Introduction
MicroRNAs (miRNAs) constitute a class of small
non-coding RNAs 19–24 nucleotides in length that function as
post-transcriptional regulators of gene expression (1). miRNAs exert important regulatory roles
in the majority of cellular and developmental processes, and have
been implicated in numerous human diseases, including cancer
(2). Since their recent
identification, the investigation of the potential for using
extracellular and circulating miRNAs as non-invasive cancer
biomarkers in body fluids, such as serum and plasma, has rapidly
expanded (3,4). Circulating miRNAs are stabilized and
protected from RNase degradation by incorporation into various
protein complexes or membranous particles, including exosomes and
microvesicles (4).
Pleural effusion is a common clinical manifestation
of the various types of non-small cell lung cancer, particularly
adenocarcinoma, and the diagnosis of pleural effusion in these
patients is of particular clinical importance. According to the
Cancer Staging system, the existence of malignant pleural effusion
(MPE) at stage IV indicates systemic disease; these patients cannot
be treated with local therapeutic methods, such as surgical
resection or radiotherapy (5).
Currently the diagnosis of MPE relies on cytological analysis of
pleural fluid; however, this method has limited sensitivity
(6) and alternative methods are
required to improve the diagnosis of pleural effusion. Recently,
several studies have reported that the cell-free miRNAs present in
pleural effusion may be useful diagnostic biomarkers for
discriminating between benign pleural effusion (BPE) and MPE
(7–9).
miRNA expression levels have been analyzed using
traditional semi-quantitative methods, including northern blotting,
bead-based flow-cytometry and microarray technology; however,
reverse transcription-quantitative polymerase chain reaction
(RT-qPCR) is the most sensitive, reproducible and widely used
approach for the evaluation of miRNAs (10). To prevent errors in datasets and to
overcome the experimental variation associated with RT-qPCR
analysis procedures, such as RNA isolation, cDNA synthesis and PCR
kinetics, the relative quantification of miRNAs through
normalization to one or more stably expressed reference gene is the
preferred approach (10). Suitable
reference genes should be expressed constitutively and the
expression levels should be unaffected by biological change,
disease or treatment. The normalization of experimental gene
RT-qPCR data to those of unreliable reference genes may result in
incorrect quantification of the miRNAs of interest; the importance
of validating suitable candidate endogenous control reference genes
has been previously demonstrated (11–15).
Although several miRNA expression profiling studies
in pleural effusion specimens have been performed (7–9,16),
validation strategies for the selection of reference genes for
normalization have, to the best of our knowledge, not been
reported. Therefore, the aim of the present study was to identify
suitable reference genes for normalizing the expression levels of
circulating miRNAs in pleural effusion identified by RT-qPCR.
Materials and methods
Patients and pleural effusion
samples
Pleural effusion samples were derived from 111
patients who visited Chungbuk National University Hospital
(Cheongju, Korea) or Kangwon National University Hospital
(Chuncheon, Korea) between February 2009 and September 2012. The
pleural effusions were diagnosed as benign, as determined by the
clinical context and the absence of malignant cells in at least two
separate samples from the same patient. All lung
adenocarcinoma-associated MPE (LA-MPE) samples were obtained from
patients with tumors that were histologically and clinically
diagnosed as primary adenocarcinoma of the lung, and that contained
adenocarcinoma cells, as confirmed by pathologists. All samples
were transported to the laboratory within 30 min of collection. The
samples were then centrifuged at 11,300 × g for 5 min, and the
supernatant and sediment fractions were aliquoted into separate
microcentrifuge tubes and stored at −80°C prior to use. All
patients provided written informed consent, and the study was
reviewed and approved by the Institutional Review Board of Chungbuk
National University Hospital.
RNA extraction
RNA was extracted from 500 μl of each sample by the
use of a Genolution urine miRNA purification kit (Genolution
Pharmaceuticals, Inc., Seoul, Korea), according to the
manufacturer’s instructions. The quantity of RNA extracted from
each sample was examined using a NanoDrop ND-1000 spectrophotometer
(Thermo Scientific, Wilmington, DE, USA).
Microarray-based miRNA analysis
Candidate reference miRNAs were selected from 10 BPE
samples and 10 LA-MPE samples using data from miRNA microarray
analyses. The BPE and LA-MPE miRNA expression profiles were
generated by hybridizing small RNAs extracted from the pleural
effusion samples to locked nucleic acid probes targeting 160 human
miRNAs. A PANArrayTM miRNA expression profiling kit
(Panagene Inc., Daejeon, Korea) was used to identify the candidate
reference miRNAs. This kit is a peptide nucleic acid (PNA)-based
microarray, which uses a novel miRNA labeling method to examine the
expression profiles of cancer- and stem cell-related miRNAs.
RT-qPCR
The expression levels of the candidate reference
miRNAs in 46 BPE samples and 45 LA-MPE samples were validated using
RT-qPCR. The expression levels of two small nuclear RNAs (snRNAs;
U6 snRNA and RNU6B) and two small nucleolar RNAs (snoRNAs; RNU44
and RNU48) were also measured. Reverse transcription of 100 ng
isolated miRNA was conducted using a high-capacity cDNA reverse
transcription kit (Applied Biosystems, Foster City, CA, USA),
according to the manufacturer’s instructions, and a specific miRNA
primer provided with a TaqMan® MicroRNA Assay kit
(Applied Biosystems). RT-qPCR was performed using the Applied
Biosystems 7,500 Fast Real-Time PCR system along with a
TaqMan® MicroRNA Assay, TaqMan® Universal PCR
Master mix and No AmpErase® UNG (Applied Biosystems).
All reactions were performed in triplicate and Cq data were
determined using the default threshold settings. The expression
levels of the candidate reference miRNAs and small RNAs included in
the final analysis were calculated using the 2−ΔΔCt
method.
Data analysis
Non-parametric tests [Mann-Whitney U test and
Kruskal-Wallis one-way analysis of variance (ANOVA) with Dunn’s
multiple comparisons correction] were used to determine any
statistically significant differences between independent groups.
Spearman’s correlation coefficients were used to calculate the
associations between the clinical variables and the expression
levels of the candidate reference genes. P<0.05 was considered
to indicate a statistically significant difference. All statistical
analyses were performed using SPSS software for Windows, version
15.0 (SPSS, Inc., Chicago, IL, USA). The NormFinder (http://moma.dk/normfinder-software) and
BestKeeper (http://www.gene-quantification.de/bestkeeper.html)
software programs were used to analyze the expression stabilities
of the reference miRNAs. NormFinder is a Microsoft Excel add-in
that uses an ANOVA-based model to calculate stability values from a
panel of candidate genes in different subgroups by combining the
intra- and inter-group expression variation (17). BestKeeper determines the geometric
mean and coefficient of variance (18). Genes with standard deviation >1
were considered to be inconstant. Inter-gene associations were
examined by pairwise correlation analysis. This calculation was
used to determine whether the genes exhibited similar expression
behavior. Candidate reference genes that exhibited high correlation
with one another were included in the BestKeeper Index calculation.
In the two programs, the lowest stability values indicate the most
stably expressed genes. To determine the expression levels of the
target miRNAs relative to suitable reference genes, the comparative
ΔCt method was used, with the relative quantities (Qrel)
calculated as follows: Qrel = 2−Δ(Cqtest
sample − Cqnormalizer). When normalized to
the sample volume, the relative expression level of a target miRNA
was calculated as follows: Qrel = 2−Δ(Cqtest
sample − Cqaverage of all samples).
Results
Selection of candidate miRNA reference
genes by microarray analysis
A total of 10 BPE samples and 10 LA-MPE samples were
analyzed using miRNA microarrays. The following criteria were used
to identify candidate reference miRNAs: miRNAs were detected in all
20 pleural effusion samples, the mean change in miRNA expression
levels was <1.1-fold, and no significant differences in miRNA
expression levels (P>0.05) between the BPE and LA-MPE samples
was detected. To avoid artifacts resulting from normalization of
the microarray data, raw microarray expression data were also used.
Of the 160 human miRNAs included in the PANArray miRNA expression
profiling kit, 59 were identified in all pleural effusion samples.
Five of these miRNAs (miR-192, miR-20a, miR-221, miR-222 and
miR-16) exhibited mean fold changes of <1.1-fold, with
expression levels that did not differ significantly between the BPE
and LA-MPE samples.
Validation of candidate reference genes
by RT-qPCR
The baseline characteristics of the patients in the
validation cohort are listed in Table
I. RT-qPCR was performed to further evaluate the expression
patterns of the five candidate reference miRNAs identified by
microarray analysis. A cohort of 91 pleural effusion samples,
including 46 BPE samples and 45 LA-MPE samples, was used for the
RT-qPCR experiments. Furthermore, the set of candidate reference
miRNAs was extended by inclusion of the U6 snRNA, RNU6B, RNU44 and
RNU48 small RNAs, which are commonly used for miRNA expression
level normalization. Details of the functions and PCR amplification
efficiencies of each of the candidate reference miRNAs and small
RNAs are listed in Table II
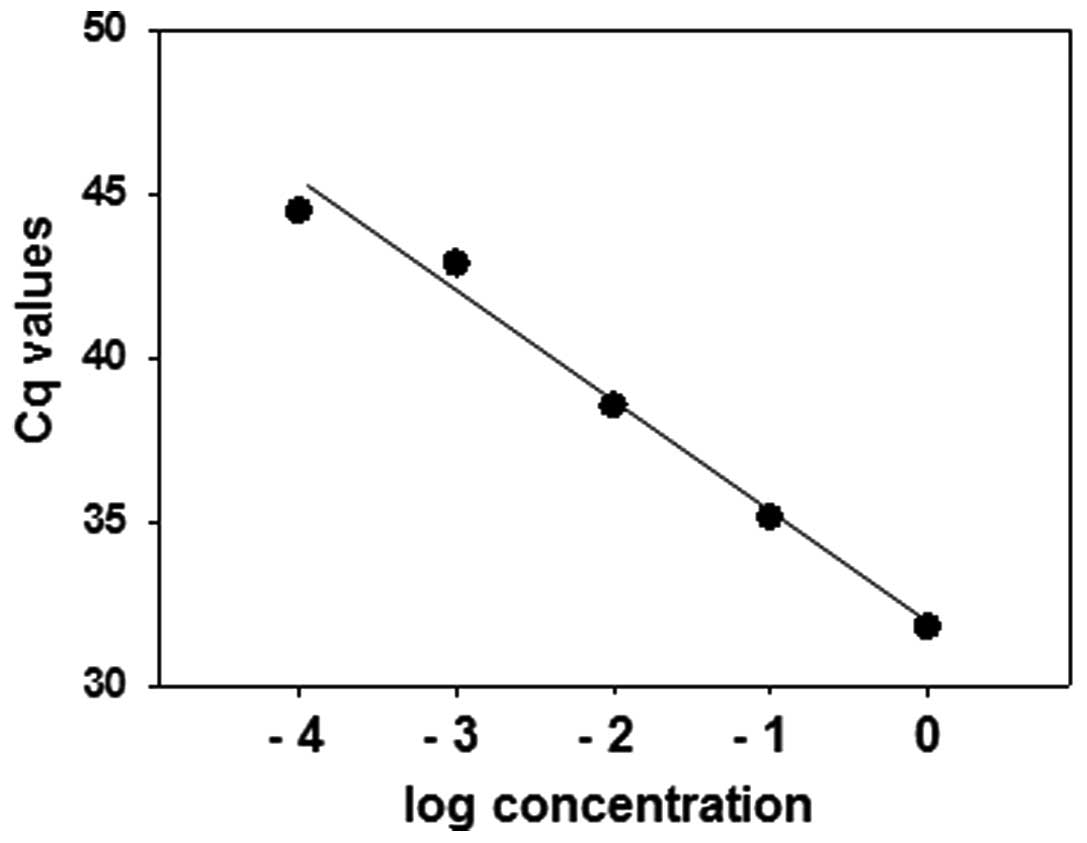
(19–25). To evaluate the range of detectable
Cq values, the miR-192 expression levels in 10-fold serial
dilutions of a pleural effusion sample were examined. A plot of Cq
values versus the log concentration revealed a linear correlation
for Cq values between 31 and 44 (Fig.
1). These results demonstrate that this method of measurement
was appropriate for the present study. RNU6B, RNU44 and RNU48 were
not detected in the majority of pleural effusion samples;
therefore, these small RNAs were excluded from further analysis.
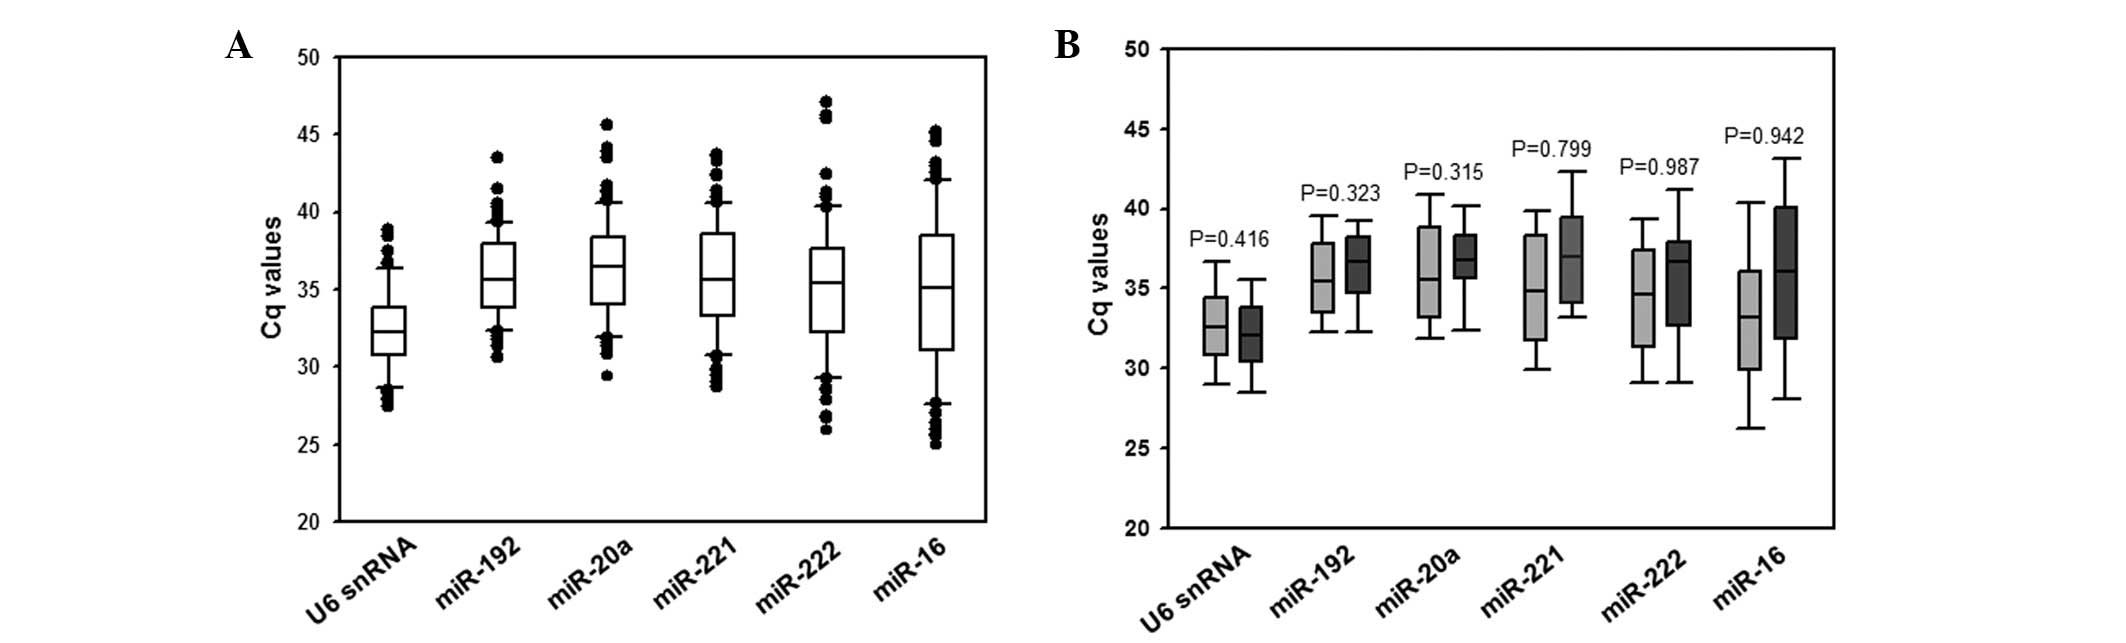
The expression levels of the remaining six candidate reference
genes, namely miR-192, miR-20a, miR-221, miR-222, miR-16 and U6
snRNA, varied widely across the samples tested, with Cq values
ranging between 25.00 and 47.03 (Fig.
2A). The expression levels of all miRNAs did not differ
significantly between BPE and LA-MPE samples (Fig. 2B). The expression levels of the five
miRNAs and U6 snRNA in BPE and LA-MPE samples did not depend on age
(Spearman’s rank correlation ranged between −0.002 and 0.128,
P-value ranged from 0.305 to 0.988), gender (Mann-Whitney U test,
P-value ranged between 0.279 and 0.808) or diagnosis
(Kruskal-Wallis test, P-value ranged between 0.066 and 0.874).
 | Table IBaseline characteristics of the
patients. |
Table I
Baseline characteristics of the
patients.
| Clinical
characteristics | BPE, n (%)
(n=46) | LA-MPE, n(%)
(n=45) |
|---|
| Age (years)a | 63 (22–92) | 68 (33–92) |
| Gender | | |
| Male | 31 (67.4) | 23 (51.1) |
| Female | 15 (32.6) | 22 (49.9) |
| Diagnosis | | |
| Tuberculosis | 22 (47.8) | - |
| Pneumonia | 19 (41.3) | - |
| Transudate | 5 (10.9) | - |
| Metastatic sites | | |
| M1a | - | 18 (40.0) |
| M1b | - | 27 (60.0) |
| Table IIDetails of candidate reference
genes. |
Table II
Details of candidate reference
genes.
| Gene | RNA species | Accession number | Function | Reference | PCR efficiency
(%) |
|---|
| miR-192 | miRNA | MI0000234 | Regulates
dihydrofolate reductase and cellular proliferation | 19 | 98.8 |
| miR-20a | miRNA | MI0000076 | Negatively regulates
autophagy | 20 | 99.5 |
| miR-221 | miRNA | MI0000298 | Regulates cell
cycle | 21 | 100.9 |
| miR-222 | miRNA | MI0000299 | Regulates cell
cycle | 21 | 101.1 |
| miR-16 | miRNA | MI0000070 | Induces apoptosis by
targeting BCL2 | 22 | 98.2 |
| U6 snRNA | snRNA | NR_003027 | Guides
post-transcriptional modification of cellular RNAs | 23 | 100.0 |
| RNU6B | snRNA | NR_002752 | Guides
post-transcriptional modification of cellular RNAs | 23 | 95.5 |
| RNU44 | snoRNA | NR_002750 | Guides site-specific
ribosomal RNA modification | 24 | Undetected |
| RNU48 | snoRNA | NR_002745 | Guides methylation of
28S ribosomal RNA | 25 | Undetected |
Stability of the candidate reference gene
expression levels
Variations in the expression stabilities of the
reference genes were further assessed using the NormFinder and
BestKeeper algorithms. The ranking of the genes by these software
programs is summarized in Table
III; lower stability values indicate higher gene stability.
NormFinder identified U6 snRNA as the most stably expressed gene,
with a stability value of 0.096. Combining the U6 snRNA and miR-192
gene data further reduced the NormFinder stability value to 0.081.
Using the BestKeeper algorithm, a similar ranking order of the
candidate reference genes was observed; miR-192 was identified as
the most stable gene (stability value of 0.160), followed by U6
snRNA (stability value of 0.177).
| Table IIIRanking and best combination of
candidate reference genes in pleural effusion samples as determined
by the expression stability values calculated using NormFinder and
BestKeeper. |
Table III
Ranking and best combination of
candidate reference genes in pleural effusion samples as determined
by the expression stability values calculated using NormFinder and
BestKeeper.
| NormFinder | BestKeeper |
|---|
|
|
|
|---|
| Rank | Gene | Stability
valuea | Gene | Stability
valuea |
|---|
| 1 | U6 snRNA | 0.096 | miR-192 | 0.160 |
| 2 | miR-192 | 0.103 | U6 snRNA | 0.177 |
| 3 | miR-20a | 0.158 | miR-20a | 0.219 |
| 4 | miR-221 | 0.185 | miR-222 | 0.222 |
| 5 | miR-222 | 0.198 | miR-221 | 0.267 |
| 6 | miR-16 | 0.251 | miR-16 | 0.374 |
| Best
combination | U6
snRNA/miR-192 | 0.081 | - | - |
Influence of reference genes on the
relative quantification of miR-198
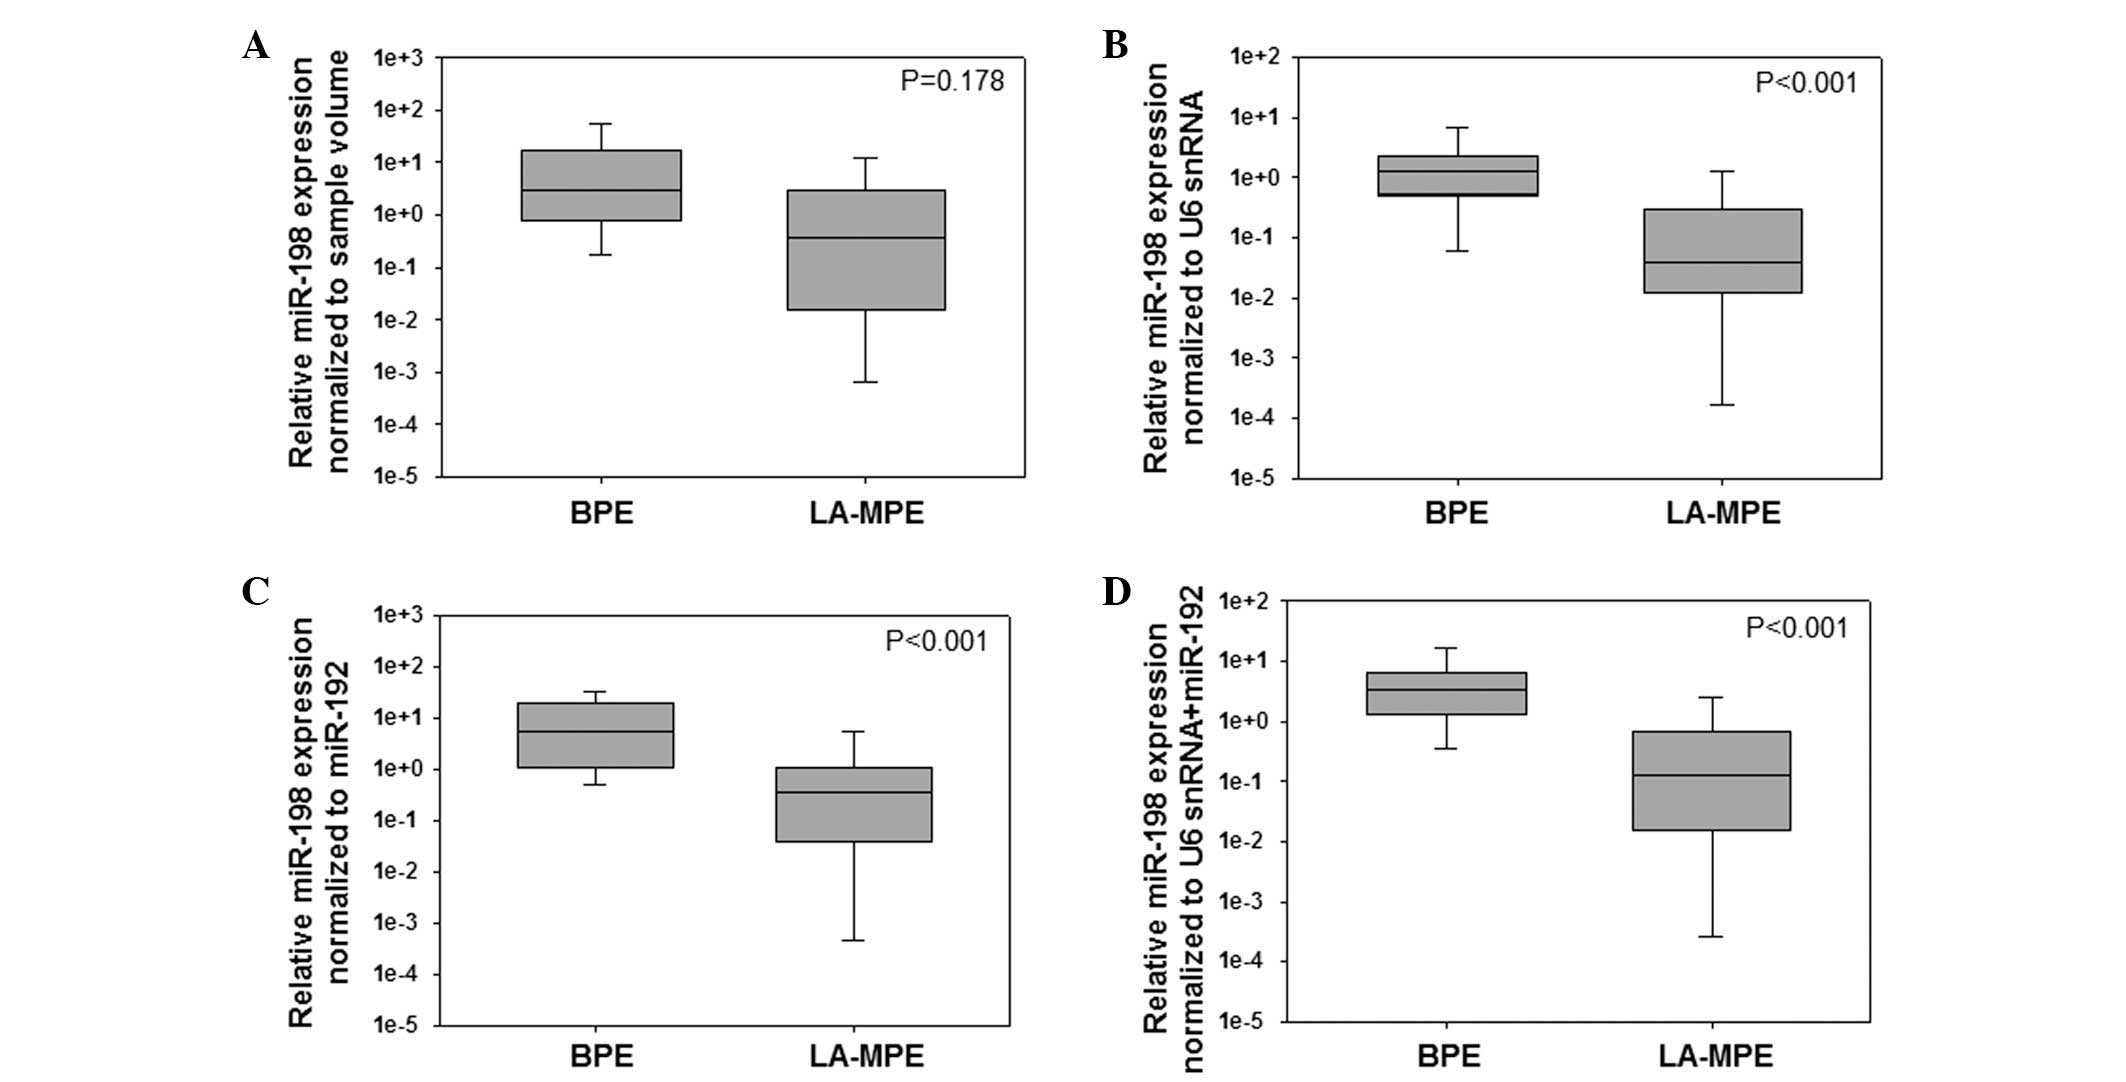
Cell-free miR-198 expression levels have been
previously demonstrated to be significantly lower in LA-MPE samples
than in BPE samples (9). Therefore,
in the present study, to assess the impact of reference gene
selection on the validity of miRNA expression data, the effect of
normalization to the following variables on the relative
quantification of miR-198 expression levels was evaluated: Sample
volume; U6 snRNA expression levels (the most stable candidate gene
ranked by NormFinder); miR-192 expression levels (the most stable
candidate gene ranked by BestKeeper); and the combination of U6
snRNA and miR-192 expression levels. For normalization of the
RT-qPCR data to the sample volume, RNA was extracted from 500 μl of
each pleural effusion sample and the Cq values were directly
converted to the relative quantification values using the formula
described above. Using this method, no significant differences in
the levels of miR-198 expression were detected between the BPE and
the LA-MPE samples (P=0.178; Fig.
3A). However, when data were normalized to the expression
levels of U6 snRNA or miR-192, the miR-198 expression levels were
significantly lower in the LA-MPE samples than in the BPE samples
(P<0.001 for U6 snRNA and miR-192; Fig. 3B and C, respectively). Significant
differences in the levels of miR-198 expression between BPE and
LA-MPE samples were also detected when the combination of U6 snRNA
and miR-192 expression levels served as a normalizer (P<0.001;
Fig. 3D).
Discussion
To the best of our knowledge, the present study is
the first systematic investigation of suitable reference genes for
the relative quantification of miRNAs in pleural effusion. In the
present study, four strategies were used to identify suitable
reference genes. miRNA microarray analyses of BPE and MPE samples
were performed to identify the invariant miRNAs that are stably
expressed. These candidate reference miRNAs, as well as the U6
snRNA, RNU6B, RNU44 and RNU48 small RNAs, which are the most
frequently used reference genes in miRNA expression studies
(10,11,26),
were validated by RT-qPCR. The statistical algorithms NormFinder
and BestKeeper were used to identify the most useful endogenous
reference genes for relative quantification. The impact of
different normalization approaches on the ability to detect reduced
miR-198 expression levels in LA-MPE samples was also examined. The
results emphasize the importance of an appropriate normalization
approach to identify U6 snRNA and miR-192 as suitable reference
genes for miRNA analyses in pleural effusion samples.
The selection of appropriate reference genes as
normalizers for the relative quantification of miRNA expression
levels is required to avoid erroneous results and to improve the
comparability of miRNA expression level data amongst studies
(10). The conventional approach to
miRNA RT-qPCR data analysis is to normalize the values to the
expression levels of snRNAs, such as U6 snRNA or RNU6B, or snoRNAs,
such as RNU44 or RNU48. Alternatively, synthetic miRNAs, including
ath-miR 156a or ath-miR 159a, are commonly added to the samples and
used as normalizers. However, these miRNAs may exhibit variable
expression levels depending on the samples used and may introduce
noise when used as internal controls (11–15).
Due to differences in length, the physicochemical properties,
isolation efficiencies and degradation rates of small RNAs differ
from those of miRNAs (26). In the
present study, RNU6B was not detected in the majority of pleural
effusion samples; the poor quality of RNU6B as a reference gene has
previously been reported in miRNA expression studies of several
other types of malignancy (11–14).
Unlike miRNAs, RNU6B is a high molecular weight RNA that lacks
resistance to degradation by RNase in body fluids (27); these properties may account for the
low abundance of RNU6B in the pleural effusion samples included in
the present study. Recent studies have also reported that snoRNAs
exhibit highly variable levels of expression, and the use of these
species as reference genes may introduce noise and result in
inaccuracies in the data (15,28).
Furthermore, the expression levels of snoRNAs have been associated
with cancer prognosis in multiple studies (15,29,30).
This evidence demonstrates that these molecules do not meet the
requirement that reference genes be unaffected by biological
changes, disease or treatments.
Non-human synthetic miRNA also frequently serves as
a spike-in control to normalize for technical variability (31). In two recent studies that attempted
to identify potential diagnostic or prognostic miRNA biomarkers in
pleural effusion, the relative miRNA expression levels were
directly normalized using ath-miR156a as a spiked-in reference gene
(8,16). However, spike-in controls may not
correct for the variability arising from differences in template
quality and/or the efficiency of the reverse transcription
reaction. Therefore, candidate reference genes must be validated
for each individual study design, as even frequently used reference
genes are unstable under certain conditions. Thus, the
identification of a reference gene that is most suited to the
specific samples and experimental conditions of the study is
recommended.
In the current study, the candidate reference genes
identified by the microarray and subsequent RT-qPCR experiments
were analyzed using the NormFinder and BestKeeper algorithms.
NormFinder calculated the intra- and inter-group variations and
identified U6 snRNA as the single most stable reference gene with a
stability value of 0.096. The use of more than one reference gene
is generally considered to increase the accuracy of miRNA
quantification, and the combination of U6 snRNA and miR-192
expression exhibited an improved NormFinder stability value of
0.081. NormFinder and BestKeeper did not produce the same reference
gene ranking order for normalization; this difference may be
attributable to the different calculation models used in the tools.
However, NormFinder and BestKeeper ranked U6 snRNA and miR-192 as
the top two reference genes.
The impact of different normalization strategies on
the accuracy of RT-qPCR results was examined by analyzing the
expression levels of cell-free miR-198 in pleural effusions. In a
previous study, the levels of miR-198 expression were found to be
significantly lower in LA-MPE samples than in BPE samples,
indicating that this miRNA may have diagnostic potential for
differentiating BPE and MPE (9). In
the present study, the relative quantification of miR-198 was
assessed using different normalization strategies. When the miR-198
data were normalized to the sample volume, no significant
differences between BPE and LA-MPE samples were detected. However,
when the data were normalized to U6 snRNA expression levels,
miR-192 expression levels, and a combination of U6 snRNA and
miR-192 expression levels, significant differences between BPE and
LA-MPE samples were detected. These results indicate that
normalization of miRNA expression level data to those of
systematically selected reference genes detects smaller differences
than those identified by normalization of the data to the sample
volume.
The present study has certain limitations. A
relatively small number of well-known miRNAs (160 of the >1,000
currently available) were screened using the PNA-based microarray.
Furthermore, the number of candidate reference genes examined was
small; the use of multiple reference genes is critical to achieve
more reliable expression data (32). Another limitation of the study was
that the identification of U6 snRNA and miR-192 as reference genes
was only confirmed by normalization of the expression levels of a
single miRNA (miR-198) in the pleural effusion samples. If further
studies investigating miRNAs as potential diagnostic, prognostic
and predictive biomarkers in pleural effusion are to be undertaken,
the use of U6 snRNA and miR-192 as reference genes must be further
validated. Another issue is that all MPE samples used in the
present study were obtained from lung adenocarcinoma specimens;
whether U6 snRNA and miR-192 may be used as reference genes for
other types of MPE remains to be determined.
In conclusion, the use of the expression levels of
U6 snRNA, miR-192 or a combination of these genes for the relative
quantification of miRNA expression levels in pleural effusion is
recommended, as determined by the results from the present
study.
Acknowledgements
This study was supported by a Basic Science Research
Program through the National Research Foundation of Korea, funded
by the Ministry of Education, Science and Technology (grant no.
2007-0054930). All effusion samples examined in this study were
provided by Chungbuk National University Hospital and Kangwon
National University Hospital, members of the National Biobank of
Korea, which is supported by the Ministry of Health, Welfare and
Family Affairs. All samples derived from the National Biobank of
Korea were obtained with informed consent under procedures approved
by the institutional review board. The authors appreciate the
assistance of the cancer research team at the Bioevaluation Center
(Korea Research Institute of Bioscience and Biotechnology,
Cheongju, Republic of Korea).
References
|
1
|
Bartel DP: MicroRNAs: genomics,
biogenesis, mechanism, and function. Cell. 116:281–297. 2004.
|
|
2
|
Cho WC: MicroRNAs: potential biomarkers
for cancer diagnosis, prognosis and targets for therapy. Int J
Biochem Cell Biol. 42:1273–1281. 2010.
|
|
3
|
Zhou L, Zhao YP, Liu WJ, et al:
Circulating microRNAs in cancer: diagnostic and prognostic
significance. Expert Rev Anticancer Ther. 12:283–288. 2012.
|
|
4
|
Cortez MA, Bueso-Ramos C, Ferdin J, et al:
MicroRNAs in body fluids - the mix of hormones and biomarkers. Nat
Rev Clin Oncol. 8:467–477. 2011.
|
|
5
|
Tsim S, O’Dowd CA, Milroy R and Davidson
S: Staging of non-small cell lung cancer (NSCLC): a review. Respir
Med. 104:1767–1774. 2010.
|
|
6
|
Nance KV, Shermer RW and Askin FB:
Diagnostic efficacy of pleural biopsy as compared with that of
pleural fluid examination. Mod Pathol. 4:320–324. 1991.
|
|
7
|
Xie L, Chen X, Wang L, et al: Cell-free
miRNAs may indicate diagnosis and docetaxel sensitivity of tumor
cells in malignant effusions. BMC Cancer. 10:5912010.
|
|
8
|
Xie L, Wang T, Yu S, et al: Cell-free
miR-24 and miR-30d, potential diagnostic biomarkers in malignant
effusions. Clin Biochem. 44:216–220. 2011.
|
|
9
|
Han HS, Yun J, Lim SN, et al:
Downregulation of cell-free miR-198 as a diagnostic biomarker for
lung adenocarcinoma-associated malignant pleural effusion. Int J
Cancer. 133:645–652. 2013.
|
|
10
|
Mestdagh P, Van Vlierberghe P, De Weer A,
et al: A novel and universal method for microRNA RT-qPCR data
normalization. Genome Biol. 10:R642009.
|
|
11
|
Ratert N, Meyer HA, Jung M, et al:
Reference miRNAs for miRNAome analysis of urothelial carcinomas.
PLoS One. 7:e393092012.
|
|
12
|
Song J, Bai Z, Han W, et al:
Identification of suitable reference genes for qPCR analysis of
serum microRNA in gastric cancer patients. Dig Dis Sci. 57:897–904.
2012.
|
|
13
|
Wotschofsky Z, Meyer HA, Jung M, et al:
Reference genes for the relative quantification of microRNAs in
renal cell carcinomas and their metastases. Anal Biochem.
417:233–241. 2011.
|
|
14
|
Chang KH, Mestdagh P, Vandesompele J,
Kerin MJ and Miller N: MicroRNA expression profiling to identify
and validate reference genes for relative quantification in
colorectal cancer. BMC Cancer. 10:1732010.
|
|
15
|
Gee HE, Buffa FM, Camps C, et al: The
small-nucleolar RNAs commonly used for microRNA normalisation
correlate with tumour pathology and prognosis. Br J Cancer.
104:1168–1177. 2011.
|
|
16
|
Wang T, Lv M, Shen S, et al: Cell-free
microRNA expression profiles in malignant effusion associated with
patient survival in non-small cell lung cancer. PLoS One.
7:e432682012.
|
|
17
|
Andersen CL, Jensen JL and Ørntoft TF:
Normalization of real-time quantitative reverse transcription-PCR
data: a model-based variance estimation approach to identify genes
suited for normalization, applied to bladder and colon cancer data
sets. Cancer Res. 64:5245–5250. 2004.
|
|
18
|
Pfaffl MW, Tichopad A, Prgomet C and
Neuvians TP: Determination of stable housekeeping genes,
differentially regulated target genes and sample integrity:
BestKeeper - Excel-based tool using pair-wise correlations.
Biotechnol Lett. 26:509–515. 2004.
|
|
19
|
Song B, Wang Y, Kudo K, et al: miR-192
Regulates Dihydrofolate Reductase and Cellular Proliferation
through the p53-microRNA Circuit. Clin Cancer Res. 14:8080–8086.
2008.
|
|
20
|
Wu H, Wang F, Hu S, et al: MiR-20a and
miR-106b negatively regulate autophagy induced by leucine
deprivation via suppression of ULK1 expression in C2C12 myoblasts.
Cell Signal. 24:2179–2186. 2012.
|
|
21
|
Visone R, Russo L, Pallante P, et al:
MicroRNAs (miR)-221 and miR-222, both overexpressed in human
thyroid papillary carcinomas, regulate p27Kip1 protein levels and
cell cycle. Endocr Relat Cancer. 14:791–798. 2007.
|
|
22
|
Cimmino A, Calin GA, Fabbri M, et al:
miR-15 and miR-16 induce apoptosis by targeting BCL2. Proc Natl
Acad Sci USA. 102:13944–13949. 2005.
|
|
23
|
Kiss T: Small nucleolar RNA-guided
post-transcriptional modification of cellular RNAs. EMBO J.
20:3617–3622. 2001.
|
|
24
|
Dieci G, Preti M and Montanini B:
Eukaryotic snoRNAs: a paradigm for gene expression flexibility.
Genomics. 94:83–88. 2009.
|
|
25
|
Galardi S, Fatica A, Bachi A, et al:
Purified box C/D snoRNPs are able to reproduce site-specific
2′-O-methylation of target RNA in vitro. Mol Cell Biol.
22:6663–6668. 2002.
|
|
26
|
Peltier HJ and Latham GJ: Normalization of
microRNA expression levels in quantitative RT-PCR assays:
identification of suitable reference RNA targets in normal and
cancerous human solid tissues. RNA. 14:844–852. 2008.
|
|
27
|
Chen X, Ba Y, Ma L, et al:
Characterization of microRNAs in serum: a novel class of biomarkers
for diagnosis of cancer and other diseases. Cell Res. 18:997–1006.
2008.
|
|
28
|
Git A, Dvinge H, Salmon-Divon M, et al:
Systematic comparison of microarray profiling, real-time PCR, and
next-generation sequencing technologies for measuring differential
microRNA expression. RNA. 16:991–1006. 2010.
|
|
29
|
Dong XY, Guo P, Boyd J, et al: Implication
of snoRNA U50 in human breast cancer. J Genet Genomics. 36:447–454.
2009.
|
|
30
|
Mourtada-Maarabouni M, Pickard MR, Hedge
VL, Farzaneh F and Williams GT: GAS5, a non-protein-coding RNA,
controls apoptosis and is downregulated in breast cancer. Oncogene.
28:195–208. 2009.
|
|
31
|
Kroh EM, Parkin RK, Mitchell PS and Tewari
M: Analysis of circulating microRNA biomarkers in plasma and serum
using quantitative reverse transcription-PCR (qRT-PCR). Methods.
50:298–301. 2010.
|
|
32
|
Tricarico C, Pinzani P, Bianchi S, et al:
Quantitative real-time reverse transcription polymerase chain
reaction: normalization to rRNA or single housekeeping genes is
inappropriate for human tissue biopsies. Anal Biochem. 309:293–300.
2002.
|