Introduction
As an aggressive cancer, hepatocellular carcinoma
(HCC) is the third leading cause of cancer-related mortality and
the fifth most common solid malignant tumor (1). Early-stage HCC can be treated by
surgical resection, while late-stage HCC patients are often treated
by sorafenib or combination chemotherapy (2). Viral infection is the major cause of
HCC; in Asia, hepatitis B virus (HBV) is the predominant cause,
while in the Western world, hepatitis C virus (HCV) is the major
cause (3).
Recently, a single nucleotide polymorphism (SNP) on
GALNT14 has been repetitively shown to correlate with the
therapeutic responses of combination chemotherapy in independent
cohorts of patients with far-advanced HCC, and the TT genotype of
the SNP, rs9679162, was correlated with a good post-chemotherapy
prognosis (2,4). The genotyping technique in these
studies followed the traditional concept, using peripheral blood
cells to provide chromosomal DNA and polymerase chain reaction
followed by direct sequencing to determine genotypes. To facilitate
future studies regarding the association between this genotype and
other clinical parameters, a more convenient assay was necessary.
The assay required the capability to process one or a few samples
(in cases where a few patients were to be assessed per day, for
clinical purposes) at low costs, while providing accurate results
promptly. The assay required the capability to use tissue-derived
chromosomal DNA for genotyping for retrospective studies.
Additionally, it should be able to be conducted in medical
facilities lacking sequencing machines, as HCC is prevalent in a
number of third world countries (5).
The identification of restriction enzymes capable of
recognizing and cleaving DNA at specific sites has been a
cornerstone of modern biotechnology (6). Genomic DNA digested by restriction
enzymes becomes DNA fragments of varied lengths, creating a
personalized signature called restriction fragment length
polymorphisms (RFLPs). Prior to the widespread use of
high-throughput sequencing and genotyping methods, RFLP was one of
the major assays for pinpointing genomic regions responsible for
various phenotypic traits (7). This
technology has led toward the discovery of the CFTR gene,
the first disease-bearing gene ever identified by positional
cloning (8,9). The method has also been used in
various clinical assays, including the diagnosis of sickle cell
anemia (10).
A variety of SNP assays, including the TaqMan and
fluorescence polarization assays, have also been developed
(11). One shared characteristic of
these assays is the requirement of batches of samples for providing
large enough numbers of signals for each of the three genotypes.
The signals are then used to delineate the genotype-specific
intensity distribution ‘on-the-fly’, in other words, an
unsupervised base-calling technique. Such a platform was found to
be suitable in the validation stage for handling a large number of
pre-collected samples, however, it was not found to be practical
for clinical use considering the daily fluctuations of patient
numbers (12). To prepare for
future clinical use, a practical, low-cost assay that could be used
in a small hospital of a remote village, as well as in large urban
medical centers, was developed in the present study. The assay was
performed on surgically resected liver tissues, and the derived
GALNT14 genotypes were correlated with the clinical data of
the HCC patients. Finally, the geographical distributions of the
genotypes were examined.
Materials and methods
Patients and clinical data
This study was conducted under the approval of the
Institutional Review Board of Chang Gung Memorial Hospital, Taiwan.
All study subjects were adults and provided written informed
consent. A total of 244 patients with HCC treated by surgical
resection were included, and their surgical specimens were
retrieved from the Tissue Bank of Chang Gung Medical Center.
Samples were obtained from the non-tumorous sections of the
surgical specimens. All samples were frozen at −70°C immediately
after surgical resection, until use. HBV was diagnosed if the HBV
surface antigen was detected in the patient’s peripheral blood. HCV
was diagnosed if anti-HCV antibody was detected.
Design of the polymerase chain reaction
(PCR)-generated double restriction enzyme sites-RFLP assay
The basic concept behind the proposed assay was to
incorporate the target bi-allelic SNP as part of an
artificially-introduced restriction enzyme cutting site. Together
with adjacent nucleotide bases, one allele of the SNP could
constitute a restriction enzyme recognizable sequence, while the
other allele could not. As a consequence, samples with distinct SNP
alleles manifested as distinct length polymorphisms following
restriction enzyme digestion.
The genetic engineering method was employed to
introduce sequence signatures artificially. The assay was based on
nested PCR. A first-step PCR was designed to amplify the DNA
fragment containing the target SNPs without any naturally occurring
restriction enzyme cutting sites. The second-step PCR employed a
set of specially designed primers targeted to the first amplicons
to introduce desired sequence signatures, which were recognizable
by restriction enzymes for allele-specific cuttings.
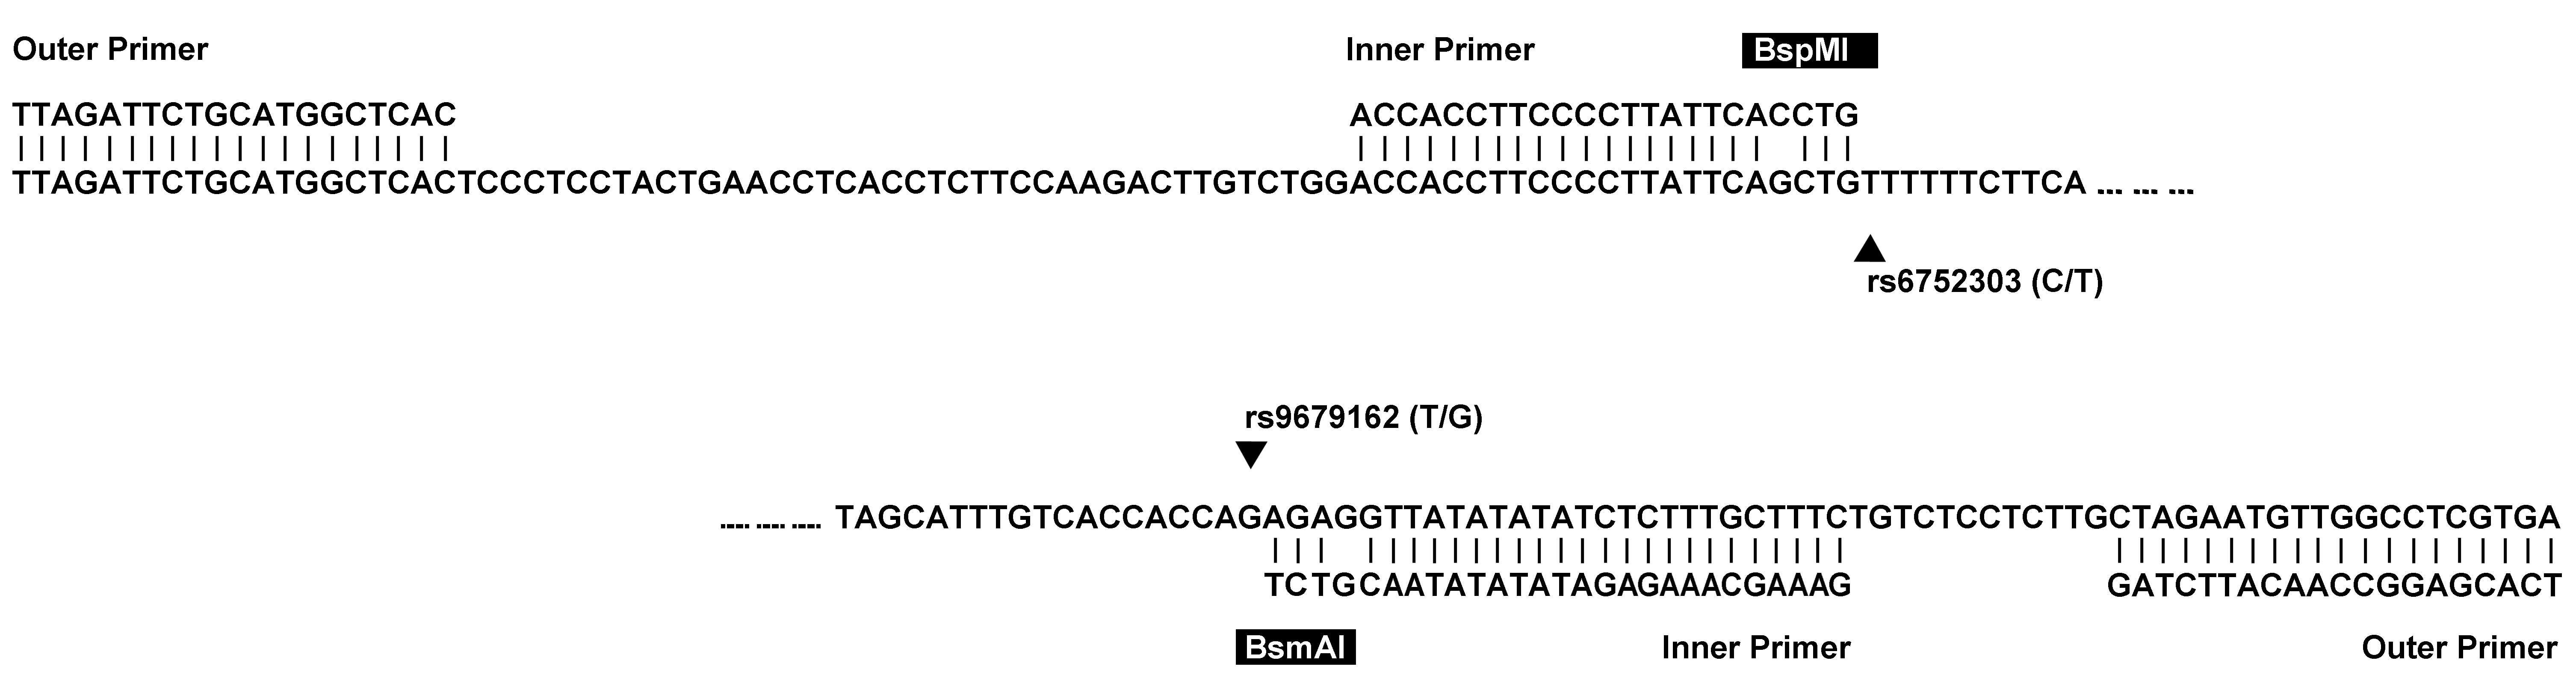
Accordingly, an assay was designed to simultaneously
genotype two adjacent and tightly linked SNPs in the GALNT14
gene; each was shown to correlate with the chemotherapy responses
of patients with far-advanced HCC (4). GALNT14 resides on chromosome 2,
and the two SNPs, rs9679162 and rs6752303, are in the intronic
region of the gene. A set of outer primers was designed to amplify
a 172-base amplicon containing the two SNPs (Table I). No endogenous restriction sites
were found in the amplicon. The inner primers were then used to
introduce two cutting sites of BsmAI and BspMI (GTCTC
and ACCTGC respectively), which were formed partly by the primer
and partly by rs9679162 and rs6752303 (Fig. 1). The second amplicon had a length
of 80 bases. The allele types at the site of the SNP were essential
in determining whether the cutting could proceed, resulting in
fragments (~55 bases). The cut and uncut fragments manifested as
lower and upper bands in the gel image of electrophoresis
respectively. A look-up table (Table
II) described how genotypes can be defined by the band
patterns.
 | Table IPrimer sequences for the restriction
fragment length polymorphism genotyping assays. |
Table I
Primer sequences for the restriction
fragment length polymorphism genotyping assays.
| Primer sequence | Tm,°C |
|---|
| Outer primer |
|
TCACGAGGCCAACATTCTAG | 58.9 |
|
TTAGATTCTGCATGGCTCAC | 56.4 |
| Inner primer |
|
GAAAGCAAAGAGATATATATAACGTCT | 59.2 |
|
ACCACCTTCCCCTTATTCACCTG | 66.2 |
| Table IIA look-up table for interpreting the
band patterns of the proposed assay. |
Table II
A look-up table for interpreting the
band patterns of the proposed assay.
| A, rs9679162 |
|---|
|
|---|
| | Genotypea |
|---|
| |
|
|---|
| RE | Band | TT (AA) | TG (AC) | GG (CC) |
|---|
| BsmAI cut | Upper | + | + | − |
| Lower | − | + | + |
|
| B, rs6752303 |
|
| | Genotypea |
| |
|
| RE | Band | CC (GG) | CT (GA) | TT (AA) |
|
| BspMI cut | Upper | − | + | + |
| Lower | + | + | − |
Genomic DNA preparation and the first PCR
amplification
Genomic DNA was extracted from clinical samples
using QIAamp® DNA Mini and Blood Mini kits (Qiagen,
Düsseldorf, Germany). DNA amplification was performed in PCR
reaction mixture consisting of genomic DNA (5 μl), Taq DNA
polymerase 2.0 Master Mix Red (MgCl2, 1.5 mM; 25 μl;
Ampliqon, Glostrup, Denmark), the first set of primers (10 μM, 0.25
μl each; Table I) and water (19.5
μl). PCR was carried out for 35 cycles under the following
conditions: Initial denaturation at 94°C for 5 min, denaturation at
94°C for 1 min, annealing at 55°C for 1 min and extension at 72°C
for 1 min, followed by a final extension step at 72°C for 10
min.
Second PCR amplification
The reaction mixture of the second PCR amplification
comprised the first PCR amplicon (i.e., the product of the previous
step; 0.1 μl), Taq DNA polymerase 2.0 Master Mix Red
(MgCl2, 1.5 mM; 25 μl), the second set of primers (10
μM, 0.25 μl each; Table I), and
water (24.5 μl). PCR was performed for 20 cycles under the
following conditions: Initial denaturation at 94°C for 5 min,
denaturation at 94°C for 1 min, annealing at 55°C for 1 min and
extension at 72°C for 1 min, followed by a final extension step at
72°C for 10 min.
Restriction enzyme digestion and gel
electrophoresis
The samples were then digested by restriction
enzymes. The reaction mixture comprised the second amplicon (3 μl),
10X buffer (2 μl), restriction enzymes BsmAI or BspMI
(1 μl) (New England Biolab, Ipswich, MA, USA) and water (14 μl).
Incubation temperatures were 55°C for BsmAI and 37°C for
BspMI. The incubation time was 2 h. The lengths of the DNA
fragments were analyzed by a subsequent electrophoresis. This was
performed by loading the BsmAI- or BspMI-treated
samples (15 μl) into wells of 2.5% superfine resolution™ agarose
gel (Amresco, Solon, OH, USA), using 50 V for 60 min. Genotypes
were then defined based on the gel image.
Evaluation of assay accuracy
Sanger sequencing was performed to the first
amplicon. The sequencing-derived genotypes were compared with those
obtained by the proposed assay.
Statistical and data analysis
The genotypes were correlated with the clinical data
of the subjects. χ2 tests were used to compare the
categorical variables, including the genotype, gender and presence
of cirrhosis, with respect to the TT and non-TT genotypes.
Comparisons of numerical variables were performed by two sample
t-tests assuming unequal variance. All P-values reported here are
two-tailed. SPSS 12.0 software (SPSS, Inc., Chicago, IL, USA) was
used for the aforementioned analysis. The public domain HapMap
genotype counts were obtained from the official website (http://hapmap.ncbi.nlm.nih.gov/) on Oct 11, 2013,
in order to facilitate the analysis (13). The Wellcome Trust Case-Control
Consortium (WTCCC) data were downloaded from the European
Genome-phenome Archive (EGA) at https://www.ebi.ac.uk/ega/ with permission from the
WTCCC (14).
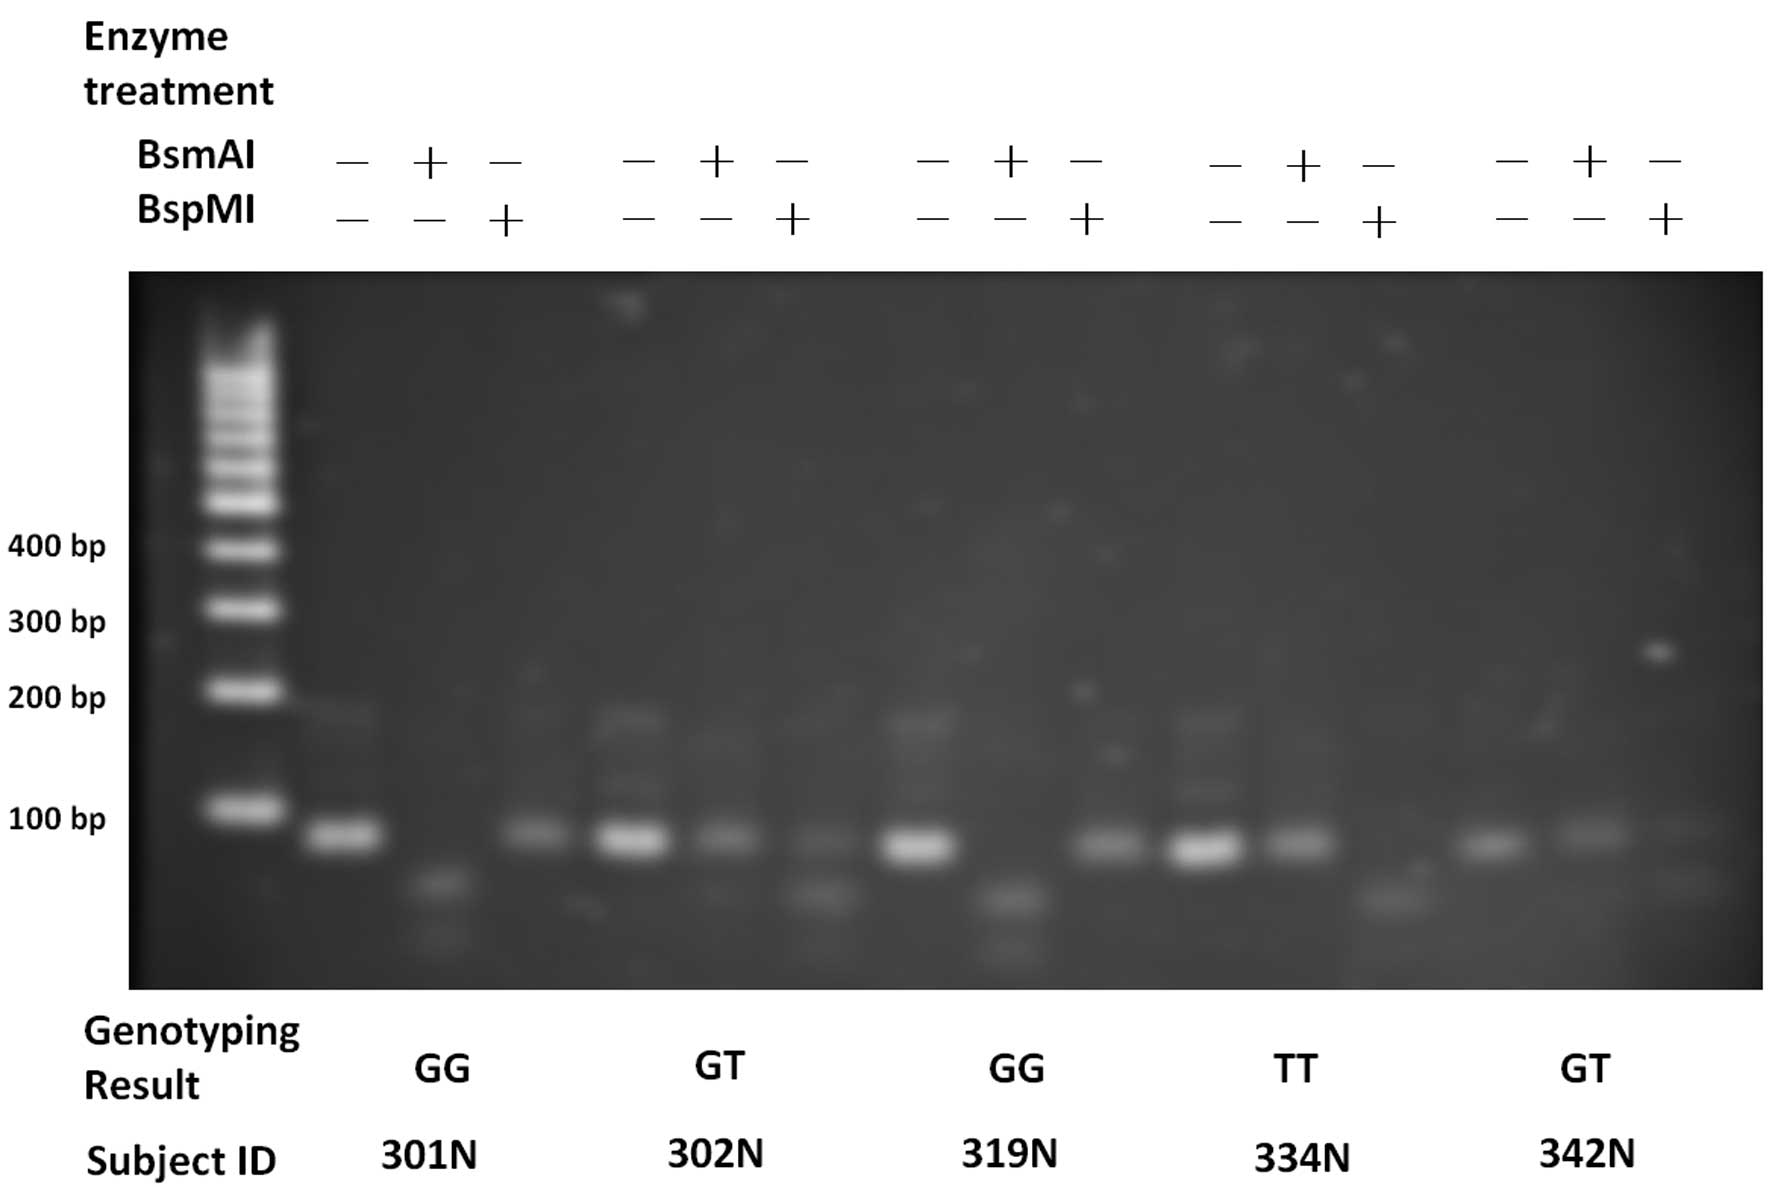
Results
The genotypes of rs9679162 and rs6752303 obtained
from the proposed assay and the conventional Sanger sequencing were
identical, reaching a concordance rate of 100% in the 244 subjects.
Fig. 2 shows examples of the gel
images of five subjects. Homozygous and heterozygous genotypes were
manifested as different band patterns. The genotypes of the two
adjacent SNPs were highly associated (linkage disequilibrium,
r2=0.984).
The HCC subjects were of either viral (HBV and/or
HCV) or non-viral etiologies (Table
III). By comparing the clinical data, it was found that the TT
type was under-represented in the viral subgroup in comparison with
the non-viral subgroup (P=0.0231). A subsequent stratification of
the viral groups showed that the HBV and HCV subgroups had a higher
percentage of the non-TT genotype compared with the non-viral HCC
subgroup (P=0.0268 and P=0.0331, respectively). No other
associations between genotypes and clinical parameters were
observed (Table III). The
viral/non-viral etiology did not correlate with a history of
alcoholism (P=0.750). No significant deviations from the
Hardy-Weinberg equilibrium were found in either the viral or
non-viral HCC subgroups (Table
IV).
| Table IIIClinical parameters of early-stage HCC
patients. |
Table III
Clinical parameters of early-stage HCC
patients.
| Parameter | rs9679162 TT | rs9679162 non-TT | P-value |
|---|
| Patient number | 59 | 185 | |
| Age, years | 54.54±15.04 | 53.94±14.37 | 0.786 |
| Male gender | 48 (81.36) | 147 (79.46) | 0.853 |
| Etiology |
| HBV | 47 (79.66) | 158 (85.41) | 0.253 |
| HCV | 9 (15.25) | 36 (19.46) | 0.458 |
| HBV-HCV
co-infection | 5 (8.47) | 19 (10.27) | 0.678 |
| Non-viral | 8 (13.56) | 9 (4.86) | 0.023 |
| Alcoholism
history | 25 (42.37) | 57 (30.81) | 0.331 |
| Cirrhosis | 35 (59.32) | 99 (53.51) | 0.548 |
| Ascities | 5 (8.47) | 16 (8.65) | 0.955 |
| Biochemical
analysis |
| AFP, n/mL | 1876.54±6735.52 |
10104.53±49077.56 | 0.054 |
| Albumin, g/dL | 3.93±0.65 | 3.92±0.65 | 0.935 |
| Bilirubin,
mg/dL | 1.68±2.94 | 1.20±1.16 | 0.224 |
| Creatinine,
mg/dL | 1.18±0.66 | 1.25±1.41 | 0.583 |
| AST, U/l | 82.09±77.79 | 80.63±115.76 | 0.914 |
| ALT, U/l | 76.60±79.00 | 79.95±108.51 | 0.804 |
| Prothrombin time,
sec | 12.24±1.34 | 12.95±8.08 | 0.259 |
| Table IVProportions of rs9679162 genotype in
various subgroups. |
Table IV
Proportions of rs9679162 genotype in
various subgroups.
| Subgroups | TT, % | Non-TT, % | Subgroup subject
number | Current study vs.
public data | HWE P-value |
|---|
| HCC |
| Viral | 22.57 | 77.43 | 226 | | 0.5659 |
| Non-viral | 47.06 | 52.94 | 17 | | 0.6446 |
| Total | 24.18 | 75.82 | 244 | | 0.7790 |
| HapMap |
| Luhya in Webuye,
Kenya | 54.55 | 45.45 | 110 | <0.0001 | 0.0471 |
| Yoruba in Ibadan,
Nigeria | 48.30 | 51.70 | 147 | <0.0001 | 0.8995 |
| Japanese in Tokyo,
Japan | 46.02 | 53.98 | 113 | <0.0001 | 0.9959 |
| African ancestry
in Southwest USA | 42.11 | 57.89 | 57 | <0.0001 | 0.9999 |
| Mexican ancestry
in Los Angeles, California | 36.21 | 63.79 | 58 | 0.0647 | 0.6739 |
| Han Chinese in
Beijing, China | 30.15 | 69.85 | 136 | 0.2138 | 0.7203 |
| Chinese in
Metropolitan Denver, Colorado | 28.44 | 71.56 | 109 | 0.4081 | 0.9005 |
| Maasai in Kinyawa,
Kenya | 25.00 | 75.00 | 156 | 0.8705 | 0.9873 |
| Gujarati Indians
in Houston, Texas | 16.83 | 83.17 | 101 | 0.1294 | 0.7804 |
| Utah residents
with Northern and Western European ancestry from the Centre d’Etude
du Polymorphisme Humain collection | 12.39 | 87.61 | 113 | 0.0097 | 0.4639 |
| Toscani in
Italia | 7.84 | 92.16 | 102 | 0.0004 | 0.0927 |
| WTCCC |
| British 1958 birth
cohort | 15.76 | 84.24 | 1504 | 0.0010 | 0.3033 |
| UK national blood
service | 17.01 | 82.99 | 1499 | 0.0063 | 0.9470 |
Geographical distributions of the genotypes were
conducted by comparison between the present data and the HapMap
data in the public domain (Table
IV). The proportion of the TT genotype in the patients with HCC
in the present study (24.18%) did not deviate significantly from
those of two Chinese cohorts from Denver, Colorado, USA (28.44%)
and Beijing, China (30.15%) (P>0.05 for each). The proportion of
the TT genotype was significantly higher in Japanese populations
from Tokyo (46.02%) and in three African populations (Kenya,
54.55%; Nigeria, 48.30%; and African ancestry in USA, 42.11%) (all
P<0.0001). Notably, the proportions were significantly lower in
cohorts of European descendants, including the Toscani, Italian
cohort (7.84%; P=0.0004), Utah residents with Northern and Western
European ancestry (12.39%; P=0.0097), the British 1958 birth cohort
(15.76%; P=0.0010) and the UK National blood service cohort
(17.01%; P=0.0063).
Discussion
Reliable genetic biomarkers for patients with HCC
could offer critical information for personal preventive and
therapeutic strategies, and GALNT14-rs9679162 has been shown to
have such a potential (2,4). The GALNT family of
glycosyltransferases has long been indicated to be involved in the
onset and progression of various cancers, including HCC, although
the molecular mechanisms remain largely elusive (15–19).
GALNT14 has been shown to be involved in the glycosylation
of multiple cellular substrates, including death receptors, DR4 and
DR5 (20). The mRNA level has been
shown to positively correlate with cancer cell sensitivity to DR4
and DR5 agonists (20,21). It has also been found that GALNT14
proteins are more abundant in breast carcinoma compared with normal
tissues, but that the expression levels decrease in more advanced
stages of cancer (22).
In the present study, a comparison of genotype
distributions of various HCC etiologies revealed that the TT
genotype, previously reported to indicate a good post-chemotherapy
prognosis, was present in a smaller proportion in the viral HCC
subgroup (22.57%) compared with the non-viral HCC subgroup (47.06%,
P=0.0231). The reduced percentage of the TT genotype in the viral
HCC subgroup suggested that it may impart a lower risk of HCC among
chronic HBV and HCV patients. As the TT genotype was associated
with a good chemotherapy response, we hypothesized that HCC cells
possessing this genotype were more susceptible to chemotherapy
agents owing to the link between the GALNT14 and apoptosis pathways
(20). As such, the hepatocytes of
TT genotype could be more vulnerable under HBV or HCV infection and
thus, less easily progress to liver cancer. Such a protective role
appeared to apply to HBV and HCV, as the two subgroups had reduced
TT percentages.
Comparing the current study to the public-domain
HapMap data, it was found that the Japanese population had a higher
percentage of the TT genotype (Table
IV). Notably, Japanese patients with advanced HCC have been
reported to have high response rates to interferon and
5-fluorouracil combination therapy (23). We hypothesize that the high
proportion of the TT genotype in Japanese patients may underlie the
high response rates in this country.
In summary, the current study presented a novel
genotyping method through the use of PCR-generated double
restriction enzyme sites. This method could correctly genotype two
linked SNPs in GALNT14. Additionally, the TT percentage of
rs9679162 was lower in the viral subgroups of HCC.
Acknowledgements
The authors would like to thank Ms. Hui-Chin Chen
and Ms. Chung-Yin Wu in the Liver Research Center, Chang Gung
Memorial Hospital, for organizing the clinical data, and the
HapMap, WTCCC and EGA groups for providing the high-quality
dataset. This project was supported by the Taiwan National Research
Program for Biopharmaceuticals (101CA1005).
References
|
1
|
Ferlay J, Shin HR, Bray F, et al:
Estimates of worldwide burden of cancer in 2008: GLOBOCAN 2008. Int
J Cancer. 127:2893–2917. 2010.
|
|
2
|
Yeh CT, Liang KH, Lin CC, Chang ML, Hsu CL
and Hung CF: A single nucleotide polymorphism on the GALNT14 gene
as an effective predictor of response to chemotherapy in advanced
hepatocellular carcinoma. Int J Cancer. 134:1214–1224. 2014.
|
|
3
|
Perz JF, Armstrong GL, Farrington LA, et
al: The contributions of hepatitis B virus and hepatitis C virus
infections to cirrhosis and primary liver cancer worldwide. J
Hepatol. 45:529–538. 2006.
|
|
4
|
Liang KH, Lin CC and Yeh CT: GALNT14 SNP
as a potential predictor of response to combination chemotherapy
using 5-FU, mitoxantrone and cisplatin in advanced HCC.
Pharmacogenomics. 12:1061–1073. 2011.
|
|
5
|
Venook AP, Papandreou C, Furuse J and de
Guevara LL: The incidence and epidemiology of hepatocellular
carcinoma: a global and regional perspective. Oncologist. 15(Suppl
4): 5–13. 2010.
|
|
6
|
Roberts RJ: How restriction enzymes became
the workhorses of molecular biology. Proc Natl Acad Sci USA.
102:5905–5908. 2005.
|
|
7
|
Botstein D, White RL, Skolnick M and Davis
RW: Construction of a genetic linkage map in man using restriction
fragment length polymorphisms. Am J Hum Genet. 32:314–331.
1980.
|
|
8
|
Rommens JM, Iannuzzi MC, Kerem B, et al:
Identification of the cystic fibrosis gene: chromosome walking and
jumping. Science. 245:1059–1065. 1989.
|
|
9
|
Collins FS: Positional cloning: let’s not
call it reverse anymore. Nat Genet. 1:3–6. 1992.
|
|
10
|
Saiki RK, Scharf S, Faloona F, et al:
Enzymatic amplification of beta-globin genomic sequences and
restriction site analysis for diagnosis of sickle cell anemia.
Science. 230:1350–1354. 1985.
|
|
11
|
Kwok PY: SNP genotyping with fluorescence
polarization detection. Hum Mutat. 19:315–323. 2002.
|
|
12
|
Liang KH, Fen JJ, Chang HH, Wang HW and
Hwang Y: A base-calling algorithm for Tm-shifted melting curve SNP
assay. J Clin Bioinforma. 1:32011.
|
|
13
|
International HapMap 3 Consortium.
Altshuler DM, Gibbs RA, Peltonen L, et al: Integrating common and
rare genetic variation in diverse human populations. Nature.
467:52–58. 2010.
|
|
14
|
Wellcome Trust Case Control Consortium.
Genome-wide association study of 14,000 cases of seven common
diseases and 3,000 shared controls. Nature. 447:661–678. 2007.
|
|
15
|
Bauer CH, Vischer P, Grünholz H and
Reutter W: Glycosyltransferases and glycosidases in Morris
hepatomas. Cancer Res. 37:1513–1518. 1977.
|
|
16
|
Mandel U, Hassan H, Therkildsen MH,
Rygaard J, Jakobsen MH, Juhl BR, Dabelsteen E and Clausen H:
Expression of polypeptide GalNAc-transferases in stratified
epithelia and squamous cell carcinomas: immunohistological
evaluation using monoclonal antibodies to three members of the
GalNAc-transferase family. Glycobiology. 9:43–52. 1999.
|
|
17
|
Kohsaki T, Nishimori I, Nakayama H,
Miyazaki E, Enzan H, Nomoto M, Hollingsworth MA and Onishi S:
Expression of UDP-GalNAc: polypeptide
N-acetylgalactosaminyltransferase isozymes T1 and T2 in human
colorectal cancer. J Gastroenterol. 35:840–848. 2000.
|
|
18
|
Wu YM, Liu CH, Hu RH, Huang MJ, Lee JJ,
Chen CH, Huang J, Lai HS, Lee PH, Hsu WM, Huang HC and Huang MC:
Mucin glycosylating enzyme GALNT2 regulates the malignant character
of hepatocellular carcinoma by modifying the EGF receptor. Cancer
Res. 71:7270–7279. 2011.
|
|
19
|
Park JH, Nishidate T, Kijima K, Ohashi T,
Takegawa K, Fujikane T, Hirata K, Nakamura Y and Katagiri T:
Critical roles of mucin 1 glycosylation by transactivated
polypeptide N-acetylgalactosaminyltransferase 6 in mammary
carcinogenesis. Cancer Res. 70:2759–2769. 2010.
|
|
20
|
Wagner KW, Punnoose EA, Januario T, et al:
Death-receptor O-glycosylation controls tumor-cell sensitivity to
the proapoptotic ligand Apo2L/TRAIL. Nat Med. 13:1070–1077.
2007.
|
|
21
|
Thorburn A, Behbakht K and Ford H: TRAIL
receptor-targeted therapeutics: resistance mechanisms and
strategies to avoid them. Drug Resist Updat. 11:17–24. 2008.
|
|
22
|
Wu C, Guo X, Wang W, et al:
N-Acetylgalactosaminyltransferase-14 as a potential biomarker for
breast cancer by immunohistochemistry. BMC Cancer. 10:1232010.
|
|
23
|
Obi S, Yoshida H, Toune R, Unuma T, Kanda
M, Sato S, Tateishi R, Teratani T, Shiina S and Omata M:
Combination therapy of intraarterial 5-fluorouracil and systemic
interferon-alpha for advanced hepatocellular carcinoma with portal
venous invasion. Cancer. 106:1990–1997. 2006.
|