Introduction
5-Fluorouracil (5-FU) continues to play a central
role in chemotherapy for colorectal cancer. S-1 is an oral
5-FU-based anticancer drug that was developed in Japan. This drug
combines tegafur, a prodrug of 5-FU, with gimeracil, a reversible
antagonist of the rate-limiting enzyme of the metabolic pathway of
5-FU, and oteracil potassium, which is distributed at high
concentrations in the gastrointestinal tract, where it reduces
gastrointestinal toxicity by irreversibly inhibiting the
phosphorylation of 5-FU. The molar ratio of tegafur, gimeracil and
oteracil potassium in S-1 is 1.0:0.4:1.0 (1,2).
Clinically, the time course of serum 5-FU concentrations following
the oral administration of S-1 has been confirmed to be similar to
that during a continuous infusion of 5-FU (3). Late phase II studies of patients with
advanced or recurrent colorectal cancer have reported a response
rate of 37.4% in patients with advanced or recurrent colorectal
cancer (4,5). As a second-line chemotherapy for
metastatic colorectal cancer, combination therapy with S-1 and
irinotecan was shown to be non-inferior to a folinic acid, 5-FU and
irinotecan (FOLFIRI) regime (6).
Clinical trials have demonstrated that administering S-1 for one
year is as effective as post-operative adjuvant chemotherapy in
stage II or III gastric cancer. Together with the results of our
previous feasibility study, this suggests that S-1 is a promising
drug for adjuvant therapy in patients with stage II or III
colorectal cancer (7–9).
Recent studies have provided evidence that the
expression of enzymes involved in 5-FU metabolism is associated
with treatment response (10,11).
Thymidylate synthase (TS), a rate-limiting enzyme in DNA synthesis,
dihydropyrimidine dehydrogenase (DPD), an enzyme participating in
the catabolism of 5-FU, and thymidine phosphorylase (TP), an
important metabolizing enzyme of 5-FU, have been studied as
predictors of the response or sensitivity to anticancer agents.
Enzymes involved in folate metabolism, including folypolyglutamate
synthetase (FPGS), γ-glutamyl hydrolase (GGH) and dihydrofolate
reductase (DHFR), have been reported to participate in the response
to 5-FU-based agents. S-1 is an oral 5-FU-based anticancer drug for
which it is considered meaningful to study the value of enzymes
involved in 5-FU metabolism or folate metabolism as predictors of
treatment response or drug sensitivity.
In the present study, the mRNA expression levels of
enzymes involved in 5-FU metabolism or folate metabolism were
measured, using tumor specimens obtained from patients with stage
II or III colorectal cancer who received post-operative adjuvant
chemotherapy with S-1 for one year. The aim of the study was to
assess the value of such expression levels as predictors of the
response or sensitivity to S-1.
Materials and methods
Patients and treatment
The study group was comprised of patients in whom
stage II or III colorectal cancer was diagnosed (Union for
International Cancer Control staging, sixth edition) (12) and curatively resected in The Jikei
University School of Medicine between February 2004 and June 2006.
Patients received oral S-1 (Taiho Pharmaceutical Co., Ltd., Tokyo,
Japan) as post-operative adjuvant chemotherapy. The daily dose of
S-1 (80, 100 or 120 mg per day) was calculated according to
body-surface area and administered in two divided doses, one after
breakfast and the other after dinner, for 28 consecutive days,
followed by a 14-day rest period. The dose of S-1 was 80 mg/day if
the body-surface area was <1.25 m2, 100 mg/day if the
body-surface area was 1.25 to <1.5 m2 and 120 mg/day
if the body-surface area was ≥1.5 m2. The duration of
treatment with S-1 was one year. This study was approved by the
ethical committee of The Jikei University School of Medicine
(Tokyo, Japan) and written informed consent was obtained from all
patients.
Laboratory analysis
Expression
Tumor tissue expression levels of various
metabolizing enzymes were measured using pathological specimens of
resected colorectal cancer. Gene mRNA expression levels of the TS,
DPD, TP, FPGS, GGH and DHFR enzymes were semiquantitatively
measured by the Dannenberg tumor profiling (DTP) method, and the
associations between such levels and clinical variables were
studied. An outline of the Dannenberg tumor profiling method is
presented below.
Staining of formalin-fixed,
paraffin-embedded (FFPE) tissue sections
To confirm the site of the tumors, 5-μm thick FFPE
tissue sections were stained with hematoxylin and eosin (HE), and
the site of cancer was identified and marked by a pathologist.
Additionally, 10-μm thick FFPE tissue sections were stained with
nuclear fast red (NFR) for RNA extraction.
Slicing of cancer tissue
Cancer tissue within the tumor, as designated by a
pathologist on examination of specimens stained with NFR under a
stereomicroscope, was thinly sliced with a razor knife, surgical
knife or laser microdissector, and the slices were placed in RNA
extraction buffer. Usually, an area >50 mm2 was
shaved to maintain at least 80% cancer cells. Cancer cells were
stained a darker red by NFR compared with the normal cells. Cancer
tissue was cut out on the basis of the staining pattern, and
specimens stained with HE served as a reference.
RNA extraction and circular DNA (cDNA)
synthesis
Proteinase was added to a cancer-cell suspension,
and the mixture was heated to cause cytolysis. RNA was refined by
simple column extraction or by phenol extraction and ethanol
precipitation, and cDNA synthesis was synthesized using random
hexamer as a primer.
Analysis by quantitative reverse
transcription (RT) polymerase chain reaction (PCR)
Formalin-fixed 10-μm thick paraffin-embedded
sections of resected primary colorectal cancer tumors were obtained
from identified areas with the highest tumor concentration and were
then mounted onto uncoated glass slides. For histological
diagnosis, representative sections were stained with haematoxylin
and eosin using standard methods. Prior to microdissection,
sections were stained with nuclear fast red (American MasterTech,
Lodi, CA, USA). The sections were selectively isolated by laser
capture microdissection (P.A.L.M. Microsystem; Leica, Wetzlar,
Germany), according to standard procedures (13). The dissected tissues were
transferred to a reaction tube containing 400 μl RNA lysis buffer
(Invitrogen Life Technologies, Carlsbad, CA, USA).
The samples were homogenised at 92°C for 30 min. A
total of 50 μm of 2 M sodium acetate (pH 4.0) was added, followed
by 600 μl phenol/chloroform/isoamyl alcohol (250:50:1). The tubes
were vortexed for 15 sec, placed on ice for 15 min, and then
centrifuged at 16,000 × g for 8 min at 8°C centrifuge. The upper
aqueous phase was removed and placed in a 1.5 ml centrifuge tube. A
total of 10 μl glycogen and 300–400 μl isopropanol were added and
the samples were vortexed for 10–15 sec. The tubes were chilled at
−20°C for 30–45 min to precipitate the RNA. The samples were then
washed in 500 μl 75% v/v ethanol and air-dried for 15 min. The
pellet was resuspended in 50 μl 5 mM Tris buffer (Sigma-Aldrich,
St. Louis, MO, USA). Finally, cDNA was prepared as described by
Lord et al (14). Quantification of
the 12 genes of interest and an internal reference gene (β-actin)
was performed using a fluorescence-based real-time detection method
(ABI PRISM 7900 Sequence Detection System; Applied Biosystems,
Foster City, CA, USA). The PCR reaction mixture consisted of 120 nM
of each primer, 200 nM probe, 0.4 U/l of AmpliTaq gold polymerase,
200 nM of each dATP, dCTP, dGTP, dTTP, 3.5 mM MgCl2 and
1× Taqman buffer, containing a reference dye (Applied Biosystems).
The final volume of the reaction mixture was 20 μl. PCR conditiosn
were as follows: 50°C for 2 min and 95°C for 10 min, followed by 46
cycles of 95°C for 15 sec and 60°C for 1 min. The primers and probe
used were as follows: Forward, 5′-GCCTCGGTGTGCCTTTCA-3′ and
reverse, 5′-CCCGTGATGTGCGCAAT-3′ for TS; and Taqman probe
5′-TCGCCAGCTACGCCCTGCTCA-3′; and forward 5′-AGGACGCAAGGAGGGTTTG-3′
and reverse, 5′-GTCCGCCGAGTCCTTACTGA-3′ for DPD; and Taqman probe
5′-CAGTGCCTACAGTCTCGAGTCTGCCAGT-3′; forward,
5′-CCTGCGGACGGAATCCT-3′ and reverse, 5′-GCTGTGATGAGTGGCAGGCT-3′for
TP; and Taqman probe 5′-CAGCCAGAGATGTGACAGCCACCGT-3′; foward,
5′-GGCTGGAGGAGACCAAGGAT-3′ and reverse, 5′-CATGAGTGTCAGGAAGCGGA-3′
for FPGS; and Taqman probe 5′-CAGCTGTGTCTCCATGCCCCCCTAC-3′;
forward, 5′-GCGAGCCTCGAGCTGTCTA-3′ and reverse,
5′-AATATTCCGATGATGGGCTTCTT-3′ for GGH; and Taqman probe
5′-ACCCCACGGCGACACCGC-3′; forward, 5′-GTCCTCCCGCTGCTGTCA-3′ and
reverse, 5′-GCCGATGCCCATGTTCTG-3′ for DHFR; and Taqman probe
5′-TTCGCTAAACTGCATCGTCGCTGTGTC-3′.
Calculation of results (DTP values)
Genes are amplified two-fold on every cycle of PCR.
Gene expression values (relative mRNA levels) are expressed as
ratios (differences between Ct values) of the gene of interest and
the internal reference gene (β-actin). Therefore, the gene
expression ratio of each sample is calculated as a 2-Ct value. The
quantity of cancer cells removed from each specimen differs and was
therefore expressed relative to the expression of β-actin
expression to correct for differences in cell quantities. In
addition, correction coefficients were calculated on the basis of
the results of the analysis of standard samples containing known
concentrations of target genes. The measured values were multiplied
by the correction coefficients to derive DTP values, which were
regarded as expression levels of the target genes. DTP values were
calculated by the following formula, in which dCt is the Ct value
of the target gene minus the Ct value of β-actin, and K is the
correction coefficient: DTP = K × 2−dCt.
Statistical methods
Disease-free survival (DFS), measured as the
interval from the date of surgery to the date of the first
documented evidence of recurrence, death or a second cancer, was
calculated using the Kaplan-Meier method. The associations between
the mRNA expression levels of the various metabolizing enzymes and
the clinicopathological factors of age, gender, invasion depth,
lymph-node metastasis, disease stage and tumor location were tested
by Wilcoxon’s test. The median mRNA expression level of each
metabolizing enzyme was regarded as the cutoff value, and tumors
were classified as having high or low expression as compared with
this value. The associations between the high and low expression
levels of each enzyme and DFS were analyzed using Kaplan-Meier
curves, and differences between survival curves were computed with
the log-rank test. P<0.05 was considered to indicate a
statistically significant difference.
Results
Patient characteristics
Between February 2004 and June 2006, a complete
resection with no microscopically residual tumor (R0) was performed
in 54 patients, who subsequently received oral S-1. The mRNA levels
of the tumors were measured. Table
I shows the demographic characteristics of the patients. The
median age was 67 years (range, 31–84 years). The primary lesion
was located in the colon or rectosigmoid colon in 40 patients
(74.1%) and in the rectum in 14 (25.9%). Overall, 16 patients
(29.6%) exhibited stage II disease and 38 (70.4%) exhibited stage
III disease.
 | Table IPatient characteristics. |
Table I
Patient characteristics.
| Parameter | Value |
|---|
| Age, years |
| Median (range) | 67 (31–84) |
| Gender, n (%) |
| Male | 39 (72.2) |
| Female | 15 (27.8) |
| Primary site, n
(%) |
|
Colon/rectosigmoid | 40 (74.1) |
| Rectum | 14 (25.9) |
| Invasion depth, n
(%) |
| MP | 1 (1.9) |
| SM | 1 (1.9) |
| SS | 21 (38.9) |
| SE | 14 (25.9) |
| SI | 4 (7.4) |
| A | 13 (24.1) |
| Lymph node
metastasis, n (%) |
| N0 | 16 (29.6) |
| N1 | 23 (42.6) |
| N2 | 12 (22.2) |
| N3 | 3 (5.6) |
| Stage, n (%) |
| II | 16 (29.6) |
| III | 38 (70.4) |
Clinicopathological factors versus TS,
DPD, TP, FPGS, GGH and DHFR mRNA levels
The mRNA expression levels [median (range)] of TS,
DPD, FPGS, GGH and DHFR are shown in Table II. There was no correlation between
the mRNA expression levels of any of these enzymes and any of the
clinicopathological factors of age, gender, primary site, location,
invasion depth or lymph-node metastasis (Table III).
| Table IIExpression level of mRNA (n=54). |
Table II
Expression level of mRNA (n=54).
| Molecular
markers | Median (range) |
|---|
| TS | 4.075
(1.100–20.48) |
| DPD | 0.295
(0.050–1.080) |
| TP | 2.575
(0.880–23.94) |
| FPGS | 0.590
(0.220–1.370) |
| GGH | 12.961
(1.600–166.5) |
| DHFR | 5.380
(1.620–12.53) |
| Table IIIAssociation between the
clinicophathological factors and TS, DPD, TP, FPGS, GGH and DHFR
mRNA levels. |
Table III
Association between the
clinicophathological factors and TS, DPD, TP, FPGS, GGH and DHFR
mRNA levels.
| TS | DPD | TP | FPGS | GGH | DHFR |
|---|
|
|
|
|
|
|
|
|---|
| Parameter | Median | P-value | Median | P-value | Median | P-value | Median | P-value | Median | P-value | Median | P-value |
|---|
| Age, years |
| <65 | 4.33 | 0.664 | 0.27 | 0.631 | 2.15 | 0.632 | 0.56 | 0.112 | 14.7 | 0.228 | 5.25 | 0.811 |
| ≥65 | 3.91 | | 0.30 | | 2.84 | | 0.62 | | 10.6 | | 5.69 | |
| Gender |
| Male | 4.11 | 0.678 | 0.29 | 0.354 | 2.49 | 0.315 | 0.57 | 0.167 | 12.6 | 0.839 | 5.18 | 0.150 |
| Female | 3.95 | | 0.32 | | 3.58 | | 0.65 | | 14.4 | | 6.39 | |
| Primary site |
|
Colon/rectosigmoid | 4.01 | 0.782 | 0.32 | 0.459 | 2.75 | 0.813 | 0.59 | 0.502 | 12.3 | 0.093 | 5.38 | 0.441 |
| Rectum | 4.24 | | 0.24 | | 2.46 | | 0.60 | | 23.1 | | 5.35 | |
| Invasion depth |
| MP | 4.08 | 0.990 | 0.40 | 0.846 | 2.93 | 0.651 | 0.76 | 0.631 | 21.9 | 0.417 | 6.27 | 0.885 |
| SM | 3.95 | | 0.27 | | 2.14 | | 0.35 | | 5.46 | | 6.39 | |
| SS | 4.86 | | 0.24 | | 2.11 | | 0.56 | | 12.2 | | 5.31 | |
| SE | 3.79 | | 0.32 | | 2.96 | | 0.60 | | 13.7 | | 5.22 | |
| SI | 5.77 | | 0.41 | | 3.75 | | 0.50 | | 9.87 | | 5.96 | |
| A | 4.11 | | 0.25 | | 2.71 | | 0.62 | | 23.0 | | 4.77 | |
| Lymph node
metastasis |
| Node(−) | 4.91 | 0.293 | 0.20 | 0.172 | 2.20 | 0.198 | 0.58 | 0.563 | 10.2 | 0.229 | 5.06 | 0.820 |
| Node(+) | 3.94 | | 0.32 | | 2.85 | | 0.59 | | 15.6 | | 5.38 | |
A correlation analysis of TS, DPD and TP, three
enzymes involved in 5-FU metabolism, showed a significant positive
correlation between TP and DPD (data not shown; Spearman’s
correlation coefficient, 0.78; P<0.0001).
DFS versus mRNA levels of TS, DPD, TP,
FPGS, GGH and DHFR
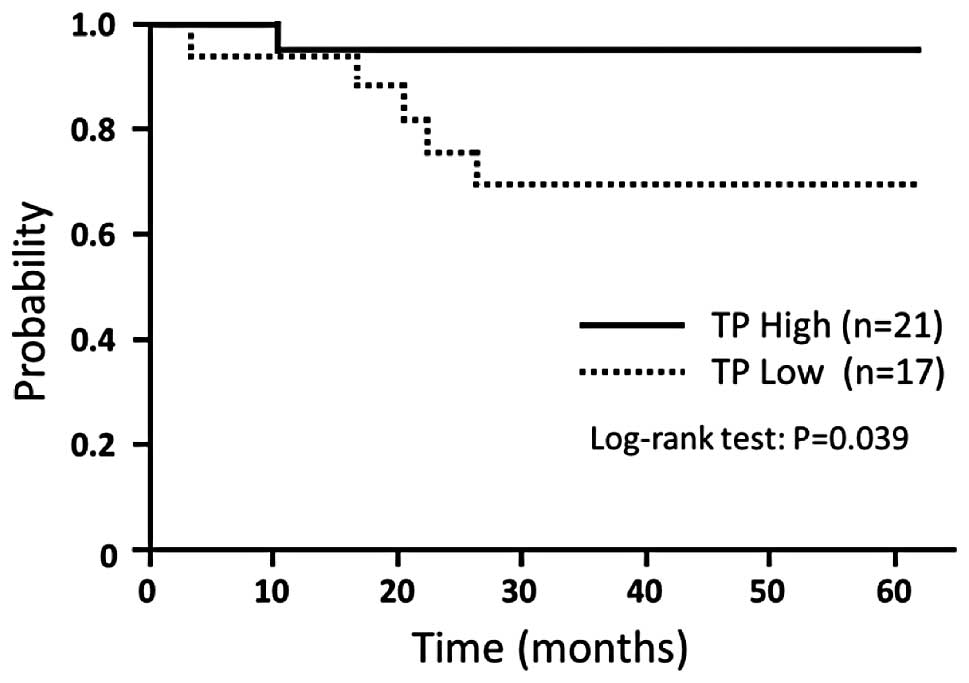
DFS did not differ significantly between the
patients with high mRNA expression and those with low mRNA
expression of any factor associated with the sensitivity to various
types of anticancer agents in the study group as a whole, but there
was a trend toward a longer DFS in the patients with high TP
expression (P=0.066). According to disease stage, no factor was
associated with survival in the patients with stage II disease.
However, in the patients with stage III disease who received
post-operative adjuvant chemotherapy, there was a statistical
difference between the association of low TP expression levels and
DFS compared with high TP expression levels (P=0.039) (Fig. 1). DFS did not differ significantly
according to the expression level of any other factor (Table IV).
| Table IVAssociation between DFS and TS, DPD,
TP, FPGS, GGH and DHFR mRNA levels. |
Table IV
Association between DFS and TS, DPD,
TP, FPGS, GGH and DHFR mRNA levels.
| All patients | Stage III |
|---|
|
|
|
|---|
| Molecular
marker | n | 3-year DFS, % | P-value | n | 3-year DFS, % | P-value |
|---|
| TS |
| High (≥4.075) | 27 | 85.2 | 0.847 | 17 | 88.2 | 0.628 |
| Low
(<4.075) | 27 | 85.2 | | 21 | 81.0 | |
| DPD |
| High (≥0.295) | 27 | 92.6 | 0.310 | 21 | 90.1 | 0.272 |
| Low
(<0.295) | 27 | 77.3 | | 17 | 75.3 | |
| TP |
| High (≥2.575) | 27 | 96.3 | 0.066 | 21 | 95.2 | 0.039 |
| Low
(<2.575) | 27 | 73.6 | | 17 | 69.3 | |
| FPGS |
| High (≥0.590) | 27 | 88.9 | 0.313 | 20 | 90.0 | 0.283 |
| Low
(<0.590) | 27 | 81.2 | | 18 | 77.0 | |
| GGH |
| High (≥12.96) | 27 | 88.7 | 0.311 | 21 | 85.5 | 0.803 |
| Low
(<12.96) | 27 | 81.5 | | 17 | 82.4 | |
| DHFR |
| High (≥5.380) | 27 | 81.5 | 0.636 | 19 | 80.0 | 0.338 |
| Low
(<5.380) | 27 | 88.6 | | 19 | 88.9 | |
Discussion
S-1, an oral 5-FU-based anticancer drug, is
indicated for the treatment of seven types of cancer in Japan,
including gastric cancer, colorectal cancer, and head and neck
cancer (15). S-1 is also approved
in various countries in Asia and Europe. S-1 has been found to be
at least as effective as conventional 5-FU-based anticancer agents
and was designed to reduce gastrointestinal toxicity, an adverse
reaction specifically associated with 5-FU analogues. S-1 contains
gimeracil, which strongly inhibits DPD, a metabolizing enzyme of
5-FU derivatives, thereby maintaining high concentrations of 5-FU
in serum (16). In addition, S-1
contains oteracil potassium, which inhibits the phosphorylation of
5-FU in the gastrointestinal tract, an important cause of
gastrointestinal toxicity, and thereby inhibits adverse effects
(17). Our previous study analyzed
the safety and effectiveness of a one-year treatment with S-1 in
patients with resected stage II or III colorectal cancer. The
treatment completion rate was 77.7%, and watery eyes was the only
grade 3 or higher adverse reaction (1 patient). The three-year DFS
rate was 85%, showing that S-1 is safe and effective (9). At present, the usefulness of S-1 as a
post-operative adjuvant chemotherapy is being evaluated in phase
III clinical trials in patients with colorectal cancer, and S-1 may
become a standard treatment for colorectal cancer in the future
(18).
The present study measured the mRNA expression
levels of TS, DPD, TP, FPGS, GGH and DHFR, enzymes that are
important in the chemotherapy of colorectal cancer with 5-FU-based
agents, and examined the associations between such levels and DFS.
TS, an enzyme required for DNA synthesis, is a target enzyme of
5-FU. DPD is an enzyme that affects the pharmacokinetics of 5-FU.
TP is not only involved in 5-FU metabolism, but is also known as a
platelet-derived endothelial cell growth factor, which has
angiogenic activity (19–21). Several studies have demonstrated
that tumors with low levels of TS, DPD and TP gene expression are
more sensitive to 5-FU, not only in advanced or recurrent
colorectal cancer, but also in gastric cancer and breast cancer
(22–25). In particular, TP expression levels
have been shown to differ by a factor of 2.6 times between patients
who are more sensitive and those who are less sensitive to
chemotherapy (22).
Few studies have examined the correlations between
TP expression and the clinical usefulness of post-operative
adjuvant chemotherapy in patients with colorectal cancer. Sadahiro
et al (26) found that
post-operative adjuvant chemotherapy with uracil and tegafur
(UFT)/leucovorin is beneficial in patients with colorectal cancer
and high TP expression levels, and reported that TP expression
levels may be a useful predictor of treatment response. Another
study showed that high TP expression was associated with a
significantly higher survival rate in patients with Duke’s C
colorectal cancer who received 5′-deoxy-5-fluorouridine (5′-DFUR)
(27). Since TP is an enzyme that
not only participates in 5-FU metabolism, but also converts 5′-DFUR
to 5-FU, it was proposed as a potential predictor of response. By
contrast, experimental studies also reported that high TP
expression is associated with the decreased sensitivity of
colorectal cancer to 5-FU (28,29),
and certain clinical trials found no clinically useful correlation
between TP expression and the response to post-operative adjuvant
chemotherapy with agents such as 5-FU/leucovorin and 5′-DFUR
(30,31). The ability to use TP mRNA expression
to predict response to post-operative adjuvant chemotherapy in
patients with colorectal cancer thus remains controversial.
In the present study, high TP expression was
associated with good outcomes, particularly in the patients with
stage III disease. These findings and the results of a previous
study by Sadahiro et al (26) showing that high TP expression is
associated with good outcomes in patients who received
UFT/leucovorin suggest that the mechanism of action and clinical
effects of post-operative adjuvant chemotherapy with S-1,
containing uracil and gimeracil, which prevents 5-FU catabolism by
inhibiting DPD, or with regimens that include UFT, differ from
those of other 5-FU-based anticancer agents (26). As S-1 and UFT enhance serum 5-FU
concentrations by inhibiting DPD, the response to these drugs may
be more susceptible to catalytic reactions mediated by TP than
other 5-FU analogues.
The present results demonstrated a significant
positive correlation between TP and DPD expression. This finding
was consistent with the result of a study by Collie-Duguid et
al (32), which reported a
positive correlation between TP and DPD expression in colorectal
cancer. In the present study, however, outcomes similar to those in
patients with high TP expression were not obtained in patients with
high DPD expression. One of the reasons for this finding may be
that S-1 was clinically effective regardless of DPD expression.
In conclusion, the present study measured the mRNA
expression levels of factors associated with the sensitivity to
various types of anticancer agents and found that TP is a predictor
of response. The results suggest that TP can be used to predict the
response to post-operative adjuvant chemotherapy with S-1. However,
as the number of patients was small, firm conclusions could not be
drawn. Further large clinical studies of factors associated with
sensitivity to various types of anticancer agents are required to
confirm these findings.
References
|
1
|
Shirasaka T, Shimamato Y, Ohshimo H, et
al: Development of a novel form of an oral 5-fluorouracil
derivative (S-1) directed to the potentiation of the tumor
selective cytotoxicity of 5-fluorouracil by two biochemical
modulators. Anticancer Drugs. 7:548–557. 1996.
|
|
2
|
Diasio RB: Clinical implications of
dihydropyrimidine dehydrogenase inhibition. Oncology (Williston
Park). 13(Suppl 3): 17–21. 1999.
|
|
3
|
Yamada Y, Hamaguchi T, Goto M, et al:
Plasma concentrations of 5-fluorouracil and F-beta-alanine
following oral administration of S-1, a dihydropyrimidine
dehydrogenase inhibitory fluoropyrimidine, as compared with
protracted venous infusion of 5-fluorouracil. Br J Cancer.
89:816–820. 2003.
|
|
4
|
Ohtsu A, Baba H, Sakata Y, et al: Phase II
study of S-1, a novel oral fluoropyrimidine derivative, in patients
with metastatic colorectal carcinoma. S-1 Cooperative Colorectal
Carcinoma Study Group. Br J Cancer. 83:141–145. 2000.
|
|
5
|
Shirao K, Ohtsu A, Takada H, et al: Phase
II study of oral S-1 for treatment of metastatic colorectal
carcinoma. Cancer. 100:2355–2361. 2004.
|
|
6
|
Muro K, Boku N, Shimada Y, et al:
Irinotecan plus S-1 (IRIS) versus fluorouracil and folinic acid
plus irinotecan (FOLFIRI) as second-line chemotherapy for
metastatic colorectal cancer: a randomised phase 2/3
non-inferiority study (FIRIS study). Lancet Oncol. 11:853–860.
2010.
|
|
7
|
Sakuramoto S, Sasako M, Yamaguchi T, et
al; ACTS-GC Group. Adjuvant chemotherapy for gastric cancer with
S-1, an oral fluoropyrimidine. N Engl J Med. 357:1810–1820.
2007.
|
|
8
|
Sasako M, Sakuramoto S, Katai H, et al:
Five-year outcomes of a randomized phase III trial comparing
adjuvant chemotherapy with S-1 versus surgery alone in stage II or
III gastric cancer. J Clin Oncol. 29:4387–4393. 2011.
|
|
9
|
Ogawa M, Watanabe M, Kobayashi T, et al:
Feasibility study of S-1 adjuvant chemotherapy in patients with
colorectal cancer. Int J Clin Oncol. 18:678–683. 2013.
|
|
10
|
Salonga D, Danenberg KD, Johnson M, et al:
Colorectal tumors responding to 5-fluorouracil have low gene
expression levels of dihydropyrimidine dehydrogenase, thymidylate
synthase, and thymidine phosphorylase. Clin Cancer Res.
6:1322–1327. 2000.
|
|
11
|
Popat S, Matakidou A and Houlston RS:
Thymidylate synthase expression and prognosis in colorectal cancer:
a systematic review and meta-analysis. J Clin Oncol. 22:529–536.
2004.
|
|
12
|
Sobin LH and Wittekind Ch: TNM
Classification of Malignant Tumors. 6th edition. Wiley-Liss, Inc;
New York, NY: 2002
|
|
13
|
Bonner RF, Emmert-Buck M, Cole K, et al:
Laser capture microdissection: molecular analysis of tissue.
Science. 278:14811997.
|
|
14
|
Lord RV, Salonga D, Danenberg KD, et al:
Telomerase reverse transcriptase expression is increased early in
the Barrett’s metaplasia, dysplasia, adenocarcinoma sequence. J
Gastrointest Surg. 4:135–142. 2000.
|
|
15
|
Satoh T and Sakata Y: S-1 for the
treatment of gastrointestinal cancer. Expert Opin Pharmacother.
13:1943–1959. 2012.
|
|
16
|
Shirasaka T, Shimamoto Y and Fukushima M:
Inhibition by oxonic acid of gastrointestinal toxicity of
5-fluorouracil without loss of its antitumor activity in rats.
Cancer Res. 53:4004–4009. 1993.
|
|
17
|
Shirasaka T, Shimamato Y, Ohshimo H, et
al: Development of a novel form of an oral 5-fluorouracil
derivative (S-1) directed to the potentiation of the tumor
selective cytotoxicity of 5-fluorouracil by two biochemical
modulators. Anticancer Drugs. 7:548–557. 1996.
|
|
18
|
Mochizuki I, Takiuchi H, Ikejiri K, et al:
Safety of UFT/LV and S-1 as adjuvant therapy for stage III colon
cancer in phase III trial: ACTS-CC trial. Br J Cancer.
106:1268–1273. 2012.
|
|
19
|
Furukawa T, Yoshimura A, Sumizawa T, et
al: Angiogenic factor. Nature. 356:6681992.
|
|
20
|
Takebayashi Y, Akiyama S, Akiba S, et al:
Clinicopathologic and prognostic significance of an angiogenic
factor, thymidine phosphorylase, in human colorectal carcinoma. J
Natl Cancer Inst. 88:1110–1117. 1996.
|
|
21
|
Nakayama Y, Inoue Y, Nagashima N, et al:
Expression levels of thymidine phosphorylase (TP) and
dihydropyrimidine dehydrogenase (DPD) in patients with
gastrointestinal cancer. Anticancer Res. 25:3755–3761. 2005.
|
|
22
|
Metzger R, Danenberg K, Leichman CG, et
al: High basal level gene expression of thymidine phosphorylase
(platelet-derived endothelial cell growth factor) in colorectal
tumors is associated with nonresponse to 5-fluorouracil. Clin
Cancer Res. 4:2371–2376. 1998.
|
|
23
|
Toi M, Hoshina S, Taniguchi T, et al:
Expression of platelet-derived endothelial cell growth
factor/thymidine phosphorylase in human breast cancer. Int J
Cancer. 64:79–82. 1995.
|
|
24
|
Takebayashi Y, Akiyama S, Akiba S, et al:
Clinicopathologic and prognostic significance of an angiogenic
factor, thymidine phosphorylase, in human coborectal carcinoma. J
Natl Cancer Inst. 88:1110–1117. 1996.
|
|
25
|
Maeda K, Chung YS, Ogawa Y, et al:
Thymidine phosphorylase/platelet-derived endothelial cell growth
factor expression associated with hepatic metastasis in gastric
carcinoma. Br J Cancer. 73:884–888. 1996.
|
|
26
|
Sadahiro S, Suzuki T, Tanaka A, Okada K,
Nagase H and Uchida J: Association of right-sided tumors with high
thymidine phosphorylase gene expression levels and the response to
oral uracil and tegafur/leucovorin chemotherapy among patients with
colorectal cancer. Cancer Chemother Pharmacol. 70:285–291.
2012.
|
|
27
|
Hasegawa S, Seike K, Koda K, et al:
Thymidine phosphorylase expression and efficacy of adjuvant
doxifluridine in advanced colorectal cancer patients. Oncol Rep.
13:621–626. 2005.
|
|
28
|
Salonga D, Danenberg KD, Johnson M, et al:
Colorectal tumors responding to 5-fluorouracil have low gene
expression levels of dihydropyrimidine dehydrogenase, thymidylate
synthase, and thymidine phosphorylase. Clin Cancer Res.
6:1322–1327. 2000.
|
|
29
|
Yoshinare K, Kubota T, Watanabe M, et al:
Gene expression in colorectal cancer and in vitro chemosensitivity
to 5-fluorouracil: a study of 88 surgical specimens. Cancer Sci.
94:633–638. 2003.
|
|
30
|
Nishimura G, Terada I, Kobayashi T, et al:
Thymidine phosphorylase and dihydropyrimidine dehydrogenase levels
in primary colorectal cancer show a relationship to clinical
effects of 5′-deoxy-5-fluorouridine as adjuvant chemotherapy. Oncol
Rep. 9:479–482. 2002.
|
|
31
|
Jensen SA, Vainer B, Witton CJ, Jørgensen
JT and Sørensen JB: Prognostic significance of numeric aberrations
of genes for thymidylate synthase, thymidine phosphorylase and
dihydrofolate reductase in colorectal cancer. Acta Oncol.
47:1054–1061. 2008.
|
|
32
|
Collie-Duguid ES, Johnston SJ, Boyce L, et
al: Thymidine phosphorylase and dihydropyrimidine dehydrogenase
protein expression in colorectal cancer. Int J Cancer. 94:297–301.
2001.
|