Introduction
Hodgkin disease (HD) is a lymphoproliferative
disorder with an incidence rate of 2.7–2.8 per 100,000 individuals
in the UK and the USA in 2013 (1).
Doxorubicin, bleomycin, vinblastine and dacarbazine (ABVD)
chemotherapy (CHT) is routinely used in the treatment of HD
(2), and is less toxic than other
chemotherapeutic schemes, such as mechlorethamine,
vincristine, procarbazine and prednisone (3), and bleomycin, etoposide, doxorubicin,
cyclophosphamide, vincristine, procarbazine and prednisone regimens
(4).
In a recent study investigating the brain glucose
metabolism in HD patients by means of 2-[18F]
fluoro-2-deoxy-D-glucose (18F-FDG) positron emission
tomography/computed tomography (PET/CT), the hypothesis of brain
damage induced by ABVD CHT treatment was dismissed (5). However, a strong body of evidence
demonstrates the coexistence of depression and cancer, with a
20–50% prevalence of depression in patients exhibiting solid tumors
(6). Furthermore, various studies
report a direct correlation between the rapid progression of cancer
and severe depression (7). This is
consistent with our previous study, which supports the hypothesis
that metabolic changes following CHT may correlate with the
transient depressive state of cancer patients after diagnosis,
followed by an improvement in general and psychological conditions
due to a positive therapeutic response (5).
The aim of the present study was to investigate the
impact of ABVD CHT on a larger cohort of HD patients, evaluating
the brain metabolic changes during the various steps of CHT and
comparing them with an age-matched control group (CG). Furthermore,
the possible role of disease severity as a variable affecting the
brain metabolic changes was investigated in the HD patients.
Patients and methods
Patients and CG
From September 2008 to September 2012, 74 patients
(males, 32; females, 42; mean age, 32±11 years) with
biopsy-diagnosed HD, who were included in a national study
evaluating the early treatment response to ABVD CHT (8), underwent a 18F-FDG PET/CT
brain scan in 3D mode (9) in
association with a whole body staging PET/CT study. According to
the Ann Arbor staging Criteria (10), 11, 35, 11 and 17 patients exhibited
stages I, II, III and IV HD, respectively.
In accordance with previous studies (11–13),
all patients underwent the initial PET/CT scan (PET0) within one
week of HD diagnosis. A second PET/CT scan (PET2) was performed in
all patients, 15±5 days after the first two ABVD cycles. Written
informed consent was obtained for a third brain PET/CT scan (PET6)
from 57 patients (females, 31; males, 26; mean age, 31±10 years),
which was performed 15±4 days after four additional one-month ABVD
cycles, for a total of six cycles.
Forty CHT-naïve subjects (males, 22; females, 18;
mean age, 36±7 years) undergoing a 18F-FDG PET/CT and
found to be completely negative for various diseases were enrolled
in the study and served as the CG (14).
Patients and CG subjects with a history of diabetes,
other carcinomas, human immunodeficiency virus, neurological,
psychiatric or mood disorders, surgery, radiation or trauma to the
brain were excluded from the present study. Furthermore, a number
of patients treated with agents that could interfere with
18F-FDG uptake and distribution in the brain were
excluded from the present study (16). No patients demonstrated liver or
renal damage, and no patients were pregnant or breastfeeding.
Informed consent was obtained from all of the patients, in
accordance with the Declaration of Helsinki, and the present study
was approved by the ethics committee of the Hospital of Tor Vergata
(Rome, Italy).
Treatment strategy
ABVD cycles were repeated every 28 days. A cycle of
treatment consisted of the following on day one: doxorubicin, 25
mg/m2; bleomycin, 10,000 units/m2;
vinblastine, 6 mg/m2; and dacarbazine, 375
mg/m2, which were administered intravenously (i.v.). The
dose intensity was 100%, regardless of patient blood count.
PET/CT scanning
The Discovery ST16 PET/CT system (GE Medical
Systems, Powell, TN, USA) was used to assess 18F-FDG
distribution in all patients in 3D mode in a 128×128 matrix.
Reconstruction was performed using the 3D reconstruction method of
ordered subsets expectation maximization with 21 subsets and four
iterations. The system combines a high-speed ultra 16-detector-row
(912 detectors/row) CT unit and a PET scanner with 10,080 bismuth
germanate crystals in 24 rings. The axial full width half maximum
(FWHM) was 1 cm (3D mode radius, 5.2 mm) and the axial
field-of-view was 157 mm. All patients and CG subjects fasted for a
minimum of 5 h prior to i.v. 18F-FDG injection to
produce a serum glucose level of ≤120 mg/ml. All of the subjects in
the present study were intravenously injected with 3 MBq/kg (range,
210–350 MBq) 18F-FDG and hydrated with 500 ml i.v.
saline NaCl 0.9%.
18F-FDG was administered to each patient
in a dedicated, dark room. All of the patients were required to
remain in a resting condition with closed eyes prior to the PET/CT
scan. Following a 45 min rest period, the brain PET/CT scan was
performed by placing the patient’s head in a support. A
low-amperage CT scan of the head was performed for attenuation
correction (40 mA; 120 Kv), prior to obtaining the PET image. The
duration of the brain PET image set acquisition was 15 min in all
of the patients. All brain PET scans were performed prior to the
whole body PET scan, consisting of a low-amperage CT scan for
attenuation correction of PET images (80 mA; 140 kV; field of view
~450±5 mm; CT slice thickness, 3.75 mm). The CT Dose Index for ldCT
was 4.0175 (±0.84) mGy and the dose-length product was 473.296
(±161.09) mGy-cm. After non-enhanced CT, total-body PET examination
in the caudocranial direction from the upper thighs to the vertex
was performed (every bed of the PET acquisition lasted 3.5 min).
Reconstruction was performed using the 3-dimensional reconstruction
method of ordered-subsets expectation maximization (OSEM) with 30
subsets and two iterations.
Statistical analysis
Differences in brain 18F-FDG uptake were
analyzed using statistical parametric mapping (SPM2; Wellcome
Department of Cognitive Neurology, London, UK) implemented in
MATLAB 6.5 (Mathworks, Inc., Natick, MA, USA). PET data were
subjected to linear (affine) and non-linear spatial normalization
into the Montreal Neurological Institute space. The spatially
normalized images were smoothed with a 12-mm isotropic Gaussian
filter to blur for individual variations in gyral anatomy and to
increase the signal-to-noise ratio. Images were globally normalized
to 50 ml/100 ml/min using proportional scaling to remove the
confounding effects of changes in the global cerebral glucose
consumption, with a masking threshold of 0.8. The resulting
statistical parametric maps, SPM{t}, were transformed into normal
distribution (SPM{z}) units. SPM coordinates were corrected to
match the Talairach coordinates, according to the method
implemented by Brett (http://imaging.mrc-cbu.cam.ac.uk/imaging/MniTalairach).
Subsequently, Brodmann areas (BAs) were identified at a range of 0
to 3 mm from the corrected Talairach coordinates of the SPM output
isocenters, using Talairach Client software (http://www.talairach.org/client.html). Consistent with
Bennett et al (15), the
threshold of the SPM{t} maps was P<0.05, corrected for multiple
comparisons using false discovery rate (FDR) at voxel level, and
P<0.01, corrected for multiple comparisons using FDR at cluster
level. Due to the explorative nature of the present study, when
statistically significant differences were not identified at such
conservative thresholds, a threshold of P<0.001 uncorrected at
voxel level was set. Only those clusters containing >125
contiguous voxels (i.e. >5×5×5 voxels or >11×11×11 mm) were
accepted as significant, due to the partial volume effect caused by
the poor spatial resolution of the PET camera (~2 × FWHM). The
voxel-based analyses were performed using a modality-adjusted
paired t-test (two conditions, one scan/condition) and the
following comparisons were assessed: i) PET0 vs. PET2 and vice
versa; ii) PET0 vs. PET6 and vice versa, CG vs. PET0, CG vs. PET2,
CG vs. PET6 and vice versa. Age and gender were used as nuisance
variables in all analyses and disease staging was added as nuisance
variable in the CG vs. PET2 comparison. Two-way analysis of
variance was used in demographic data analyses to assess
differences in gender and age. P≤0.05 was considered to indicate a
statistically significant difference and, thus, a valid
hypothesis.
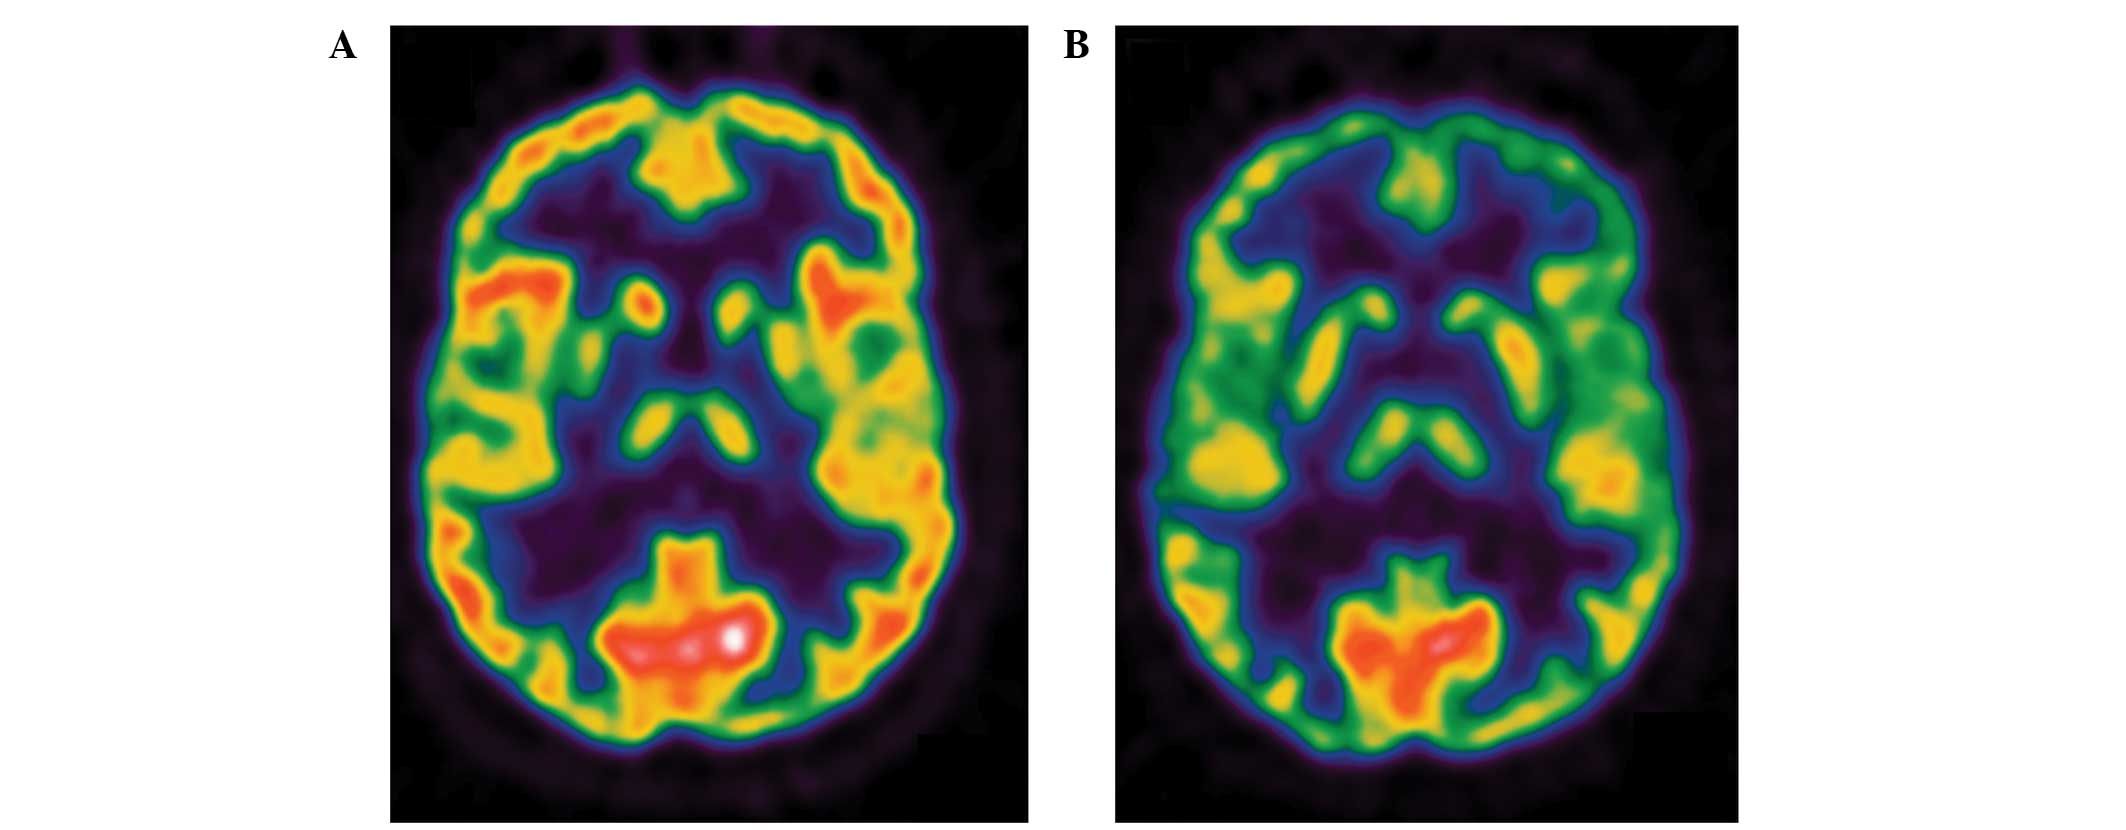
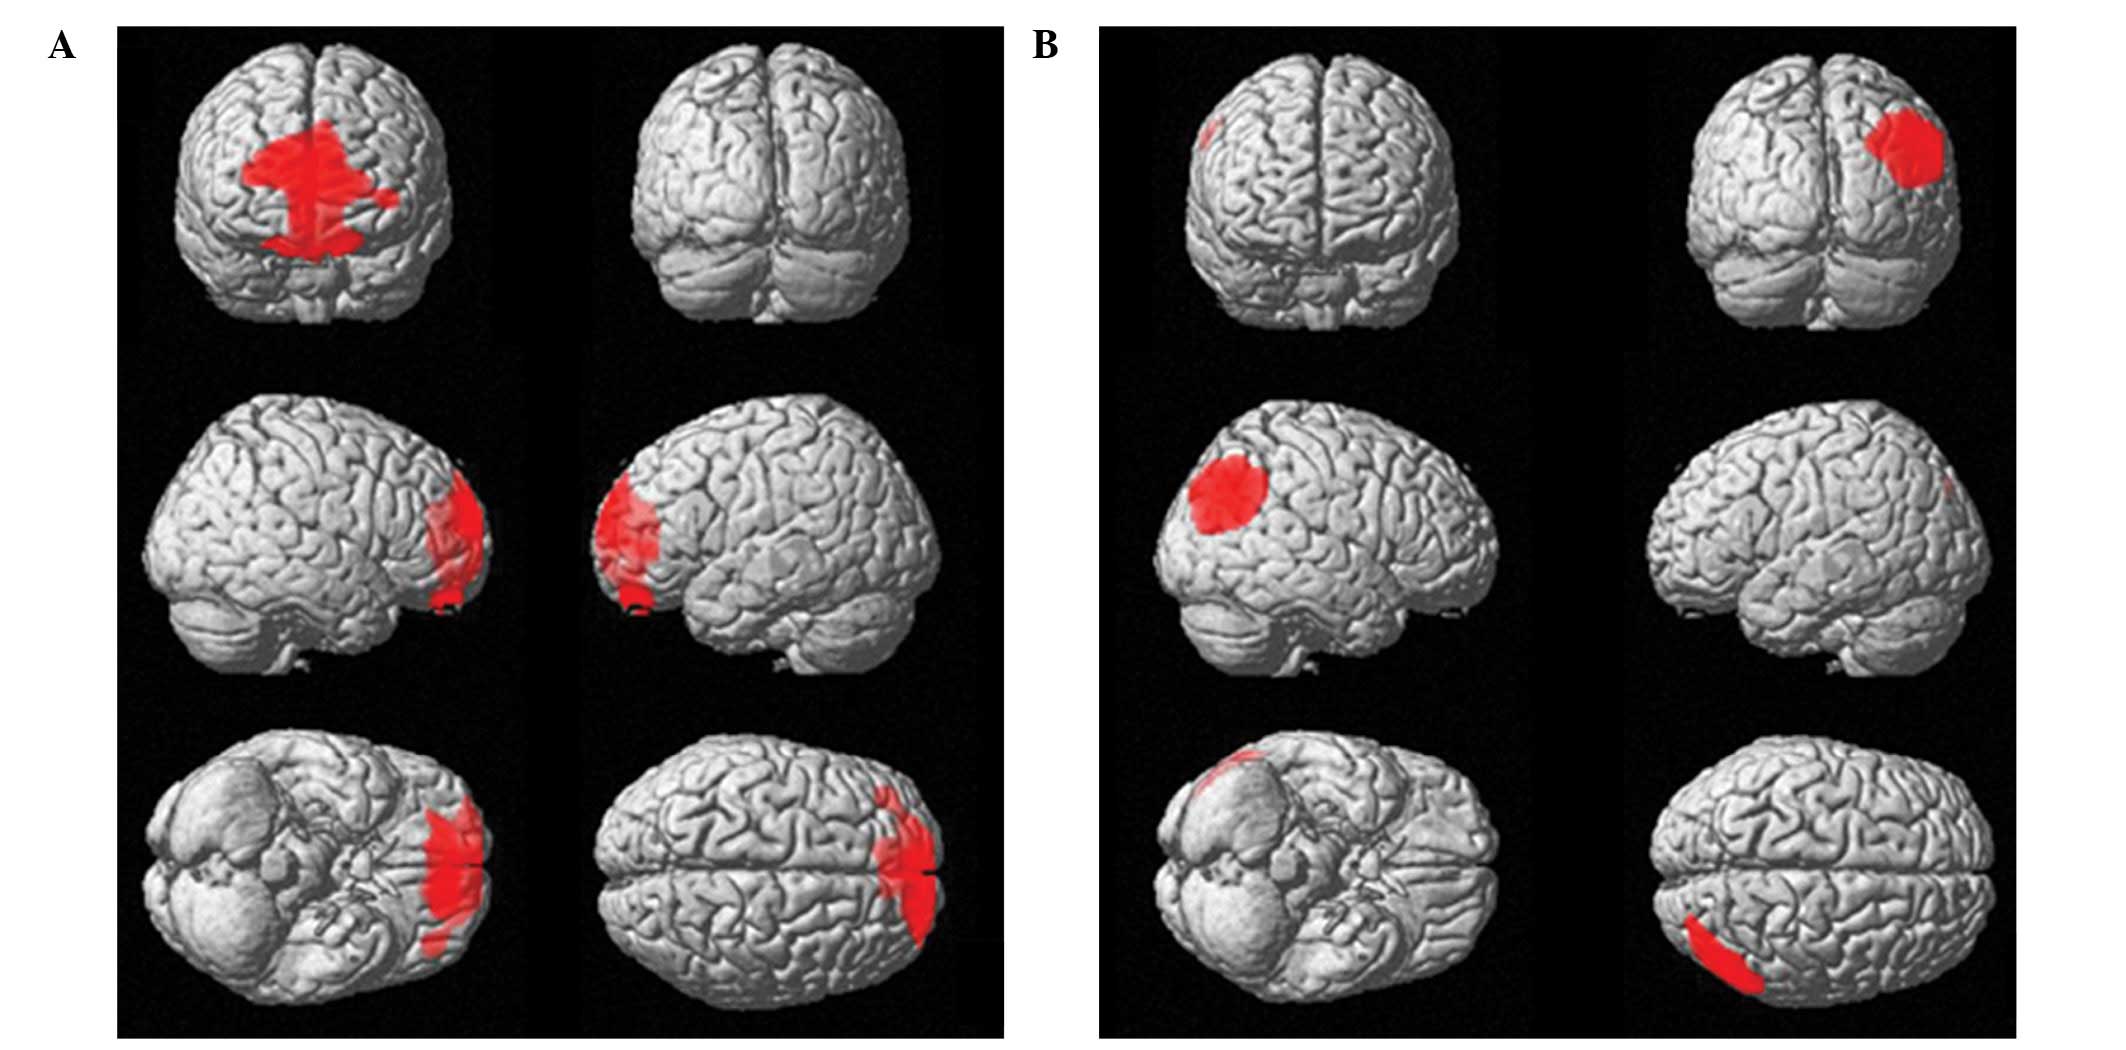
Results
No significant differences were identified in age
and gender between HD and CG subjects. However, when PET2 data were
subtracted from PET0 and CG data, a significant hypometabolic area
including a portion of the orbitofrontal cortex (OFC) bilaterally
(BA11) and left anterior cingulate cortex (ACC; BA32; Table I) was identified. When compared with
PET0 (Table II; Fig. 1) and CG (Fig. 2) scans, PET2 scans demonstrated a
significantly higher 18F-FDG uptake distribution in the
right angular gyrus (BA39; Table
I). No significant differences were identified when subtracting
PET6 from PET0 and CG scans and vice versa. Furthermore, the
18F-FDG uptake distribution changes identified at PET2
disappeared at PET6, and no significant changes were identified
between PET6 and PET2, PET0 or CG at any of the explored
statistical thresholds.
 | Table IStatistical parametric mapping
comparisons between 18F-FDG uptake in PET2 and CG. |
Table I
Statistical parametric mapping
comparisons between 18F-FDG uptake in PET2 and CG.
| Cluster level | Voxel level |
|---|
|
|
|
|---|
| Comparison | Cluster extent | Corrected
P-value | Cortical lobe | Talairach
coordinates | Maximum Z
score | Cortical
region | BA |
|---|
| CG-PET2 | 1729 | 0.036 | L limbic | −4, 43, 7 | 4.16 | Anterior cingulate
cortex | 32 |
| | | L frontal | −13, 48, 22 | 3.29 | Superior frontal
gyrus | 11 |
| PET2-CG | 546 | 0.048 | R parietal | 48, −71, 33 | 4.78 | Angular gyrus | 39 |
| Table IIStatistical parametric mapping
comparisons between 18F-FDG uptake in PET0 and PET2. |
Table II
Statistical parametric mapping
comparisons between 18F-FDG uptake in PET0 and PET2.
| Cluster level | Voxel level |
|---|
|
|
|
|---|
| Comparison | Cluster extent | Corrected
P-value | Cortical lobe | Talairach
coordinates | Maximum Z
score | Cortical
region | BA |
|---|
| PET0-PET2 | 1450 | 0.017a | L limbic | −4, 44, 6 | 4.21 | Anterior cingulate
cortex | 32 |
| | | R frontal | 4, 52, −12 | 3.64 | Medial frontal
gyrus | 11 |
| | | L frontal | −8, 48, −26 | 3.49 | Orbital gyrus | 11 |
| | | L frontal | −14, 48, −24 | 3.47 | Superior frontal
gyrus | 11 |
| PET2-PET0 | 844 | 0.042a | R parietal | 48, −72, 34 | 4.55 | Angular gyrus | 39 |
When using the stage of the disease as the nuisance
variable, no significant differences were identified in the
comparisons between PET0, PET2 or PET6 data and CG data.
Discussion
The predominant finding of the present study was a
significant hypometabolism in OFC bilaterally (BA11) and in the
left ACC (BA32), and an increased glucose consumption in the right
parietal cortex, in HD patients following the first two CHT cycles.
These changes disappeared at the termination of the therapy, six
months after diagnosis.
The present study confirms, in a larger series of
patients, the results of a previous report and, thus, reinforces
its reliability (5). Furthermore,
the present study compared the metabolic status of HD patients with
that of a CG, improving the design and the overall statistical
power of the study.
Possible CHT-induced damage in BAs 11 and 32 may be
important in the reduced brain glucose metabolism in these areas
following the first two cycles of CHT. Although chemotherapeutic
agents typically have restricted direct access to brain tissue due
to the blood-brain barrier, animal studies indicate that even
chemotherapeutic agents not known to readily cross the blood-brain
barrier (for example, doxorubicin used in the present study) are
associated with reduced neurogenesis (16,17).
In contrast to the previous study using significantly fewer
patients (5), the current study did
not demonstrate any differences between the PET6 and PET0
18F-FDG distributions. Furthermore, no significant
differences were detected between the CG scan and the brain PET
scan at the termination of therapy (PET6).
In the case of CHT-induced brain damage, a diffuse
cortical and sub-cortical reduction in brain glucose consumption at
PET2, followed by a further reduction after four more CHT cycles,
would be expected (18). The
present study demonstrated that the metabolic changes that occurred
during the disease course and the restoration of normal metabolism
in the ACC and PFC at the termination of therapy do not appear to
be associated with the total dose of CHT administered.
These findings, in particular those derived from the
comparison with CG subjects, are in disagreement with a previously
published study exploring functional changes in the brains of
CHT-treated patients (19), and
dispute claims that ABVD CHT may induce permanent brain damage
(19). A previous study evaluating
the impact of CHT in female breast cancer patients using magnetic
resonance imaging indicated that CHT may cause permanent disruption
in the networks of various brain regions (in particular in the
hippocampus), thus, directly affecting cerebral function in these
areas (20). These disruptions may
be associated with specific activation/deactivation patterns in
different areas of the cerebral cortical during tasks and at rest
(for example, the frontal cortex), as reported by Silverman et
al (21).
However, a recent study outlined that, during
neuropsychological testing, patients who were treated with CHT
performed worse than non-cancer control participants. However,
CHT-treated patients improved upon their own pre-CHT baseline and
performed better than patients treated without CHT, indicating that
the majority of long-term cognitive deficits associated with
CHT-treated breast cancer patients are generally small in magnitude
(22).
The lack of a permanent brain metabolic dysfunction
identified in the present study may be due to the different types
of CHT used and the different periods of examination during the
disease course (~5–10 years in the cited studies; in the acute
phase of CHT in the present case) (20,21).
ABVD is considered to be less toxic when compared with other CHT
schemes (3,4); however, further studies are required
to investigate a possible delayed effect of ABVD CHT on brain
function and metabolism.
Various changes in the structure and function of the
OFC and ACC have been described in different psychiatric
conditions. In particular, structural neuroimaging studies have
observed a reduction in the gray matter volume of ACC, and left and
right OFC among patients with major depressive disorders (23,24).
During traumatic exposure in patients exhibiting post-traumatic
stress disorder (PTSD), a significant decrease in cerebral blood
flow (CBF) has been identified in the ACC and OFC, and a
significant increase in CBF has been identified in right parietal
regions (25–28). The temporary reduced brain glucose
metabolism in the OFC and ACC, and the increased metabolism in the
right parietal cortex may be explained by the presence of an acute
anxiety status in the present patients. This hypothesis is
consistent with the development of depressive symptoms in cancer
patients caused by the stress of diagnosis with a life-threatening
disease (29). Additionally, cancer
diagnosis and treatment are accompanied by a number of acute and
chronic stressors that can impact the patient quality of life
(29).
In the present study, all patients examined by PET6
were disease-free for a minimum of 12 months and presented a
negative whole body PET scan after two ABVD cycles. Thus, treatment
with two cycles of ABVD is associated with a high disease-free
survival rate in HD patients (10–12).
It is possible that the good prognosis in the present series of
patients resulted in the disappearance of psychiatric symptoms
(time period, 6–12 months), as previously reported in patients
affected by cancer (30). However,
various functional imaging analyses of patients exhibiting mood
disorders identified an increased or a decreased CBF or metabolism
in BA 11 and 32, despite the majority of patients exhibiting
increased CBF or metabolism at rest (28,31).
The largest regional metabolic differences were
identified in the comparison of PET2 with PET0 and CG (Tables I and II). At this point of the disease course
(15±5 days after the first two ABVD cycles), a high level of
anxiety would be expected, due to: (i) The recent diagnosis (within
two months) and (ii) the uncertainty of the therapeutic outcome
(12,13). This acute anxiety may impact brain
metabolism and blood flow. Although the patient may remain in a
state of anxiety associated with the possibility of disease
recurrence prior to PET6 examination (13), no significant differences in brain
metabolism were identified when comparing PET6 with PET0 and CG
scans. This supports the hypothesis of an acute and transient
psychiatric condition that affects patients early during the
disease course.
The severity of the disease appears to be associated
with metabolic changes observed in the brains of HD patients. When
the disease stage was used as a nuisance variable in the comparison
of PET2 and CG scans, no significant difference was identified,
possibly due to the patient’s perception of a more advanced disease
stage as a worse prognostic factor. This is supported by a study
performed on a large cohort of patients exhibiting different types
of cancer; the presence of metastases was associated with an
increased number of anxiety symptoms and early disease stage was
associated with fewer depressive symptoms (7,32).
However, it has been demonstrated that the distribution of
18F-FDG uptake in healthy tissues is associated with
disease progression in HD (33).
Furthermore, various studies have demonstrated that the tumor or
treatment-induced inflammation can promote the production of
peripheral proinflammatory cytokines. Proinflammatory cytokines
activate central nervous system pathways that may induce behavioral
and affective symptoms, such as a depressed mood, fatigue,
anorexia, impaired concentration, sleep disturbance, enhanced pain
sensitivity and reduced activity (29,34–36).
Therefore, subsequent studies should include longitudinal
neuropsychological, psychiatric and laboratory assessments.
In contrast to previous reports (5), the present study demonstrated no
significant metabolic changes in BA 10 (prefrontal cortex) in HD
patients receiving ABVD CHT. This discrepancy may explained by the
larger number of patients examined in the present study,
introducing a higher inter-individual variability and, thus, no
significant differences. The previous (5) and present cluster of voxels resulting
from the group comparisons were almost superimposable and the
reported results predominantly differ in the coordinates of the
isocenters determined by SPM. However, in respect to its functional
role in major depression and/or PTSD, the prefrontal cortex and
orbito-frontal cortex voxel clusters superimpose well (28). Furthermore, stress symptoms in
cancer patients have been previously described (30,37,38),
and several studies describe diagnosis-associated psychological
trauma in cancer patients and survivors, for example acute and
chronic PTSD (39,40).
As the design of the present study did not consider
the co-occurrence of HD and other psychiatric disorders, the
possible occurrence of an acute and transient anxiety status is
only speculative. The present study achieved its aim of evaluating
alterations in brain metabolism in HD patients during various
stages of ABVD CHT treatment and compared with a CG; however, the
impact of the psychological status of the patient was only
considered post hoc. Thus, the lack of a neuropsychological or
psychiatric evaluation following disease diagnosis and during
treatment is an evident limitation of the present study.
Another possible limitation of the present study is
the use of a CG of subjects with a negative brain PET scan, as
opposed to a group of healthy volunteers. However, it is important
to note that the CG was specifically set up for the present study,
and identical protocol and scanners were used for patients and
controls. This is important in neuroimaging studies where the
number of potential confounding variables must be minimized. The
use of a CG comprising of a sample of individuals with a negative
PET is common, due to the high costs associated with obtaining a
cohort of volunteers. Furthermore, the stringent exclusion criteria
were the same as those applied in previous investigations (41,42).
In addition, using a CG comprised of neurologically healthy
subjects undergoing PET scans for other reasons prevents healthy
individuals being exposed to radiations and makes the protocol
feasible for the majority of PET centers, as it reduces the costs
and efforts required to build up CGs comprised of healthy subjects
(43).
In conclusion, brain metabolic changes in a large
cohort of HD patients during the initial phases of CHT are
transient and may be due to an acute anxiety state following
disease diagnosis and treatment outcome uncertainty. Further
studies integrating this data with neuropsychological, psychiatric
and laboratory assessments are necessary to confirm the hypotheses
of the present study.
References
|
1
|
National Cancer Institute. Cancer
statistics: SEER stat fact sheets. Hodgkin lymphoma. http://seer.cancer.gov/statfacts/html/hodg.html.
Accessed October, 2013
|
|
2
|
Bonadonna G, Zucali R, Monfardini S, et
al: Combination chemotherapy of Hodgkin’s disease with adriamycin,
bleomycin, vinblastine and imidazole carboxamide versus MOPP.
Cancer. 36:252–259. 1975. View Article : Google Scholar : PubMed/NCBI
|
|
3
|
Canellos GP and Niedzwiecki D: Long-term
follow-up of Hodgkin’s disease trial. N Engl J Med. 346:1417–1418.
2002. View Article : Google Scholar : PubMed/NCBI
|
|
4
|
Borchmann P and Engert A: The past: what
we have learned in the last decade. Hematology Am Soc Hematol Educ
Program. 2010:101–107. 2010. View Article : Google Scholar
|
|
5
|
Chiaravalloti A, Pagani M, Di Pietro B, et
al: Is cerebral glucose metabolism affected by chemotherapy in
patients with Hodgkin’s lymphoma? Nucl Med Commun. 34:57–63. 2012.
View Article : Google Scholar
|
|
6
|
Pasquini M and Biondi M: Depression in
cancer patients: a critical review. Clin Pract Epidemiol Ment
Health. 3:22007. View Article : Google Scholar : PubMed/NCBI
|
|
7
|
Spiegel D: Health care. Psychosocial
support for patients with cancer. Cancer. 74(Suppl 4): 1453–1457.
1994. View Article : Google Scholar : PubMed/NCBI
|
|
8
|
Ospedale Santa Croce-Carle Cuneo. Positron
Emission Tomography (PET) - Adapted Chemotherapy In Advanced
Hodgkin Lymphoma (HL) (HD0607). NLM identifier: NCT00795613.
http://clinicaltrials.gov/show/NCT00795613.
Accessed October 2010
|
|
9
|
Varrone A, Asenbaum S, Vander Borght T, et
al; European Association of Nuclear Medicine Neuroimaging
Committee. EANM procedure guidelines for PET brain imaging using
[18F]FDG, version 2. Eur J Nucl Med Mol Imaging. 36:2103–2110.
2009. View Article : Google Scholar : PubMed/NCBI
|
|
10
|
Lister TA, Crowther D, Sutcliffe SB, et
al: Report of a committee convened to discuss the evaluation and
staging of patients with Hodgkin’s disease: Cotswolds meeting. J
Clin Oncol. 7:1630–1636. 1989.PubMed/NCBI
|
|
11
|
Gallamini A, Fiore F, Sorasio R and
Meignan M: Interim positron emission tomography scan in Hodgkin
lymphoma: definitions, interpretation rules, and clinical
validation. Leuk Lymphoma. 50:1761–1764. 2009. View Article : Google Scholar : PubMed/NCBI
|
|
12
|
Gallamini A, Hutchings M, Rigacci L, et
al: Early interim 2-[18F]fluoro-2-deoxy-D-glucose
positron emission tomography is prognostically superior to
international prognostic score in advanced-stage Hodgkin’s
lymphoma: a report from a joint Italian-Danish study. J Clin Oncol.
25:3746–3752. 2007. View Article : Google Scholar : PubMed/NCBI
|
|
13
|
Gallamini A, Rigacci L, Merli F, et al:
The predictive value of positron emission tomography scanning
performed after two courses of standard therapy on treatment
outcome in advanced stage Hodgkin’s disease. Haematologica.
91:475–481. 2006.PubMed/NCBI
|
|
14
|
Cistaro A, Valentini MC, Chiò A, et al:
Brain hypermetabolism in amyotrophic lateral sclerosis: a FDG PET
study in ALS of spinal and bulbar onset. Eur J Nuc Med Mol Imaging.
39:251–259. 2011. View Article : Google Scholar
|
|
15
|
Bennett CM, Wolford GL and Miller MB: The
principled control of false 483 positives in neuroimaging. Soc Cogn
Affect Neurosci. 4:417–422. 2009. View Article : Google Scholar
|
|
16
|
Janelsins MC, Roscoe JA, Berg MJ, et al:
IGF-1 partially restores chemotherapy-induced reductions in neural
cell proliferation in adult C57BL/6 mice. Cancer Invest.
28:544–553. 2010. View Article : Google Scholar
|
|
17
|
Lopes MA, Meisel A, Dirnagl U, et al:
Doxorubicin induces biphasic neurotoxicity to rat cortical neurons.
Neurotoxicology. 29:286–293. 2008. View Article : Google Scholar : PubMed/NCBI
|
|
18
|
Attwell D and Laughlin SB: An energy
budget for signaling in the grey matter of the brain. J Cereb Blood
Flow Metab. 21:1133–1145. 2001. View Article : Google Scholar : PubMed/NCBI
|
|
19
|
Zimmer P, Mierau A, Bloch W, et al:
Post-chemotherapy cognitive impairment in patients with B-cell
non-Hodgkin lymphoma: a first comprehensive approach to determine
cognitive impairments after treatment with rituximab,
cyclophosphamide, doxorubicin, vincristine and prednisone or
rituximab and bendamustine. Leuk Lymphoma. 1–6. 2014. View Article : Google Scholar
|
|
20
|
Bruno J, Hosseini SM and Kesler S: Altered
resting state functional brain network topology in
chemotherapy-treated breast cancer survivors. Neurobiol Dis.
48:329–338. 2012. View Article : Google Scholar : PubMed/NCBI
|
|
21
|
Silverman DH, Dy CJ, Castellon SA, et al:
Altered frontocortical, cerebellar, and basal ganglia activity in
adjuvant-treated breast cancer survivors 5–10 years after
chemotherapy. Breast Cancer Res Treat. 103:303–311. 2007.
View Article : Google Scholar
|
|
22
|
Barton MK: Cognitive deficits are usually
mild in patients with breast cancer after chemotherapy. CA Cancer J
Clin. 63:3–4. 2013. View Article : Google Scholar
|
|
23
|
Hakamata Y, Matsuoka Y, Inagaki M, et al:
Structure of orbitofrontal cortex and its longitudinal course in
cancer-related post-traumatic stress disorder. Neurosci Res.
59:383–389. 2007. View Article : Google Scholar : PubMed/NCBI
|
|
24
|
Niida A, Niida R, Matsuda H, Inada T,
Motomura M and Uechi A: Identification of atrophy of the subgenual
anterior cingulate cortex, in particular the subcallosal area, as
an effective auxiliary means of diagnosis for major depressive
disorder. Int J Gen Med. 5:667–674. 2012. View Article : Google Scholar : PubMed/NCBI
|
|
25
|
Bonne O, Gilboa A, Louzoun Y, et al:
Resting regional cerebral perfusion in recent posttraumatic stress
disorder. Biol Psychiatry. 54:1077–1086. 2003. View Article : Google Scholar : PubMed/NCBI
|
|
26
|
Sachinvala N, Kling A, Suffin S, et al:
Increased regional cerebral perfusion by 99mTc hexamethyl propylene
amine oxime single photon emission computed tomography in
post-traumatic stress disorder. Mil Med. 165:473–479.
2000.PubMed/NCBI
|
|
27
|
Pagani M, Högberg G, Salmaso D, et al:
Regional cerebral blood flow during auditory recall in 47 subjects
exposed to assaultive and non-assaultve trauma and developing or
not posttraumatic stress disorder. Eur Arch Psychiatry Clin
Neurosci. 255:359–365. 2005. View Article : Google Scholar : PubMed/NCBI
|
|
28
|
Francati V, Vermetten E and Bremner JD:
Functional neuroimaging studies in posttraumatic stress disorder:
review of current methods and findings. Depress Anxiety.
24:202–218. 2007. View
Article : Google Scholar
|
|
29
|
Costanzo ES, Sood AK and Lutgendorf SK:
Biobehavioral influences on cancer progression. Immunol Allery Clin
North Am. 31:109–132. 2011. View Article : Google Scholar
|
|
30
|
Mehnert A and Koch U: Prevalence of acute
and post-traumatic stress disorder and comorbid mental disorders in
breast cancer patients during primary cancer care: a prospective
study. Psychooncology. 16:181–188. 2007. View Article : Google Scholar
|
|
31
|
Savitz J and Drevets WC: Bipolar and major
depressive disorder: neuroimaging the developmental-degenerative
divide. Neurosci Biobehav Rev. 33:699–771. 2009. View Article : Google Scholar : PubMed/NCBI
|
|
32
|
Vodemaier A, Linden W, MacKenzie R, Greig
D and Marshall C: Disease stage predicts post-diagnosis anxiety and
depression only in some types of cancer. Br J Cancer.
105:1814–1817. 2011. View Article : Google Scholar
|
|
33
|
Chiaravalloti A, Danieli R, Abbatiello P,
et al: Factors affecting intrapatient liver and mediastinal blood
pool 18F-FDG standardized uptake value changes during
ABVD chemotherapy in Hodgkin’s lymphoma. Eur J Nucl Med Mol
Imaging. 41:1123–1132. 2014.PubMed/NCBI
|
|
34
|
Wenrib AZ, Sephton SE, Degeest K, et al:
Diurnal cortisol dysregulation, functional disability, and
depression in women with ovarian cancer. Cancer. 116:4410–4419.
2010. View Article : Google Scholar
|
|
35
|
Rich T, Innominato PF, Boerner J, et al:
Elevated serum cytokines correlated with altered behavior, serum
cortisol rhythm and dampene 24-hour rest-activity patterns in
patients with metastatic colorectal cancer. Clin Cancer Res.
11:1757–1764. 2005. View Article : Google Scholar : PubMed/NCBI
|
|
36
|
Lutgendorf SK, Weinrib AZ, Penedo F, et
al: Interleukin-6, cortisol and depressive symptoms on ovarian
cancer patients. J Clin Oncol. 26:4820–4827. 2008. View Article : Google Scholar : PubMed/NCBI
|
|
37
|
Andersen BL, Kiecolt-Glaser JK and Glaser
R: A biobehavioral model of cancer stress and disease course. Am
Psychol. 49:389–404. 1994. View Article : Google Scholar : PubMed/NCBI
|
|
38
|
Butler LD, Koopman C, Classen C and
Spiegel D: Traumatic stress, life events, and emotional support in
women with metastatic breast cancer: cancer-related traumatic
stress symptoms associated with past and current stressors. Health
Psychol. 18:555–560. 1999. View Article : Google Scholar
|
|
39
|
Cordova MJ, Studts JL, Hann DM, Jacobsen
PB and Andrykowski MA: Symptom structure of PTSD following breast
cancer. J Trauma Stress. 13:301–319. 2000. View Article : Google Scholar : PubMed/NCBI
|
|
40
|
DuHamel KN, Ostrof J, Ashman T, et al:
Construct validity of the posttraumatic stress disorder checklist
in cancer survivors: analyses based on two samples. Psychol Assess.
16:255–266. 2004. View Article : Google Scholar : PubMed/NCBI
|
|
41
|
Pagani M, Dessi B, Morbelli S, et al: MCI
patients declining and not-declining at mid-term follow-up: FDG-PET
findings. Curr Alzheimer Res. 7:287–294. 2010. View Article : Google Scholar
|
|
42
|
Nobili F, Mazzei D, Dessi B, et al:
Unawareness of memory deficit in amnestic MCI: FDG-PET findings. J
Alzheimers Dis. 22:993–1003. 2012.
|
|
43
|
Del Sole A, Clerici F, Chiti A, et al:
Individual cerebral metabolic deficits in Alzheimer’s disease and
amnestic mild cognitive impairment: an FDG PET study. Eur J Nucl
Med Mol Imaging. 35:1357–1366. 2008. View Article : Google Scholar : PubMed/NCBI
|