Introduction
Epithelial tissue is fundamental to the physiology
of organisms. Maintenance of its complex architecture and function
requires strict spatial and temporal coordination of various
processes (1). Loss of control over
the cell cycle, migration and adhesion results in the deregulation
of normal tissue function, and may lead to the development of
epithelium-related diseases, including cancer (2). Adhesion molecules are therefore of
significance in the study of tumor progression, particularly due to
their contribution to signal transduction and cell communication,
in addition to adhesion (2–6).
Epithelial tissues achieve their highly organized
structure through cell-cell junction complexes. Four main types of
cell-cell junctions have been identified, which form areas of
contact between cells: Adherens junctions, desmosomes, tight
junctions and gap junctions (2,5).
Adherens junctions and desmosomes are anchoring-type
junctions, which hold cells together allowing them to form certain
complex structures. The junctions are formed predominantly by
interactions between the extracellular domains of transmembrane
cadherin proteins, which are also anchored to the cytoskeleton
(3). Tight junctions (or occluding
junctions) function as selective barriers for ions and molecules,
controlling their passage through adjacent cells. Tight junctions
are critical for maintaining cell polarity, and are localized near
the apical membrane of the cell (4,6). These
junctions are maintained primarily by transmembrane proteins
including occludin and a variety of claudins (4,6). Gap
junctions are channels made of connexins, which allow cells to
communicate via the direct flow of inorganic ions and small
water-soluble molecules between the cytoplasm of neighboring cells
(5).
Colorectal adenocarcinoma (AC) is among the most
common malignancies worldwide, accounting for the diagnosis of
>1.2 million cases and >600,000 mortalities, annually
(7). According to the generally
accepted model, it develops from the mucosa of colonic crypts
through the stage of benign adenoma (AD). The neoplastic
progression from colonic mucosa to invasive tumor is accompanied by
distinct molecular alterations and changes in morphological tissue
characteristics, known as the ‘adenoma-carcinoma sequence’
(1). This involves conformational
changes, loss or disruption of cell adhesion and increased cell
mobility. These changes appear in the early stages of benign
adenomas, and progress concurrently with the invasive potential of
tumors. They are also features of the epithelial-mesenchymal
transition phenomenon, which is crucial for the development of
invasive phenotypes. Dissociation of cell-cell junctions is an
important element of these processes (3,8).
Genes encoding proteins involved in intercellular
adhesion are differentially expressed between normal colonic mucosa
and neoplastic epithelia of adenoma and cancer. In the present
study, quantitative reverse transcription polymerase chain reaction
(qPCR) was used to assess the expression levels of 20 genes
encoding cell-cell adhesion-related proteins with the greatest
difference in expression levels between normal and tumor tissue.
Candidate genes were selected based on the results of previous
microarray transcriptome profiling of normal and neoplastic
colorectal tissues (9).
Material and methods
Patients
Fresh frozen tumor tissue samples were obtained from
26 cancer patients, with 15 samples of corresponding normal colonic
(NC) mucosa sections, and 42 colorectal adenoma samples. Clinical
tissue sample sections were collected at the Maria Sklodowska-Curie
Memorial Cancer Center and Institute of Oncology (Warsaw, Poland)
upon the agreement of the ethics committee of the Maria
Sklodowska-Curie Memorial Cancer Center and Institute of Oncology
and written informed consent was obtained from each patient.
AC tissue and adjacent normal colon tissue were
obtained following surgical resection through laparotomy. NC
sections were collected from a distance of >5 cm from the tumor
tissue. Colonic AD samples were obtained during colonoscopic
polypectomy. Samples of normal mucosa from nine healthy individuals
were also collected during colonoscopy. Tissue samples were snap
frozen in liquid nitrogen and stored at −80°C. Cryostat sections
were prepared for each specimen using a Microm HM 505E (Zeiss,
Oberkochen, Germany) and upper and lower sections from each
cryosection collection were evaluated by a pathologist to control
the relative cell type content. Patient characteristics are shown
in Table I.
 | Table I.Patient characteristics and sample
description. |
Table I.
Patient characteristics and sample
description.
| A, Cancer
patients | n |
|---|
| Patients, n | 26 |
| Gender, n |
|
|
Male | 11 |
|
Female | 15 |
| Age, years |
|
|
Range | 38–81 |
|
Median | 64 |
| Astler-Coller
stage, n |
|
| B1 | 4 |
| B2 | 15 |
| C2 | 7 |
| Tumor location,
n |
|
|
Caecum | 4 |
|
Ascending | 7 |
|
Transverse | 1 |
|
Descending | 2 |
|
Sigmoid | 6 |
|
Rectum | 6 |
| Carcinoma content,
% |
|
|
Range | 51–98 |
|
Median | 75.5 |
|
| B, Adenoma
patients |
|
|
| Patients, n | 42 |
| Gender, n |
|
Male | 25 |
|
Female | 17 |
| Age, years |
|
|
Range | 41–83 |
|
Median | 60 |
| Adenoma size,
mm |
|
|
Range | 9–50 |
|
Median | 15 |
| Histopathology,
n |
|
| Tubular
adenoma | 29 |
|
Tubulovillous adenoma | 13 |
| Polyp location,
n |
|
|
Caecum | 3 |
|
Ascending | 1 |
|
Transverse | 6 |
|
Descending | 2 |
|
Sigmoid | 25 |
|
Rectum | 5 |
| Adenoma content,
% |
|
|
Range | 50–99 |
|
Median | 90 |
|
| C, Normal mucosa
samples |
|
|
| Samples, n |
|
Total | 24 |
| From
cancer patients | 15 |
| From
healthy individuals | 9 |
Assessment of gene expression
levels
A total of 20 genes encoding molecules involved
directly in cell-cell adhesion were selected, based on annotation
in the Gene Ontology (GO) database and a literature search of the
PubMed database. Genes that exhibited a fold change (FC) in
expression of >2.5 between normal and tumor tissue, and reached
a significance threshold (adjusted P-value <0.05), based on
previous microarray analyses, were included (9).
Total RNA from tissue samples was isolated with the
use of RNeasy Mini (Qiagen, Hilden, Germany). From each tissue
sample, 1 µg of RNA was subjected to reverse transcription with
SuperScript II Reverse Transcriptase (Invitrogen Life Technologies,
Carlsbad, CA, USA). qPCR was conducted in 384 well plates using an
Applied Biosystems 7900HT Fast Real-Time PCR System (Applied
Biosystems Life Technologies, Foster City, CA, USA) with Sensimix
SYBR kit (Bioline Reagents Ltd., London, UK), according to
manufacturer's recommendations, in a volume of 5 µl.
ACTB (β-actin) was selected for use as a
reference gene following the evaluation of four potential reference
genes [ACTB, UBC (Ubiquitin C), RPLP0 (60S acidic
ribosomal protein P0) and GAPDH (Glyceraldehyde 3-phosphate
dehydrogenase)] with GeNorm software (http://medgen.ugent.be/~jvdesomp/genorm/).
All primer sequences are listed in Table II. The standard curves based on the
amplification of a known concentration of cDNA template were used
for the quantification of PCR products in the samples.
| Table II.Primer sequences used in quantitative
real-time polymerase chain reaction. |
Table II.
Primer sequences used in quantitative
real-time polymerase chain reaction.
| Gene symbol | Forward primer,
5′-3′ | Reverse primer,
5′-3′ |
|---|
| CDH3 |
CAGTGCTAAACAGAGCTGGC |
AGGCTGAAGTGACCTTGGAG |
| CDH11 |
CAGCAGAAATCCACAATCGG |
CTTCATAAGGGGCAGCAAAC |
| CDH19 |
TGATTCCCTCCAGACCTACG |
AGCGAGGTCCCAACTCATTA |
| PTPRF |
CTTCTCCACCACCTTCAGC |
GCCTGGGTGAGATCAACACT |
| DSC2 |
CTGACCCTCGCGATCTTA |
TTGCAGCTGTAAAGCACTCT |
| DSC3 |
GACCCTCGTGATCTTCAGTC |
ACCTGAAGCACTCTTCCAAA |
| DSG3 |
CCATCTTCGTGGTGGTCATA |
CCCATTCACGTTTTTGCCTT |
| CLDN1 |
CTTCTTGCAGGTCTGGCTAT |
AGAGCCTGACCAAATTCGTA |
| CLDN2 |
GGTTGAATTGCCAAGGATGC |
TGAGTCCTGGCTTAAGGGAA |
| CLDN5 |
CCTTCCTGGACCACAACATC |
CGAGTCGTACACTTTGCACT |
| CLDN8 |
CCATGCCTTAGAAATCGCTG |
TGTTTTCAATGAAGGCCGAC |
| CLDN15 |
CCATCTTCGAGAACCTCTGG |
CCTGAATATACCCAGAGAGGG |
| CLDN23 |
ACAGGACTCCTTGGACGATT |
TATGAAAAGCCCGTCACTCC |
| JAM2 |
GTCGCCCTGGGCTATCATAA |
CTTTGGGGTTTTGCAGGCTA |
| CGN |
CACCATGCTGCAGTTCAAAT |
TCCCTCAGGATGCCATAGAT |
| MUPCDH |
CTTCTACGCAGAGGTTGAGG |
GGGCTCCTGTTCGGAAAC |
| PCDH7 |
GACACGGGGACCATTTACTC |
AAAGCGAGACTGTAGCTGTG |
| PCDHB14 |
CCAATACGAGGTGTGTCTGA |
TCCCCCATATTCCTACCAGT |
| PCDHB16 |
ATGGATGCACAATCGGAGAC |
CTCCGTTTCTTCCACTACGG |
| NEO1 |
TACAGAGGGCATGAGTCAGA |
GGGGGTATTTCGAACGGATT |
| ACTB |
AGAGCTACGAGCTGCCTGAC |
AAGGTAGTTTCGTGGATGCC |
Statistical analysis
The values of expression levels were compared using
a two-sided Mann-Whitney U test, and a two-sided Fisher's exact
test was used for the analysis of proportion. P<0.05 was
considered to indicate a statistically significant difference. Data
were analyzed and visualized using GraphPadPrism (La Jolla, CA,
USA). A hierarchical clustering analysis was conducted using
Cluster 3.0, and the results were visualized using TreeView 1.6
software (Stanford University School of Medicine, Stanford, CA,
USA).
Results
The expression levels of 20 genes encoding proteins
involved in cell-cell adhesion were evaluated using qPCR. The genes
were selected based on previous microarray transcriptome profiling
of colorectal cancer, adenoma and normal tissues, and fulfilled two
criteria: They encode molecules directly involved in intercellular
junctions, and exhibited a FC of >2.5 between cancer and normal,
or adenoma and normal tissue. These criteria resulted in the
selection of genes encoding components of adherens junctions
[CDH3 (cadherin 3), CDH11 (cadherin 11), CDH19
(cadherin 19) and PTPRF (protein tyrosine phosphatase,
receptor type F)], tight junctions [CLDN1 (claudin 1),
CLDN2 (claudin 2), CLDN5 (claudin 5), CLDN8
(claudin 8), CLDN15 (claudin 15), CLDN23 (claudin
23), CGN (cingulin) and JAM2 (junctional adhesion
molecule 2)] and desmosomes [DSC2 (desmocollin 2),
DSC3 (desmocollin 3) and DSG3 (desmoglein 3)], in
addition to certain other surface molecules: PCDH7
(protocadherin 7), MUPCDH (mucin like protocadherin),
PCDHB14 (protocadherin beta 14), PCDHB16
(protocadherin beta 16) and NEO1 (neogenin). Although other
adhesion-related genes, including those encoding for gap junction
proteins, have been demonstrated by microarray studies to differ in
expression levels between tissue types, they did not meet the FC
criterion.
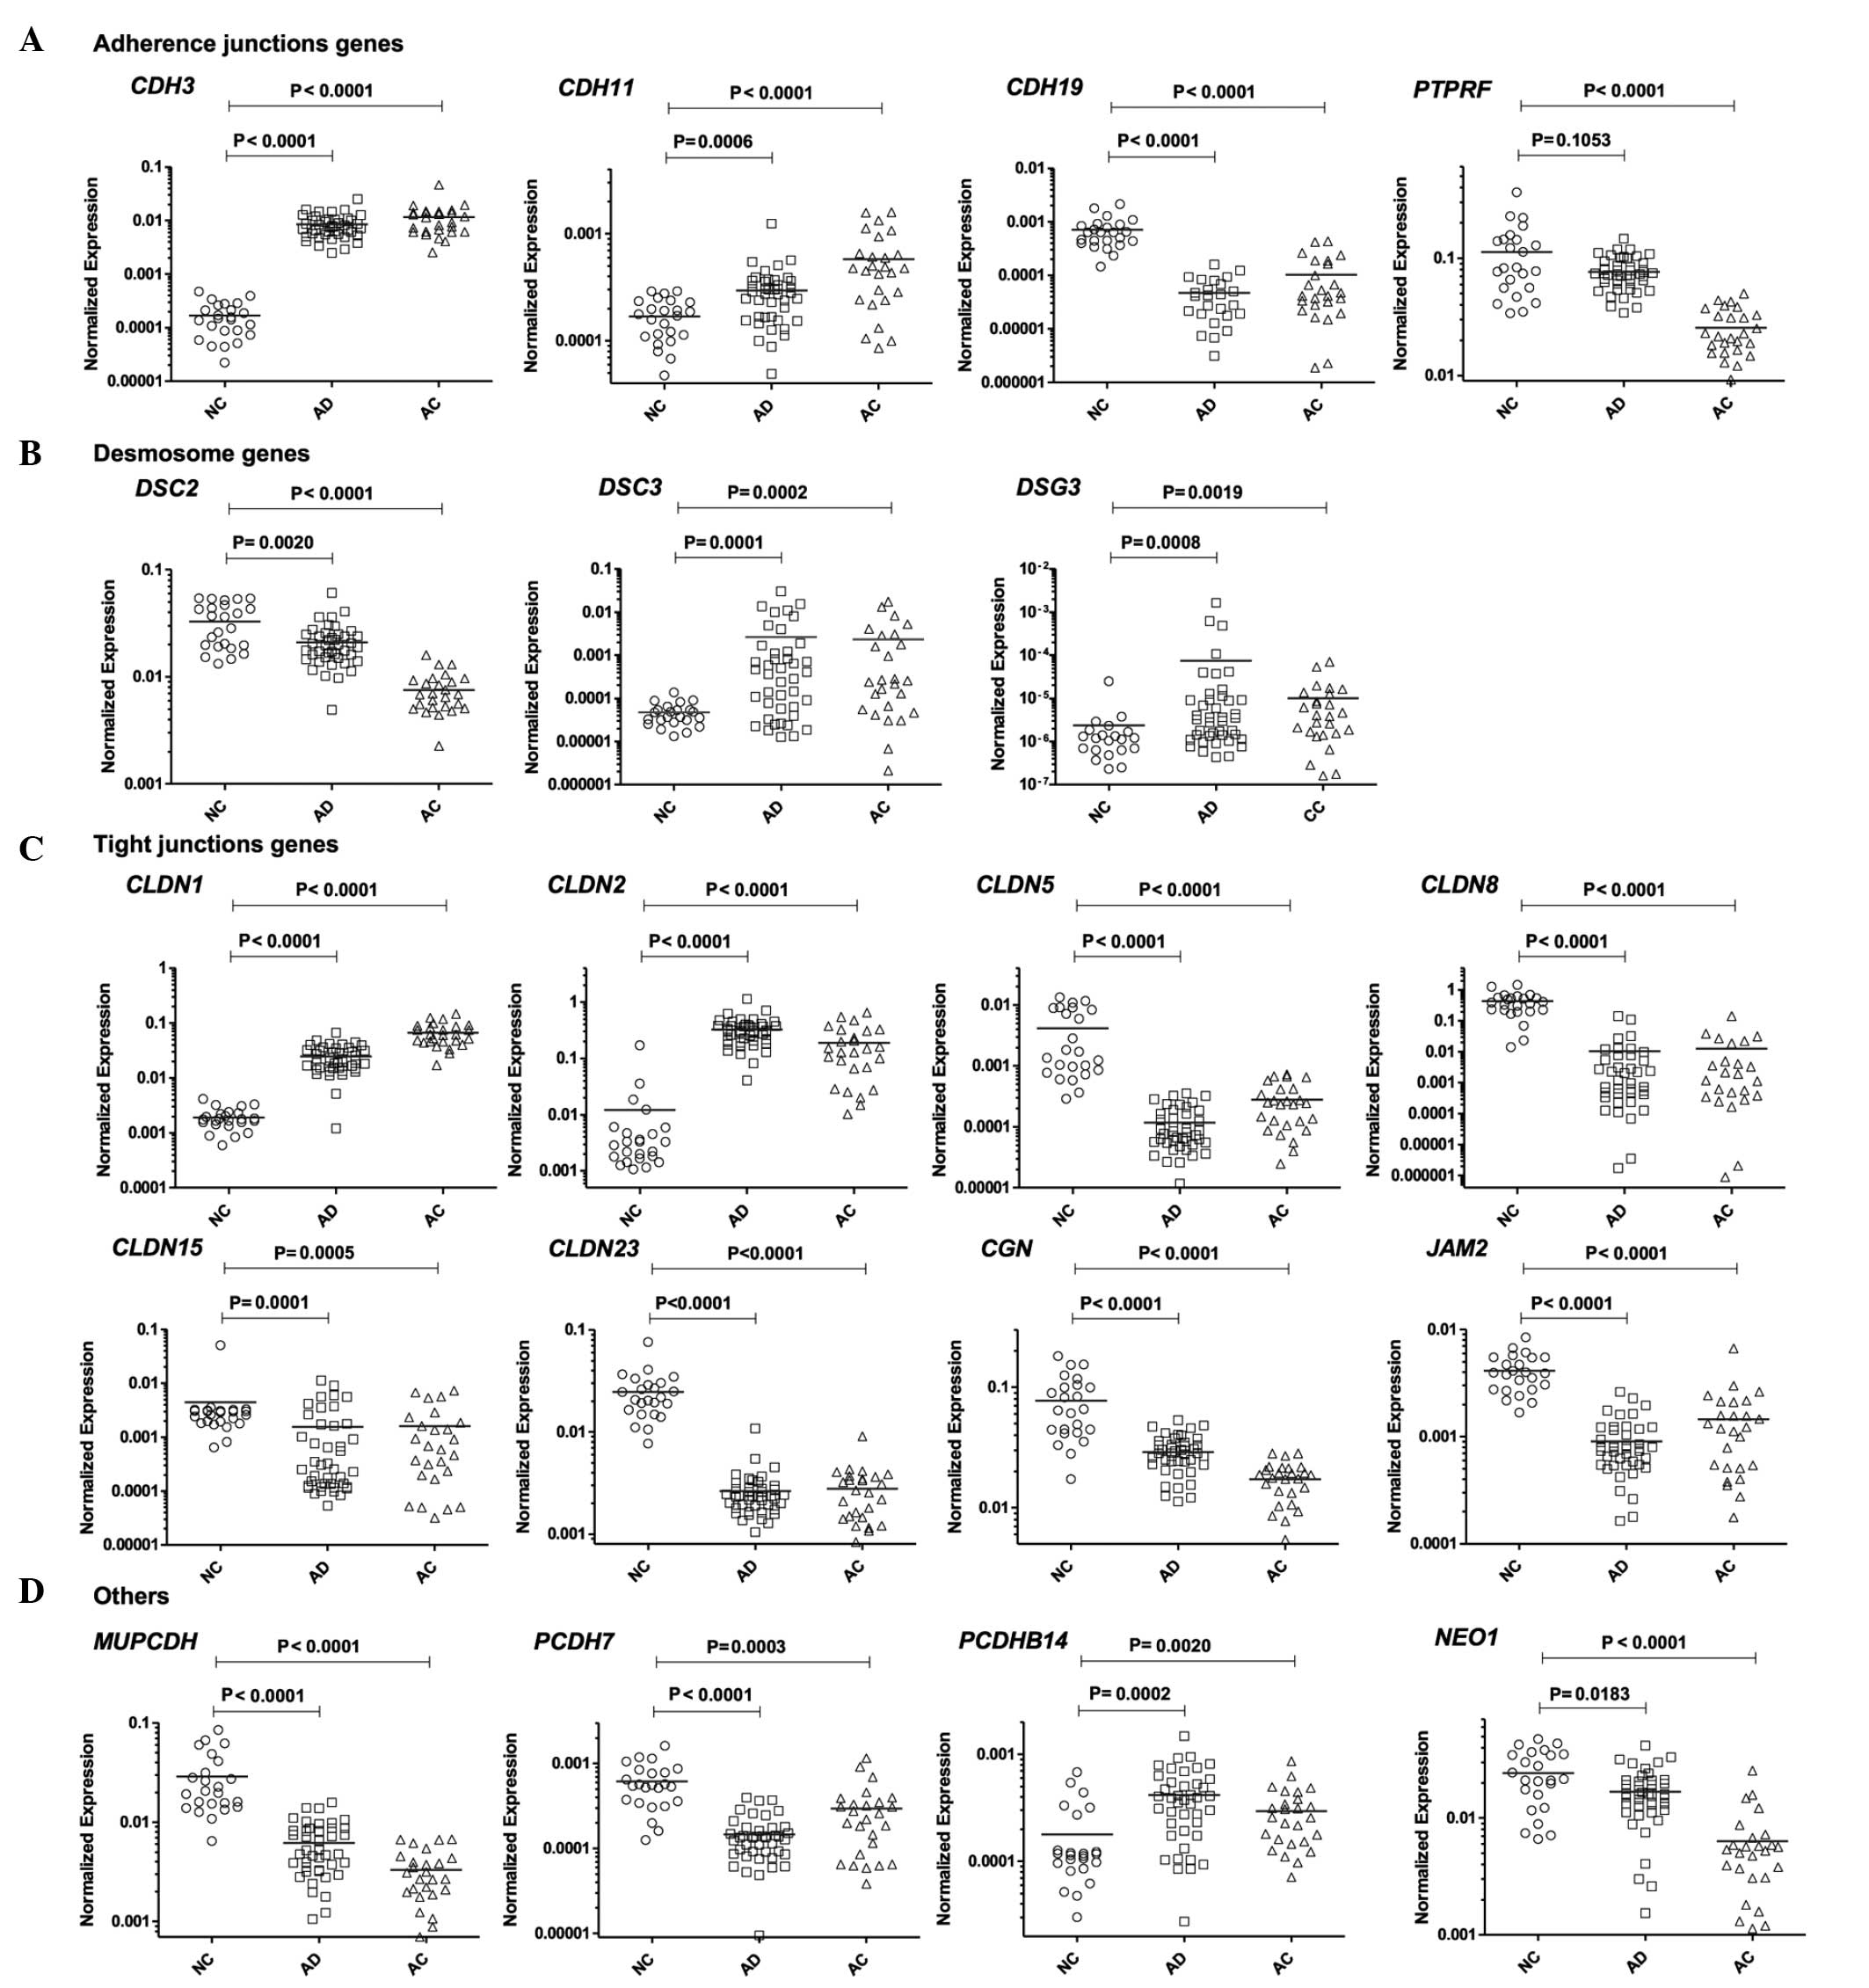
Among the genes encoding adherens junction
components, expression of cadherin genes CDH3 and
CDH11 was markedly increased in tumor tissue compared with
normal tissue. This was accompanied by a decrease in the expression
of CDH19 and PTPRF, a gene that encodes a tyrosine
phosphatase associated with adherens junctions (Fig. 1A).
In tumor samples (AC and AD tissue), six claudin
genes, encoding the crucial extracellular elements of tight
junctions, were aberrantly expressed in comparison with normal
tissue. The changes included the upregulation of CLDN1 and
CLDN2, and the downregulation of CLDN5, CLDN8,
CLDN15 and CLDN23. A decrease in the expression of
CGN and JAM2, which encode other tight junction
proteins, was also observed (Fig.
1B). In addition, tumor tissues were characterized by the
altered expression of DSC2 (downregulated), DSC3
(upregulated) and DSG3 (upregulated), encoding desmosome
elements (Fig. 1C). Compared with NC,
the protocadherin genes PCDH7 and MUPCDH exhibited
lower expression in the two tumor tissue types, whilst
PCDHB14 exhibited increased mRNA levels in tumors. Decreased
expression of the NEO1 gene, encoding an immunoglobulin
superfamily member, was also detected (Fig. 1D). The expression level of one gene,
PCDHB16 did not exhibit a significant difference between NC
and tumor tissue, in contrast with the differences observed in
microarray experiments (NC vs. AC, P=0.0623; NC vs AD, P=0.3016).
Details of the gene expression comparison are shown in Table III and Fig. 1.
| Table III.Description of the studied genes and
results of quantitative polymerase chain reaction analysis,
presented as the fold change in expression levels in normal mucosa
versus adenoma, and normal mucosa versus cancer tissue. |
Table III.
Description of the studied genes and
results of quantitative polymerase chain reaction analysis,
presented as the fold change in expression levels in normal mucosa
versus adenoma, and normal mucosa versus cancer tissue.
| Gene symbol | Encoded
protein | Protein
function | NC vs. AD,
fold-change | NC vs. AC,
fold-change |
|---|
| CDH3 | P-cadherin | Adherent junction
formation | 50.02 | 68.91 |
| CDH11 | OB-cadherin | Adherent junction
formation | 1.74 | 3.43 |
| CDH19 | Cadherin 19 | Adherent junction
formation | −31.41 | −8.13 |
| PTPRF | Protein tyrosine
phosphatase, receptor type F | Adherent junction
regulaiton | −1.48a | −4.42 |
| DSC2 | Desmocollin 2 | Epithelial
desmosomal cadherin | −1.56a | −4.37 |
| DSC3 | Desmocollin 3 | Desmosome forming
cadherin | 55.75 | 49.40 |
| DSG3 | Desmoglein 3 | Desmosome forming
cadherin | 31.62 | 4.28a |
| CLDN1 | Claudin 1 | Structural tight
junction component | 12.96 | 35.17 |
| CLDN2 | Claudin 2 | Structural tight
junction component | 26.94 | 15.62 |
| CLDN5 | Claudin 5 | Structural tight
junction component | −35.64 | −14.86 |
| CLDN8 | Claudin 8 | Structural tight
junction component | −41.16 | −33.81 |
| CLDN15 | Claudin 15 | Structural tight
junction component | −2.87 | −2.76 |
| CLDN23 | Claudin 23 | Structural tight
junction component | −9.36 | −8.87 |
| JAM2 | Junctional adhesion
molecule B | Structural tight
junction component | −4.57 | −2.85 |
| CGN | Cingulin | Intracellular tight
junction element, adhesion related signaling | −2.66 | −4.49 |
| MUPCDH |
Mu-protocadherin | Cadherin family
protein | −4.63 | −8.70 |
| PCDH7 |
Protocadherin-7 | Cell-cell
adhesion | 4.22 | 2.01 |
| PCDHB14 | Protocadherin
beta-14 | Homophillic
cell-cell connections | 2.34 | 1.64 |
| PCDHB16 | Protocadherin
beta-16 | Homophillic
cell-cell connections | 1.91a | 1.87a |
| NEO1 | Neogenin | Cell-cell adhesion,
cell growth and differentiation | −1.44a | −3.84 |
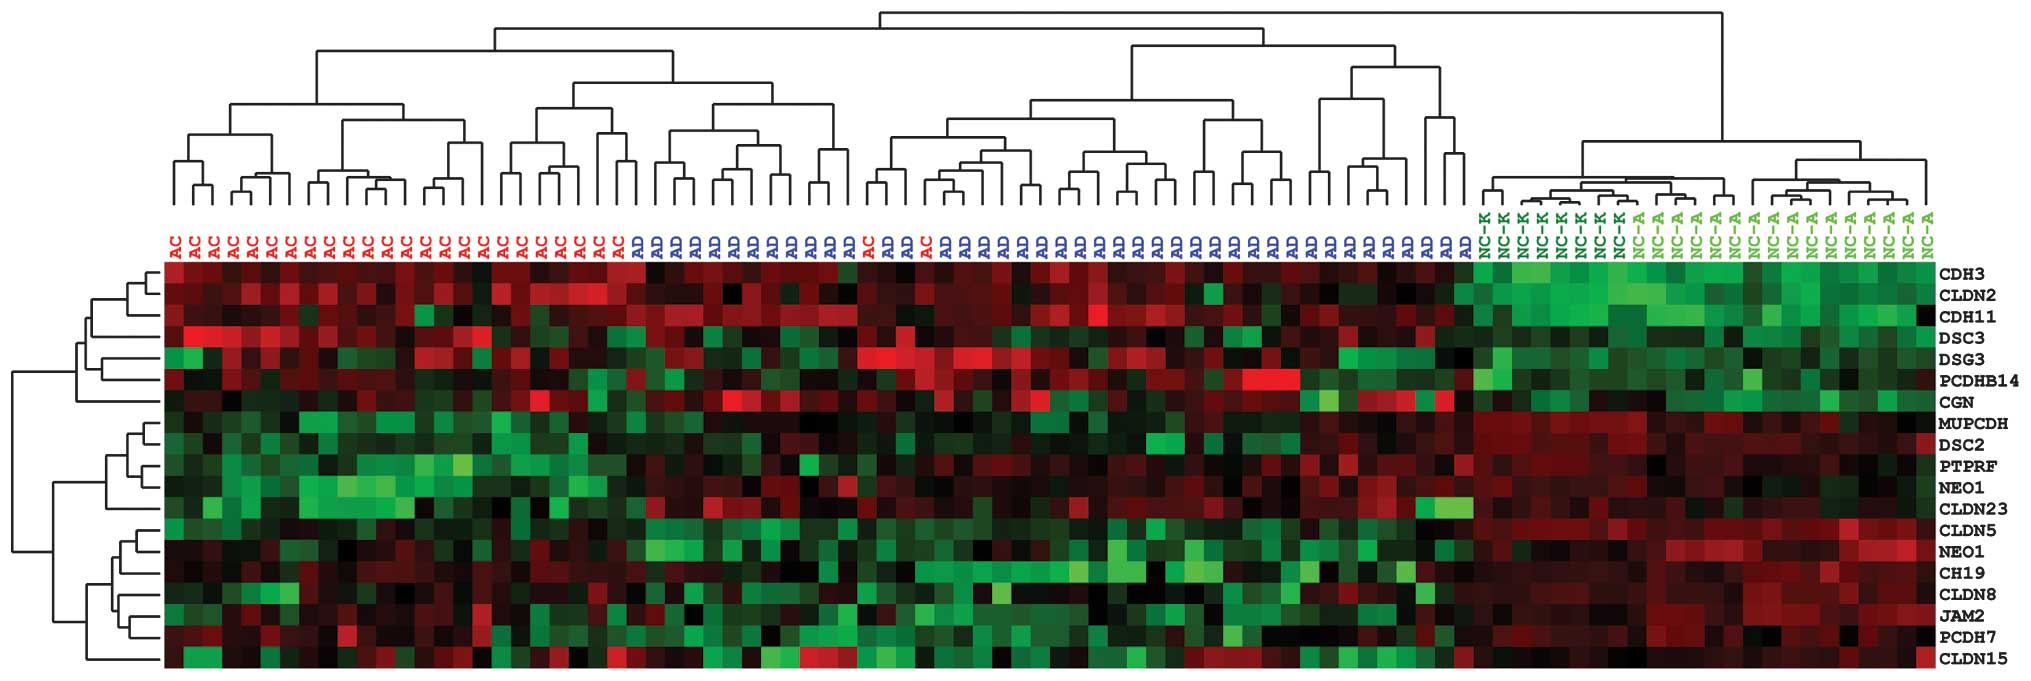
The results of the mRNA expression assessment of the
19 genes that significantly differed between the three types of
tissue in the 83 tissue samples were subjected to hierarchical
clustering analysis; the selected genes may be divided into three
categories based on these results (Fig.
2). The first category comprises genes that are overexpressed
in the two neoplastic tissues compared with NC. These genes are
progressively upregulated throughout the stages of cancer
progression from NC to AC (CDH3, CDH11,
CLDN1), show comparable expression in AD and AC, or exhibit
the highest mRNA levels in AD (DSC3, DSG3,
CLDN2 and PCDHB14). The second category is composed
of genes that undergo gradual downregulation during the progression
from NC to AC: CGN, MUPCDH, DSC2, PTPRF
and NEO1. The third category consists of genes that
exhibited lower expression in the two neoplastic tissue types, with
comparable expression in AD and AC (CLDN8, CLDN15,
CLDN23), as well as those with lowest expression levels in
AD (PCDH7, JAM2 and CLDN5).
The clustering analysis clearly distinguished tumor
samples from normal mucosa. Cancer patients (with exception of two
samples) were grouped in one cluster, which also included 12 AD
samples. Notably, these patients did not differ from the remaining
AD patients (grouped in a second cluster) with regard to clinically
relevant features, including dysplasia grade, AD size or
histopathological subtype. The only observed difference was in the
location of the tumor: Of the 12 adenoma samples that were
clustered with the AC samples, 6 samples were located in the
transverse and descending colon, while the majority of the
remaining ADs, clustered in the second category, were located in
the sigmoid colon and rectal regions (25/30). However, the
difference in proportions was only marginally below the
significance threshold level (P=0.0491, two-sided Fisher's exact
test).
Two types of NC samples were used: Sections of
normal epithelium adjacent (>5 cm) to AC (NC-A) as well as
tissue from healthy individuals obtained during colonoscopy (NC-K).
Each of these sample types clustered together, however, both types
exhibited similar patterns of expression.
Discussion
The expression profile of junctional proteins is
essential for the maintenance of epithelial tissue architecture,
and its disruption in tumors results in the dissociation of
adhesion complexes. This is a hallmark of carcinogenesis-related
morphological changes, including the epithelial-mesenchymal
transition of neoplastic tissue, a crucial step in tumor
progression (8).
A number of studies have investigated the role of
aberrant expression of a single or small number of a priori
selected cell-cell adhesion-related genes in colorectal tumors.
Cadherin genes are the most extensively studied, particularly
E-cadherin (3), however, genes
encoding for tight junction (4)
proteins, desmosomes (10) and gap
junction (5) proteins have also been
investigated. The present study focused on the mRNA expression
levels of intercellular adhesion-related genes that had previously
been identified to differ to the greatest extent between normal
mucosa and colorectal tumor tissues in a microarray transcriptome
study (9). In total, 20 genes that
fulfilled the inclusion criteria were selected, and their
expression levels were evaluated using qPCR, followed by an
analysis of the association between gene expression and patient
characteristics. The majority of these genes encode components of
three basic intercellular complexes: Adherens junctions, desmosomes
and tight junctions.
Three genes encoding adherens junction cadherins
(CDH3, CDH11 and CDH19) were included in qPCR
evaluation. Notably, the E-cadherin gene (the best characterized
cadherin in AC) was identified among genes that differ in
expression between NC and AC tissue, however, it was not among the
genes with the highest FC in expression between these tissue
types.
A marked increase in CDH3 (P-cadherin)
expression was detected in tumors, compared with NC. P-cadherin is
predominantly expressed in the stratified squamous epithelia,
including the esophagus. Its expression is limited to the basal
cell layer, and is not observed in the mucosa of the colon or
rectum (11). The role of P-cadherin
in colorectal carcinogenesis has not been extensively studied,
however, its increased expression has previously been reported
based on immunohistochemical staining of AD (12) and AC (13). P-cadherin is classified as an oncogene
due to its ability to increase crypt cell proliferation in the
context of inflammation (14). In
addition, two reports have suggested that CDH3 upregulation
in cancer tissue is associated with gene promoter demethylation
(14,15). However, using a quantitative approach,
increased promoter hypomethylation was identified in only 77% of
carcinomas (15), which does not
account for the universal upregulation of the expression of this
gene in AD and cancer. P-cadherin has also been used as a target
for immunotherapy in the treatment of AC (16).
CDH11 encodes OB-cadherin, which is expressed
predominantly in osteoblastic cells. Its function in tumorigenesis
has been investigated in gliomas, where it acts as a marker of the
mesenchymal phenotype (17), as well
as in prostate (18) and breast
cancer (19), where its expression is
important in metastasis. Recently, the overexpression of
CDH11 was identified as a marker of cancer-associated
stromal cells, and this stromal expression was found to have
prognostic value (20). Increased
immunohistochemical expression was also observed in AC epithelial
cells (20). It has been hypothesized
that, in certain tumors or tumor cell lines, CDH11 acts as a
suppressor gene, and its expression is downregulated via a DNA
methylation mechanism (21,22).
Little has been established with regard to
CDH19 in tumors. The highest expression of this gene is
observed in heart tissue and melanocytes (according to the
Genevestigator database) (23), and
deletion of the 18q22 region that comprises CDH19, in
addition to a decrease in gene expression, have been identified in
head and neck tumors (24). The
results of the present study suggest that it may be important in
colorectal tumor development and progression. However, as the
function of the encoded cadherin has not been fully elucidated,
this observation requires further investigation.
A marked decrease in PTPRF expression in
tumor tissue, compared with NC, was observed in the present study,
which has not previously been reported. This gene belongs to the
large family of receptor-associated protein phosphatases, which
negatively regulate receptor-associated kinases (25). PTPRF is localized to adhesion
junctions and is important in E-cadherin and β-catenin signaling
(26–28). The role of PTRPF in E-cadherin
signaling, in addition to its high expression in NC tissue
(according to the Genevestigator database) (23) and the identification of mutations of
this gene in AC (29), suggests that
a reduction in tyrosine phosphatase may be significant in adherens
junction disintegration.
The comparison of NC and tumor tissue revealed
aberrant expression of desmosome-specific cadherins DSC2 and
DSC3. Desmocollin 2 is the major extracellular component of
demosomes in normal colorectal mucosa. The downregulation of this
gene has been observed in cancer tissue, and is associated with
shortened survival of patients (10,30).
DSC2 downregulation is accompanied by the de novo
expression of DSC3; this transition has been called
‘desmosome switching’, similarly to the well-described ‘cadherin
switching’ process (10). This
phenomenon has not been fully described, however, it is concurrent
with the observations of the current study, which identified the
equivalent directional changes in DSC2 and DSC3
expression. The increased expression of DSG3, encoding the
extracellular desmosome protein desmoglein, also appears to be
involved in desmosome remodeling, which has not previously been
reported. As desmosomes contribute to strong intercellular
adhesion, and exhibit differential expression between normal and
tumor tissue, the role of desmosomes in AC may be of greater
significance than has previously been predicted.
Aberrant expression of genes encoding tight junction
proteins, particularly those belonging to claudin family, were
observed in the present study. Claudins, along with occludin, are
essential structural elements of tight junctions, and constitute a
family of 24 proteins that are important in carcinogenesis
(6). The results of the current study
were consistent with previous reports of upregulation of
CLDN1 and CLDN2 (31–34), and
downregulation of CLDN8 (34)
and CLDN23 (35) in tumor
tissue compared with NC. A decrease in CLDN5 and
CLDN15 levels was also identified in colorectal AD and AC,
that had not previously been described. Claudin-5 is primarily
detected in the brain and endothelium, and is also present in
epithelial cells, including those of intestine (36), and in certain cancers (37). In addition, this protein is involved
as a structural component in the junctions between tumor epithelial
and vascular endothelial cells, and results from in vitro
experiments in HECV endothelial cells indicate that it contributes
to cell motility and angiogenic potential, which are reduced when
CLDN5 is overexpressed (38).
Claudin-5 is also reported to be associated with neoangiogenesis in
ovarian cancer (39). The decrease of
CLDN5 expression in tumor tissue, as observed in the present
study, may reflect changes in tight junctions between cells, and
functional changes in tumor vascularization. A decrease in
CLDN5 expression has also been observed in Crohn's disease,
an inflammatory bowel disease that exhibits a variety of mucosal
changes, including preneoplastic lesions, which leads to an
increased risk of colorectal cancer (40).
Less is known about the role of CLDN15 in
tumors. In mice, claudin-15 was detected among claudins with the
highest expression in the colon (41)
and it exhibited altered expression in the rat models of colitis
and colitis-associated cancer (42).
The current study also confirmed the differential expression
between AC/AD and NC of two other genes encoding tight junction
components: JAM2, a gene that has been found to be
hypermethylated in AC (43), and
CGN. The latter encodes an intracellular tight junction
protein, and its overexpression in AC has been reported in one
immunohistochemical study (44). The
function of the encoded protein, cingulin remains elusive; however
it appears to be important for junction formation and also
negatively regulates cell proliferation (45). Additionally, CGN is downregulated
during the epithelial-mesenchymal transition in breast cancer model
cells (46). These previous findings
indicate that cingulin may suppress tumor development, in
accordance with the results of the current study.
As well as the genes associated with the large
functional complexes described above, four additional cell-cell
adhesion-related genes were aberrantly expressed in the two tumor
tissue types compared with NC. These included the following
protocadherins: MUPCDH, for which downregulation has
previously been observed in AC (47);
PCDH7, which has not been investigated in AC or AD, but has
been found to be methylated in bladder cancer (48); PCDHB14, a member of
protocadherin-β gene cluster for which function is poorly
understood; and NEO1, encoding the neogenin protein which is
a member of the immunoglobulin superfamily and has been
demonstrated to be downregulated in colorectal AD and AC (49).
Hierarchical clustering of patients showed that
clinical samples are grouped according to the expression levels of
the studied genes in two main clusters: NC samples and tumors (AD
and AC). Normal mucosa samples share a similar expression pattern
whether obtained from cancer patients or from healthy patients.
Tumors are further divided into two clusters: one primarily
comprises AC samples, while the second is predominantly composed of
AD samples. Notably, a portion of AD samples was clustered with the
AC samples; tumor location appears to be the only feature that
distinguishes these samples from the remaining AD samples. This
observation is concordant with previously reported
localization-related biological profiles of colon and rectal tumors
(50,51).
In conclusion, the current study indicates that
morphological changes that occur during in neoplastic colon tissue
progression through the ‘adenoma-carcinoma sequence’ are
accompanied by aberrant expression of multiple genes encoding
cell-cell adhesion proteins, particularly those of junctional
complexes. A number of these genes were previously reported to be
involved in the pathogenesis of colorectal AC, however, the altered
expression of several genes, including CDH19, PTPRF,
DSG3, CLDN5, CLDN15, CGN, PCDH7
and PCDHB14 have been demonstrated for the first time in
colorectal neoplasms (compared with NC). The specific differential
patterns of gene expression appear to be similar among patients
with cancer and adenoma, as well as normal mucosa samples. The main
limitation of the present study was that the expression of the
selected genes were only investigated at the mRNA level. Thus,
further studies using immunohistochemistry and western blot
analysis are required to validate these results at the protein
level, however, this remains a challenge for multiple gene
signatures. Protein analysis would be particularly valuable for
genes which have not been investigated previously.
We hypothesize that the tumor-specific, aberrant
expression of the aforementioned genes may have practical
implications for the future and may serve as novel prognostic
markers or provide rationale for novel therapeutic strategies.
Acknowledgements
This work was supported by a research grant from
Ministry of Science and Higher Education of Poland (grant no.
IP2011 005471).
References
|
1
|
Ponz de Leon M and Di Gregorio C:
Pathology of colorectal cancer. Dig Liver Dis. 33:372–388. 2001.
View Article : Google Scholar : PubMed/NCBI
|
|
2
|
Le Bras GF, Taubenslag KJ and Andl CD: The
regulation of cell-cell adhesion during epithelial-mesenchymal
transition, motility and tumor progression. Cell Adh Migr.
6:365–373. 2012. View Article : Google Scholar : PubMed/NCBI
|
|
3
|
Tsanou E, Peschos D, Batistatou A,
Charalabopoulos A and Charalabopoulos K: The E-cadherin adhesion
molecule and colorectal cancer. A global literature approach.
Anticancer Res. 28:3815–3826. 2008.PubMed/NCBI
|
|
4
|
Wang X, Tully O, Ngo B, Zitin M and Mullin
JM: Epithelial tight junctional changes in colorectal cancer
tissues. ScientificWorldJournal. 11:826–841. 2011. View Article : Google Scholar : PubMed/NCBI
|
|
5
|
Kanczuga-Koda L: Gap junctions and their
role in physiology and pathology of the digestive tract. Postepy
Hig Med Dosw (Online). 58:1581652004.(In Polish). PubMed/NCBI
|
|
6
|
Turksen K and Troy TC: Junctions gone bad:
claudins and loss of the barrier in cancer. Biochim Biophys Acta.
1816:73–79. 2011.PubMed/NCBI
|
|
7
|
Brenner H, Kloor M and Pox CP: Colorectal
cancer. Lancet. 383:1490–1502. 2014. View Article : Google Scholar : PubMed/NCBI
|
|
8
|
Sipos F and Galamb O:
Epithelial-to-mesenchymal and mesenchymal-to-epithelial transitions
in the colon. World J Gastroenterol. 18:601–608. 2012. View Article : Google Scholar : PubMed/NCBI
|
|
9
|
Skrzypczak M, Goryca K, Rubel T, et al:
Modeling oncogenic signaling in colon tumors by multidirectional
analyses of microarray data directed for maximization of analytical
reliability. PLoS One. 5:e130912010. View Article : Google Scholar : PubMed/NCBI
|
|
10
|
Khan K, Hardy R, Haq A, Ogunbiyi O, Morton
D and Chidgey M: Desmocollin switching in colorectal cancer. Br J
Cancer. 95:1367–1370. 2006. View Article : Google Scholar : PubMed/NCBI
|
|
11
|
Shimoyama Y, Yoshida T, Terada M, et al:
Molecular cloning of a human Ca2+-dependent cell-cell adhesion
molecule homologous to mouse placental cadherin: its low expression
in human placental tissues. J Cell Biol. 109:1787–1794. 1989.
View Article : Google Scholar : PubMed/NCBI
|
|
12
|
Hardy RG, Tselepis C, Hoyland J, et al:
Aberrant P-cadherin expression is an early event in hyperplastic
and dysplastic transformation in the colon. Gut. 50:513–519. 2002.
View Article : Google Scholar : PubMed/NCBI
|
|
13
|
Kamposioras K, Konstantara A, Kotoula V,
et al: The prognostic significance of WNT pathway in
surgically-treated colorectal cancer: β-catenin expression predicts
for disease-free survival. Anticancer Res. 33:4573–4584.
2013.PubMed/NCBI
|
|
14
|
Milicic A, Harrison LA, Goodlad R, et al:
Ectopic expression of P-cadherin correlates with promoter
hypomethylation early in colorectal carcinogenesis and enhanced
intestinal crypt fission in vivo. Cancer Res. 68:7760–7768. 2008.
View Article : Google Scholar : PubMed/NCBI
|
|
15
|
Hibi K, Goto T, Mizukami H, et al:
Demethylation of the CDH3 gene is frequently detected in advanced
colorectal cancer. Anticancer Res. 29:2215–2217. 2009.PubMed/NCBI
|
|
16
|
Yoshioka H, Yamamoto S, Hanaoka H, et al:
In vivo therapeutic effect of CDH3/P-cadherin-targeting
radioimmunotherapy. Cancer Immunol Immunother. 61:1211–1220. 2012.
View Article : Google Scholar : PubMed/NCBI
|
|
17
|
Kaur H, Phillips-Mason PJ, Burden-Gulley
SM, et al: Cadherin-11, a marker of the mesenchymal phenotype,
regulates glioblastoma cell migration and survival in vivo. Mol
Cancer Res. 10:293–304. 2012. View Article : Google Scholar : PubMed/NCBI
|
|
18
|
Chu K, Cheng CJ, Ye X, et al: Cadherin-11
promotes the metastasis of prostate cancer cells to bone. Mol
Cancer Res. 6:1259–1267. 2008. View Article : Google Scholar : PubMed/NCBI
|
|
19
|
Tamura D, Hiraga T, Myoui A, Yoshikawa H
and Yoneda T: Cadherin-11-mediated interactions with bone marrow
stromal/osteoblastic cells support selective colonization of breast
cancer cells in bone. Int J Oncol. 33:17–24. 2008.PubMed/NCBI
|
|
20
|
Torres S, Bartolome RA, Mendes M, et al:
Proteome profiling of cancer-associated fibroblasts identifies
novel proinflammatory signatures and prognostic markers for
colorectal cancer. Clin Cancer Res. 19:6006–6019. 2013. View Article : Google Scholar : PubMed/NCBI
|
|
21
|
Li L, Ying J, Li H, et al: The human
cadherin 11 is a pro-apoptotic tumor suppressor modulating cell
stemness through Wnt/β-catenin signaling and silenced in common
carcinomas. Oncogene. 31:3901–3912. 2012. View Article : Google Scholar : PubMed/NCBI
|
|
22
|
Carmona FJ, Villanueva A, Vidal A, et al:
Epigenetic disruption of cadherin-11 in human cancer metastasis. J
Pathol. 228:230–240. 2012. View Article : Google Scholar : PubMed/NCBI
|
|
23
|
Hruz T, Laule O, Szabo G, et al:
Genevestigator v3: a reference expression database for the
meta-analysis of transcriptomes. Adv Bioinformatics.
2008:4207472008. View Article : Google Scholar : PubMed/NCBI
|
|
24
|
Blons H, Laccourreye O, Houllier AM, et
al: Delineation and candidate gene mutation screening of the 18q22
minimal region of deletion in head and neck squamous cell
carcinoma. Oncogene. 21:5016–5023. 2002. View Article : Google Scholar : PubMed/NCBI
|
|
25
|
Chernoff J: Protein tyrosine phosphatases
as negative regulators of mitogenic signaling. J Cell Physiol.
180:173–81. 1999. View Article : Google Scholar : PubMed/NCBI
|
|
26
|
Serra-Pages C, Kedersha NL, Fazikas L, et
al: The LAR transmembrane protein tyrosine phosphatase and a
coiled-coil LAR-interacting protein co-localize at focal adhesions.
EMBO J. 14:2827–2838. 1995.PubMed/NCBI
|
|
27
|
Symons JR, LeVea CM and Mooney RA:
Expression of the leucocyte common antigen-related (LAR) tyrosine
phosphatase is regulated by cell density through functional
E-cadherin complexes. Biochem J. 365:513–519. 2002. View Article : Google Scholar : PubMed/NCBI
|
|
28
|
Bonvini P, An WG, Rosolen A, et al:
Geldanamycin abrogates ErbB2 association with proteasome-resistant
beta-catenin in melanoma cells, increases beta-catenin-E-cadherin
association, and decreases beta-catenin-sensitive transcription.
Cancer Res. 61:1671–1677. 2001.PubMed/NCBI
|
|
29
|
Wang Z, Shen D, Parsons DW, et al:
Mutational analysis of the tyrosine phosphatome in colorectal
cancers. Science. 304:1164–1166. 2004. View Article : Google Scholar : PubMed/NCBI
|
|
30
|
Knosel T, Chen Y, Hotovy S, Settmacher U,
Altendorf-Hofmann A and Petersen I: Loss of desmocollin 1–3 and
homeobox genes PITX1 and CDX2 are associated with tumor progression
and survival in colorectal carcinoma. Int J Colorectal Dis.
27:1391–1399. 2012. View Article : Google Scholar : PubMed/NCBI
|
|
31
|
Singh AB, Sharma A, Smith JJ, et al:
Claudin-1 up-regulates the repressor ZEB-1 to inhibit E-cadherin
expression in colon cancer cells. Gastroenterology. 141:2140–2153.
2011. View Article : Google Scholar : PubMed/NCBI
|
|
32
|
Huo Q, Kinugasa T, Wang L, et al:
Claudin-1 protein is a major factor involved in the tumorigenesis
of colorectal cancer. Anticancer Res. 29:851–857. 2009.PubMed/NCBI
|
|
33
|
Kinugasa T, Huo Q, Higashi D, et al:
Selective up-regulation of claudin-1 and claudin-2 in colorectal
cancer. Anticancer Res. 27:3729–3734. 2007.PubMed/NCBI
|
|
34
|
Grone J, Weber B, Staub E, et al:
Differential expression of genes encoding tight junction proteins
in colorectal cancer: frequent dysregulation of claudin-1, −8 and
−12. Int J Colorectal Dis. 22:651–659. 2007. View Article : Google Scholar : PubMed/NCBI
|
|
35
|
Pitule P, Vycital O, Bruha J, et al:
Differential expression and prognostic role of selected genes in
colorectal cancer patients. Anticancer Res. 33:4855–4865.
2013.PubMed/NCBI
|
|
36
|
Rahner C, Mitic LL and Anderson JM:
Heterogeneity in expression and subcellular localization of
claudins 2, 3, 4, and 5 in the rat liver, pancreas, and gut.
Gastroenterology. 120:411–422. 2001. View Article : Google Scholar : PubMed/NCBI
|
|
37
|
Soini Y: Expression of claudins 1, 2, 3,
4, 5 and 7 in various types of tumours. Histopathology. 46:551–560.
2005. View Article : Google Scholar : PubMed/NCBI
|
|
38
|
Escudero-Esparza A, Jiang WG and Martin
TA: Claudin-5 participates in the regulation of endothelial cell
motility. Mol Cell Biochem. 362:71–85. 2012. View Article : Google Scholar : PubMed/NCBI
|
|
39
|
Herr D, Sallmann A, Bekes I, et al: VEGF
induces ascites in ovarian cancer patients via increasing
peritoneal permeability by downregulation of Claudin 5. Gynecol
Oncol. 127:210–216. 2012. View Article : Google Scholar : PubMed/NCBI
|
|
40
|
Zeissig S, Burgel N, Gunzel D, et al:
Changes in expression and distribution of claudin 2, 5 and 8 lead
to discontinuous tight junctions and barrier dysfunction in active
Crohn's disease. Gut. 56:61–72. 2007. View Article : Google Scholar : PubMed/NCBI
|
|
41
|
Fujita H, Chiba H, Yokozaki H, et al:
Differential expression and subcellular localization of claudin-7,
−8, −12, −13, and −15 along the mouse intestine. J Histochem
Cytochem. 54:933–944. 2006. View Article : Google Scholar : PubMed/NCBI
|
|
42
|
Arimura Y, Nagaishi K and Hosokawa M:
Dynamics of claudins expression in colitis and colitis-associated
cancer in rat. Methods Mol Biol. 762:409–425. 2011. View Article : Google Scholar : PubMed/NCBI
|
|
43
|
Oster B, Thorsen K, Lamy P, et al:
Identification and validation of highly frequent CpG island
hypermethylation in colorectal adenomas and carcinomas. Int J
Cancer. 129:2855–2866. 2011. View Article : Google Scholar : PubMed/NCBI
|
|
44
|
Citi S, Amorosi A, Franconi F, Giotti A
and Zampi G: Cingulin, a specific protein component of tight
junctions is expressed in normal and neoplastic human epithelial
tissues. Am J Pathol. 138:781–789. 1991.PubMed/NCBI
|
|
45
|
Guillemot L and Citi S: Cingulin regulates
claudin-2 expression and cell proliferation through the small
GTPase RhoA. Mol Biol Cell. 17:3569–3577. 2006. View Article : Google Scholar : PubMed/NCBI
|
|
46
|
Papageorgis P, Lambert AW, Ozturk S, et
al: Smad signaling is required to maintain epigenetic silencing
during breast cancer progression. Cancer Res. 70:968–978. 2010.
View Article : Google Scholar : PubMed/NCBI
|
|
47
|
Losi L, Parenti S, Ferrarini F, et al:
Down-regulation of μ-protocadherin expression is a common event in
colorectal carcinogenesis. Hum Pathol. 42:960–971. 2011. View Article : Google Scholar : PubMed/NCBI
|
|
48
|
Beukers W, Hercegovac A, Vermeij M, et al:
Hypermethylation of the polycomb group target gene PCDH7 in bladder
tumors from patients of all ages. J Urol. 190:311–316. 2013.
View Article : Google Scholar : PubMed/NCBI
|
|
49
|
Li VS, Yuen ST, Chan TL, et al: Frequent
inactivation of axon guidance molecule RGMA in human colon cancer
through genetic and epigenetic mechanisms. Gastroenterology.
137:176–187. 2009. View Article : Google Scholar : PubMed/NCBI
|
|
50
|
Yamauchi M, Morikawa T, Kuchiba A, et al:
Assessment of colorectal cancer molecular features along bowel
subsites challenges the conception of distinct dichotomy of
proximal versus distal colorectum. Gut. 61:847–854. 2012.
View Article : Google Scholar : PubMed/NCBI
|
|
51
|
Koestler DC, Li J, Baron JA, et al:
Distinct patterns of DNA methylation in conventional adenomas
involving the right and left colon. Mod Pathol. 27:145–155. 2014.
View Article : Google Scholar : PubMed/NCBI
|