Introduction
Bladder cancer (BC) is estimated to be among the top
five most common types of cancer in western countries and ranks
number 13 in terms of cancer-associated mortality worldwide
(1,2).
Histologically, BC may be classified based on the depth of
invasion: pTa, papillary; pT1, lamina propria invasion; pT2, muscle
invasive; pT3, invasion to peri-vesical fat; and pT4, locally
advanced (3,4). BC results from long-term exposure to
contaminants or other environmental factors involving gene
mutations and progressive cellular damage. Parkin et al
(5) demonstrated that the incidence
of BC is almost four times higher in men than in women and inducing
factors include tobacco smoke, prolonged exposure to chemical
substances and race (6,7).
Genetic mutations in gene expression may lead to the
malignant transformation of bladder cells. High-throughput DNA
microarray analyses have identified multiple DNA mutations and
alterations in the genesis of BC; these include genes encoding for
B cell lymphoma-2, p53, H-Ras and fibroblast growth factor receptor
3 (FGFR3) (8,9). FGFR3 is a tyrosine kinase receptor that
regulates fundamental developmental pathways and triggers a range
of cellular processes, including proliferation, differentiation,
migration and apoptosis (10). The
FGFR3 gene is located on chromosome region 4p16.3 (11) and it is made up of 9 exons and 18
introns (12). The structure of FGFR3
is composed of an extracellular domain consisting of two or three
immunoglobulin-like domains, a hydrophobic transmembrane domain and
an intracellular tyrosine kinase domain (13). Upon ligand binding, FGFR3 forms dimers
and activates the intracellular kinase domain, resulting in
autophosphorylation of this domain. The phosphorylated residues are
the binding targets of the adaptor proteins and their binding
results in the activation of several signal transduction pathways,
including the Ras mitogen-activated protein kinase (MAPK) signaling
pathway and phosphoinositide 3-kinase (PI3K) Akt mammalian target
of rapamycin (mTOR) pathway (14).
There are two mechanisms to explain the abnormal
activation of FGFR3: Overexpression or activating mutations. FGFR3
mutations have been identified in multiple dwarfisms (15), such as hypochondroplasia, and in
multiple types of cancer, including prostate cancer (16), cervical cancer (17) and BC. FGFR3 mutations were reported in
BC for the first time by Cappellen et al (18). There is evidence to suggest that
codons 248, 249 and 375 are the major mutation hot spots in BC
(19); in addition, activating
mutations of FGFR3 have been revealed primarily in pTa (60–70%) and
in pT1-4 (16–20%) (19).
Overexpression of FGFR3 has been frequently identified in BC;
furthermore, Jebar et al (20)
demonstrated that the expression of FGFR3 was higher in low stage
BC. Du et al (21) identified
a gene pathway linking FGFR3 with sterol and lipid metabolism
through transcriptional profiling of BC cells subjected to short
hairpin (sh)RNA knockdown of FGFR3 (21). FGFR3 has been demonstrated to be a
promising therapeutic target for BC (22,23).
However, the molecular mechanisms of FGFR3 activation, via
overexpression or activating mutation, in BC remain to be
elucidated.
The present study aimed to analyze microarray data
in order to investigate the changes in gene expression profiles
that occur following loss of FGFR3; in addition, the current study
aimed to explore the target genes and molecular mechanisms of FGFR3
The genes that were differentially expressed in FGFR3-deleted cell
lines as compared with the control cell lines were considered to be
potential transcriptional targets of over-expressed FGFR3 in
bladder cancer. Furthermore, a protein-protein interaction (PPI)
network was constructed and the disturbed biological pathways were
identified following FGFR3 knockdown in order to explore the
pathogenesis and occurrence of BC associated with FGFR3.
Materials and methods
Messenger RNA expression profile data
of BC
The transcription profile dataset of BC was obtained
from National Center of Biotechnology Information Gene Expression
Omnibus database (http://www.ncbi.nlm.nih.gov/geo/). The accession
number was GSE41035 and the dataset consisted of a total of 24 mRNA
samples, including 18 experimental samples collected from RT112
cell lines, with FGFR3 shRNA 2–4, FGFR3 shRNA 4-1 or FGFR3 shRNA
6–16, as well as 6 control enhanced green fluorescent protein
(EGFP) shRNA samples. The platform used was GPL570 Affymetrix Human
Genome U133 Plus 2.0 array (Affymetrix, Inc., Santa Clara, CA,
USA). The original CEL files and the annotations file were
downloaded based on this platform.
Identification of differentially
expressed genes (DEGs)
Probe-level data in the CEL files were first
converted into expression measures. For each sample, the expression
values of all probes for a given gene were reduced to a single
value by taking the average expression value. Subsequently, missing
data was imputed and quartile data normalization was performed by
robust multichip averaging using Affy package in R software
(version 3.1; http://www.bioconductor.org/packages/release/bioc/html/affy.html)
(24). The Limma package version
3.24.2 (http://www.bioconductor.org/packages/release/bioc/html/limma.html)
(25) in R language with multiple
testing correction was then used according to the Benjamini &
Hochberg method (26) in order to
identify DEGs between BC samples and normal controls. P<0.05 and
|log(fold change; FC)|>1 were defined as the thresholds.
Gene ontology (GO) enrichment
analysis
In order to investigate DEGs at the molecular and
functional level, the online biological tool, Database for
Annotation, Visualization and Integrated Discovery (DAVID) version
6.7 (http://david.abcc.Ncifcrf.gov/), was
used for GO term enrichment and genes were clustered according to
GO. GO is a collection of controlled vocabularies, which include
molecular function, cellular component and biological process, to
describe the biology of a gene product in any organism. P<0.05
was selected as the cut-off criterion during the analysis.
Pathway enrichment analysis
The theoretical principle for enrichment analysis is
that associated functional genes are more likely to be selected in
the abnormal biological process by the high-through screening
technologies (27). Based on the
selected genes, researchers are able to correctly identify the
biological processes involved. In order to identify the enriched
pathways of DEGs, DAVID was used with P<0.05 as the threshold.
The pathways used as DAVID input for cluster analysis were from
Kyoto Encyclopedia of Genes and Genomes (KEGG; http://www.genome.jp/kegg/) and BIOCARTA (http://www.biocarta.com/).
PPI network construction
PPIs are crucial for all biological processes. In
the present study, the PPI network was constructed based on the
Protein Interaction Network Analysis platform (PINA2) database
(http://cbg.garvan.unsw.edu.au/pina/).
PINA2 (28) is a database containing
known and predicted associations of protein interaction. The
interactions include direct (physical) and indirect (functional)
associations. Of note, the protein names in the Universal Protein
Resource database (http://www.ebi.ac.uk/uniprot/remotingAPI/), which
correspond to the DEGs, were submitted to construct the PPI
network. Here Cytoscape software (version 3.2.1; http://cytoscape.org/) (29) was used to visualize the PPI network to
further observe the associations between genes.
Analysis of co-expressed genes
DEGs only explain a limited number of mechanisms of
FGFR3-shRNA in BC. However, analysis of differential co-expression
genes may reveal two or several similar genes with similar
expression patterns across a set of samples. Co-expression genes
were hypothesized to have a functional association, such as
physical interaction between the encoded proteins (30,31). In
order to further explore the pathogenesis of BC in the present
study, the differential coexpression enrichment (DCe) function in
DGCL package (32) version 2.1.2
(http://cran.r-project.org/web/packages/DCGL/index.html)
in R language was used and the parameters in the function were set
to default values. P<0.05 and the maximum absolute correlation
coefficient >1.5 were set as thresholds.
Results
Identification of DEGs
The Limma package was used to analyze the
transcription profile data between the experimental and control
samples. P<0.05 and |logFC|>1 were used as the significant
thresholds for DEGs. Based on these criteria, a total of 196 DEGs
were identified, among which 101 were downregulated and 95 were
upregulated.
GO analysis
Functional classification was performed using the
online biological tool DAVID, with a threshold of P<0.05.
Table I demonstrates the top ten
significantly enriched GO terms when these DEGs were classified
according to biological process. This analysis revealed that the
most enriched functions detected in FGFR3 knockdown samples
compared with control samples were the biosynthesis of sterol
(P=8.87×10⁻⁸)and metabolism of sterol
(P=1.58×10⁻⁷) or steroid (P=3.52×10⁻⁷). In
addition, oxidation reduction, extracellular region part and
identical protein process were also demonstrated to be
enriched.
 | Table I.Clustering of differentially
expressed genes based on biological process. |
Table I.
Clustering of differentially
expressed genes based on biological process.
| GO ID | GO name | Gene
numbera | P-value |
|---|
| GO:0016126 | Sterol biosynthetic
process | 8 |
8.87×10⁻⁸ |
| GO:0016125 | Sterol metabolic
process | 11 |
1.58×10⁻⁷ |
| GO:0008202 | Steroid metabolic
process | 14 |
3.52×10⁻⁷ |
| GO:0008203 | Cholesterol
metabolic process | 10 |
7.47×10⁻⁷ |
| GO:0055114 | Oxidation
reduction | 22 |
6.80×10⁻⁶ |
| GO:0006695 | Cholesterol
biosynthetic process | 6 |
8.27×10⁻⁶ |
| GO:0044421 | Extracellular
region part | 27 |
3.78×10⁻⁵ |
| GO:0006694 | Steroid
biosynthetic process | 8 |
4.11×10⁻⁵ |
| GO:0042802 | Identical protein
binding | 20 |
4.16×10⁻⁵ |
| GO:0008299 | Isoprenoid
biosynthetic process | 5 |
5.97×10⁻⁵ |
Analysis of the biological pathways of
DEGs
The gene transcription profile was significantly
altered in experimental samples compared with control samples.
These DEGs were selected for KEGG and BIOCATRA pathway enrichment
analysis. As shown in Table II,
according to the threshold of P<0.05, six biological pathways
were significantly enriched. Consistent with the results of the GO
enrichment analysis, these pathways were primarily associated with
biosynthesis and metabolism, including steroid biosynthesis
(P=4.80×10⁻⁵) and arachidonic acid metabolism
(P=0.03285).
| Table II.Biological pathways in bladder cancer
cells. |
Table II.
Biological pathways in bladder cancer
cells.
| Category | Pathway name | P-value | Gene name |
|---|
| KEGG | Steroid
biosynthesis |
4.80×10⁻⁵ | CYP51A1, SQLE,
DHCR7, FDFT1, SC4MOL |
| KEGG | Terpenoid backbone
biosynthesis |
7.77×10⁻⁴ | HMGCR, FDPS, IDI1,
ACAT2 |
| BIOCARTA | Fibrinolysis
pathway | 0.009393 | SERPINB2, PLAU,
F2R |
| KEGG | Arachidonic acid
metabolism |
0.03285 | PLA2G4A, PLA2G10,
GPX3, CYP4F3 |
| KEGG | Complement and
coagulation cascades | 0.045395 | F5, CFD, PLAU,
F2R |
| BIOCARTA | Nuclear receptors
in lipid metabolism and toxicity | 0.047437 | CYP24A1, ABCG1,
CYP4B1 |
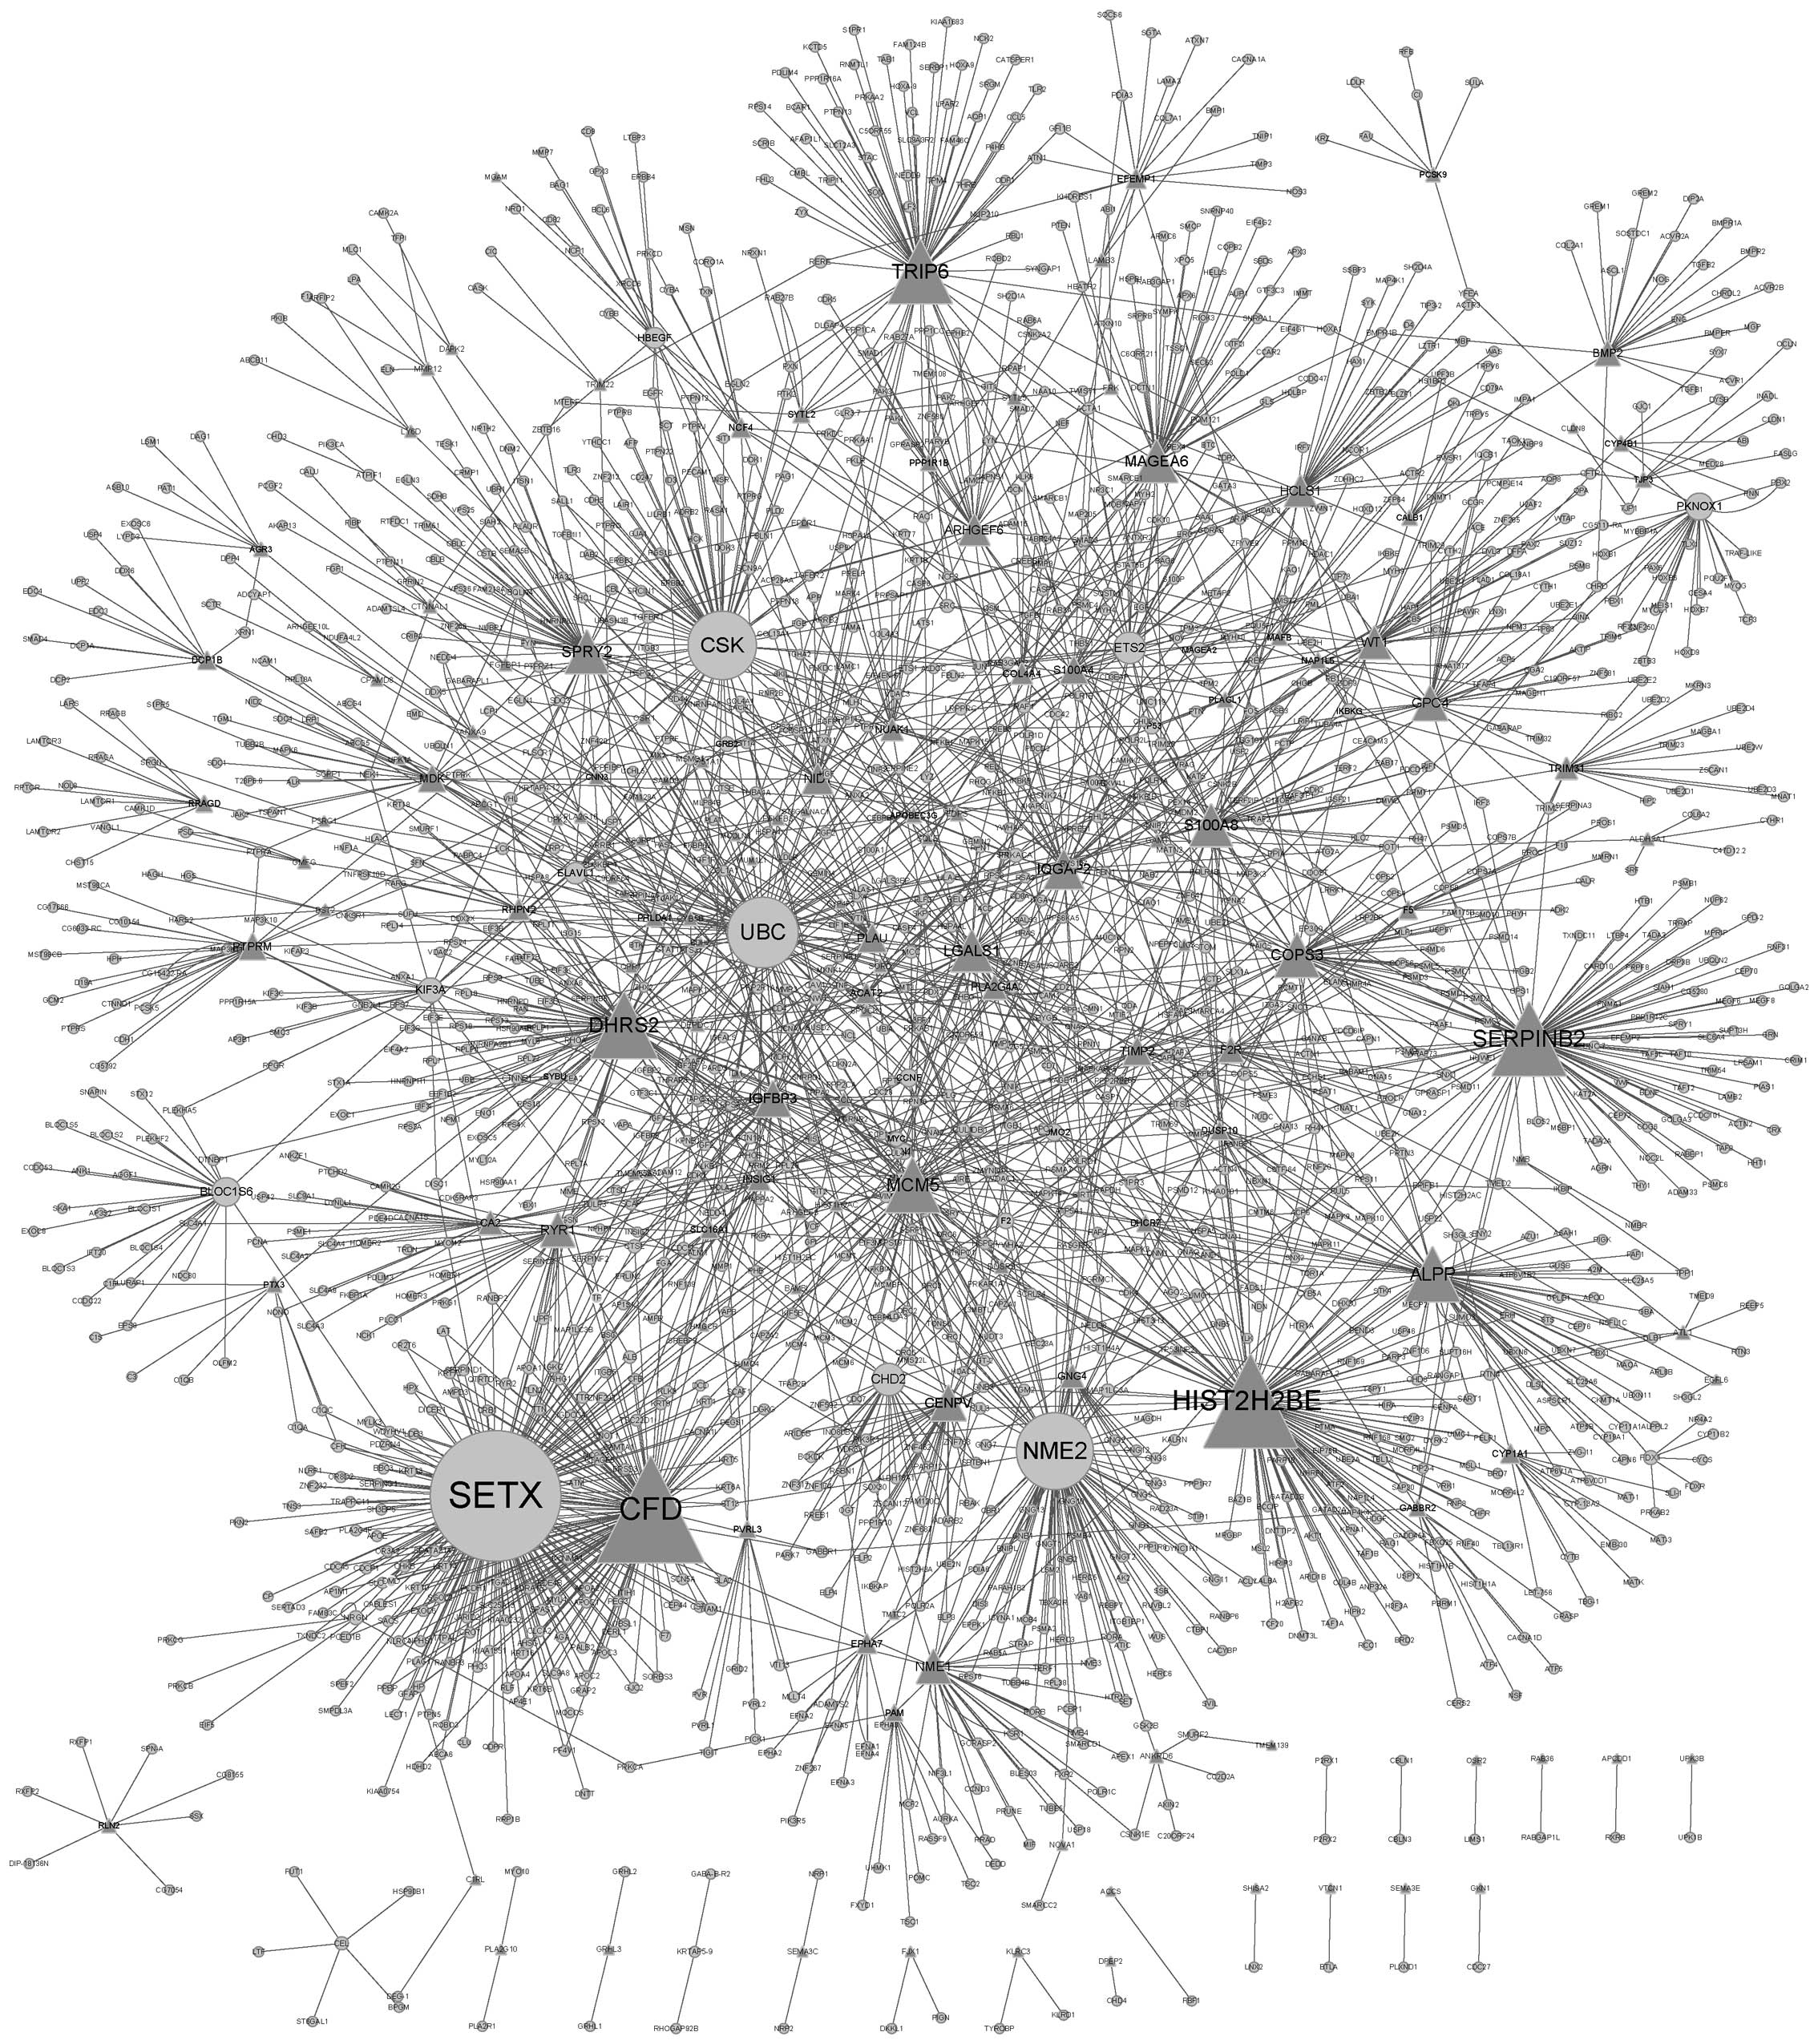
PPI network construction
DEGs were mapped to a PINA2 database and a PPI
network was constructed. The PPI network identified 1,865 genes,
with 2,482 interactions between them (Fig. 1). Genes that had more interactions
with other genes may have a critical role in BC. Table III demonstrates the DEGs with the
ten highest degrees of gene interactions identified in these
samples. The gene SETX was reported to have the highest degree
(degree, 159), which indicated that it may have an important role
in FGFR3-regulated BC.
| Table III.Ten highest degrees of interaction
and the corresponding differentially-expressed genes. |
Table III.
Ten highest degrees of interaction
and the corresponding differentially-expressed genes.
| Gene name | Degree |
|---|
| SETX | 159 |
| CFD | 127 |
| HIST2H2BE | 110 |
| NME2 | 88 |
| SERPINB2 | 85 |
| UBC | 80 |
| CSK | 77 |
| DHRS2 | 75 |
| TRIP6 | 72 |
| MCM5 | 60 |
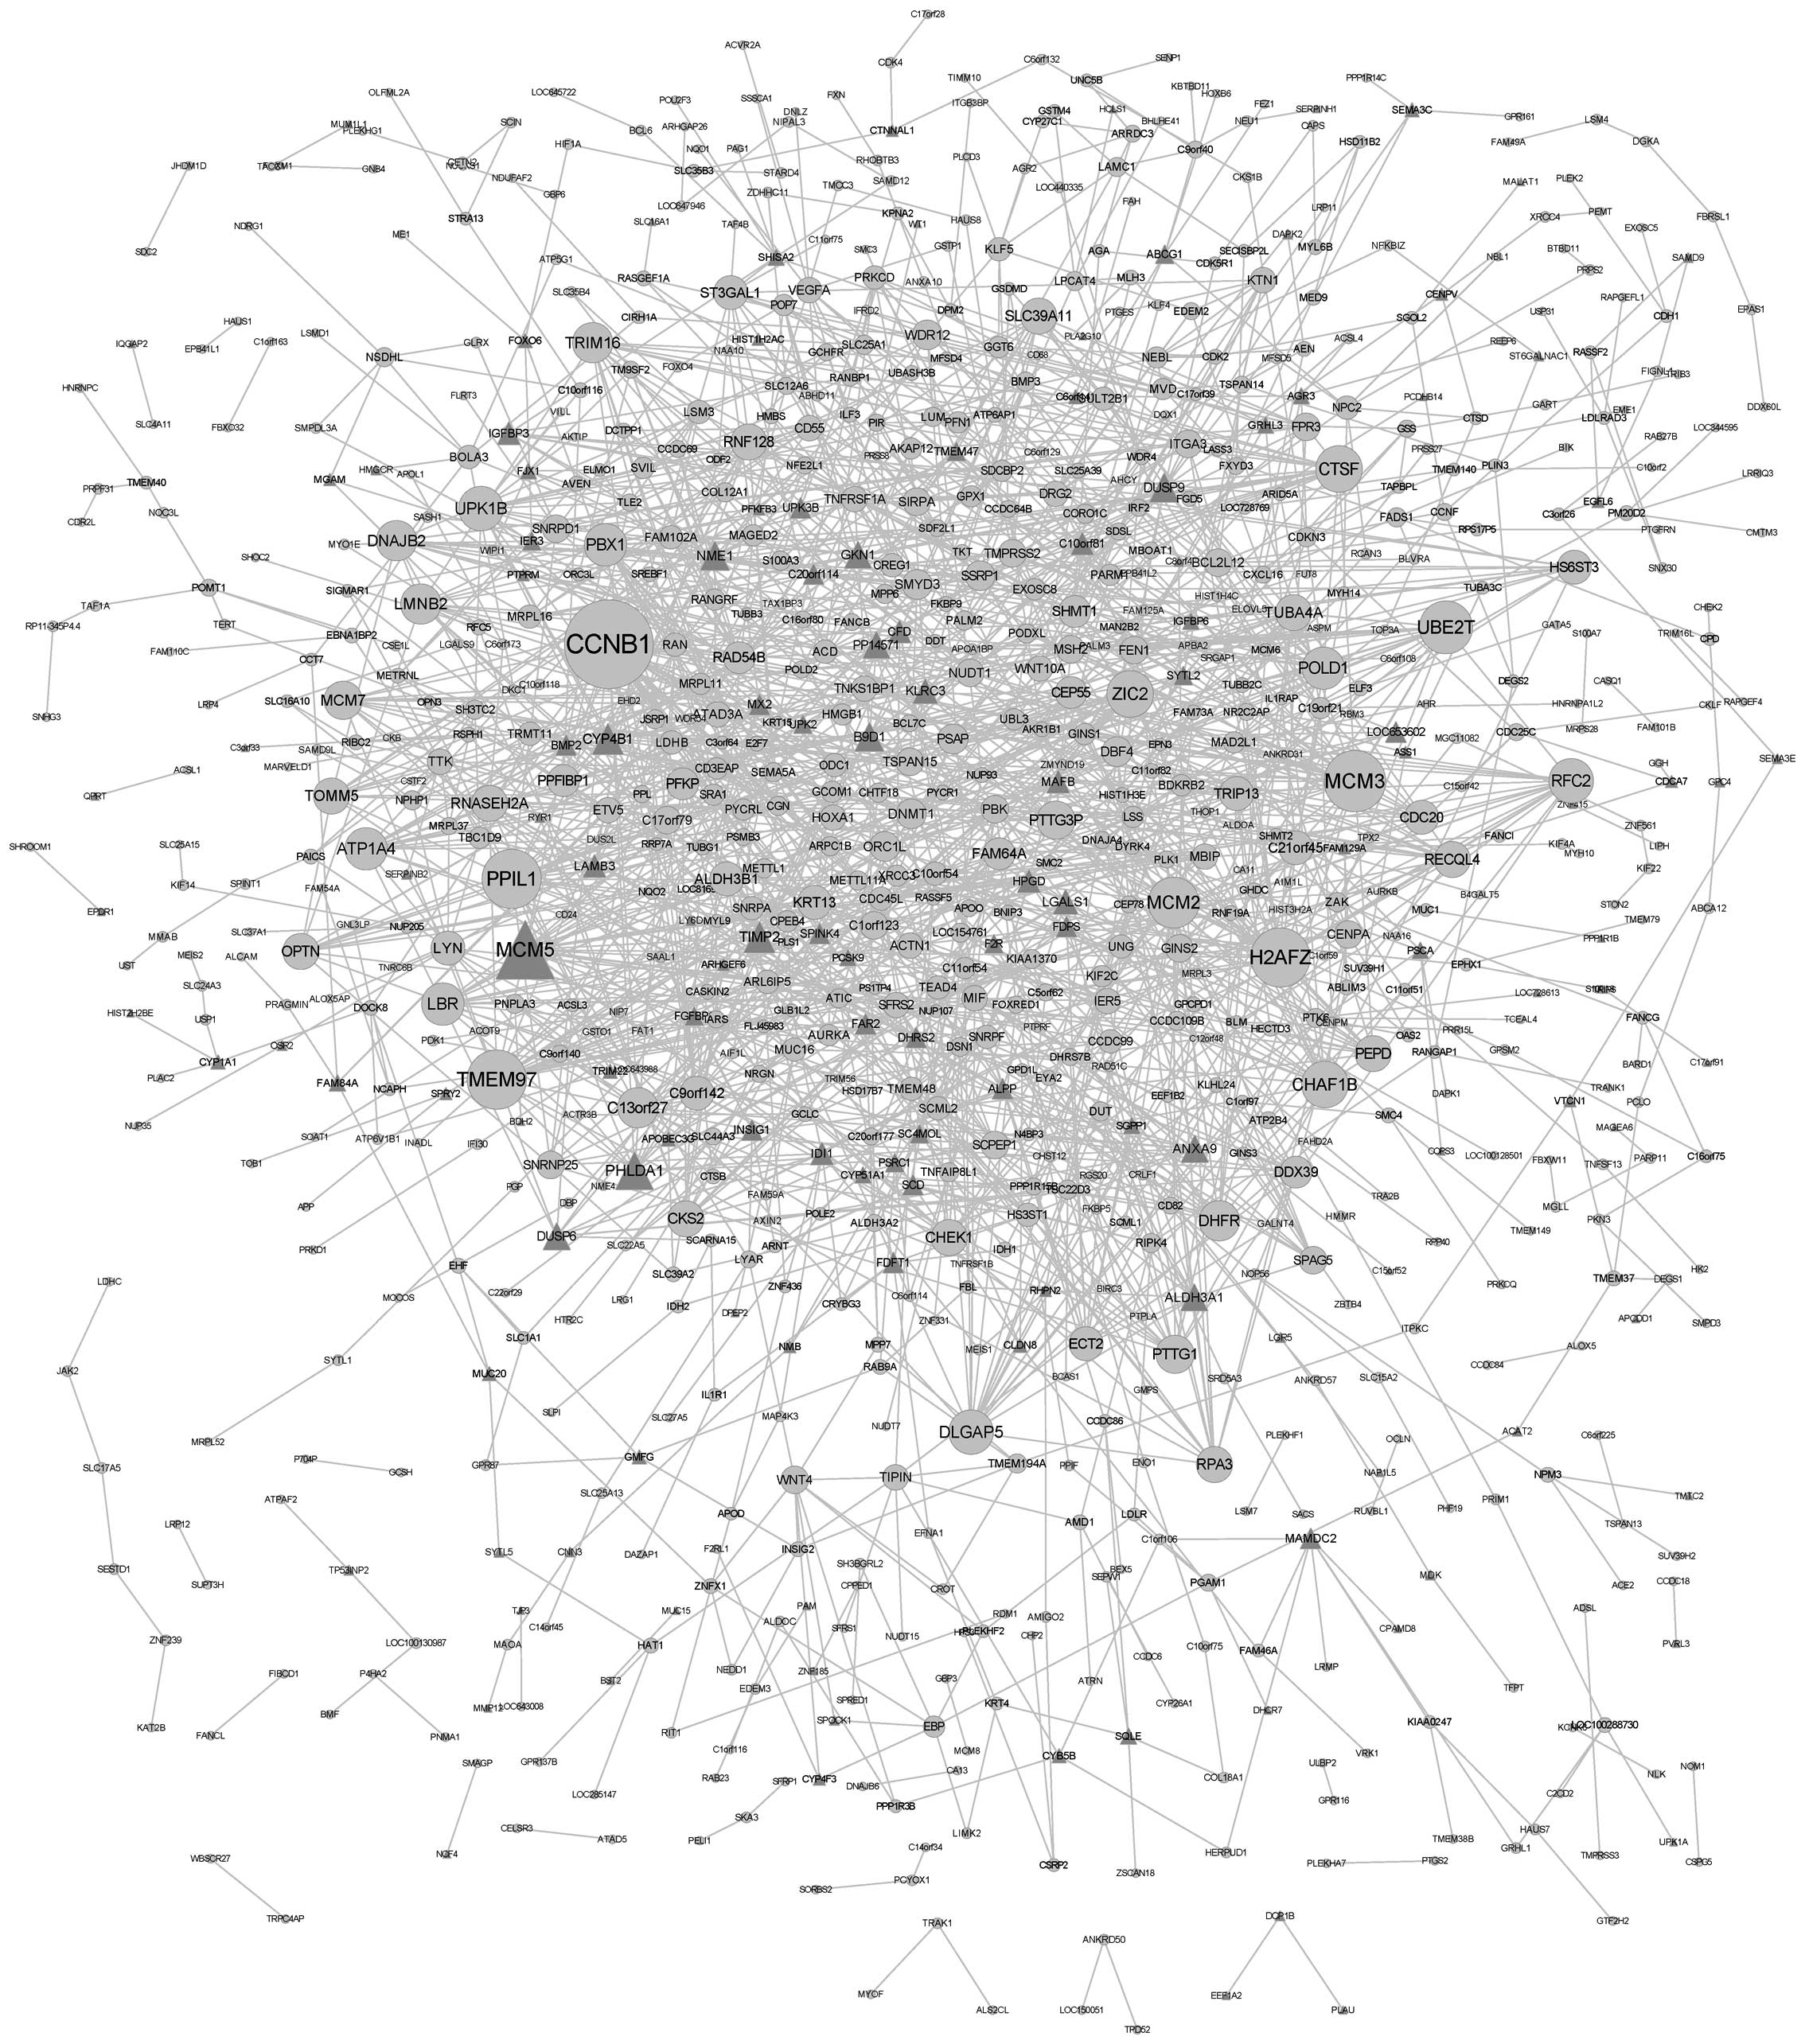
Analysis of co-expressed genes
Co-expressed genes were identified using DCe
function in R language; a gene co-expression network was then
constructed and visualized using Cytoscape. The network involved
1,935 co-expression associations between 140 differentially
co-expressed genes and 798 non-differentially co-expressed genes
(Fig. 2). Table IV lists the differentially
co-expressed genes with the ten highest degrees of gene
interactions, among which CCNB1 was the top hub gene with the
highest degree (degree, 39).
| Table IV.Ten highest degrees of interaction
and the corresponding differentially co-expressed genes. |
Table IV.
Ten highest degrees of interaction
and the corresponding differentially co-expressed genes.
| Gene name | Degree |
|---|
| CCNB1 | 39 |
| MCM3 | 26 |
| TMEM97 | 25 |
| MCM5 | 25 |
| H2AFZ | 25 |
| PPIL1 | 25 |
| UBE2T | 22 |
| MCM2 | 21 |
| CTSF | 19 |
| ZIC2 | 19 |
Discussion
BC is the fourth most common type of solid cancer in
men and the seventh most common in women, worldwide. Although
mutations and overexpression of FGFR3 have been associated with BC,
the biological mechanisms underlying its pathogenesis remain to be
fully elucidated. The present study aimed to analyze DEGs based on
the transcription profile data of experimental FGFR3 knockdown
samples and control EGFP shRNA samples. A total of 196 genes were
identified to be differentially expressed in FGFR3 knockdown
bladder cancer cell lines in comparison with control cell lines. GO
and pathway enrichment analysis were conducted; in addition, a PPI
network of DEGs and a differential co-expression network were
constructed.
In the present study, the results of the GO analysis
as well as the KEGG and BIOCATRA pathway enrichment analysis
revealed that the primary biological process in which these DEGs
were involved was sterol biosynthesis and metabolism. These results
were consistent with those of a previous study, which demonstrated
that FGFR3 may affect BC through the biosynthesis of sterol and
lipids (21). Activation of FGFR3 was
reported to promote the accumulation of mature sterol-regulatory
element binding protein (SREBP)-1 through the PI3K-mTOR complex 1
pathway (21). SREBPs belong to the
basic helix-loop-helix-leucine zipper family of transcription
factors, which include SREBP-1a, SREBP-1C and SREBP-2. These
transcription factors have been reported to be regulators of the
activation or expression of enzymes in lipid and cholesterol
homeostasis (33). Such enzymes
include lanosterol-14α-demethylase, squalene epoxidase
monooxygenase, sterol-Δ7-reductase, farnesyl-diphosphate
farnesyl transferase 1 and sterol-C4-methyl oxidase, encoded for by
CYP51A1, SQLE, DHCR7, FDFT1 and SC4MOL, respectively, which were
genes identified in the present study to be involved in the top
biological process affected by FGFR3 knockdown in BC, steroid
biosynthesis. When sterol concentrations are low, SREBPs bind with
SREBP cleavage-activating protein and mature SREBPs activate the
biosynthesis of sterol (34). Wu
et al (35) and Degener et
al (36) revealed an association
between the metabolism of steroid or bile acid and bladder cancer.
Therefore, it was hypothesized that FGFR3 may regulate the
corresponding target genes, which in turn affects the metabolism
and biosynthesis of steroid substances and subsequently affects
BC.
The genes with the ten highest degrees of
interaction in the PPI network constructed in the present study
were SETX, CFD, HIST2H2BE, NME2, SERPINB2, UBC, CKS, DHRS2, TRIP6
and MCM5. NME2, also known as NM23-H2, encodes nucleoside
diphosphate kinase (NDPK)-B, which catalyzes the transposition of
γ-phosphate between nucleosides (37). In addition, NME2 is known to be a
motility and metastasis suppressor (38), which may inhibit cancer, as cells must
survive and proliferate to become overt metastases. NME1, also
known as NM23-H2, is a paralog of NME2, with 88% amino acid
identity, and was first discovered to be a metastasis suppressor by
Steeg et al (39) in 1988.
Yong et al (40) studied the
differential expression of NM23-H1 in BC and normal bladder cases
using the immunohistochemical technique streptavidin-peroxidase
procedure and demonstrated that the positive expression rates of
NM23-H1 were 62.3 and 100.0% in BC and normal bladder,
respectively. With disease progression, the positive expression
rate decreased indicating its important role in BC (40). NM23 phosphorylates kinase suppressor
of Ras and prevents downstream activation of the MAPK pathway
(41). Therefore, FGFR3 expression
may lead to the activation of the MAPK pathway. Furthermore,
numerous studies have provided evidence to suggest that the NME2
gene may be associated with cancer (42,43).
Co-expression genes were hypothesized to have
functional associations, such as physical interactions, between the
encoded proteins. In the present study, the gene co-expression
network containing 168 differentially co-expressed genes and 1,935
associations were built. The genes with the highest degrees of
interaction were CCNB1, MCM3, TMEM97, MCM5, H2AFZ, PPIL1, UBE2T,
MCM2, CTSF and ZIC2. CCNB1, encoding cyclin B1, was reported to
contribute to the regulation of G2-M-phase transition,
which is essential for DNA synthesis and cell proliferation
(44). Dysregulated expression of
CCNB1 may therefore result in uncontrolled growth and malignant
transformation (45). Of note, CCNB1
is one of the 11 genes to predict outcome in several types of
cancer, including BC (46). Yuan
et al (47) reported that the
specific downregulation of CCNB1 may lead to tumor regression
through preventing the progression of cells in G2 phase
and triggering cell death. H2AFZ encodes H2A histone family, member
Z, which is a variant of histone H2A and is responsible for the
thermosensory response and regulating euchromatin-heterochromatin
transition (48). H2AFZ may have a
role in high-grade cancer due to its ability to regulate a large
numbers of genes (49). Dong et
al (50) revealed that H2AFZ was
overexpressed in BC and may be applied to the diagnosis of BC.
In conclusion, according to the expression profile
data of FGFR3 knockdown in BC, the present study identified 196
DEGs. GO analysis as well as KEGG and BIOCATRA pathway enrichment
analysis revealed that the primary biological process in which
these DEGs were involved was sterol biosynthesis and metabolism. In
addition, PPI networks of DEGs and co-expressed genes were
constructed and revealed the information flow of PPIs. This
comprehensive expression profile data of BC provided novel insight
into the pathogenesis and occurrence of BC associated with
FGFR3.
References
|
1
|
Bryan RT: Update on bladder cancer
diagnosis and management. Trends in Urology and Men's Health.
4:7–11. 2013.
|
|
2
|
Ploeg M, Aben KK and Kiemeney LA: The
present and future burden of urinary bladder cancer in the world.
World J Urol. 27:289–293. 2009. View Article : Google Scholar : PubMed/NCBI
|
|
3
|
Billerey C, Chopin D, Aubriot-Lorton MH,
et al: Frequent FGFR3 mutations in papillary non-invasive bladder
(pTa) tumors. Am J Pathol. 158:1955–1959. 2001. View Article : Google Scholar : PubMed/NCBI
|
|
4
|
Heney NM: Natural history of superficial
bladder cancer. Prognostic features and long-term disease course.
Urol Clin North Am. 19:429–433. 1992.PubMed/NCBI
|
|
5
|
Parkin DM: The global burden of urinary
bladder cancer. Scand J Urol Nephrol Suppl. 218:12–20. 2008.
View Article : Google Scholar : PubMed/NCBI
|
|
6
|
Boffetta P: Tobacco smoking and risk of
bladder cancer. Scand J Urol Nephrol Suppl. 218:45–54. 2008.
View Article : Google Scholar : PubMed/NCBI
|
|
7
|
Zeegers MP, Tan FE, Dorant E and van Den
Brandt PA: The impact of characteristics of cigarette smoking on
urinary tract cancer risk: A meta-analysis of epidemiologic
studies. Cancer. 89:630–639. 2000. View Article : Google Scholar : PubMed/NCBI
|
|
8
|
Sánchez-Carbayo M and Cordon-Cardó C:
Molecular alterations associated with bladder cancer progression.
Semin Oncol. 34:75–84. 2007. View Article : Google Scholar : PubMed/NCBI
|
|
9
|
Cordon-Cardo C: Molecular alterations
associated with bladder cancer initiation and progression. Scand J
Urol Nephrol Suppl. 218:154–165. 2008. View Article : Google Scholar : PubMed/NCBI
|
|
10
|
Ornitz DM, Xu J, Colvin JS, et al:
Receptor specificity of the fibroblast growth factor family. J Biol
Chem. 271:15292–15297. 1996. View Article : Google Scholar : PubMed/NCBI
|
|
11
|
Thompson LM, Plummer S, Schalling M, et
al: A gene encoding a fibroblast growth factor receptor isolated
from the Huntington disease gene region of human chromosome 4.
Genomics. 11:1133–1142. 1991. View Article : Google Scholar : PubMed/NCBI
|
|
12
|
Perez-Castro AV, Wilson J and Altherr MR:
Genomic organization of the human fibroblast growth factor receptor
3 (FGFR3) gene and comparative sequence analysis with the mouse
Fgfr3 Gene. Genomics. 41:10–16. 1997. View Article : Google Scholar : PubMed/NCBI
|
|
13
|
Pandith AA, Shah ZA and Siddiqi MA:
Oncogenic role of fibroblast growth factor receptor 3 in
tumorigenesis of urinary bladder cancer. Urol Oncol. 31:398–406.
2013. View Article : Google Scholar : PubMed/NCBI
|
|
14
|
Turner N and Grose R: Fibroblast growth
factor signalling: From development to cancer. Nat Rev Cancer.
10:116–129. 2010. View
Article : Google Scholar : PubMed/NCBI
|
|
15
|
Passos-Bueno MR, Wilcox WR, Jabs EW,
Sertié AL, Alonso LG and Kitoh H: Clinical spectrum of fibroblast
growth factor receptor mutations. Hum Mutat. 14:115–125. 1999.
View Article : Google Scholar : PubMed/NCBI
|
|
16
|
Hernández S, de Muga S, Agell L, et al:
FGFR3 mutations in prostate cancer: association with low-grade
tumors. Mod Pathol. 22:848–856. 2009.PubMed/NCBI
|
|
17
|
Rosty C, Aubriot MH, Cappellen D, et al:
Clinical and biological characteristics of cervical neoplasias with
FGFR3 mutation. Mol Cancer. 4:152005. View Article : Google Scholar : PubMed/NCBI
|
|
18
|
Cappellen D, De Oliveira C, Ricol D, et
al: Frequent activating mutations of FGFR3 in human bladder and
cervix carcinomas. Nat Genet. 23:18–20. 1999. View Article : Google Scholar : PubMed/NCBI
|
|
19
|
Billerey C, Chopin D, Aubriot-Lorton MH,
et al: Frequent FGFR3 mutations in papillary non-invasive bladder
(pTa) tumors. Am J Pathol. 158:1955–1959. 2001. View Article : Google Scholar : PubMed/NCBI
|
|
20
|
Jebar AH, Hurst CD, Tomlinson DC, Johnston
C, Taylor CF and Knowles MA: FGFR3 and Ras gene mutations are
mutually exclusive genetic events in urothelial cell carcinoma.
Oncogene. 24:5218–5225. 2005. View Article : Google Scholar : PubMed/NCBI
|
|
21
|
Du X, Wang QR, Chan E, et al: FGFR3
stimulates stearoyl CoA desaturase 1 activity to promote bladder
tumor growth. Cancer Res. 72:5843–5855. 2012. View Article : Google Scholar : PubMed/NCBI
|
|
22
|
Tomlinson DC, Hurst CD and Knowles MA:
Knockdown by shRNA identifies S249C mutant FGFR3 as a potential
therapeutic target in bladder cancer. Oncogene. 26:5889–5899. 2007.
View Article : Google Scholar : PubMed/NCBI
|
|
23
|
Miyake M, Ishii M, Koyama N, et al:
1-tert-butyl-3-[6-(3,
5-dimethoxy-phenyl)-2-(4-diethylamino-butylamino)-pyrido [2, 3-d]
pyrimidin-7-yl]-urea (PD173074), a selective tyrosine kinase
inhibitor of fibroblast growth factor receptor-3 (FGFR3), inhibits
cell proliferation of bladder cancer carrying the FGFR3 gene
mutation along with up-regulation of p27 Kip1 and G1 G0 arrest. J
Pharmacol Exp Ther. 332:795–802. 2010. View Article : Google Scholar : PubMed/NCBI
|
|
24
|
Irizarry RA, Hobbs B, Collin F, et al:
Exploration, normalization and summaries of high density
oligonucleotide array probe level data. Biostatistics. 4:249–264.
2003. View Article : Google Scholar : PubMed/NCBI
|
|
25
|
Smyth GK: Limma: linear models for
microarray dataBioinformatics and Computational Biology Solutions
Using R and Bioconductor. Gentleman R, Carey V, Huber W, Irizarry
RA and Dudoit S: Springer; New York, NY: pp. 397–420. 2005
|
|
26
|
Benjamini Y and Hochberg Y: Controlling
the false discovery rate: A practical and powerful approach to
multiple testing. J Roy Statist Soc Ser B (Methodological).
57:289–300. 1995.
|
|
27
|
Huang da W, Sherman BT and Lempicki RA:
Systematic and integrative analysis of large gene lists using DAVID
bioinformatics resources. Nat Protoc. 4:44–57. 2009. View Article : Google Scholar : PubMed/NCBI
|
|
28
|
Cowley MJ, Pinese M, Kassahn KS, et al:
PINA v2.0: Mining interactome modules. Nucleic Acids Res.
40:(Database Issue). D862–D865. 2012. View Article : Google Scholar : PubMed/NCBI
|
|
29
|
Shannon P, Markiel A, Ozier O, et al:
Cytoscape: A software environment for integrated models of
biomolecular interaction networks. Genome Res. 13:2498–2504. 2003.
View Article : Google Scholar : PubMed/NCBI
|
|
30
|
Jansen R, Greenbaum D and Gerstein M:
Relating whole-genome expression data with protein-protein
interactions. Genome Res. 12:37–46. 2002. View Article : Google Scholar : PubMed/NCBI
|
|
31
|
Kemmeren P, van Berkum NL, Vilo J, et al:
Protein interaction verification and functional annotation by
integrated analysis of genome-scale data. Mol Cell. 9:1133–1143.
2002. View Article : Google Scholar : PubMed/NCBI
|
|
32
|
Liu BH, Yu H, Tu K, Li C, Li YX and Li YY:
DCGL: An R package for identifying differentially coexpressed genes
and links from gene expression microarray data. Bioinformatics.
26:2637–2638. 2010. View Article : Google Scholar : PubMed/NCBI
|
|
33
|
Yokoyama C, Wang X, Briggs MR, et al:
SREBP-1, a basic-helix-loop-helix-leucine zipper protein that
controls transcription of the low density lipoprotein receptor
gene. Cell. 75:187–197. 1993. View Article : Google Scholar : PubMed/NCBI
|
|
34
|
Porstmann T, Griffiths B, Chung YL, et al:
PKB Akt induces transcription of enzymes involved in cholesterol
and fatty acid biosynthesis via activation of SREBP. Oncogene.
24:6465–6481. 2005.PubMed/NCBI
|
|
35
|
Wu J, Liu J, Jia R and Song H: Nur77
inhibits androgen-induced bladder cancer growth. Cancer Invest.
31:654–660. 2013. View Article : Google Scholar : PubMed/NCBI
|
|
36
|
Degener S, Roth S, Mathers MJ and Ubrig B:
Follow-up care-consequences of urinary diversion after bladder
cancer. Urologe A. 53:253–262. 2014.(In German). View Article : Google Scholar : PubMed/NCBI
|
|
37
|
Lascu I: The nucleoside diphosphate
kinases 1973–2000. J Bioenerg Biomembr. 32:211–214. 2000.
View Article : Google Scholar
|
|
38
|
Rayner K, Chen YX, Hibbert B, et al:
Discovery of NM23-H2 as an estrogen receptor β-associated protein:
Role in estrogen-induced gene transcription and cell migration. J
Steroid Biochem Mol Biol. 108:72–81. 2008. View Article : Google Scholar : PubMed/NCBI
|
|
39
|
Steeg PS, Bevilacqua G, Kopper L, et al:
Evidence for a novel gene associated with low tumor metastatic
potential. J Natl Cancer Inst. 80:200–204. 1988. View Article : Google Scholar : PubMed/NCBI
|
|
40
|
Yong G: Expression of C-erbB-2, EGFR and
nm23-H1 in human bladder cancer and its clinical significance. Proc
Clin Med. 2011((5)): 333–365. 2011.
|
|
41
|
Cook LM, Hurst DR and Welch DR: Metastasis
suppressors and the tumor microenvironment. Semin Cancer Biol.
21:113–122. 2011. View Article : Google Scholar : PubMed/NCBI
|
|
42
|
Legin AA, Jakupec MA, Bokach NA, Tyan MR,
Kukushkin VY and Keppler BK: Guanidine platinum (II) complexes:
Synthesis, in vitro antitumor activity and DNA interactions. J
Inorg Biochem. 133:33–39. 2014. View Article : Google Scholar : PubMed/NCBI
|
|
43
|
Chen S, Su L, Qiu J, et al: Mechanistic
studies for the role of cellular nucleic-acid-binding protein
(CNBP) in regulation of c-myc transcription. Biochim Biophys Acta.
1830:4769–4777. 2013. View Article : Google Scholar : PubMed/NCBI
|
|
44
|
Poli A, Ramazzotti G, Matteucci A, et al:
A novel DAG-dependent mechanism links PKCα and Cyclin B1 regulating
cell cycle progression. Oncotarget. 30:11526–11540. 2014.
|
|
45
|
Soria JC, Jang SJ, Khuri FR, et al:
Overexpression of cyclin B1 in early-stage non-small cell lung
cancer and its clinical implication. Cancer Res. 60:4000–4004.
2000.PubMed/NCBI
|
|
46
|
Nakamura N, Yamamoto H, Yao T, et al:
Prognostic significance of expressions of cell-cycle regulatory
proteins in gastrointestinal stromal tumor and the relevance of the
risk grade. Hum Pathol. 36:828–837. 2005. View Article : Google Scholar : PubMed/NCBI
|
|
47
|
Yuan J, Krämer A, Matthess Y, et al:
Stable gene silencing of cyclin B1 in tumor cells increases
susceptibility to taxol and leads to growth arrest in vivo.
Oncogene. 25:1753–1762. 2006. View Article : Google Scholar : PubMed/NCBI
|
|
48
|
Xu Y, Ayrapetov MK, Xu C, et al: Histone
H2A.Z controls a critical chromatin remodeling step required for
DNA double-strand break repair. Mol Cell. 48:723–733. 2012.
View Article : Google Scholar : PubMed/NCBI
|
|
49
|
Meneghini MD, Wu M and Madhani HD:
Conserved histone variant H2A.Z protects euchromatin from the
ectopic spread of silent heterochromatin. Cell. 112:725–736. 2003.
View Article : Google Scholar : PubMed/NCBI
|
|
50
|
Dong L, Bard AJ, Richards WG, Nitz MD,
Theodorescu D, Bueno R and Gordon GJ: A gene expression ratio-based
diagnostic test for bladder cancer. Adv Appl Bioinform Chem.
2:17–22. 2009.PubMed/NCBI
|