Introduction
Gastric cancer (GC) is a common disease and is the
second leading cause of cancer-related mortality worldwide
(1). Recently, significant
developments have been made in the field of cancer-specific
targeted therapy, and fatty acid synthase (FAS) and human epidermal
growth factor receptor 2 (HER2) have emerged as possible markers of
GC (2–4).
Fatty acids (FAs), which are components of the
membrane and are essential in energy production, are absorbed from
foods (exogenous pathway) or synthesized from intracellular
substrates and enzymes (mainly through an endogenous pathway or
de novo synthesis). FAS is a key biosynthetic enzyme
involved in de novo synthesis, through which long chain FAs
(LCFAs) can be produced with acetyl-CoA, malonyl-CoA and NADPH as
substrates (5).
FAS is expressed in the liver, lipogenic tissues,
proliferating fetal cells and hormone-sensitive cells, but is
generally poorly expressed by non-tumor tissues (6–9). However,
it has been reported that FAS is highly expressed in several
cancers, including prostate, ovarian, breast, endometrial, thyroid,
colorectal, bladder, gastric and lung cancers (5,10).
Moreover, this pattern of expression in transformed tissues cannot
be modulated by physiological signals, as is occasionally the case
in non-tumor tissues. Therefore, tumors can perpetually synthesize
LCFAs to facilitate their proliferation and infiltration. At the
same time, FAS is becoming increasingly significant in tumor
diagnosis, prognosis and even treatment, particularly since a close
association has been proposed between energy metabolism and tumor
genesis (5,11). Several in vitro studies have
demonstrated the diagnostic value of FAS in cancer (12–14) or
precancerous lesions (15). However,
the role of FAS in gastric carcinogenesis has not been clearly
identified.
FAS expression is modulated in multiple ways in
cancer cells, one of which is through transcriptional regulation.
Extracellular stimulants can ultimately activate FAS gene
expression through the Ras/Raf/MAPK and PI3K/Akt pathways, but
numerous other factors are also important, such as HIF-1α, mTOR and
SPOT14 (16–18). In general, a complicated network of
molecules is involved in FAS-related carcinogenesis, including
HER2.
HER2 is a type of tyrosine kinase receptor that
belongs to the erbB family. Similar to FAS, HER2 has been proven to
be underexpressed in normal tissues, but in a number of tumors it
is abnormally overexpressed and activated, including GC where
patients with overexpression of HER2 have a morbidity rate of
10–30% (19). HER2 can activate
multiple downstream pathways, including the PI3K/Akt and
Ras/Raf/MAPK pathways, which are the upstream signals of FAS. On
the other hand, sufficient production of phospholipids for membrane
microdomains will result in accommodation of receptor tyrosine
kinases expressed on the membrane, including HER2 (20). Therefore, there appear to be certain
significant correlations between FAS and HER2, which may
synergistically modulate gastric carcinogenesis.
The roles that FAS has played in gastric
carcinogenesis are under investigation. Overexpression of
membranous HER2 (mHER2) in cancer tissues indicates a poor
prognosis. Anti-HER2 therapy has been recommended in the treatment
of HER2-positive GC patients (2), but
the exact effect of this approach is yet to be determined. The
experience gained from HER2-targeted therapy in breast cancer has
shown that drug resistance inevitably interrupts the process of
cancer treatment. Examinations of FAS and HER2 expression in breast
(21,22), ovarian (20) and oral (23) cancers has been performed in
vivo. However, few studies have investigated FAS expression or
its association with HER2 in GC. In the present study, FAS and HER2
expression patterns were examined in 94 GC tissues and compared
with adjacent non-tumor tissues. Finally, the expression of FAS and
HER2, and their association with clinicopathological features and
prognosis was examined in the GC patients.
Materials and methods
Ethics statement
The present study was approved by the Zhongshan
Hospital Review Board (Shanghai, China), and all enrolled patients
provided written informed consent to participate in the study.
Patients enrolled
A total of 94 patients with GC who underwent D2
surgery, performed by the same surgeon in Zhongshan Hospital
between 2000 and 2005, were consecutively enrolled in this study.
Prior to surgery, no therapy was administered to any of the
patients. All patients had a complete clinicopathological history
recorded, including age, gender, tumor size, histological grade,
American Joint Committee on Cancer (AJCC) tumor stage, depth of
invasion, lymph node metastasis and distant metastasis (24,25). All
patients presented with adenocarcinoma, and the median age of the
patients at the time of diagnosis was 60 years (range, 30–80
years). The histological grade of the tumor was evaluated under a
microscope and was categorized based on the degree of tumor
differentiation, tumor necrosis and mitotic count according to the
criteria of Enzinger and Weiss (26,27). Depth
of invasion and lymph node metastasis were evaluated based on the
National Comprehensive Cancer Network (NCCN) GC guideline (version
2011) (28). Follow-up time was
calculated as the time of the initial surgery for the primary tumor
until mortality or January 2013. The basic clinical information for
all 94 patients is listed in Table I.
Three of the patients presented positive for group no. 13 lymph
node metastasis when enrolled and a D2 radical surgery was
performed at that time according to the latest guidelines in 2011.
These patients were labeled as exhibiting phase IV disease.
 | Table I.Complete clinical information of 94
gastric cancer patients. |
Table I.
Complete clinical information of 94
gastric cancer patients.
|
Characteristics | Value |
|---|
| Gender, n (%) |
|
|
Male | 61 (64.89) |
|
Female | 33 (35.11) |
| Age, years |
|
|
Median | 60 |
|
Range | 30–80 |
| Histological type,
n (%) |
|
|
Adenocacinoma | 94
(100.00) |
|
Other | 0 (0.00) |
| Presentation, n
(%) |
|
|
Initial | 94
(100.00) |
|
Recurrent | 0 (0.00) |
| Size, cm |
|
|
Median | 3 |
|
Range | 0.3–10 |
| Differentiation, n
(%) |
|
| I | 6 (6.38) |
| II | 34 (36.17) |
|
III | 54 (57.45) |
| Metastasis, n
(%) |
|
|
Negative | 91 (96.81) |
|
Positive | 3 (3.19) |
| AJCC stage, n
(%) |
|
| I | 30 (31.91) |
| II | 18 (19.15) |
|
III | 43 (45.74) |
| IV | 3 (3.19) |
Tissue microarray (TMA)
construction
From each patient, two cancerous and two non-tumor
tissues (5 cm away from the tumor edge) were obtained for TMA
construction and immunohistochemical (IHC) staining.
Non-tumor/healthy tissues were defined as the paired gastric
tissues that were 5 cm away from the tumor edge. Tissue sections
(diameter, 1.5 mm; thickness, 4 µm) from archival, formalin-fixed,
paraffin-embedded tissue specimens were mounted on
poly-L-lysine-coated slides (Muto Chemicals, Tokyo, Japan). The
sections were deparaffinized in xylene for 15 min, rehydrated in
different concentrations of ethanol and then heated at 95°C for 5
min in 10 mM sodium citrate buffer (pH 6.0) in a microwave oven for
antigen retrieval. Endogenous peroxidase was sequentially
inactivated in 3% H2O for 15 min at room
temperature.
IHC staining of the TMAs
For FAS staining, the sections were blocked in 3%
normal donkey serum and subsequently incubated at 4°C overnight
with monoclonal anti-FAS antibody (dilution, 1:50; #3180; Cell
Signaling Technology, Inc., Danvers, MA, USA). Finally, the
sections were stained with horseradish peroxidase (HRP)-conjugated
donkey anti-rabbit immunoglobulin G (H+L) secondary antibody (Dako,
Inc., Carpinteria, CA, USA).
For HER2 staining, the sections were first placed
into a peroxidase-blocking reagent for 15 min. The primary antibody
(dilution, 1:10; #2242; Cell Signaling Technology, Inc.) specific
for HER2 was added and incubated at 4°C overnight. The sections
were covered with Dako Envision+/HRP donkey anti-rabbit secondary
antibody (Dako, Inc.) and incubated at room temperature for 30 min.
Signal detection was performed using a Dako signaling amplification
system (product no. K346811). The TMA was counterstained with
hematoxylin, then dehydrated and mounted for better tissue
structure identification. Certain other routine reagents were
provided by the Department of Pathology, Zhongshan Hospital
(Shanghai, China).
IHC score of FAS and HER2
All the IHC-stained slides were interpreted by one
pathologist blinded to the sample identities. IHC scoring of FAS
and HER2 was executed based on staining intensity and positivity.
For each specimen, the staining intensity of FAS and cytoplasmic
HER2 (cHER2) was scored as 0 for negative staining, 1 for weak
intensity, 2 for moderate intensity and 3 for high intensity. The
number of positive cells per section was categorized into three
groups based on the percentage of positive cells: Group 1, <33%;
group 2, 33–67%; and group 3, 68–100%, which were scored as 1, 2
and 3 respectively (positivity score). This method of positive
scoring was demonstrated by Vandhana et al in 2011 (29). Total scores according to the
semiquantitative immunoreactivity scoring (IRS) method were
obtained by multiplying the staining intensity by the positivity
score, leading to a range from 0 to 9. Ultimate scores (US) of FAS
[US(FAS)] and cHER2 [US(cHER2)] were defined as the average of each
of the two total scores for one tissue (two sections). Next,
US(FAS) and US(cHER2) was categorized into two grades using the
area under curve method for further analysis as follows: Weak
staining for US(FAS), <6.75; strong staining for US(FAS), ≥6.75;
weak staining for US(cHER2), <6; and strong staining for
US(cHER2), ≥6.
mHER2 IHC scoring was also performed based on
intensity and positivity. The intensity of expression for each
section was scored using four categories: 0+, meaning that there
was no membranous staining in any of the tumor cells; 1+, meaning
that there was membranous staining in <10% of the tumor cells
with any intensity or in <30% of the tumor cells with weak
intensity; 2+, meaning that there was staining in 10–30% of the
tumor cells with moderate to strong intensity or staining in 30–50%
of the tumor cells with weak to moderate intensity; and 3+, meaning
that there was staining in >30% of the tumor cells with strong
intensity or >50% of the tumor cells with any intensity. The
average of the two scores for the same tissue was defined as the
US(mHER2) ranging from 0 to 3. Tissues with a US(mHER2) score of ≤2
were classified as overexpressed (positive) (30). The schematic of the IHC staining for
FAS and HER2 is shown in Fig.
1A–H.
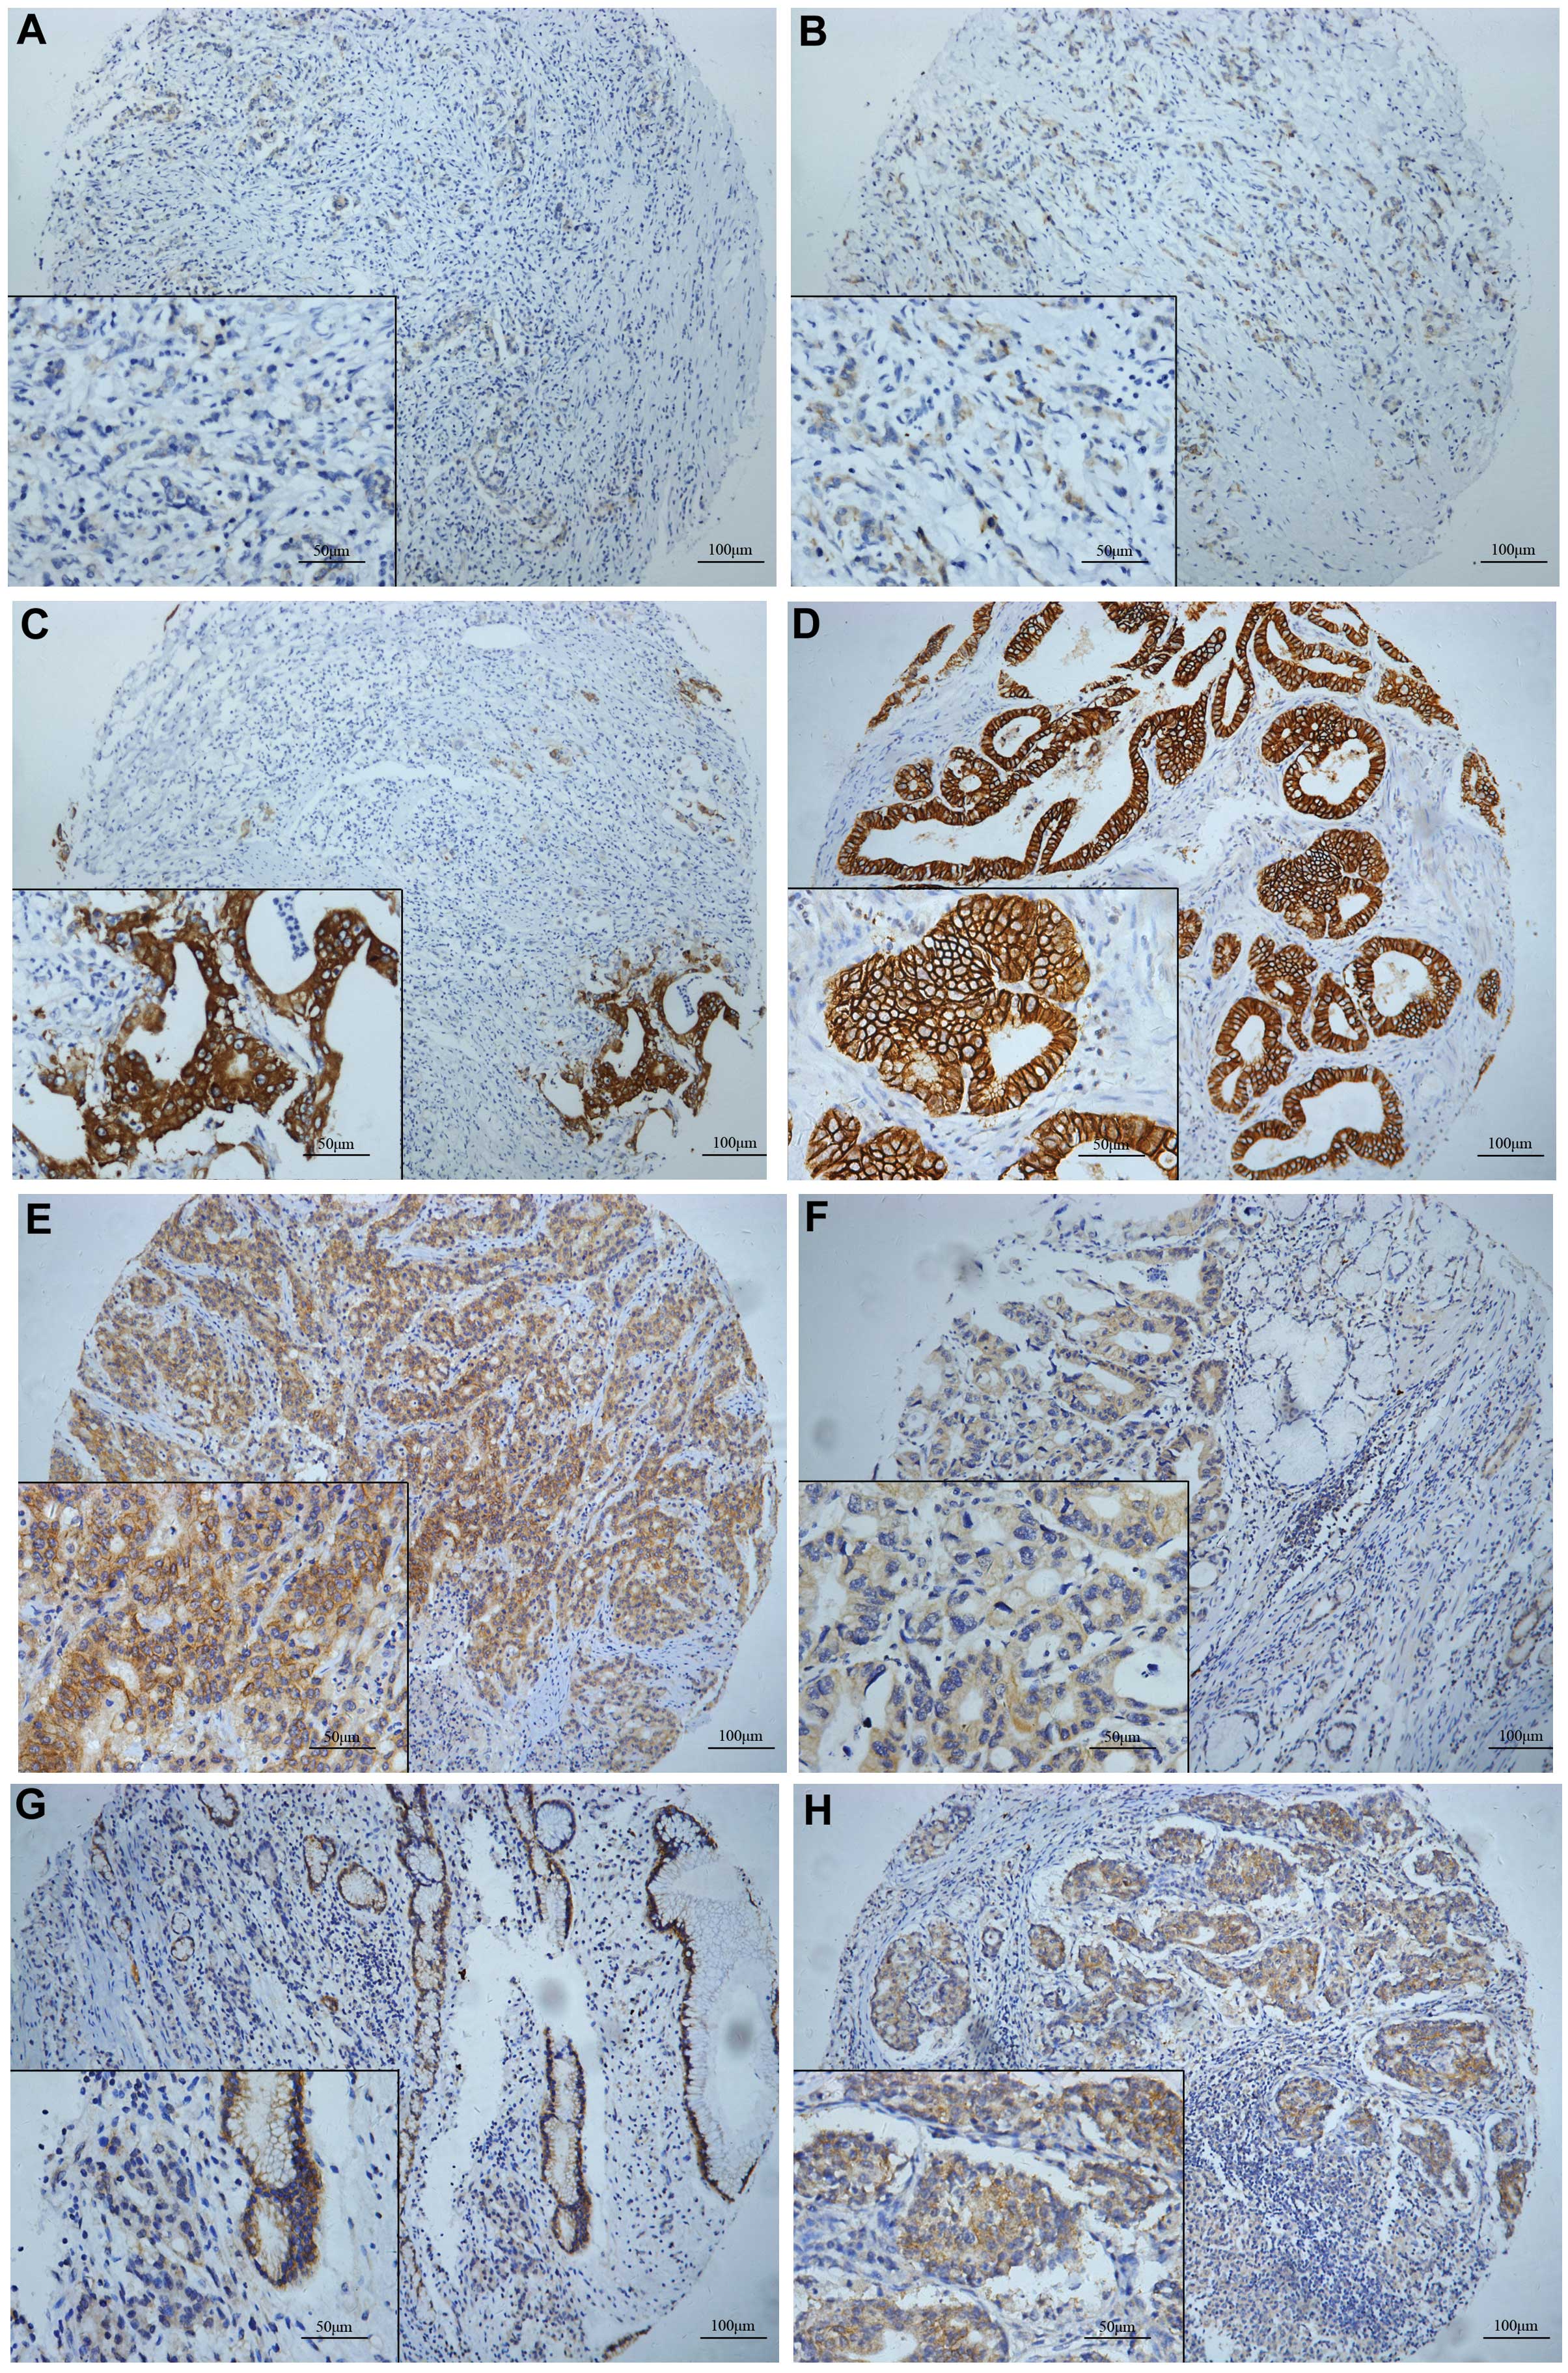 | Figure 1.Fatty acid synthase (FAS) and human
epidermal growth factor receptor 2 (HER2) expression in gastric
cancer (GC) tissues. (A-C) Immunohistochemical staining of FAS in
GC tissues. FAS was expressed in the cytoplasm according to
different staining grades as follows: (A) Intensity, 1; positivity,
60%; (B) intensity, 2; positivity, 70%; and (C) intensity, 3;
positivity, 90%. The cytoplasm and membrane stained for HER2. (D)
Cytoplasmic (c)HER2: Intensity, 0; memranous (m)HER2: Intensity, 3;
positivity, 95%; (E) cHER2: Intensity, 2; positivity, 90%; mHER2:
Intensity, 2; positivity, 60%; (F) cHER2: Intensity, 2; positivity,
90%; mHER2: Intensity, 1; positivity, 20%; (G) cHER2: Intensity, 1;
positivity, 60%; mHER2: Intensity, 0; (H) cHER2: Intensity, 3;
positivity, 80%; mHER2: Intensity, 3; positivity, 20%. Neither FAS
or HER2 were expressed in the nucleus. (A-C, E, G and H) Poor
differentiation. (D and F) Good or moderate differentiation. |
Statistical analysis
The data were analyzed with GraphPad Prism 5
(GraphPad Software, Inc., La Jolla, CA, USA) for Windows. The
paired t-test was used to compare the FAS and HER2 expression
levels in the cancer tissues with those in the non-tumor tissues.
Contingency Table analysis and χ2 tests were used to
investigate the correlation between FAS and HER2 protein expression
and clinical parameters, and the Fisher's exact test was used when
qualified. The correlation between FAS and HER2 was determined
mainly by using the Mann-Whitney rank test or unpaired t-test. The
survival rate was estimated using the Kaplan-Meier method. Any
difference in survival curves was compared by Wilcoxon test and a
hazard ratio was obtained. P<0.05 was used to indicate a
statistically significant difference.
Results
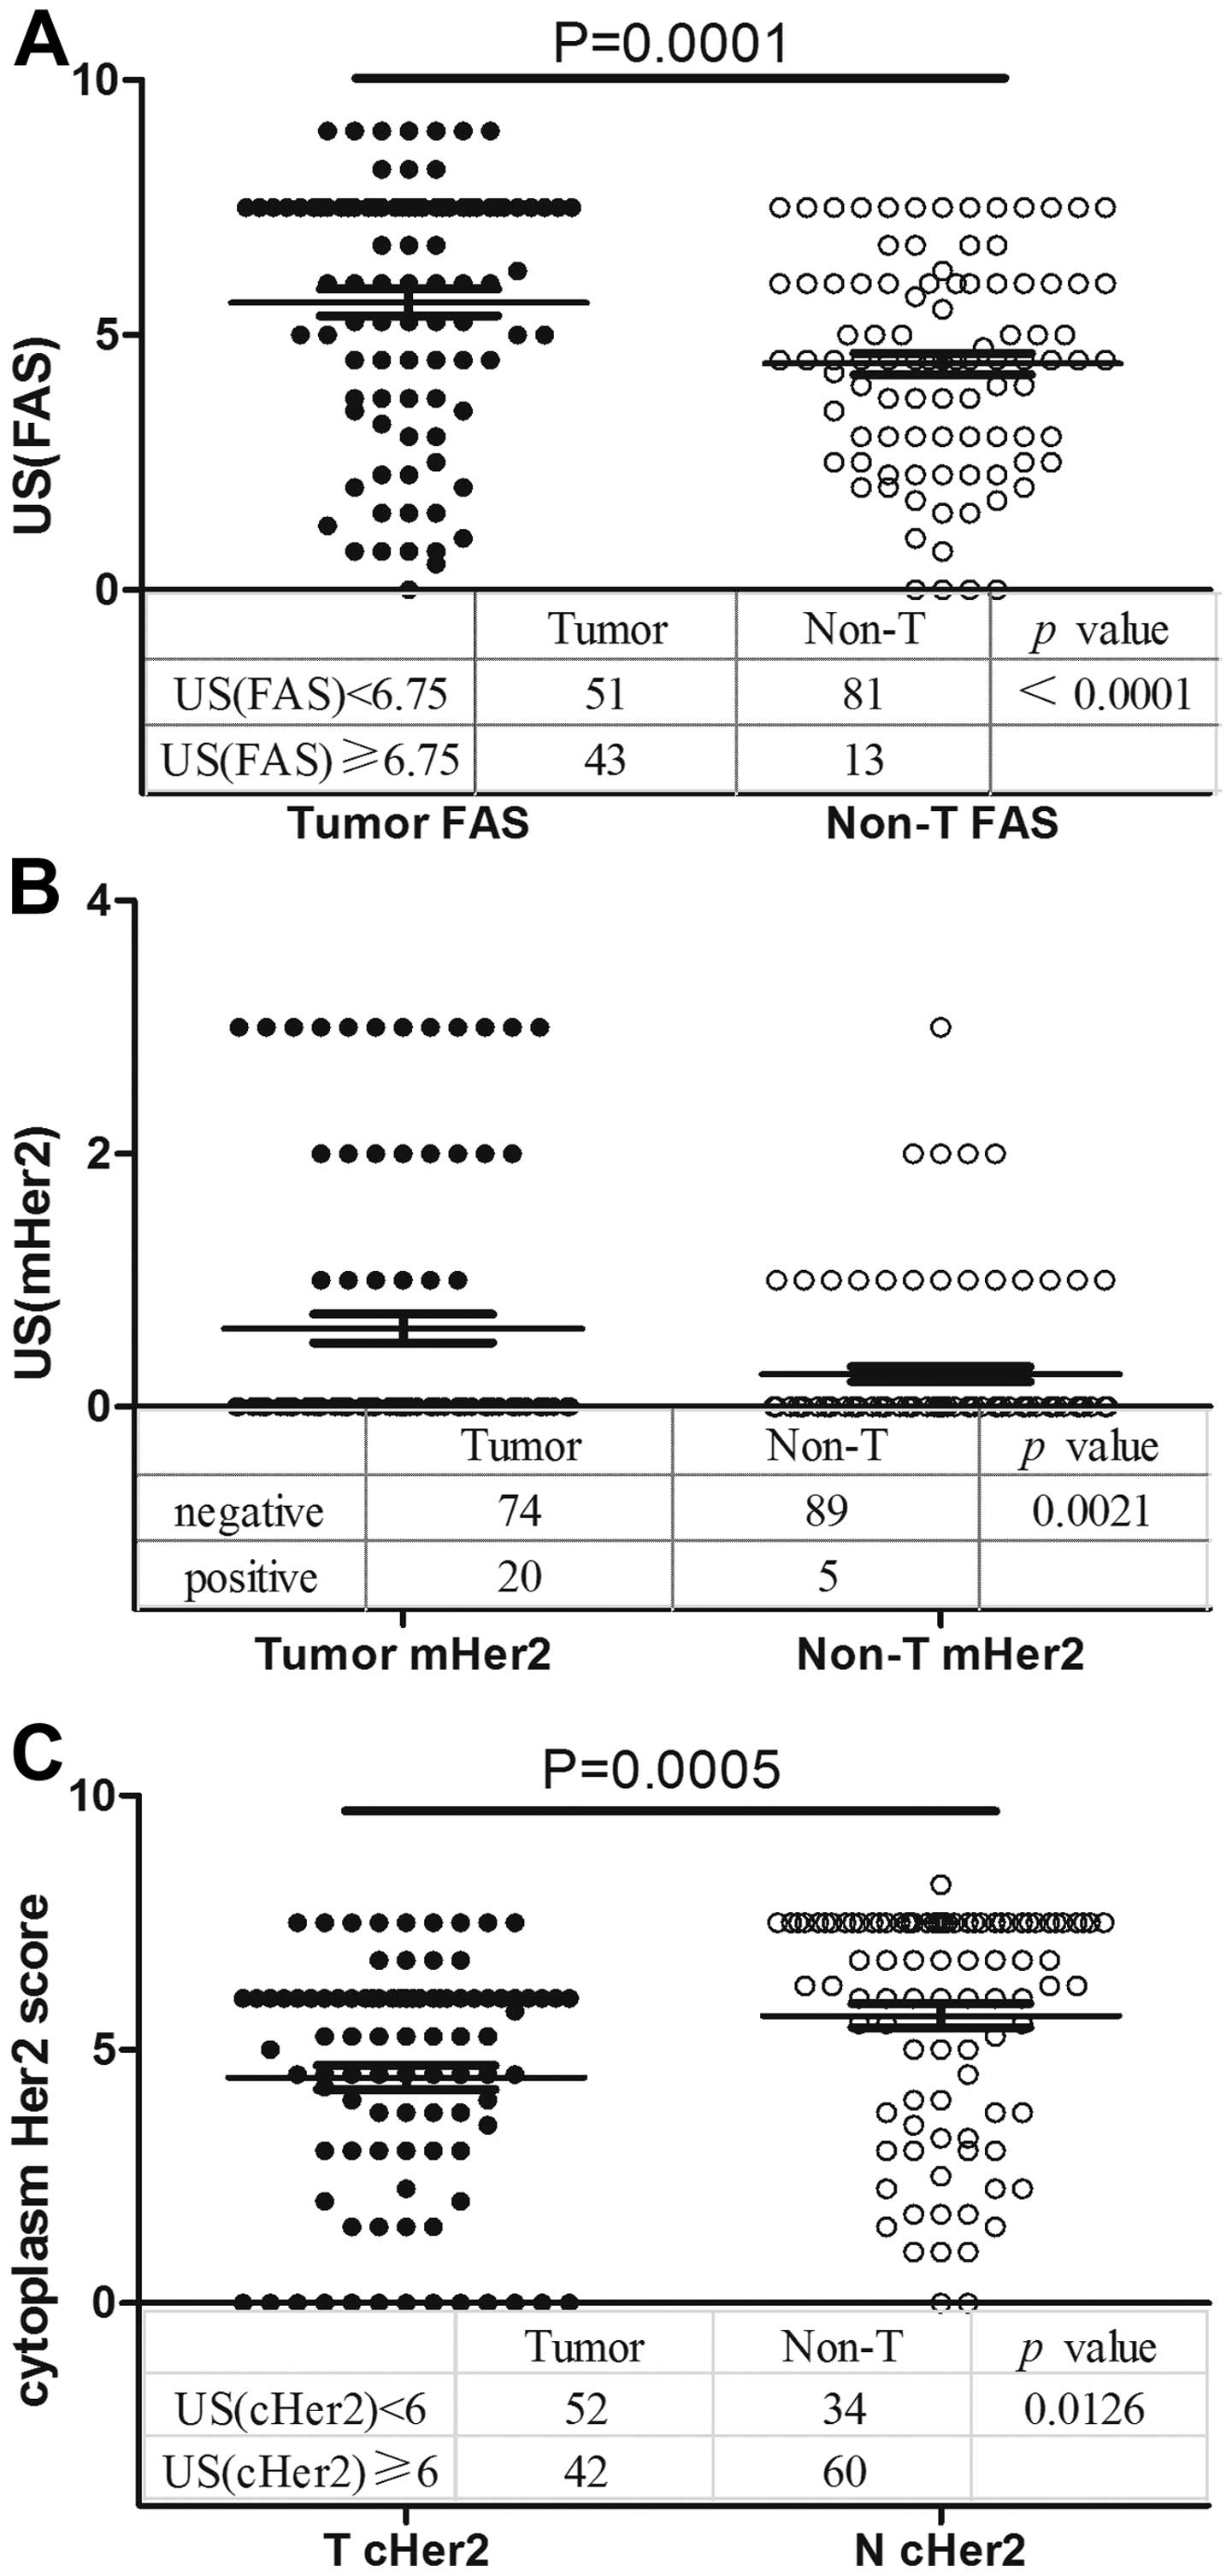
Overexpression of FAS in GC
The FAS expression pattern in the 94 GC tissues and
the adjacent non-tumor tissues was analyzed by TMA and IHC. FAS was
expressed in the cell cytoplasm. A total of 54.3% (51/94) of the
tumor tissues exhibited weak staining and 45.7% (43/94) exhibited
strong staining, whereas these values were 86.2% (81/94) and 13.8%
(13/94) in the non-tumor tissues (P<0.0001; χ2 test),
respectively. FAS was overexpressed in the GC tissues compared with
the normal tissues (5.633±0.510 vs. 4.431±0.423; P=0.0001,
Mann-Whitney test; Fig. 2A).
Overexpression of mHER2 in GC
HER2 was expressed not only in the cytoplasm, but
also on the membrane. Using classification variables, the
significance of mHER2 staining scores was determined by
χ2 test, and overexpression of mHER2 was present in
21.3% (20/94) of the tumors and 5.3% (5/94) of the non-tumor
tissues [P=0.0021; relative risk, 1.762; 95% confidence interval
(CI), 1.361–2.282; Fisher's exact test; Fig. 2B].
cHER2 is underexpressed in GC
cHER2 was found to be expressed in the GC and
non-tumor tissues. In total, 44.7% of tumor tissues (42/94)
exhibited strong staining (US(cHER2), ≥6) for cHER2, while 63.8%
(60/94) of normal gastric tissues exhibited high expression levels
of cHER2 (P=0.0126). Using the t-test to determine significance,
the tumor tissues were shown to underexpress cHER2 compared with
the non-tumor tissues (4.441±0.481 vs. 5.662±0.465; P=0.0005;
Fig. 2C).
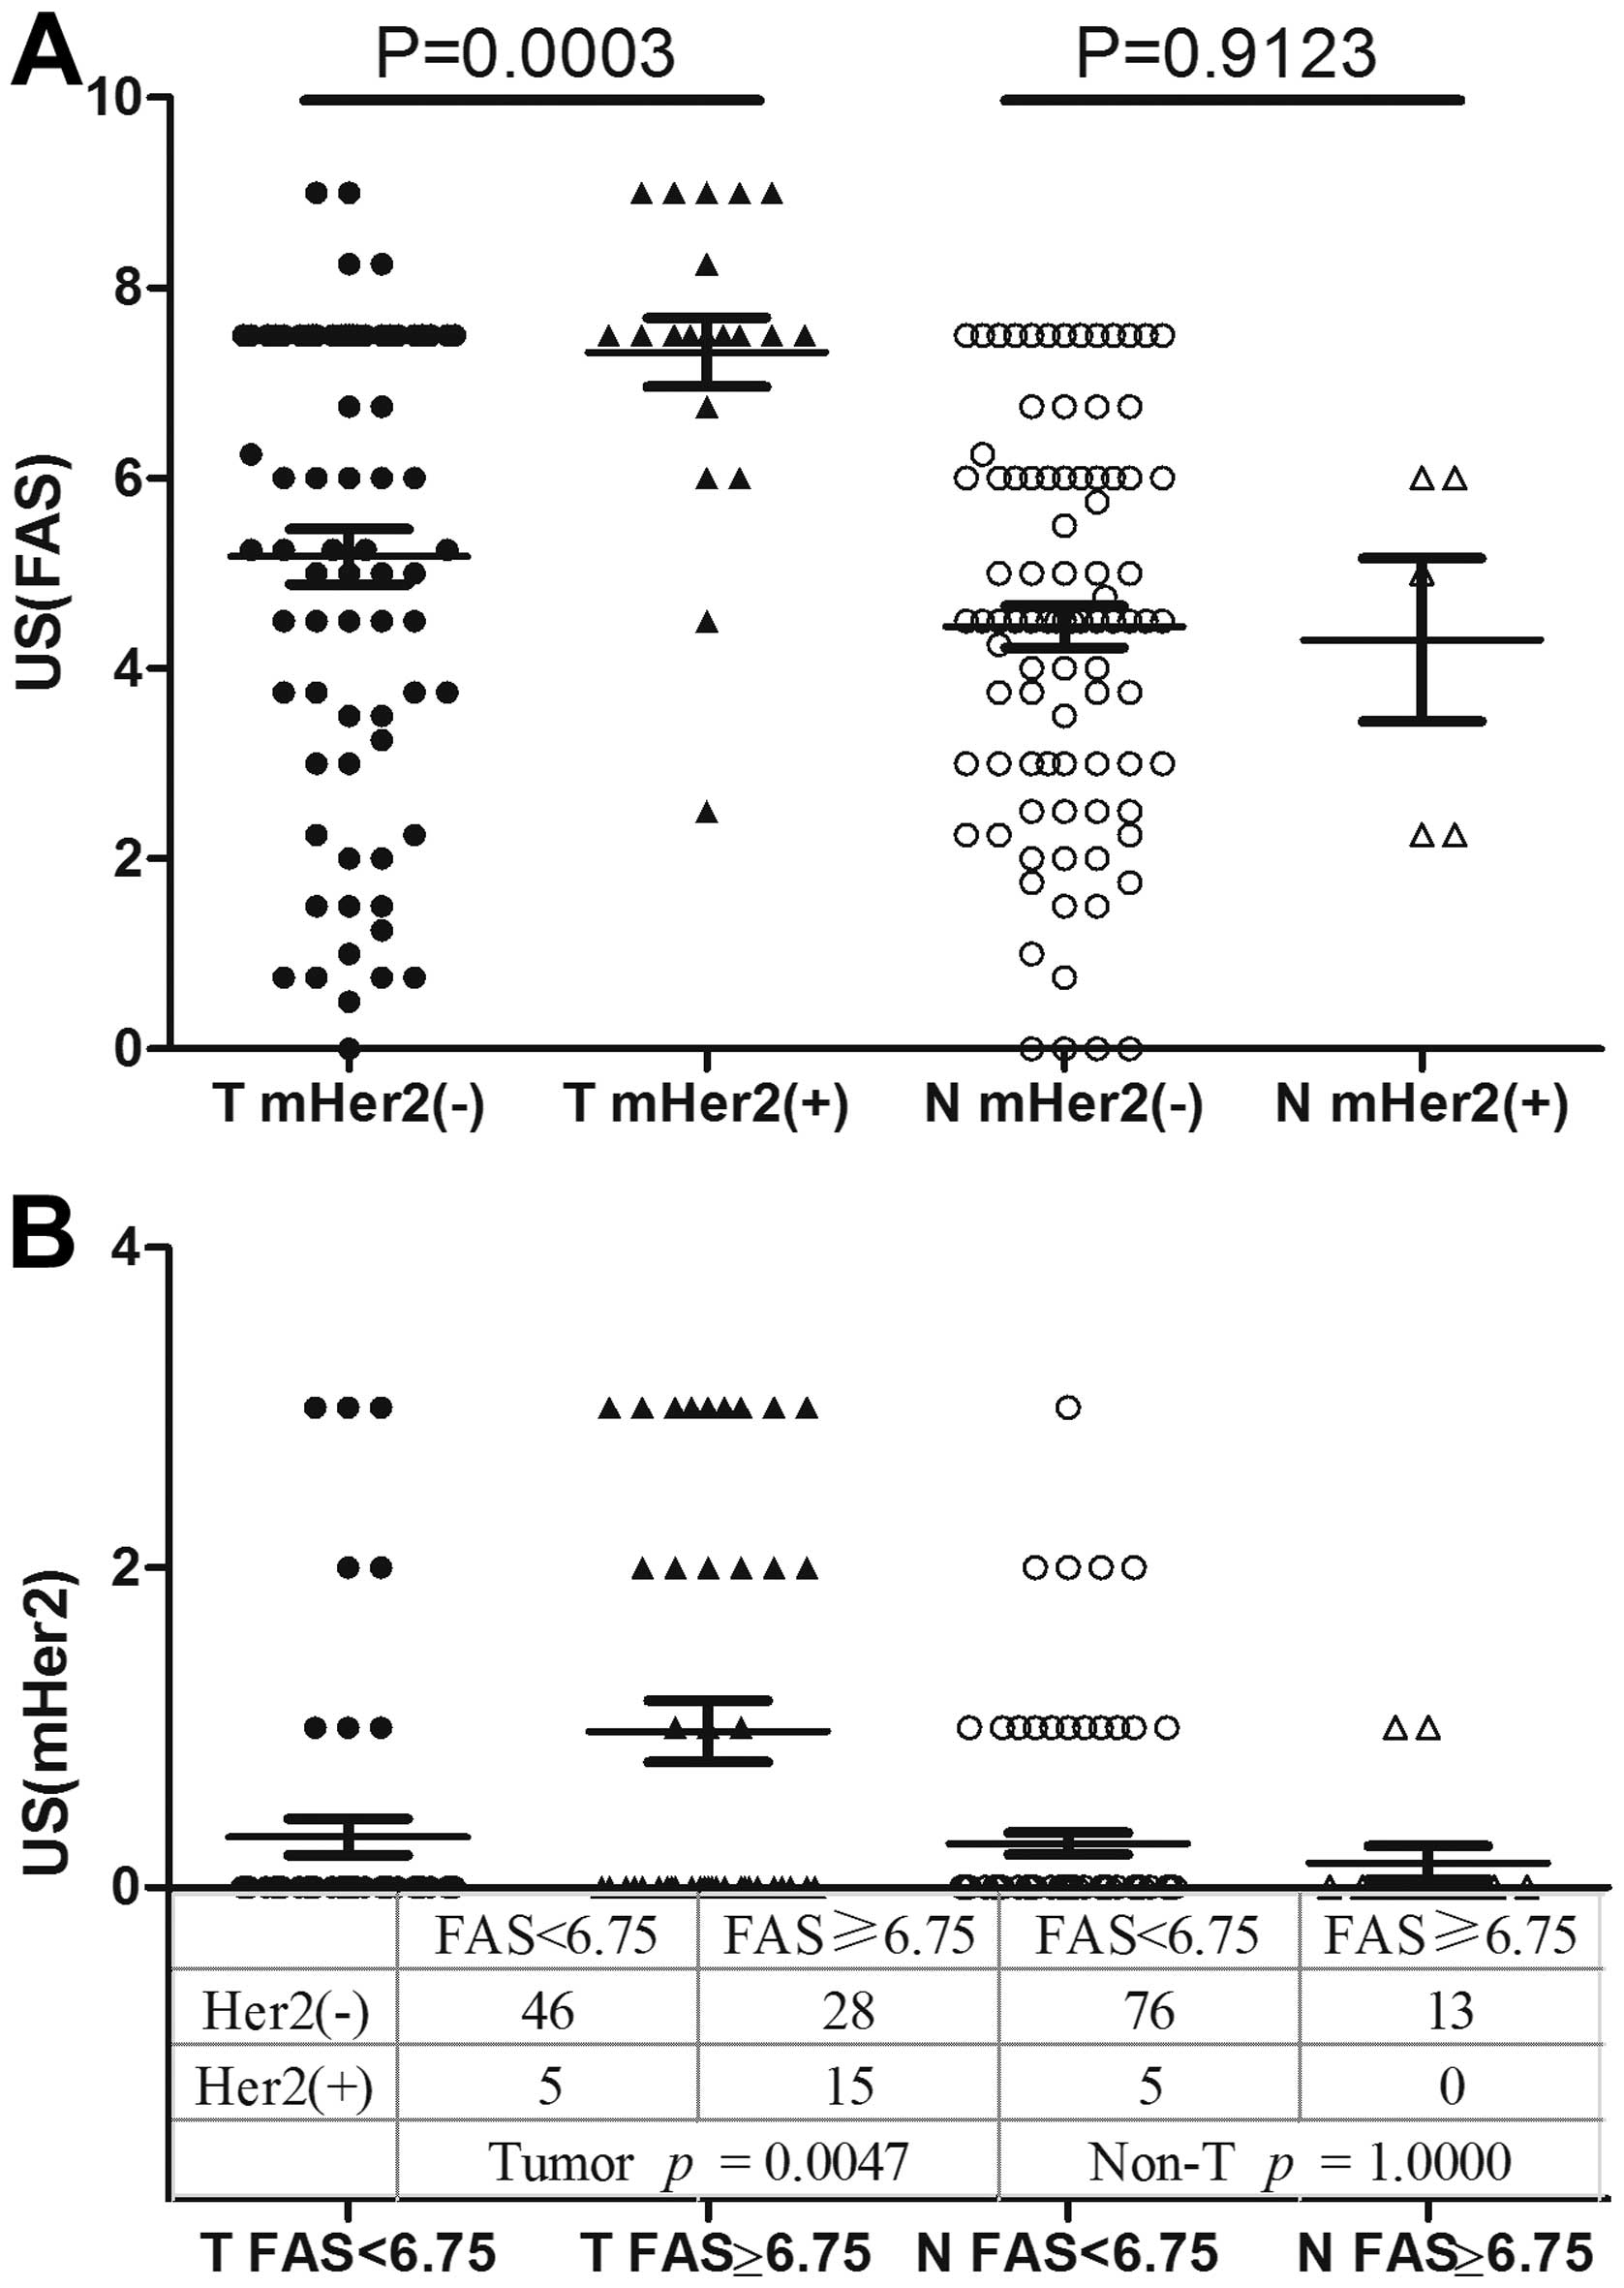
GC tissues exhibit a mutually strong
correlation between FAS and mHER2
There is a potential interaction between FAS and
mHER2 in the signaling pathway mentioned in the introduction, and
the present study further combined these two molecules to analyze
the correlation between them. mHER2 expression was significantly
upregulated in the FAS-strong group compared with its control, and
the expression of FAS in the mHER2-positive group was greater than
its expression in the mHER2-negative group. These results
documented a potent and bidirectional significant correlation
between FAS and mHER2 expression in the tumor tissues (a concordant
expression pattern), but this pattern was not demonstrated in the
non-tumor tissues (Fig. 3A and
B).
A less differentiated state is
associated with low cHER2 expression and is concordant with the
expression of FAS and mHER2
The correlation between clinicopathological
parameters, and the expression of FAS and HER2 was investigated.
Clinical variables included age, gender, differentiation, AJCC
stage, invasion depth, lymph node involvement, distant metastasis,
tumor localization and tumor size. The results are listed in
Table II. No significant
correlations were detected between FAS and mHER2 expression. More
significantly, a less differentiated state was associated with a
concordant expression pattern [grade I+II vs. grade III; Fisher's
exact test; P=0.0484; odds ratio (OR), 2.585; 95% CI, 1.084–6.167]
and reduced cHER2 staining (P=0.0376; OR, 2.492; 95% CI,
1.076–5.772). In addition, female patients appeared to suffer a
much higher risk of a concordant expression pattern compared with
male patients (Fisher's exact test; P=0.0439; OR, 2.7595; 95% CI,
1.039–7.330).
| Table II.Correlation of FAS and mHER2 protein
expression in gastric cancer with the clinicopathological
characteristics of 94 patients. |
Table II.
Correlation of FAS and mHER2 protein
expression in gastric cancer with the clinicopathological
characteristics of 94 patients.
|
|
| US(FAS) | mHER2 | cHER2 | Combination of FAS
and mHER2 |
|---|
|
|
|
|
|
|
|
|---|
| Characteristic | n | Weak | Strong | P-value | – | + | P-value | Weak | Strong | P-value | Concordant | Non-concordant | P-value |
|---|
| Gender |
|
|
| 0.0867 |
|
| 0.6078 |
|
| 0.5176 |
|
| 0.0439 |
|
Male | 61 | 29 | 32 |
| 49 | 12 |
| 32 | 29 |
| 35 | 26 |
|
|
Female | 33 | 22 | 11 |
| 25 | 8 |
| 20 | 13 |
| 26 | 7 |
|
| Age, years |
|
|
| 0.5348 |
|
| 0.0443 |
|
| 0.2130 |
|
| 0.8294 |
|
Median |
| 58 | 62 |
| 59 | 65 |
| 57.5 | 63 |
| 59 | 60 |
|
|
Range |
| 30–77 | 43–80 |
| 30–77 | 36–80 |
| 30–77 | 40–80 |
| 30–80 | 36–73 |
|
|
<60 | 48 | 28 | 20 |
| 42 | 6 |
| 30 | 18 |
| 32 | 16 |
|
|
≥60 | 46 | 23 | 23 |
| 32 | 14 |
| 22 | 24 |
| 29 | 17 |
|
| Histological
grade |
|
|
| 0.1454 |
|
| 0.2158 |
|
| 0.0376 |
|
| 0.0484 |
|
I+II | 40 | 18 | 22 |
| 29 | 11 |
| 17 | 23 |
| 21 | 19 |
|
|
III | 54 | 33 | 21 |
| 45 | 9 |
| 35 | 19 |
| 40 | 14 |
|
| TNM stage |
|
| 0.4160 |
|
| 0.3183 |
|
| 0.5408 |
|
| 0.1995 |
|
|
0+1+2 | 48 | 24 | 24 |
| 40 | 8 |
| 25 | 23 |
| 28 | 20 |
|
|
3+4 | 46 | 27 | 19 |
| 34 | 12 |
| 27 | 19 |
| 33 | 13 |
|
| Depth of
invasion |
|
|
| 1.0000 |
|
| 0.1163 |
|
| 0.8324 |
|
| 0.1198 |
|
T0+1+2 | 35 | 19 | 16 |
| 31 | 4 |
| 20 | 15 |
| 19 | 16 |
|
|
T3+4 | 59 | 32 | 27 |
| 43 | 16 |
| 32 | 27 |
| 42 | 17 |
|
| LN metastasis |
|
|
| 0.4055 |
|
| 0.6126 |
|
| 0.5342 |
|
| 0.1892 |
| N0 | 39 | 19 | 20 |
| 32 | 7 |
| 20 | 19 |
| 22 | 17 |
|
|
N1+2+3 | 55 | 32 | 23 |
| 42 | 13 |
| 32 | 23 |
| 39 | 16 |
|
| Distant
metastasis |
|
|
| 1.0000 |
|
| 1.0000 |
|
| 1.0000 |
|
| 1.0000 |
| M0 | 91 | 49 | 42 |
| 71 | 20 |
| 50 | 41 |
| 59 | 32 |
|
| M1 | 3 | 2 | 1 |
| 3 | 0 |
| 2 | 1 |
| 2 | 1 |
|
| Tumor size, cm |
|
|
| 1.0000 |
|
| 0.3171 |
|
| 0.4073 |
|
| 1.0000 |
|
<3 | 38 | 21 | 17 |
| 32 | 6 |
| 19 | 19 |
| 25 | 13 |
|
| ≥3 | 56 | 30 | 26 |
| 42 | 14 |
| 33 | 23 |
| 36 | 20 |
|
| Localization |
|
|
| 0.9592 |
|
| 0.9689 |
|
| 0.1973 |
|
| 0.3279 |
| Up | 10 | 5 | 5 |
| 8 | 2 |
| 3 | 7 |
| 5 | 5 |
|
|
Median | 44 | 24 | 20 |
| 35 | 9 |
| 27 | 17 |
| 27 | 17 |
|
|
Down | 40 | 22 | 18 |
| 31 | 9 |
| 22 | 18 |
| 29 | 11 |
|
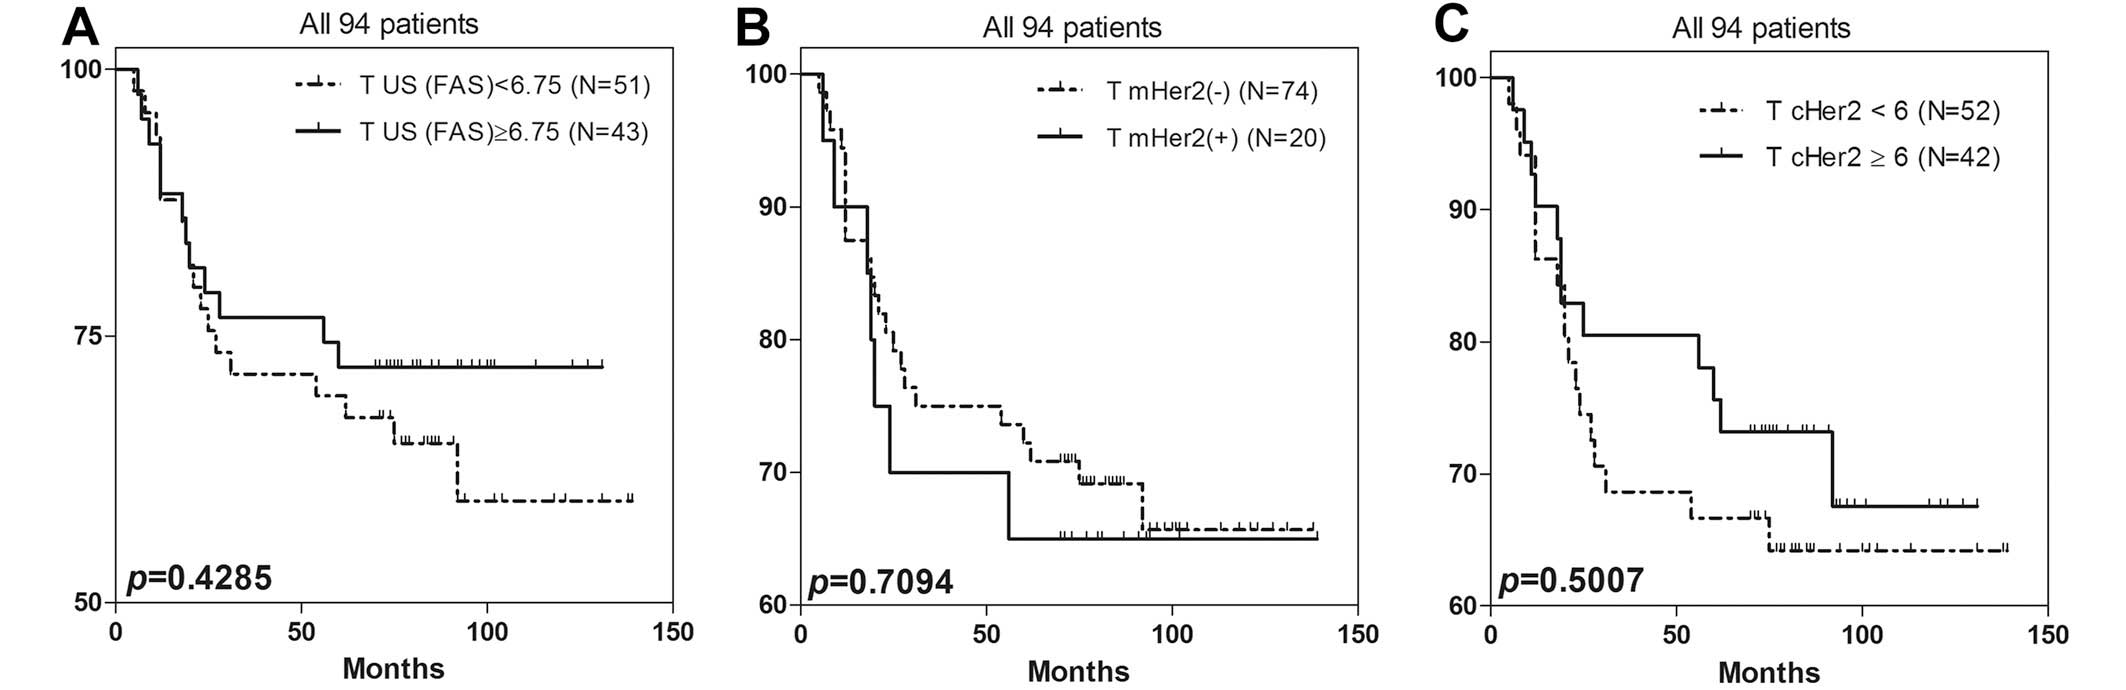
Concordant expression of FAS and HER2
indicates a poor prognosis in GC patients
Although it has been demonstrated that the in
vitro overexpression of FAS and mHER2 commonly predicts a poor
survival rate (20–23), the present data showed no significant
overall survival difference between the groups classified by FAS
(P=0.4285; Fig. 4A), mHER2 (P=0.7094;
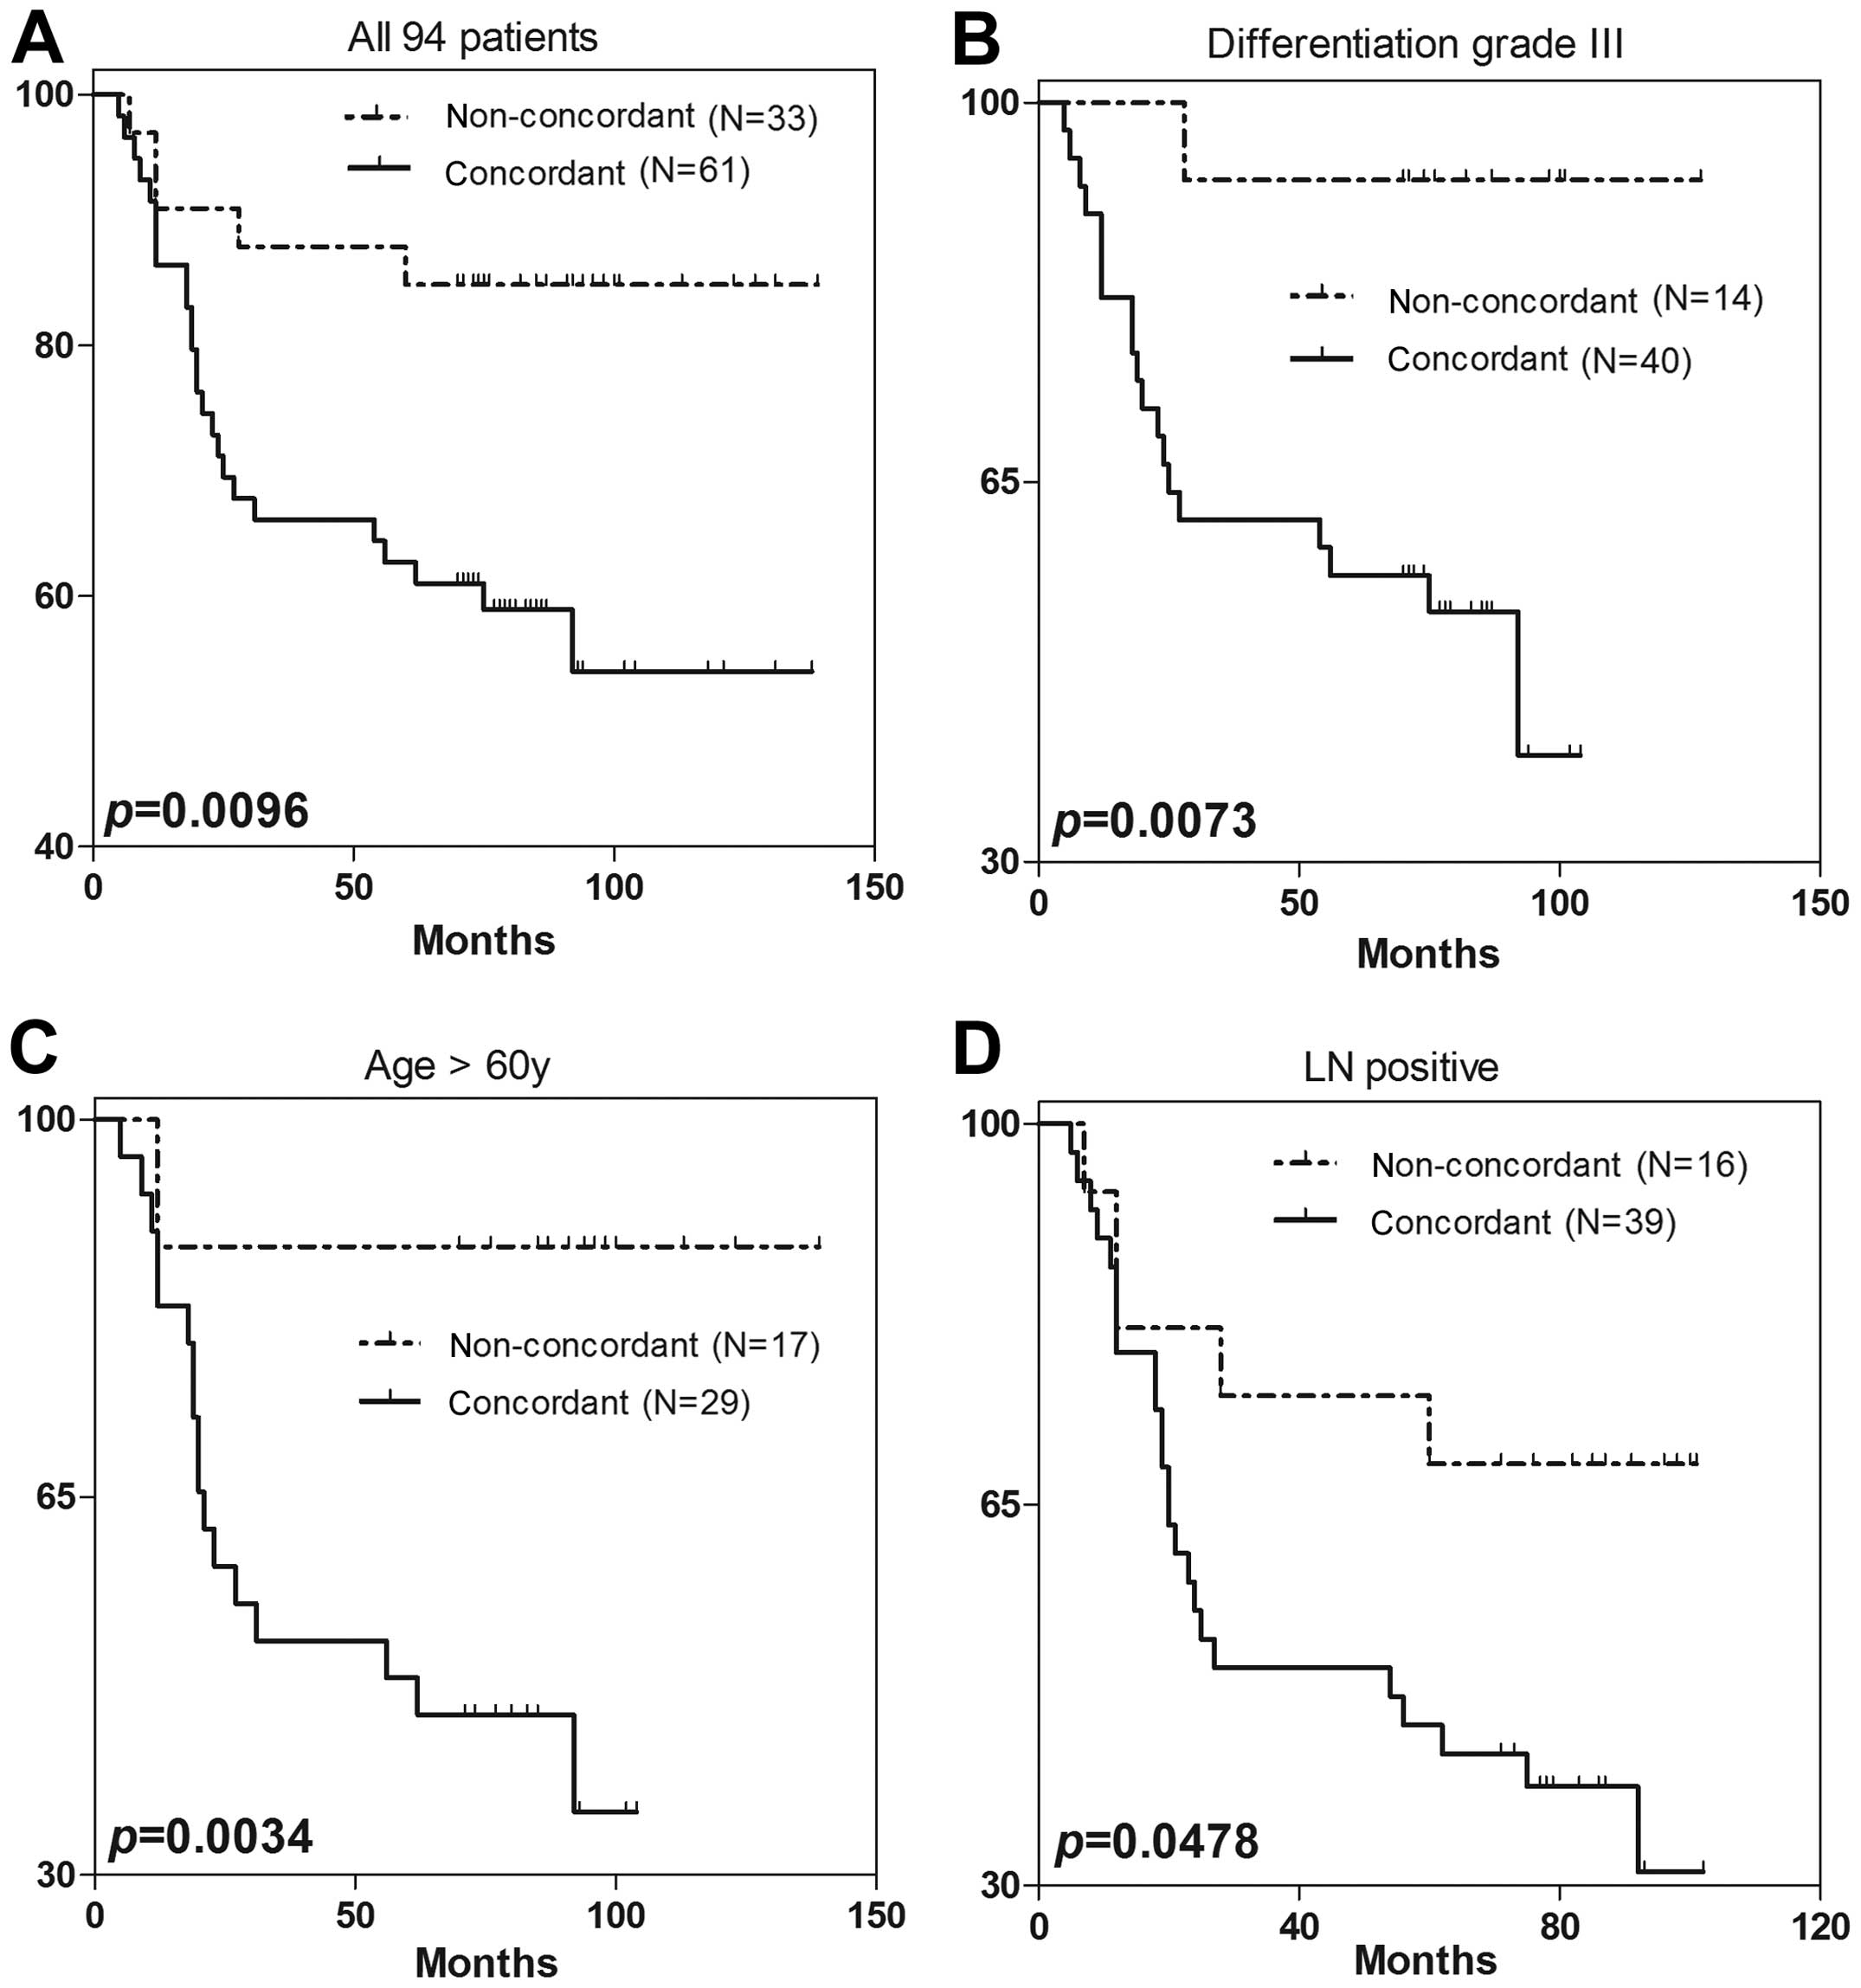
Fig. 4B) or cHER2 (P=0.5507; Fig. 4C). However, when combining mHER2 and
FAS together, and analyzing the data in the two groups as
concordant or non-concordant, a prognostic difference was found
between the groups. The survival curves of the patients are
presented in Fig. 5A (Wilcoxon test;
P=0.0096; HR, 3.2801; 95% CI, 1.5781–6.8176). When stratified by
tumor differentiation, age and node metastasis, patients with
concordant expression still showed a worse prognosis in
differentiation grade III, elder and positive lymphatic metastasis
patients (Fig. 5B–D).
Discussion
The treatment of GC has improved during the last few
decades with regard to the surgical skills and tumor targeted
strategies, however, the general outcome for GC patients remains
inadequate, and various studies have been conducted on gastric
carcinogenesis and novel targeted molecules (2,31–33). FAS, a crucial synthesizer of LCFAs, is
an enzyme that is involved in the synthesis of normal lipids and
the development of cancer (5). FAS
overexpression and increased activity represents one of the most
recurrent phenotypic variations in cancer cells. A number of growth
factors and their receptors, including HER2, have materialized as
major contributors to the overexpression of FAS. However, the
mechanisms ultimately responsible for tumor-associated FAS
overexpression are not completely understood (5). In the present study, a potent and
bidirectional correlation between FAS and mHER2 expression and the
potential value for predicting patient outcome was primarily
demonstrated in the GC patients. These novel findings may indicate
an important role for these two combined molecules in gastric
carcinogenesis and tumor invasiveness, and the potential benefits
for future targeted therapy.
The present data showed that FAS and mHER2 were
overexpressed in 45.7% (43/94) and 21.3% (20/94) of the GC tissues,
respectively. The expression of these proteins in the cancer
tissues was higher than their expression levels in the non-tumor
tissues.
As shown in former studies, the positivity of FAS
ranges from 50% to >80% in various types of tumors (15,34–38),
apparently overexpressed in comparison with paired non-tumor
tissues. In 2002, Kusakabe et al demonstrated the
overexpression of FAS in GC tissues by IHC methods (39), and a following study was conducted to
investigate the potential function of FAS in gastric carcinogenesis
in vitro (40). HER2 as a
membranous molecule has been reported to be overexpressed in
various percentages of GC patients according to different studies
(41–43). A study involving 1,414 GC patients
showed that 17% of GC tissues would overexpress mHER2 (44). The present data was also consistent
with these results. The mechanism of FAS and HER2 overexpression in
cancer has been the subject of several studies; however, the total
representation remains far from understood.
It has been hypothesized that there must be a
potential correlation between FAS and mHER2 (45), with a number of studies confirming
this fact, for example, in various tumors, including breast
(22,46,47), ovary
(20) or oral (23,48)
cancer, with mHER2 and FAS upstream and downstream molecules of the
PI3K and MAPK pathways. In normal human tissues, this type of
correlation has not been found between FAS and mHER2. The present
results showed that in GC tissues, the expression of FAS may be
elevated along with mHER2 overexpression, and vice versa. This
interaction appeared to serve as a positive-feedback pathway that
can mutually regulate the expression of FAS and mHER2. This result
showed that FAS and mHER2 were definitely correlated in GC, which
was consistent with studies in other tumors (20–23).
The mechanisms involved in the mutual regulation
between mHER2 and FAS have been mainly revealed. mHER2 activates
the FAS gene promoter through the PI3K and MAPK signaling pathway,
and finally elevates FAS expression. Moreover, mHER2 can directly
activate FAS protein by its intracellular phosphorylation domain
(22). Alternatively, HER2 gene
expression and HER2 protein activity can be modulated through the
concentration changes of acetyl-CoA and malonyl-CoA that are
regulated by FAS (5,49). In addition, as the key enzyme of de
novo synthesis, FAS can increase the stability of mHER2 by the
formation of a domain known as a lipid raft, located on the
membranes (46). These mechanisms
ultimately construct a positive-feedback pathway between mHER2 and
FAS.
The present study did not find any correlation
between the clinical information and the expression of mHER2 and
FAS. Generally, mHER2 is considered to be highly correlated with
intestinal GC (Laurén type) (50–54).
However, information about Laurén type intestinal GC was not
included in the present study. The reasons for this correlation
between mHER2 and FAS, and the mechanisms behind it, remain to be
elucidated. Other clinical parameters, including differentiation
grade, tumor-node-metastasis stage and tumor size, were not
confirmed to correlate with mHER2 expression. FAS has been found to
be highly expressed in well-differentiated GC tissues compared with
poorly-differentiated GC tissues, and it also appears to function
in the early stage of gastric carcinogenesis (39). This deduction was not statistically
evident in the present study when the correlation between FAS
expression and tumor differentiation was analyzed, but 55.0%
(22/40) of grade I and II GC tissues demonstrated overexpression of
FAS, and this ratio was 38.9% (21/54) in grade III tissues. So
there may be a decreasing trend of FAS expression along with
worsening tumor differentiation. In the generation of the majority
of tumors, FA synthesis is a highly activated process to supply
enough phospholipid and enzymes for the rapid proliferation of
tumor cells. However, there is no standard FAS scoring system to
evaluate its IHC staining level, which has shown variations and
discrepancies among different studies (3,4,39,40,55.
Currently, controversy remains with regard to the
prognostic value of mHER2 in GC patients (43,44,56,57),
and former observational studies and the ToGA trial do not have a
uniform conclusion to this issue (2,43,58–60).
However, a number of recent studies have shown that elevated
expression levels of mHER2 are associated with tumor invasion and a
poor prognosis (56,61). However, the present study did not find
that mHER2 exhibited prognostic value in GC patients, which may be
due to several factors. GC only showed mHER2 positivity in ~20% of
the patients, but the sample capacity of the study was too limited
to detect the potential and probable significance. Moreover,
fluorescence in situ hybridization is commonly considered to
be the gold standard in the evaluation of mHER2 expression
(62), and other IHC methods may have
a bias tendency. However, the consistency of these two methods is
~93.5%, as proposed by the ToGA trial (2). Moreover, the Herceptin standard was
recommended by NCCN to evaluate the IHC staining of mHER2, and the
present study used the criteria proposed by Chung et al in
2005 (30), thus it suggested that
bias and deviations inevitably exist in spite of their good
concordance. Finally, mHER2 is commonly overexpressed more simply
in intestinal GC, but the Laurén type of GC in the present study
was unknown, which may be a confounding factor in prognostic
analysis, since a diffuse type definitely indicates an inferior
prognosis. Therefore, after the patients were stratified by
differentiation grade, it was found that in the
poorly-differentiated groups, positive mHER2 expression
significantly indicated a poor prognosis (P=0.0153), which may have
resulted from a certain elimination of perplexing factors. On the
other hand, this result showed that tumors with mHER2 expression
have a higher capability for invasion and metastasis, which is in
disagreement with a former study (63). Therefore, the function and regulation
of HER2-mediated pathways in gastric carcinogenesis are intricate
and complex.
The value of FAS in predicting GC prognosis is not
yet confirmed, although FAS has been considered to be correlated
with the prognosis of various tumors, such as non-small cell lung
carcinoma (37), melanoma (38) and soft-tissue sarcomas (64). It has been a more commonly accepted
fact that FAS does not associate with the prognosis of GC patients.
The present data did not find any significant correlation between
FAS and patient survival, which is in agreement with a former study
(39). In 2009, Dowling et al
reported that FAS inhibitors could apparently induce the apoptosis
of GC cells in vitro and depress tumor formation in mice,
which to some extent reflect the potential roles of FAS in gastric
carcinogenesis (40). This requires
further investigation in more depth. However, notably, the present
study found that the concordant expression group suffered a much
worse prognosis compared with the non-concordant group, when FAS
and mHER2 were combined together in a survival analysis. The
five-year overall survival rates were 62.7 and 84.8% in these two
groups. Moreover, in the elder patients (>60 years), the females
and the patients with grade-III differentiation, concordant
expression still acted as a predictor of a poor prognosis. It has
been reported in vitro that prostate cells expressing FAS
and androgen receptor (another activator of the PI3K-Akt pathway)
can form invasive adenocarcinomas in immunodeficient mice, however,
cells that expressed only FAS did not (65). Thus, we can hypothesize based on
present data, that in non-tumor tissues, the positive-feedback
pathway of mHER2-FAS is not activated, and no correlation was found
between them. However, this pathway could be activated in a certain
stage of gastric carcinogenesis and would promote gastric cell
proliferation. Therefore, the patients that present with FAS/mHER2
concordant expression may have a worse prognosis, due to the
activation of the mHER2/FAS pathway.
However, not all GC patients presented with a
pattern of concordant expression, and a large proportion of the
patients showed non-concordant expression of FAS and mHER2, which
may be a presentation of GC heterogenicity or result from other
unknown mechanisms involved in the process of gastric
carcinogenesis. Nevertheless, mHER2 and FAS are simultaneously
modulated by various molecules in a complicated process, and more
intensive and detailed cytological experiments are required to
confirm or investigate this theory.
cHER2 expressed in GC has seldom been investigated
in depth. Unexpectedly, the present study found that cHER2 was
significantly overexpressed in non-tumor tissues compared with
tumor tissues. In addition, cancerous tissues with good
differentiation (grade I+II) showed a higher percentage of cHER2
overexpression in comparison to poorly-differentiated cancerous
tissues [57.5% (23/40) vs. 35.2% (19/54); P=0.0376; Fisher's exact
test]. It appears that the expression of cHER2 has a tendency to
increase with GC progression. Therefore, cHER2 may play completely
different roles from mHER2, in normal and tumor tissues. With tumor
progression, mHER2 increases and cHER2 decreases, and complicated
mechanisms must be involved in this process.
Currently, the complications that arise from the use
of HER2-targeted therapy in GC treatment are not fully understood,
but the experience and information gained from HER2-targeted breast
cancer therapy indicates that a large number of HER2-positive
breast cancer patients are primarily resistant to anti-HER2 drugs,
and almost all of the patients will have drug-resistant tumors
following HER2-targeted therapy (66–69).
However, it has been proved in vitro that the combination of
anti-FAS and anti-HER2 targeted therapy will decrease the
resistance to HER2 inhibitors through various mechanisms (21,22,70,71).
Therefore, the present study preliminarily offers evidence for the
feasibility of using combined detection of FAS and mHER2 in GC
patients, which appears most significant in mHER2-negative patients
and mHER2-positive patients who are resistant to HER2-targeted
therapy. Also, from the present results, we further surmise that
this promising method will be of more use in the personalized
treatment of GC patients who are >60 years old, female and who
have tumors with poor differentiation. However, a great deal of
research is required in order to achieve this goal, and more
cytological and genetic studies are required.
In conclusion, FAS and mHER2 are overexpressed in GC
tissues, with a strong association with each other. The present
study showed a concordant expression pattern of FAS and mHER2 in GC
tissues, while there was no association between these two markers
in healthy, adjacent non-tumor tissues. The two proteins are linked
to the same signaling pathway (MAPK and PI3K/Akt), and their
expression is associated with a poor prognosis for GC patients.
cHER2 was also found to be underexpressed in GC tissues.
Acknowledgements
This study was supported by the Department of
Pathology, Zhongshan Hospital, and GlaxoSmithKline (Philadelphia,
PA, USA), who offered the use of their laboratories and equipment;
the authors would like to express their appreciation for the
assistance provided.
References
|
1
|
Devesa SS, Blot WJ and Fraumeni JF Jr.:
Changing patterns in the incidence of esophageal and gastric
carcinoma in the United States. Cancer. 83:2049–2053. 1998.
View Article : Google Scholar : PubMed/NCBI
|
|
2
|
Kuhajda FP: Fatty acid synthase and
cancer: New application of an old pathway. Cancer Res.
66:5977–5980. 2006. View Article : Google Scholar : PubMed/NCBI
|
|
3
|
Notarnicola M, Tutino V, Calvani M, et al:
Trastuzumab in combination with chemotherapy versus chemotherapy
alone for treatment of HER2-positive advanced gastric or
gastro-oesophageal junction cancer (ToGA):A phase3, open-label,
randomised controlled trial. Lancet. 376:687–697. 2010. View Article : Google Scholar : PubMed/NCBI
|
|
4
|
Ito T, Sako K, Maekawa H, et al: Elevated
levels of serum fatty acid synthase in patients with gastric
carcinoma. Oncol Lett. 7:616–620. 2014.PubMed/NCBI
|
|
5
|
Menendez JA and Lupu R: Fatty acid
synthase and the lipogenic phenotype in cancer pathogenesis. Nat
Rev Cancer. 7:763–777. 2007. View
Article : Google Scholar : PubMed/NCBI
|
|
6
|
Weiss L, Hoffmann GE, Schreiber R, et al:
Fatty-acid biosynthesis in man, a pathway of minor importance.
Purification, optimal assay conditions, and organ distribution of
fatty-acid synthase. Biol Chem Hoppe Seyler. 367:905–912. 1986.
View Article : Google Scholar : PubMed/NCBI
|
|
7
|
Wagle S, Bui A, Ballard Pl, et al:
Hormonal regulation and cellular localization of fatty acid
synthase in human fetal lung. Am J Physiol. 227:L381–L390.
1999.
|
|
8
|
Kusakabe T, Maeda M, Hoshi N, et al: Fatty
acid synthase is expressed mainly in adult hormone-sensitive cells
or cells with high lipid metabolism and in proliferating fetal
cells. J Histochem Cytochem. 48:613–622. 2000. View Article : Google Scholar : PubMed/NCBI
|
|
9
|
Pizer ES, Kurman RJ, Pasternack GR and
Kuhjada FP: Expression of fatty acid synthase is closely linked to
prolieration and stromal decidualization in cycling endometrium.
Int J Gynecol Pathol. 16:45–51. 1997. View Article : Google Scholar : PubMed/NCBI
|
|
10
|
Kuhajada FP: Fatty acid synathase and
cancer: New application of an old pathway. Cancer Res.
66:5977–5980. 2006. View Article : Google Scholar : PubMed/NCBI
|
|
11
|
Abramson HN: The lipogenesis pathway as a
cancer target. J Med Chem. 54:5615–5638. 2011. View Article : Google Scholar : PubMed/NCBI
|
|
12
|
Tischler V, Fritzsche FR, Gerhardt J, et
al: Comparison of the diagnostic value of fatty acid synthase
(FASN) with alpha-methylacyl-CoA racemase (AMACR) as prostatic
cancer tissue marker. Histopathology. 56:811–815. 2010. View Article : Google Scholar : PubMed/NCBI
|
|
13
|
Nguyen PL, Ma J, Chavarro JE, et al: Fatty
acid synthase polymorphisms, tumor expression, body mass index,
prostate cancer risk, and survival. J Clin Oncol. 28:3958–3964.
2010. View Article : Google Scholar : PubMed/NCBI
|
|
14
|
Heo CK, Woo MK, Yu DY, et al:
Identification of autoantibody against fatty acid synthase in
hepatocellular carcinoma mouse model and its application to
diagnosis of HCC. Int J Oncol. 36:1453–1459. 2010.PubMed/NCBI
|
|
15
|
Ishimura N, Amano Y, SanchezSiles AA, et
al: Fatty acid synthase expression in Barrett's esophagus:
Implications for carcinogenesis. J Clin Gastroenterol. 45:665–672.
2011. View Article : Google Scholar : PubMed/NCBI
|
|
16
|
Furuta E, Pai SK, Zhan R, et al: Fatty
acid synthase gene is up-regulated by hypoxia via activation of Akt
and sterol regulatory element binding protein-1. Cancer Res.
68:1003–1011. 2008. View Article : Google Scholar : PubMed/NCBI
|
|
17
|
Calvisi DF, Wang C, Ho C, et al: Increased
lipogenesis, induced by AKT-mTORC1-RPS6 signaling, promotes
development of human hepatocellular carcinoma. Gastroenterology.
140:1071–1083. 2011. View Article : Google Scholar : PubMed/NCBI
|
|
18
|
Kim K, Kim HY, Cho HK, Kim KH and Cheong
J: The SDF-1alpha/CXCR4 axis induces the expression of fatty acid
synthase via sterol regulatory element-binding protein-1 activation
in cancer cells. Carcinogenesis. 31:679–686. 2010. View Article : Google Scholar : PubMed/NCBI
|
|
19
|
Yan B, Yau EX, Bte Omar SS, et al: A study
of HER2 gene amplification and protein expression in gastric
cancer. J Clin Pathol. 63:839–842. 2010. View Article : Google Scholar : PubMed/NCBI
|
|
20
|
Grunt TW, Wagner R, Grusch M, et al:
Interaction between fatty acid synthase- and ErbB-systems in
ovarian cancer cells. Biochem Biophys Res Commun. 385:454–459.
2009. View Article : Google Scholar : PubMed/NCBI
|
|
21
|
Oliveras G, Blancafort A, Urruticoechea A,
et al: Novel anti-fatty acid synthase compounds with anti-cancer
activity in HER2+ breast cancer. Ann N Y Acad Sci. 1210:86–92.
2010. View Article : Google Scholar : PubMed/NCBI
|
|
22
|
Jin Q, Yuan LX, Boulbes D, et al: Fatty
acid synthase phosphorylation: A novel therapeutic target in
HER2-overexpressing breast cancer cells. Breast Cancer Res.
12:R962010. View
Article : Google Scholar : PubMed/NCBI
|
|
23
|
Silva SD, Perez DE, Alves FA, et al: ErbB2
and fatty acid synthase (FAS) expression in 102 squamous cell
carcinomas of the tongue: Correlation with clinical outcomes. Oral
Oncol. 44:484–490. 2008. View Article : Google Scholar : PubMed/NCBI
|
|
24
|
Rice TW, Blackstone EH and Rusch VW: 7th
edition of the AJCC Cancer Staging Manual: Esophagus and
Esophagogastric Junction. Ann Surg Oncol. 17:1721–1724. 2010.
View Article : Google Scholar : PubMed/NCBI
|
|
25
|
Washington K: 7th edition of the AJCC
Cancer Staging Manual: Stomach. Ann Surg Oncol. 17:3077–3079. 2010.
View Article : Google Scholar : PubMed/NCBI
|
|
26
|
Weiss SW: Franz M. Enzinger: His life and
work. Adv Anat Pathol. 13:109–113. 2006. View Article : Google Scholar : PubMed/NCBI
|
|
27
|
Kindblom LG: Lipomatous tumours - how we
have reached our present views, what controversies remain and why
we still face diagnostic problems: A tribute to Dr Franz Enzinger.
Adv Anat Pathol. 13:279–285. 2006. View Article : Google Scholar : PubMed/NCBI
|
|
28
|
Ajana JA, Bathel JS, BekaiiSaab T, et al:
Gastric cancer. J Natl Compr Canc Netw. 8:378–409. 2010.PubMed/NCBI
|
|
29
|
Vandhana S, Deepa PR, Jayanthi U, Biswas J
and Krishnakumar S: Clinico-pathological correlations of fatty acid
synthase expression in retinoblastoma: An Indian cohort study. Exp
Mol Pathol. 90:29–37. 2011. View Article : Google Scholar : PubMed/NCBI
|
|
30
|
Chung KY, Shia J, Kemeny NE, et al:
Cetuximab shows activity in colorectal cancer patients with tumors
that do not express the epidermal growth factor receptor by
immunohistochemistry. J Clin Oncol. 23:1803–1810. 2005. View Article : Google Scholar : PubMed/NCBI
|
|
31
|
Shah MA, Jhawer M, Ilson DH, et al: Phase
II study of modified docetaxel, cisplatin, and fluororacil with
bevacizymab in patients with metastatic gastroesophageal
adenocarcinoma. J Clin Oncol. 23:1803–1810. 2005.PubMed/NCBI
|
|
32
|
Shah MA, Power DG, Kindler HL, et al: A
multicenter, phase II study of bortezomib (PS-341) in patients with
unresectable or metastatic gastric and gastroesophageal junction
adenomcarcinoma. Invest New Drugs. 29:1475–1481. 2011. View Article : Google Scholar : PubMed/NCBI
|
|
33
|
Doi T, Muro K, Boku N, et al: Multicenter
phase II study of everolimus in patients with previously treated
metastatic gastric cancer. J Clin Oncol. 28:1904–1910. 2010.
View Article : Google Scholar : PubMed/NCBI
|
|
34
|
Gabrielson EW, Pinn ML, Testa JR and
Kuhajda FP: Increased fatty acid synthase is a therapeutic target
in mesothelioma. Clin Cancer Res. 7:153–157. 2001.PubMed/NCBI
|
|
35
|
Orita H, Coulter J, Tully E, et al: High
levels of fatty acid synthase expression in esophageal cancers
represent a potential target for therapy. Cancer Biol Ther.
10:549–554. 2010. View Article : Google Scholar : PubMed/NCBI
|
|
36
|
Kearney KE, Pretlow TG and Pretlow TP:
Increased expression of fatty acid synthase in human aberrant crypt
foci: Possible target for colorectal cancer prevention. Int J
Cancer. 125:249–252. 2009. View Article : Google Scholar : PubMed/NCBI
|
|
37
|
Visca P, Sebastiani V, Botti C, et al:
Fatty acid synthase (FAS) is a marker of increased risk of
recurrence in lung carcinoma. Anticancer Res. 24:4169–4173.
2004.PubMed/NCBI
|
|
38
|
Kapur P, Rakheja D, Roy LC and Hoang MP:
Fatty acid synthase expression in cutaneous melanocytic neoplasms.
Mod Pathol. 18:1107–1112. 2005. View Article : Google Scholar : PubMed/NCBI
|
|
39
|
Kusakabe T, Nashimoto A, Honma K and
Suzuki T: Fatty acid synthase is highly expressed in carcinoma,
adenoma and in regenerative epithelium and intestinal metaplasia of
the stomach. Histopathology. 40:71–79. 2002. View Article : Google Scholar : PubMed/NCBI
|
|
40
|
Dowling S, Cox J and Cenedella RJ:
Inhibition of fatty acid synthase by Orlistat accelerates gastric
tumor cell apoptosis in culture and increases survival rates in
gastric tumor bearing mice in vivo. Lipids. 44:489–498. 2009.
View Article : Google Scholar : PubMed/NCBI
|
|
41
|
Allgayer H, Babic R, Gruetzner KU,
Tarabichi A, Schildberg FW and Heiss MM: c-erbB-2 is of independent
prognostic relevance in gastric cancer and is associated with the
expression of tumor-associated protease systems. J Clin Oncol.
18:2201–2209. 2000.PubMed/NCBI
|
|
42
|
Matsubara J, Yamada Y, Hirashima Y, et al:
Impact of insulin-like growth factor type 1 receptor, epidermal
growth factor receptor, and HER2 expressions on outcomes of
patients with gastric cancer. Clin Cancer Res. 14:3022–3029. 2008.
View Article : Google Scholar : PubMed/NCBI
|
|
43
|
Grabsch H, Sivakumar S, Gray S, Gabbert HE
and Müller W: HER2 expression in gastric cancer: Rare,
heterogeneous and of no prognostic value - conclusions from 924
cases of two independent series. Cell Oncol. 32:57–65.
2010.PubMed/NCBI
|
|
44
|
Kim KC, Koh YW, Chang HM, et al:
Evaluation of HER2 protein expression in gastric carcinomas:
Comparative analysis of 1,414 cases of whole-tissue sections and
595 cases of tissue microarrays. Ann Surg Oncol. 18:2833–2840.
2011. View Article : Google Scholar : PubMed/NCBI
|
|
45
|
KumarSinha C, Ignatoski KW, Lippman ME,
Ethier SP and Chinnaiyan AM: Transcriptome analysis of HER2 reveals
a molecular connection to fatty acid synthesis. Cancer Res.
63:132–139. 2003.PubMed/NCBI
|
|
46
|
VazquezMartin A, FernandezReal JM,
OliverasFerraros C, et al: Fatty acid synthase activity regulates
HER2 extracellular domain shedding into the circulation of
HER2-positive metastatic breast cancer patients. Int J Oncol.
35:1369–1376. 2009.PubMed/NCBI
|
|
47
|
VazquezMartin A, Colomer R, Brunet J, Lupu
R and Menendez JA: Overexpression of fatty acid synthase gene
activates HER1/HER2 tyrosine kinase receptors in human breast
epithelial cells. Cell Prolif. 41:59–85. 2008. View Article : Google Scholar : PubMed/NCBI
|
|
48
|
Silva SD, Cunha IW, Rangel AL, et al:
Differential expression of fatty acid synthase (FAS) and ErbB2 in
nonmalignant and malignant oral keratinocytes. Virchows Arch.
453:57–67. 2008. View Article : Google Scholar : PubMed/NCBI
|
|
49
|
Menendez JA, Papadimitropoulou A, Vellon L
and Lupu R: A genomic explanation connecting ‘Mediterranean diet’,
olive oil and cancer: Oleic acid, the main monounsaturated fatty
acid of olive oil, induces formation of inhibitory ‘PEA3
transcription factor-PEA3 DNA binding site’ complexes at the
Her-2/neu (erbB-2) oncogene promoter in breast, ovarian and stomach
cancer cells. Eur J Cancer. 42:2425–2432. 2006. View Article : Google Scholar : PubMed/NCBI
|
|
50
|
Lin JT, Wu MS, Shun CT, Lee WJ, Sheu JC
and Wang TH: Occurrence of microsatellite instability in gastric
carcinoma is associated with enhanced expression of erbB-2
oncoprotein. Cancer Res. 55:1428–1430. 1995.PubMed/NCBI
|
|
51
|
Wu MS, Shun CT, Wang HP, et al: Genetic
alterations in gastric cancer: Relation to histological subtypes,
tumor stage, and Helicobacter pylori infection.
Gastroenterology. 112:1457–1465. 1997. View Article : Google Scholar : PubMed/NCBI
|
|
52
|
Polkowski W, van Sandick JW, Offerhaus GJ,
et al: Prognostic value of Laurén classification and c-erbB-2
oncogene overexpression in adenocarcinoma of the esophagus and
gastroesophageal junction. Ann Surg Oncol. 6:290–297. 1999.
View Article : Google Scholar : PubMed/NCBI
|
|
53
|
Lemoine NR, Jain S, Silvestre F, et al:
Amplification and overexpression of the EGF receptor and c-erbB-2
proto-oncogenes in human stomach cancer. Br J Cancer. 64:79–83.
1991. View Article : Google Scholar : PubMed/NCBI
|
|
54
|
Tanner M, Hollmén M, Junttila TT, et al:
Amplification of HER-2 in gastric carcinoma: Association with
Topoisomerase IIalpha gene amplification, intestinal type, poor
prognosis and sensitivity to trastuzumab. Ann Oncol. 16:273–278.
2005. View Article : Google Scholar : PubMed/NCBI
|
|
55
|
Alli PM, Pinn ML, Jaffee EM, McFadden JM
and Kuhajda FP: Fatty acid synthase inhibitors are
chemopreventative for mammary cancer in neu-N transgenic mice.
Oncogene. 24:39–46. 2005. View Article : Google Scholar : PubMed/NCBI
|
|
56
|
Gravalos C and Jimeno A: HER2 in gastric
cancer: A new prognostic factor and a novel therapeutic target. Ann
Oncol. 19:1523–1529. 2008. View Article : Google Scholar : PubMed/NCBI
|
|
57
|
DeVita F, Giuliani F, Silvestris N,
Catalano G, Ciardiello F and Orditura M: Human epidermal growth
factor receptor 2 (HER2) in gastric cancer: A new therapeutic
target. Cancer Treat Rev. 36 Suppl 3:S11–S15. 2010. View Article : Google Scholar
|
|
58
|
Lee KE, Lee HJ, Kim YH, et al: Prognostic
significance of p53, nm23, PCNA and c-erbB-2 in gastric cancer. Jpn
J Clin Oncol. 33:173–179. 2003. View Article : Google Scholar : PubMed/NCBI
|
|
59
|
Yu GZ, Chen Y and Wang JJ: Overexpression
of Grb2/HER2 signaling in Chinese gastric cancer: Their
relationship with clinicopathological parameters and prognostic
significance. J Cancer Res Clin Oncol. 135:1331–1339. 2009.
View Article : Google Scholar : PubMed/NCBI
|
|
60
|
Park DI, Yun JW, Park JH, et al: HER-2/neu
amplification is an independent prognostic factor in gastric
cancer. Dig Dis Sci. 51:1371–1379. 2006. View Article : Google Scholar : PubMed/NCBI
|
|
61
|
Begnami MD, Fukuda E, Fregnani JH, et al:
Prognostic implications of altered human epidermal growth factor
receptors (HERs) in gastric carcinomas: HER2 and HER3 are
predictors of poor outcome. J Clin Oncol. 29:3030–3036. 2011.
View Article : Google Scholar : PubMed/NCBI
|
|
62
|
Pauletti G, Godolphin W, Press MF and
Slamon DJ: Detection and quantitation of HER-2/neu gene
amplification in human breast cancer archival material using
fluorescence in situ hybridization. Oncogene. 13:63–72.
1996.PubMed/NCBI
|
|
63
|
Hochwald SN, Kim S, Klimstra DS, Brennan
MF and Karpeh MS: Analysis of 154 actual five-year survivors of
gastric cancer. J Gastrointest Surg. 4:520–525. 2000. View Article : Google Scholar : PubMed/NCBI
|
|
64
|
Takahiro T, Shinichi K and Toshimitsu S:
Expression of fatty acid synthase as a prognostic indicator in soft
tissue sarcomas. Clin Cancer Res. 9:2204–2212. 2003.PubMed/NCBI
|
|
65
|
Migita T, Ruiz S, Fornari A, et al: Fatty
acid synthase: A metabolic enzyme and candidate oncogene in
prostate cancer. J Natl Cancer Inst. 101:519–532. 2009. View Article : Google Scholar : PubMed/NCBI
|
|
66
|
Lan KH, Lu CH and Yu D: Mechanisms of
trastuzumab resistance and their clinical implications. Ann N Y
Acad Sci. 1059:70–75. 2005. View Article : Google Scholar : PubMed/NCBI
|
|
67
|
Nahta R, Yu D, Hung MC, Hortobagyi GN and
Esteva FJ: Mechanisms of disease: Understanding resistance to
HER2-targeted therapy in human breast cancer. Nat Clin Pract Oncol.
3:269–280. 2006. View Article : Google Scholar : PubMed/NCBI
|
|
68
|
Nahta R and Esteva FJ: Herceptin:
Mechanisms of action and resistance. Cancer Lett. 232:123–138.
2006. View Article : Google Scholar : PubMed/NCBI
|
|
69
|
Hortobagyi GN: Trastuzumab in the
treatment of breast cancer. N Engl J Med. 353:1734–1736. 2005.
View Article : Google Scholar : PubMed/NCBI
|
|
70
|
VazquezMartin A, Colomer R, Brunet J and
Menendez JA: Pharmacological blockade of fatty acid synthase (FASN)
reverses acquired autoresistance to trastuzumab (Herceptin by
transcriptionally inhibiting ‘HER2 super-expression’ occurring in
high-dose trastuzumab-conditioned SKBR3/Tzb100 breast cancer cells.
Int J Oncol. 31:769–776. 2007.PubMed/NCBI
|
|
71
|
Menendez JA, Vellon L and Lupu R:
Targeting fatty acid synthase-driven lipid rafts: A novel strategy
to overcome trastuzumab resistance in breast cancer cells. Med
Hypotheses. 64:997–1001. 2005. View Article : Google Scholar : PubMed/NCBI
|