Introduction
In general, cell lines are considered to be
genetically and phenotypically homogenous populations of cells.
When cell lines are cultured in vitro, the most adaptable
clone is usually the one that expands most rapidly during the
stabilization process, and the cells derived from this clone become
the most abundant in the culture. Generally, ≤20–30 passages are
required in order to purify the cells derived from this clone from
other clones that may also be present in the culture. This
potential genetic heterogeneity displayed by cell lines cultured
in vitro has led to certain opposition to the use of cancer
cell lines in modern drug testing (1,2). The
number of cell lines described as consisting of several genetically
different cell populations has increased in the recent years
(3,4).
However, the number of publications based on genetically
heterogeneous cell lines is limited. The analysis of genetically
heterogenous cell cultures is more complicated than that of
genetically homogenous cell populations, due to the flexibility and
differences in adaptation exhibited by the different populations
present in the culture, and typically requires the combination of
well-established methodologies, including immunocytochemistry (ICC)
and cell sorting, with novel technologies such as massive parallel
sequencing. These types of genetic analyses are of importance,
particularly for cancer, since the mutational analysis of the
cellular heterogeneity of an specimen offers an evolutionary
perspective of the carcinogenic process. In the present study, the
genetic heterogeneity of RPMI-8402, a T-acute lymphoblastic
leukemia (T-ALL) cell line, is analyzed in depth, and the
usefulness of cell lines in anticancer drug research is debated
(5–7).
Materials and methods
RPMI-8402 cell culture
The RPMI-8402 cell line (ACC 290 human, peripheral
blood, leukaemia, acute lymphoblastic T cell) was purchased from
the Leibniz Institute DSMZ-German Collection of Microorganisms and
Cell Cultures (Brunswick, Germany). RPMI-8402 cells were cultured
at low and high density in RPMI-1640 expansion medium supplemented
with 10% FBS (both PAA, Linz, Austria) and
penicillin/streptomycin/glutamin (Thermofisher Scientific, Inc.,
Waltham, MA< USA) in %% CO2 for 24 h.
DNA and RNA extraction
DNA and RNA were isolated from RPMI-8402 cells at 48
and 72 h post-seeding, using AllPrep DNA/RNA Mini Kit (Qiagen GmbH,
Hilden, Germany) according to the manufacturers protocol. The
concentration and purity of the nucleic acids were measured by
NanoPhotometer® (Implen GmbH, Munich, Germany).
TP53 mutation detection
The TP53 gene was sequenced via the Sanger's method
(also known as the dideoxy sequencing or chain termination method),
using cDNA as template. Reverse transcription was performed with
QuantiTect® Reverse Transcription Kit (Qiagen GmbH), according to
the manufacturers protocol. The exons 4–8 of the TP53 gene
on the cDNA template were amplified by polymerase chain reaction
(PCR), using Q5® Hot Start High-Fidelity DNA Polymerase (New
England BioLabs, Inc., Ipswich, MA, USA). The primer sequences used
for PCR and sequencing of the TP53 gene are indicated in
Table I. The cycling conditions were
as follows: 30 sec at 98°C (polymerase activation), followed by 35
cycles of 10 sec at 98°C (denaturation), 20 sec at 63°C
(annealing), 20 sec at 72°C (extension), and 2 min at 72°C (final
extension). Next, samples were purified with NucleoSpin Gel and PCR
Clean-up (Macherey-Nagel GmbH, Düren, Germany). cDNA sequencing was
performed using BigDye Terminator v3.1 Cycle Sequencing Kit
(Applied Biosystems, Thermo Fisher Scientific, Inc., Waltham, MA,
USA) following the manufacturers protocol. Upon ethanol/EDTA
precipitation, the sequences were analysed with ABI PRISM® 310
Genetic Analyzer (Applied Biosystems, Thermo Fisher Scientific,
Inc.), using the DNA sequencing analysis software provided with the
instrument.
 | Table I.Primer sequences used for sequencing
the TP53 gene. |
Table I.
Primer sequences used for sequencing
the TP53 gene.
| TP53
sequencing primer | Exon | Sequence |
|---|
| TP53_Forward1 | 4–5 |
5′-CCAGAGGCTGCTCCCCCCGT-3′ |
| TP53_Reverse1 | 4–5 |
5′-TCATCCAAATACTCCACACG-3′ |
| TP53_Forward2 | 5–8 |
5′-GCCATCTACAAGCAGTCACAGC-3′ |
| TP53_Reverse2 | 5–8 |
5′-ATCCAGTGGTTTCTTCTT-3′ |
ICC
RPMI-8402 cells, obtained from expansion of the
culture, were fixed for 15 min in phosphate-buffered saline (PBS)
containing 4% paraformaldehyde (Sigma-Aldrich, St. Louis, MO, USA),
and next permeabilised with 0.1% Triton™ X-100 (Sigma-Aldrich) for
10 min at room temperature (RT) while agitating. The fixed cells
were subsequently blocked with 2% donkey serum (Sigma-Aldrich)
dissolved in PBS for 1 h at RT while agitating, and then incubated
with monoclonal rabbit antibody against human TP53 (dilution 1:200;
cat no. sc-6243, Santa Cruz Biotechnology, Inc., Dallas, TX, USA).
Next, the cells were incubated with anti-rabbit Alexa Fluor 488
secondary antibody (dilution 1:1,000; Invitrogen, Thermo Fisher
Scientific, Inc.) for 1 h at RT in the dark, and the cell nuclei
were counterstained with DAPI (Sigma-Aldrich). Slides were
cover-slipped and examined under a fluorescence microscope (ECLIPSE
Ci-S; Nikon, Corporation, Tokyo, Japan), using ACT-1 software
(Nikon, Corporation).
Fluorescence in situ hybridization
(FISH) analyses
For the simultaneous detection of the number of
copies of the TP53 gene and chromosome 17 centromere (CEP17)
by FISH, TP53/CEP 17 FISH Probe Kit (Vysis, Abbott Molecular, Des
Plaines, IL, USA) was used. The reaction was conducted according to
the following protocol: Fixed samples were incubated in 2X standard
saline citrate (SSC) buffer (Abbott Molecular) at 72°C for 2 min,
followed by 5-min incubation at 37°C in a 0.5 mg/l protease
solution (Abbott Molecular, Des Plaines, IL, USA), and then washed
in PBS for 5 min at RT. Next, the specimens were fixed for 5 min at
RT in 1% formaldehyde solution; washed in PBS for 5 min at RT;
dehydrated in 70% ethanol for 1 min, followed by 1-min incubation
in 85% ethanol, and 5-min incubation in 100% ethanol; and dried at
RT, prior to be placed on a slide warmer at 50°C for 2 min. The
FISH probe mix was centrifuged and denatured at 73°C for 5 min.
Upon addition of the denaturated probe, the specimens were
cover-slipped and incubated at 37°C overnight in a humidified
chamber, prior to be subjected to hybridization. Subsequently, the
cell specimens were washed with 0.4X SSC buffer containing 0.3%
Nonidet (N)P-40 (Abbott Molecular) at 73°C for 2 min, followed by
1-min wash at RT with 2X SSC buffer containing 0.1% NP-40. Next,
the specimens were dried in the dark at RT, stained with 10 µl 125
ng/ml DAPI solution (Abbott Molecular) and cover-slipped. The
samples were analysed with ECLIPSE Ci-S fluorescence microscope,
which was equipped with a specifically designed combination of
filters for a range of green and orange light. The number of red
signals, resulting from the binding of the TP53-specific probe,
directly indicated the number of copies of TP53, while the number
of green signals, caused by the binding of the CEP 17 probe,
directly indicated the number of copies of the chromosome 17.
Fluorescence activated cell sorting
(FACS)
For FACS analysis, 5×10⁶ cells were
suspended in 0.5 ml 0.5% bovine serum albumin (BSA) (Sigma-Aldrich)
in PBS; fixed in PBS containing 4% paraformaldehyde for 10 min;
permeabilised with 0.1% Triton™ X-100 for 10 min at RT; and washed
three times with 0.5 ml 0.5% BSA dissolved in PBS. Nonspecific
binding sites were blocked by incubation with 2% BSA dissolved in
PBS for 15 min. Next, 25% cells were subjected to a preliminary
analysis to evaluate their size and granularity, and 75% of them
were then selected for immunolabeling with rabbit anti-TP53
antibody (diluted 1:200 in PBS; cat no. sc-6243; Santa Cruz
Biotechnology, Inc.). For immunolabeling, the fixed cells were
incubated with the aforementioned primary antibody for 15 min at
RT, followed by 15-min incubation at RT with a goat anti-rabbit
Alexa Fluor® 488 fluorochrome-conjugated secondary antibody
(dilution 1:1,000 in PBS; cat no., Invitrogen, Thermo Fisher
Scientific, Inc.) for visualization of the labeled proteins. Cell
sorting was performed with Amnis® Imaging Flow Cytometer (Amnis,
EMD Millipore, Billerica, MA, USA). Side scatter and forward
scatter gate parameters were selected to sort cells according to
their cell size and granularity, which had been previously
determined during the preliminary analysis. The selected population
of cells was divided into two groups, TP53+ and
TP53−, according to the intensity of the fluorescence
signal arising from the secondary antibody. To ensure the precision
of the selection process, the two cells detected following a
TP53+ cell, were excluded. Cell debris was collected in
a separate tube. Sorted cells (≤5×10⁵ cells) were
subjected to DNA/RNA isolation for further sequencing analysis.
Ion Torrent™ Personal Genome Machine
(PGM) sequencing and sequencing data analysis
Library preparation and sequencing were performed
with Ion Torrent™ PGM (Thermo Fisher Scientific, Inc.), following
the manufacturer's protocol, using whole genomic DNA isolated from
RPMI-8402 cells.
The high-quality DNA required for sequencing was
isolated from RPMI-8402 cells using AllPrep DNA/RNA Mini Kit, and
purified with NucleoSpin Gel and PCR Clean-up. The concentration
and purity of the extracted DNA were estimated by NanoPhotometer®
and Qubit 2.0® Fluorometer (Thermo Fisher Scientific, Inc).
Ion AmpliSeq™ Libraries were constructed using Ion
AmpliSeq 2.0 Library Kit (Thermo Fisher Scientific, Inc.), and
purified with Agencourt AMPure XP (Beckman Coulter, Inc., Brea, CA,
USA). Target amplification was performed using four pools of 4,000
primers (Ion AmpliSeq™ Comprehensive Cancer Panel; Thermo Fisher
Scientific, Inc.). The quantification of libraries was estimated
with Qubit 2.0 Fluorometer, using Qubit dsDNA HS Assay Kit (Thermo
Fisher Scientific, Inc.). The size of the DNA fragments in each
pool and the concentration of the final libraries were evaluated by
2100 BioAnalyzer (Agilent Technologies, Inc., Santa Clara, CA, USA)
with High Sensitivity DNA Analysis Kit (Agilent Technologies,
Inc.).
Upon dilution, the libraries were mixed and used to
prepare Ion Sphere™ particles (ISPs), using Ion OneTouch™ 2 System
(Thermo Fisher Scientific, Inc.) and Ion PGM™ Template OT2 200 Kit
(Thermo Fisher Scientific, Inc.). The quality of the unenriched,
template-positive ISPs was assessed with Qubit 2.0 Fluorometer,
using Alexa Fluor® 488 and 647 fluorophores (Invitrogen, Thermo
Fisher Scientific, Inc.). Following emulsion PCR and recovery, the
template-positive ISPs were enriched with Ion OneTouch™ ES (Thermo
Fisher Scientific, Inc.), using Dynabeads® MyOne™ Streptavidin C1
(Thermo Fisher Scientific, Inc.), and subjected to sequencing.
The sequencing process, which included 500 flows and
>5×10⁶ total counts with 99.5% aligned bases, was
performed on Ion 318™ Chip (Thermo Fisher Scientific, Inc.), using
Ion PGM™ Sequencing 200 Kit v2 (Thermo Fisher Scientific, Inc.).
Ion Torrent™PGM sequencing of RPMI-8402 cells was performed using
Ion AmpliSeq™ Comprehensive Cancer Panel (Thermo Fisher Scientific,
Inc.), which included 16,000 pairs of primers (4,000 in each pool)
that enabled to cover exons in ~400 genes involved in
tumorigenesis.
The data obtained from the Ion Torrent™ PGM
sequencing reaction were directly processed to generate sequence
reads, and loaded onto Ion Torrent Server™ (Thermo Fisher
Scientific, Inc.).
Initial variant calling from the Ion AmpliSeq™
sequencing data were generated by Torrent Suite™ Software version
4.0.2 (Thermo Fisher Scientific, Inc.) with Torrent Variant Caller
plug-in version 4.0 (Thermo Fisher Scientific, Inc.). The analysis
was performed using Homo sapiens hg19 genome as
reference.
In order to ensure the specificity and sensitivity
of the assay, the following restrictions were applied during the
generation of the final results: i) The frequency of the candidate
sites with potential mutations was analysed, and those mutations
presenting a frequency in the range of 20–100 were used for further
analysis; ii) for the filters, ‘total coverage depth >100’ and
‘coverage ± >20’ settings were used to eliminate potential false
positives arising from low read depth; and iii) a subsequent
filtering step was applied to eliminate those mutations that were
detected in one strand, in order to reduce possible strand-specific
errors. The data fulfilling all the aforementioned filtering
criteria were used for further analysis, leading to the
identification of single nucleotide polymorphisms (SNPs),
insertions and deletions. The variant calls were visualised with
Integrative Genomics Viewer software, version 8 (http://www.broadinstitute.org/software/igv), and the
detected mutations were compared to mutations in RPMI-8402 cells
that had been previously reported in the Broad-Novartis Cancer Cell
Line Encyclopedia (CCLE) (http://www.broadinstitute.org/ccle) (8).
Results
The ratio of mutated to wild-type (WT)
TP53 DNA
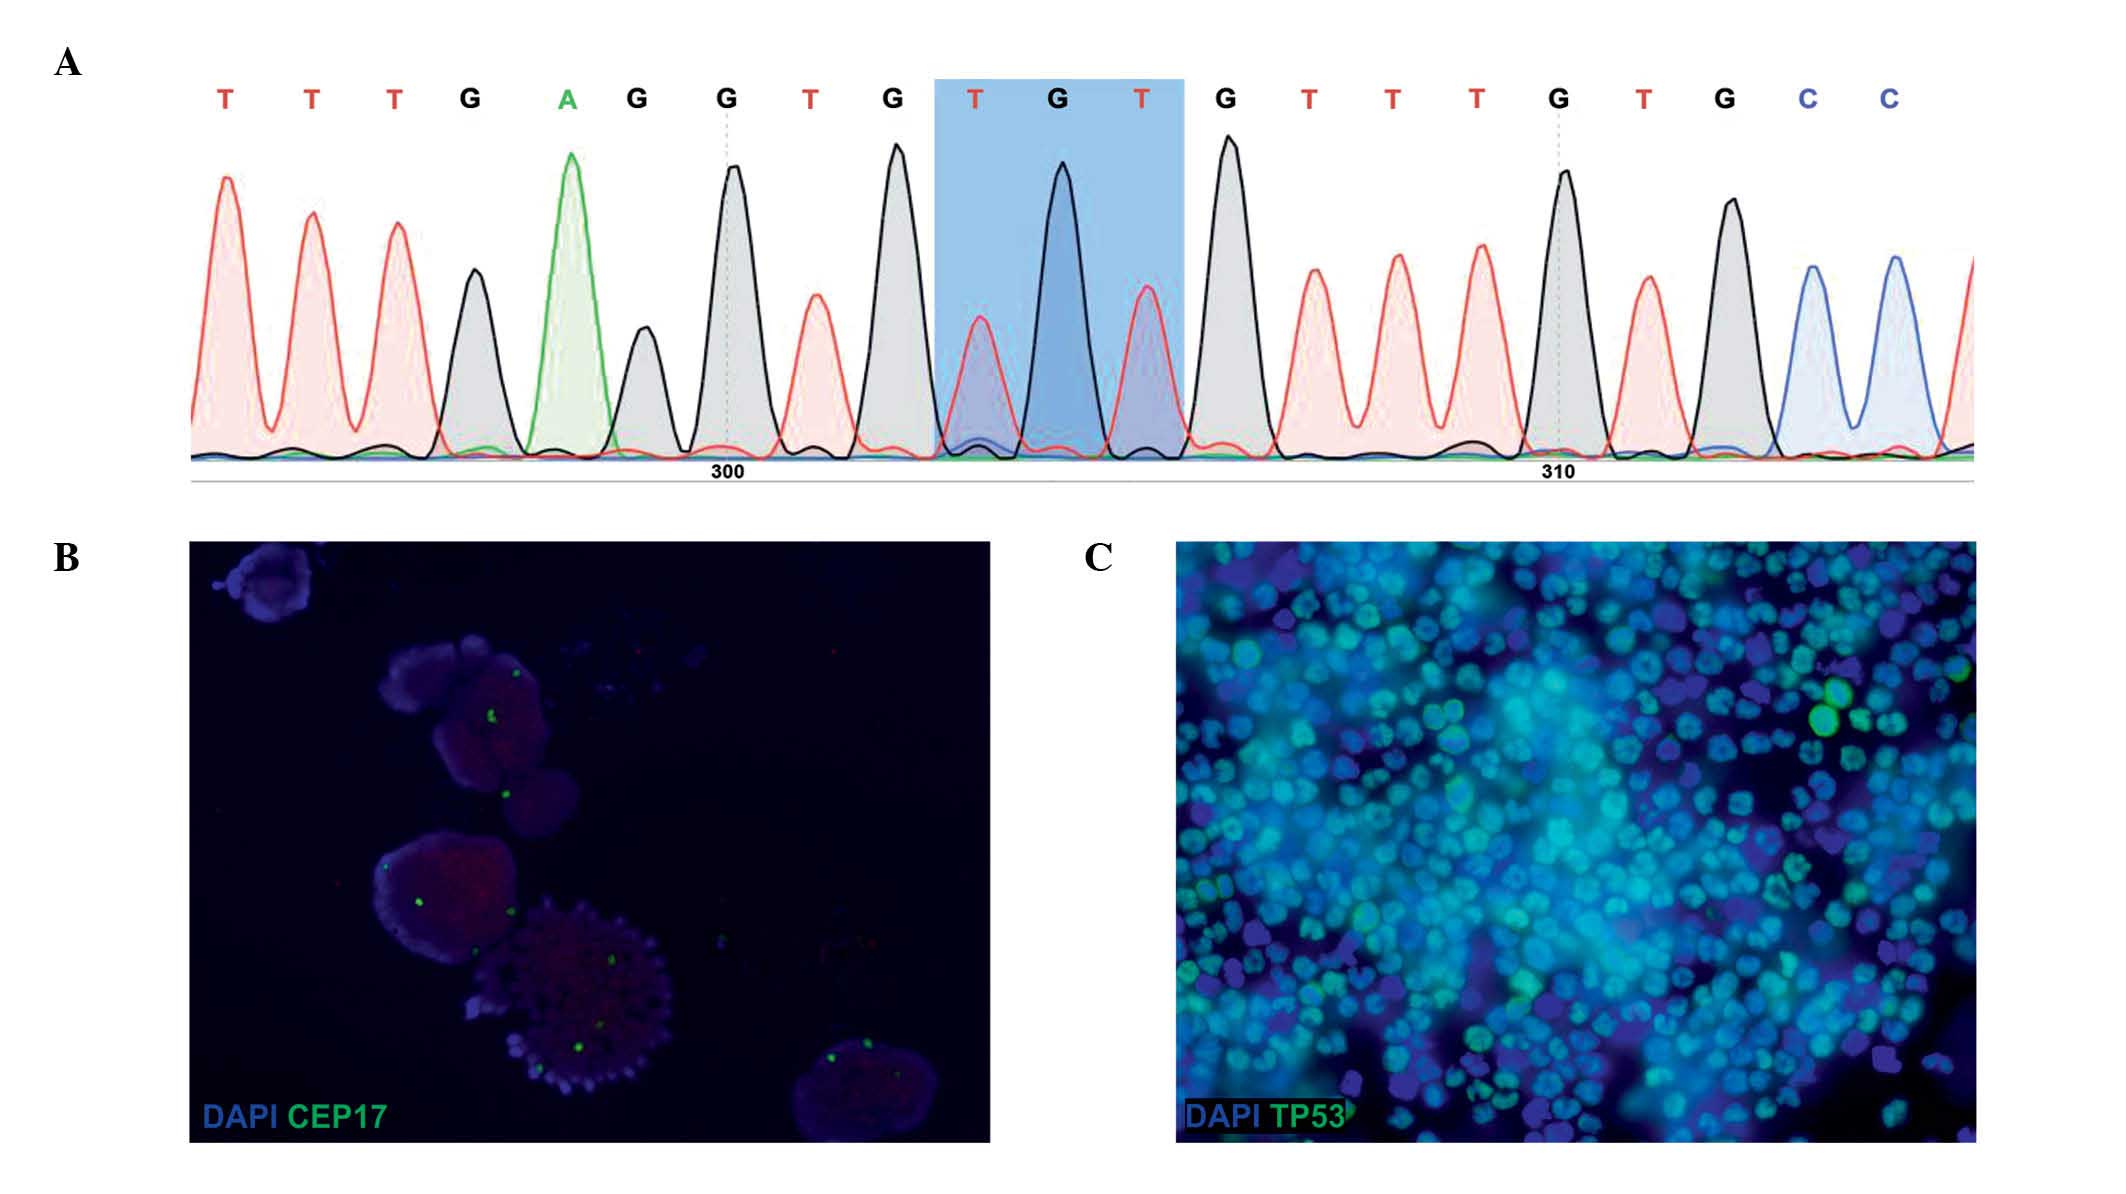
Sequencing analysis demonstrated the presence of the
heterozygous mutation CGT-TGT (Arg-Cys) in codon 273 of the
TP53 gene (Fig. 1A). In cells
cultured at low density, the ratio of mutated to WT TP53
detected by sequencing was 0.9, whereas in high density cultures
this ratio reduced to 0.4.
Genetic heterogeneity visualized at
the single cell level
FISH analysis with CEP17 demonstrated an
heterogeneous number of copies of the chromosome 17 (3–7
copies/cell, 4 copies/cell on average) (Fig. 1B). In addition, ICC analysis
identified two distinct populations of cells, one of them
displaying nuclear accumulation of TP53 (TP53+), and the
other one presenting low expression levels of TP53
(TP53−) (Fig. 1C).
Cell sorting
Two cell populations were sorted by FACS, based on
their expression levels of TP53, and subsequently subjected to
sequencing analysis. TP53+ cells exhibited a higher
proportion of the mutated template, compared with the
TP53− population (Table
II). Further analyses revealed a heterozygous mutation in the
phosphatase and tensin homolog (PTEN) gene in TP53+
cells, which was absent in the TP53− population. By
contrast, a homozygous mutation in the F-Box and WD repeat domain
containing 7 (FBXW7) gene was observed in both cell
populations.
| Table II.Sequencing results of the sorted cell
populations. |
Table II.
Sequencing results of the sorted cell
populations.
| Gene/population | TP53+
population | TP53−
population |
|---|
| TP53 | Heterozygous | Trace or absence of
mutated template |
| PTEN | Heterozygous | Trace or absence of
mutated template |
| FBXW7 | Homozygous | Homozygous |
Massive parallel sequencing and
database analysis
The results of massive parallel sequencing were
consistent with the data previously published in CCLE, confirming
the reliability of the analyses performed on the present study.
Furhermore, massive parallel sequencing demonstrated that the
RPMI-8402 cell line consists of several genetically different cell
populations. Consistently with the sorting analysis and Sangers
sequencing, massive parallel sequencing detected the aforementioned
R159S mutation in the PTEN gene in 36% of the templates. In
addition, mutations in Harvey rat sarcoma viral oncogene homolog
(HRAS) (A134S), low-density lipoprotein receptor-related protein 1B
(LPRB1) (R3239G) and tuberous sclerosis complex 2 (TSC2) (A614T)
were detected in 30, 24 and 73% of the templates, respectively
(Table III). These mutations, as
well as mutations in Wolf-Hirschhorn syndrome candidate 1 (WHSC1)
and peroxisome proliferator-activated receptor γ (PPARγ) (Table III), represent an additional
indication of genetic heterogeneity in the RPMI-8402 cell line,
which may be used to reconstruct the carcinogenic process leading
to the development of T-ALL (Tables
III and IV).
| Table III.Mutations detected by Ion Torrent™
Personal Genome Machine sequencing in the RPMI-8402 cell line,
which had been previously described in the Cancer Cell Line
Encyclopedia. |
Table III.
Mutations detected by Ion Torrent™
Personal Genome Machine sequencing in the RPMI-8402 cell line,
which had been previously described in the Cancer Cell Line
Encyclopedia.
| Gene ID | Allele source | Type | Allele name | Frequency (%) | Quality |
|---|
| FBXW7 | Hotspot | SNP | COSM22965 | 100 | 3759.76 |
|
|
|
| COSM117310 |
|
|
|
|
|
| COSM117309 |
|
|
|
|
|
| COSM117308 |
|
|
| NOTCH4 | Novel | DEL | – | 100 | 1037.50 |
| TSC2 | Novel | SNP | – | 73.1 |
616.35 |
| WT1 | Novel | SNP | – | 51.5 |
901.63 |
| TP53 | Hotspot | SNP | COSM99933 | 51.2 |
892.21 |
| WHSC1 | Novel | SNP | – | 51.0 |
882.84 |
| PKHD1 | Novel | SNP | – | 48.5 |
787.38 |
| PPARG | Novel | SNP | – | 45.5 |
687.62 |
| PTEN | Hotspot | SNP | COSM5287 | 36.0 |
146.91 |
| HRAS | Novel | SNP | – | 30.7 |
251.17 |
| LRP1B | Novel | SNP | – | 24.0 |
91.27 |
| Table IV.Novel mutations detected by Ion
Torrent™ Personal Genome Machine sequencing in the RPMI-8402 cell
line, which had not been previously published in the Cancer Cell
Line Encyclopedia. |
Table IV.
Novel mutations detected by Ion
Torrent™ Personal Genome Machine sequencing in the RPMI-8402 cell
line, which had not been previously published in the Cancer Cell
Line Encyclopedia.
| Gene ID | Type | Frequency (%) | Allele call | Chromosome | Position | Reference | Variant | Coverage |
|---|
| PDE4DIP | DEL | 20.4 | Heterozygous | 1 |
1.45×10⁸ | C | – | 397 |
| LPP | INS | 25.3 | Heterozygous | 3 |
1.88×10⁸ | – | T | 292 |
| IGF1R | DEL | 27.7 | Heterozygous | 15 | 99467943 | GT | – | 267 |
| BLM | INS | 34.6 | Heterozygous | 15 | 91358272 | – | GAA | 396 |
| LTF | INS | 37.0 | Heterozygous | 3 | 46501285 | – | CTT | 392 |
| ROS1 | INS | 43.5 | Heterozygous | 6 |
1.18×10⁸ | – | TAA | 168 |
| TCF7L1 | DEL | 45.6 | Heterozygous | 2 | 85536129 | TCTT | – | 386 |
|
HSP90AB1 | DEL | 46.9 | Heterozygous | 6 | 44221146 | GAGTTTGT | – | 326 |
| FN1 | DEL | 52.3 | Heterozygous | 2 |
2.16×10⁸ | AA | – | 327 |
| FN1 | DEL | 55.2 | Heterozygous | 2 |
2.16×10⁸ | AC | – | 223 |
| FN1 | DEL | 59.2 | Heterozygous | 2 |
2.16×10⁸ | AC | – | 343 |
| SF3B1 | INS | 52.4 | Heterozygous | 2 |
1.98×10⁸ | – | AA | 246 |
| CRBN | INS | 52.9 | Heterozygous | 3 |
3192525 | – | TAAC | 363 |
| NUP98 | DEL | 58.1 | Heterozygous | 11 |
3789983 | AAAAAGAAAAA | – | 327 |
| PTEN | INS | 63.3 | Heterozygous | 10 | 89717681 | – | CCCCCGGCCC | 294 |
| CDK6 | DEL | 70.2 | Heterozygous | 7 | 92244631 | ATACA | – | 161 |
| LIFR | DEL | 78.9 | Heterozygous | 5 | 38528952 | AC | – | 209 |
| MLL3 | DEL | 85.6 | Heterozygous | 7 |
1.52×10⁸ | T | – | 209 |
| MTR | INS | 90.7 | Homozygous | 1 |
2.37×10⁸ | – | TCTG | 396 |
| MTR | INS |
100 | Homozygous | 1 |
2.37×10⁸ | – | T | 127 |
| HLF | INS | 92.1 | Homozygous | 17 | 53342797 | – | TTTC | 151 |
| AFF1 | DEL | 98.7 | Homozygous | 4 | 88056720 | T | – | 311 |
| PIK3C2B | INS |
100 | Homozygous | 1 |
2.04×10⁸ | – | C | 291 |
| PDGFRA | INS |
100 | Homozygous | 4 | 55151959 | – | A | 242 |
| SYNE1 | DEL |
100 | Homozygous | 6 |
1.52×10⁸ | TGTT | – | 217 |
| WRN | INS |
100 | Homozygous | 8 | 31005018 | – | C | 392 |
| NUMA1 | DEL |
100 | Homozygous | 11 | 71728909 | GTCAAC | – | 142 |
| PLEKHG5 | DEL | 33.4 | Heterozygous | 1 |
6529183 | TCC | – | 356 |
| AKAP9 | INS | 89.7 | Heterozygous | 7 | 91669961 | – | T | 87 |
Discussion
RPMI-8402 is a genetically heterogenous T-ALL cell
line (9). Using DNA sequencing, the
present study identified a heterozygous Arg-Cys mutation at codon
273 of the TP53 gene in RPMI-8402 cells, with varying
proportions of the templates (50–75% of WT allele), depending on
cell confluence. Additionally, FISH analysis detected a variable
number of copies of the chromosome 17 in RPMI-8402 cells, while ICC
analysis revealed two different cell populations, exhibiting high
and low protein expression levels of TP53, respectively, which
suggests genetic heterogeneity of the RPMI-8402 cell line. Cell
sorting analysis identified heterogeneity of PTEN and
TP53 mutations, but an homozygous mutation in the
FBXW7 gene was detected in both cell populations.
Furthermore, massive parallel sequencing confirmed the genetic
heterogeneity of RPMI-8402 cells, and excluded the possibility of
cross-contamination with another cell line. The comparison between
the results obtained with Ion Torrent™ and Sanger sequencing
indicates that the former method provides high sensitivity and
specificity and, therefore, may be the a suitable technique for
mutational analysis of cancer samples (10–12).
However, strict parameters should be employed when using Ion
Torrent™ sequencing, in order to ensure a correct analysis of the
data. The results of the present study demonstrated that the
RPMI-8402 cell line consists of several genetically different
subpopulations. Furthermore, the proportion of cells with different
mutations was observed to vary during cell culturing. Thus, in low
density cultures, a significant proportion of the cells exhibited a
mutated version of TP53, while at high density, cells
carrying mainly the WT TP53 template constituted the
majority of the culture.
From the perspective of new drug development, the
heterogeneity of RPMI-8402 cells may be regarded at the same time
as a difficulty and an opportunity. Thus, the results of
antineoplastic drug testing may be influenced by the culture
confluence, since different cell subpopulations may display
different drug resistance, which may complicate the interpretation
of the data. However, the findings of the present study, which
identified genetic heterogeneity in the cell line RPMI-8402, may
support the use of cell lines in future anticancer drug studies,
since the lack of genetic heterogeneity (contrarily to what is
typically observed in neoplasms) was one of the arguments against
the use of cell lines in drug research (13,14).
Additionally, the results of the analyses of the
RPMI-8402 cell line conducted in the present study may be used to
elucidate the evolution of mutational alterations that occur during
carcinogenesis. The results of the present study suggest that
mutations in genes such as FBXW7, neurogenic locus notch
homolog 4, 5-methyltetrahydrofolate-homocysteine methyltransferase
(MTR; Table IV), nuclear
mitotic apparatus protein 1, platelet-derived growth factor
receptor α, synaptic nuclear envelope protein 1 and Werner syndrome
occurred early in the process of carcinogenesis, since all the
cells analysed contained the mutated templates. These alterations
were possibly followed by mutations in TP53, Wilms tumor 1,
PTEN, cyclin-dependent kinase 6, leukemia inhibitory factor
receptor, mixed-lineage leukemia protein 3, A-kinase anchor protein
9, hepatic leukemia factor and AF4/FMR2 family, member 1; while the
mutations detected in lactotransferrin, ROS1, transcription
factor 7-like 1, heat shock protein 90 kDa α (cytosolic), class B
member 1, fibronectin 1, splicing factor 3B subunit 1, cereblon and
nuclear pore complex protein 98 possibly occurred at later stages
of the carcinogenic process. In addition, mutations in genes such
as low-density lipoprotein receptor-related protein 1B,
phosphodiesterase 4D-interacting protein, lipoma-preferred partner,
insulin-like growth factor 1 receptor and pleckstrin homology
domain containing, family G member 5 and Bloom syndrome genes were
observed in minor subpopulations of cells, where the mutated
template constituted ~20%, suggesting their generation at the final
stages of carcinogenesis (Table IV).
Previous studies have demonstrated that certain mutations,
particularly of oncogenes, do not require an homo-/hemizygous
status to efficiently promote neoplastic transformation (15). In the case of RPMI-8402 cells,
previous studies have demonstrated hypertetraploidy in this cell
line, which further complicates the interpretation of data
(16). However, massive parallel
sequencing seems to be a useful tool in the identification of
driver genes in carcinogenesis (17,18). The
observations of the present study are in agreement with previous
analyses of clinical T-ALL samples, which revealed that individual
patients with T-ALL contained various clones that shared a common
genetic stem origin but responded differently to the therapy
(5,19).
In conclusion, the present study has demonstrated
that the RPMI-8402 cell line exhibits the genetic heterogeneity
typical of T-ALL, and therefore, it may be useful in anticancer
drug research.
Acknowledgements
The present study was supported by the National
Science Centre (Kraków, Poland) (grant nos. 2011/01/B/NZ1/01502 and
2011/01/B/NZ4/07832). Ion Torrent™ sequencing analyses were
performed within the framework of control procedures of the PGM™
equipment at the Celther Polska Ltd. (Łódź, Poland).
References
|
1
|
Gillet JP, Calcagno AM, Varma S, Marino M,
Green LJ, Vora MI, Patel C, Orina JN, Eliseeva TA, Singal V, et al:
Redefining the relevance of established cancer cell lines to the
study of mechanisms of clinical anti-cancer drug resistance. Proc
Natl Acad Sci USA. 108:18708–18713. 2011. View Article : Google Scholar : PubMed/NCBI
|
|
2
|
Gazdar AF, Gao B and Minna JD: Lung cancer
cell lines: Useless artifacts or invaluable tools for medical
science? Lung Cancer. 68:309–318. 2010. View Article : Google Scholar : PubMed/NCBI
|
|
3
|
Nugoli M, Chuchana P, Vendrell J, Orsetti
B, Ursule L, Nguyen C, Birnbaum D, Douzery EJ, Cohen P and Theillet
C: Genetic variability in MCF-7 sublines: Evidence of rapid genomic
and RNA expression profile modifications. BMC Cancer. 3:132003.
View Article : Google Scholar : PubMed/NCBI
|
|
4
|
Inoue A, Yokomori K, Tanabe H, Mizusawa H,
Sofuni T, Hayashi Y, Tsuchida Y and Shimatake H: Extensive genetic
heterogeneity in the neuroblastoma cell line NB(TU)1. Int J Cancer.
72:1070–1077. 1997. View Article : Google Scholar : PubMed/NCBI
|
|
5
|
Treanor LM, Zhou S, Janke L, Churchman ML,
Ma Z, Lu T, Chen SC, Mullighan CG and Sorrentino BP: Interleukin-7
receptor mutants initiate early T cell precursor leukemia in murine
thymocyte progenitors with multipotent potential. J Exp Med.
211:701–713. 2014. View Article : Google Scholar : PubMed/NCBI
|
|
6
|
Hait WN: Anticancer drug development: The
grand challenges. Nat Rev Drug Discov. 9:253–254. 2010. View Article : Google Scholar : PubMed/NCBI
|
|
7
|
Hutchinson L and Kirk R: High drug
attrition rates - where are we going wrong? Nat Rev Clin Oncol.
8:189–190. 2011. View Article : Google Scholar : PubMed/NCBI
|
|
8
|
Robinson JT, Thorvaldsdóttir H, Winckler
W, Guttman M, Lander ES, Getz G and Mesirov JP: Integrative
genomics viewer. Nat Biotechnol. 29:24–26. 2011. View Article : Google Scholar : PubMed/NCBI
|
|
9
|
Srivastava BI, Minowada J and Moore GE:
High terminal deoxynucleotidyl transferase activity in a new T-cell
line (RPMI 8402) of acute lymphoblastic leukemia origin. J Natl
Cancer Inst. 55:11–14. 1975.PubMed/NCBI
|
|
10
|
Gu Y, Lu K, Yang G, Cen Z, Yu L, Lin L,
Hao J, Yang Z, Peng J, Cui S and Huang J: Mutation spectrum of six
genes in Chinese phenylketonuria patients obtained through
next-generation sequencing. PLoS One. 9:e941002014. View Article : Google Scholar : PubMed/NCBI
|
|
11
|
Cai X, Sheng J, Tang C, Nandakumar V, Ye
H, Ji H, Tang H, Qin Y, Guan H, Lou F, et al: Frequent mutations in
EGFR, KRAS and TP53 genes in human lung cancer tumors detected by
ion torrent DNA sequencing. PLoS One. 9:e952282014. View Article : Google Scholar : PubMed/NCBI
|
|
12
|
Bai X, Zhang E, Ye H, Nandakumar V, Wang
Z, Chen L, Tang C, Li J, Li H, Zhang W, et al: PIK3CA and TP53 gene
mutations in human breast cancer tumors frequently detected by ion
torrent DNA sequencing. PLoS One. 9:e993062014. View Article : Google Scholar : PubMed/NCBI
|
|
13
|
Mitra A, Mishra L and Li S: Technologies
for deriving primary tumor cells for use in personalized cancer
therapy. Trends Biotechnol. 31:347–354. 2013. View Article : Google Scholar : PubMed/NCBI
|
|
14
|
Marjanovic ND, Weinberg RA and Chaffer CL:
Cell plasticity and heterogeneity in cancer. Clin Chem. 59:168–179.
2013. View Article : Google Scholar : PubMed/NCBI
|
|
15
|
Vogelstein B and Kinzler KW: Cancer genes
and the pathways they control. Nat Med. 10:789–799. 2004.
View Article : Google Scholar : PubMed/NCBI
|
|
16
|
Gebhart E, Thoma K, Verdorfer I, Drexler
HG and Efferth T: Genomic imbalances in T-cell acute lymphoblastic
leukemia cell lines. Int J Oncol. 21:887–894. 2002.PubMed/NCBI
|
|
17
|
Gerlinger M, Horswell S, Larkin J, Rowan
AJ, Salm MP, Varela I, Fisher R, McGranahan N, Matthews N, Santos
CR, et al: Genomic architecture and evolution of clear cell renal
cell carcinomas defined by multiregion sequencing. Nat Genet.
46:225–233. 2014. View
Article : Google Scholar : PubMed/NCBI
|
|
18
|
Sottoriva A, Spiteri I, Piccirillo SG,
Touloumis A, Collins VP, Marioni JC, Curtis C, Watts C and Tavaré
S: Intratumor heterogeneity in human glioblastoma reflects cancer
evolutionary dynamics. Proc Natl Acad Sci USA. 110:4009–4014. 2013.
View Article : Google Scholar : PubMed/NCBI
|
|
19
|
Mullighan CG: The molecular genetic makeup
of acute lymphoblastic leukemia. Hematology Am Soc Hematol Educ
Program. 2012:389–396. 2012.PubMed/NCBI
|