Introduction
In previous years, the association between tumor
development and autophagy has received increasing attention. As the
first gene identified to inhibit tumorigenesis through lysosome
degradation, Beclin1 has been widely studied. The mammalian Beclin1
gene encodes a B-cell lymphoma 2-interacting coiled-coil protein
that possesses structural similarities to the yeast autophagy
protein. The human Beclin1 gene, which contains 12 exons, is
located on human chromosome 17q21. It has previously been reported
that Beclin1 is a mammalian autophagy gene that inhibits
tumorigenesis (1–3). Beclin1, as a key factor that mediates
the localization of other autophagy proteins into the precursor of
autophagic bodies, is involved in the regulation of mammalian
autophagy formation (4).
Extracellular signal-regulated kinase (ERK)1/2 is a
protein involved in the Ras/Raf-1/ERK1/2 signaling pathway that is
important for autophagy (5). Sodium
arsenite induces autophagy through ERK1/2 phosphorylation in human
uroepithelial cells (6). Apelin is
isolated from an endogenous ligand from bovine gastric secretion
(7). Apelin-13 is one of the most
active protein fragments in the Apelin/Apelin receptor system, and
promotes the phosphorylation of ERK1/2 in rat vascular smooth
muscle cells in a concentration-dependent manner (8).
In the present study, the effect of Apelin-13 on the
protein and mRNA expression of ERK1/2, phosphorylated ERK (pERK)1/2
and Beclin1 was determined. The effect of Apelin-13 on autophagy in
HepG2 cells was also investigated.
Materials and methods
Reagents and instruments
RPMI-1640, fetal bovine serum (FBS), trypsin and
dimethyl sulfoxide (DMSO) were purchased from Beyotime Institute of
Biotechnology (Hangzhou, Zhejiang, China). Apelin-13 and PD98059
were purchased from Santa Cruz Biotechnology, Inc. (Dallas, TX,
USA). Monodansylcadaverine (MDC) and mouse monoclonal β-tubulin
(D-10; sc-5274), rabbit polyclonal pERK (Thr 177/Thr 160;
sc-23759-R), mouse monoclonal ERK (C-9; sc-514302) and mouse
monoclonal Beclin-1 (G-11; sc-48381) antibodies were purchased from
Santa Cruz Biotechnology, Inc. Horseradish peroxidase-conjugated
rabbit anti-mouse and mouse anti-rabbit secondary antibodies, and
the hyper-pure RNA, PrimeScript reverse transcription-polymerase
chain reaction (RT-PCR), enhanced chemiluminescence western blot
and bicinchoninic acid (BCA) protein assay kits were purchased from
Beijing ComWin Biotech Co., Ltd. (Beijing, China). The primers for
RT-PCR were synthesized by Sangon Biotech Co., Ltd. (Shanghai,
China).
An IX73 inverted and reflected fluorescent
microscope was purchased from Olympus Optical Co., Ltd. (Tokyo,
Japan). The FlourChem E HD2 and AlphaImager 2200 gel imaging
systems were purchased from ProteinSimple (San Jose, CA, USA).
Cell lines and culture
Hepatocarcinoma HepG2 cells were provided by the
Tumor Research Institute of University of South China. The cells
were cultured in RPMI-1640 medium supplemented with 10% FBS, and
maintained in a humidified incubator at 37°C and in a 5%
CO2 atmosphere. Adherent cells were trypsinized using
0.25% trypsin-EDTA, harvested and re-plated into flasks every 2–3
days. Cells in the logarithmic phase of growth were used in the
subsequent analyses.
Experimental groups and
treatments
The cells were treated with Apelin-13 and PD98059.
Apelin-13 was dissolved in phosphate-buffered saline (PBS) and
PD98059 was dissolved in DMSO. In the Apelin-13 group, the cells
were treated with Apelin-13 at final concentrations of 0.0001,
0.001, 0.01 and 0.1 µmol/l for 24 h. In the PD98059 group, the
cells were treated with 10 µmol/l PD98059 for 24 h. In the
Apelin-13 and PD98059 groups, the cells were treated with 0.1
µmol/l Apelin-13 and 10 µmol/l PD98059 for 24 h, respectively. The
cells treated with 10% FBS and DMSO were used as the control
groups.
Western blot analysis
The samples were lysed in 100 µl of lysis buffer
(RIPA:PMSF ratio, 94:6). Subsequent to incubating the samples on
ice for 30 min, the cell lysate was centrifuged at 18,000 × g for 8
min at 4°C and the supernatant was collected. The protein
concentration in the supernatant was quantified using the BCA kit.
The proteins were then separated by SDS-PAGE and transferred onto a
nitrocellulose membrane. Subsequent to blocking, the membrane was
incubated at 21°C overnight with mouse anti-β-tubulin (dilution,
1:250), mouse anti-ERK1/2 (dilution, 1:250), rabbit anti-pERK1/2
(dilution, 1:250) and mouse anti-Beclin1 (dilution, 1:250)
monoclonal primary antibodies. Subsequent to washing, the mouse
anit-rabbit and rabbit anti-mouse secondary antibodies were added
at dilutions of 1:10,000 and 1:5,000, respectively, and the
membrane was incubated at 21°C for 4 h. Finally, the membrane was
developed using enhanced chemiluminescence reagent (Beyotime
Institute of Biotechnology). The developed film was scanned using
the AlphaImager 2200 gel imaging system. The western blot images
were analyzed using GraphPad Prism 5, which was purchased from
GraphPad Software, Inc., (La Jolla, CA, USA). β-tubulin was used as
an internal control. The relative expression of ERK1/2, pERK1/2 and
Beclin1 was calculated based on the grayscale value of
β-tubulin.
RT-PCR assay
Total RNA was extracted from HepG2 cells, and the
expression of Beclin1 mRNA was detected using the PrimeScript
RT-PCR kit. According to the manufacturer's instructions, the
purity and concentration of the RNA was calculated using a DNA/RNA
calculator (Pharmacia, Fairfield, CT, USA). For the amplification
of Beclin1, PCR was performed with pre-denaturation step at 95°C
for 5 min, 35 cycles consisting of denaturation at 94°C for 30 sec,
annealing at 58°C for 40 sec and extension at 72°C for 1 min, and a
final extension at 72°C for 10 min. GAPDH was used as the internal
reference. The PCR products were separated by electrophoresis under
a constant voltage of 80 V in a 12 g/l agarose gel for 30 min. The
gel was then observed and images of the gel were captured using the
AlphaImager 2200 gel imaging analysis system. This reaction was
conducted three times. The primer sequences used were as follows:
GAPDH sense, 5′-ACCACAGTCCATGCCATCAC-3′ and anti-sense,
5′-TCCACCACCCTGTTGCTGTA-3′; Beclin1 sense,
5′-CTAAGTCGTCCAACAACAGCAC-3′ and anti-sense,
5′-CGATGTCAAAAAGGTCCC-3′. The primers were designed and synthesized
by Sangon Biotech Co., Ltd. (Shanghai, China). The relative
expression level of Beclin1 was determined by the grayscale ratio
of Beclin1 to GAPDH.
MDC staining and autophagy
detection
Based on the method described by Biederbick et
al, MDC was used to stain the autophagosomes (9). Briefly, the cells were placed on
six-well plates and treated with Apelin-13 and PD98059, as
aforementioned. Following incubation for 24 h, 0.05 mmol/l MDC was
added to the plates and the cells were incubated at 37°C for 60
min. The cells were then fixed with 4% paraformaldehyde for 15 min.
Subsequent to rinsing twice with cold PBS, the cells were observed
and photographed by inverted fluorescence microscopy.
Statistical analysis
The data were expressed as the mean ± standard
deviation and were analyzed using SPSS software, version 13 (SPSS,
Inc., Chicago, IL, USA). The differences between groups were
compared using one-way analysis of variance. Multiple comparison
between the groups was performed using the S-N-K method The
variables in the two groups were compared by Student's t-test.
P<0.05 was considered to indicate a statistically significant
difference.
Results
Apelin-13 upregulates the expression
of pERK1/2 in HepG2 cells
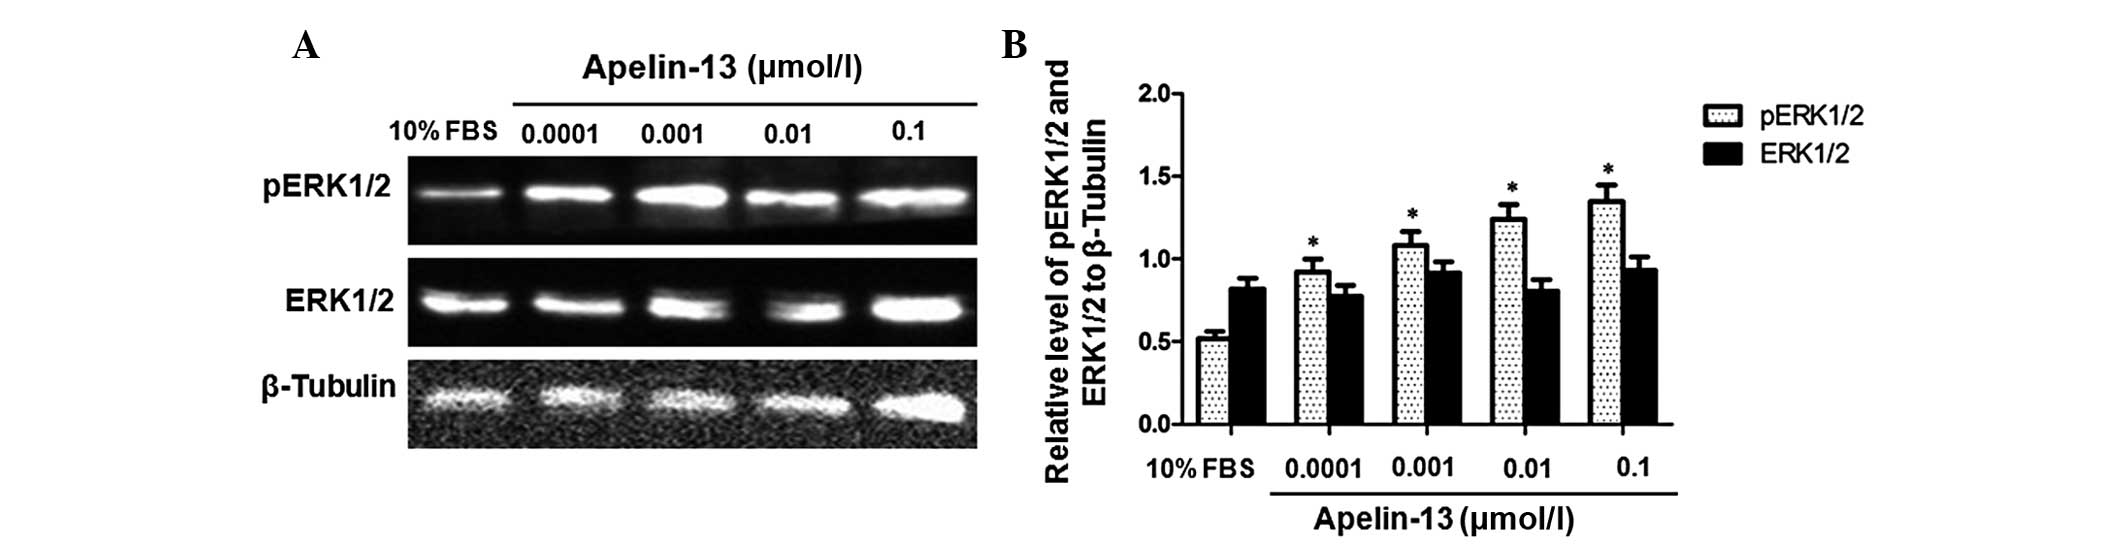
To determine the effect of Apelin-13 on the
expression of ERK1/2 and pERK1/2, western blot analysis was
performed. The cells were treated with Apelin-13 at final
concentrations of 0.0001, 0.001, 0.01 and 0.1 µmol/l for 24 h. The
cells treated with 10% FBS were used as a negative control.
Representative western blot results are presented in Fig. 1A and quantitative results are reported
in Fig. 1B. As indicated in Fig. 1, following treatment with Apelin-13,
the expression level of ERK1/2 was not evidently changed. However,
the level of pERK1/2 was increased in a dose-dependent manner. The
relative expression levels of pERK1/2 in cells treated with 10% FBS
or 0.0001, 0.001, 0.01 and 0.1 µmol/l Apelin-13 were 0.445±0.021,
0.764±0.013, 0.857±0.018, 0.906±0.072 and 1.019±0.041,
respectively. Following treatment with Apelin-13, the expression
levels of pERK1/2 at concentrations of 0.0001, 0.001, 0.01 and 0.1
µmol/l were significantly increased compared with the negative
control group (P<0.05). These data indicate that Apelin-13
induced the phosphorylation of ERK1/2 and upregulated the level of
pERK1/2 in HepG2 cells in a dose-dependent manner.
Apelin-13 upregulates the expression
of Beclin1 protein and mRNA in HepG2 cells
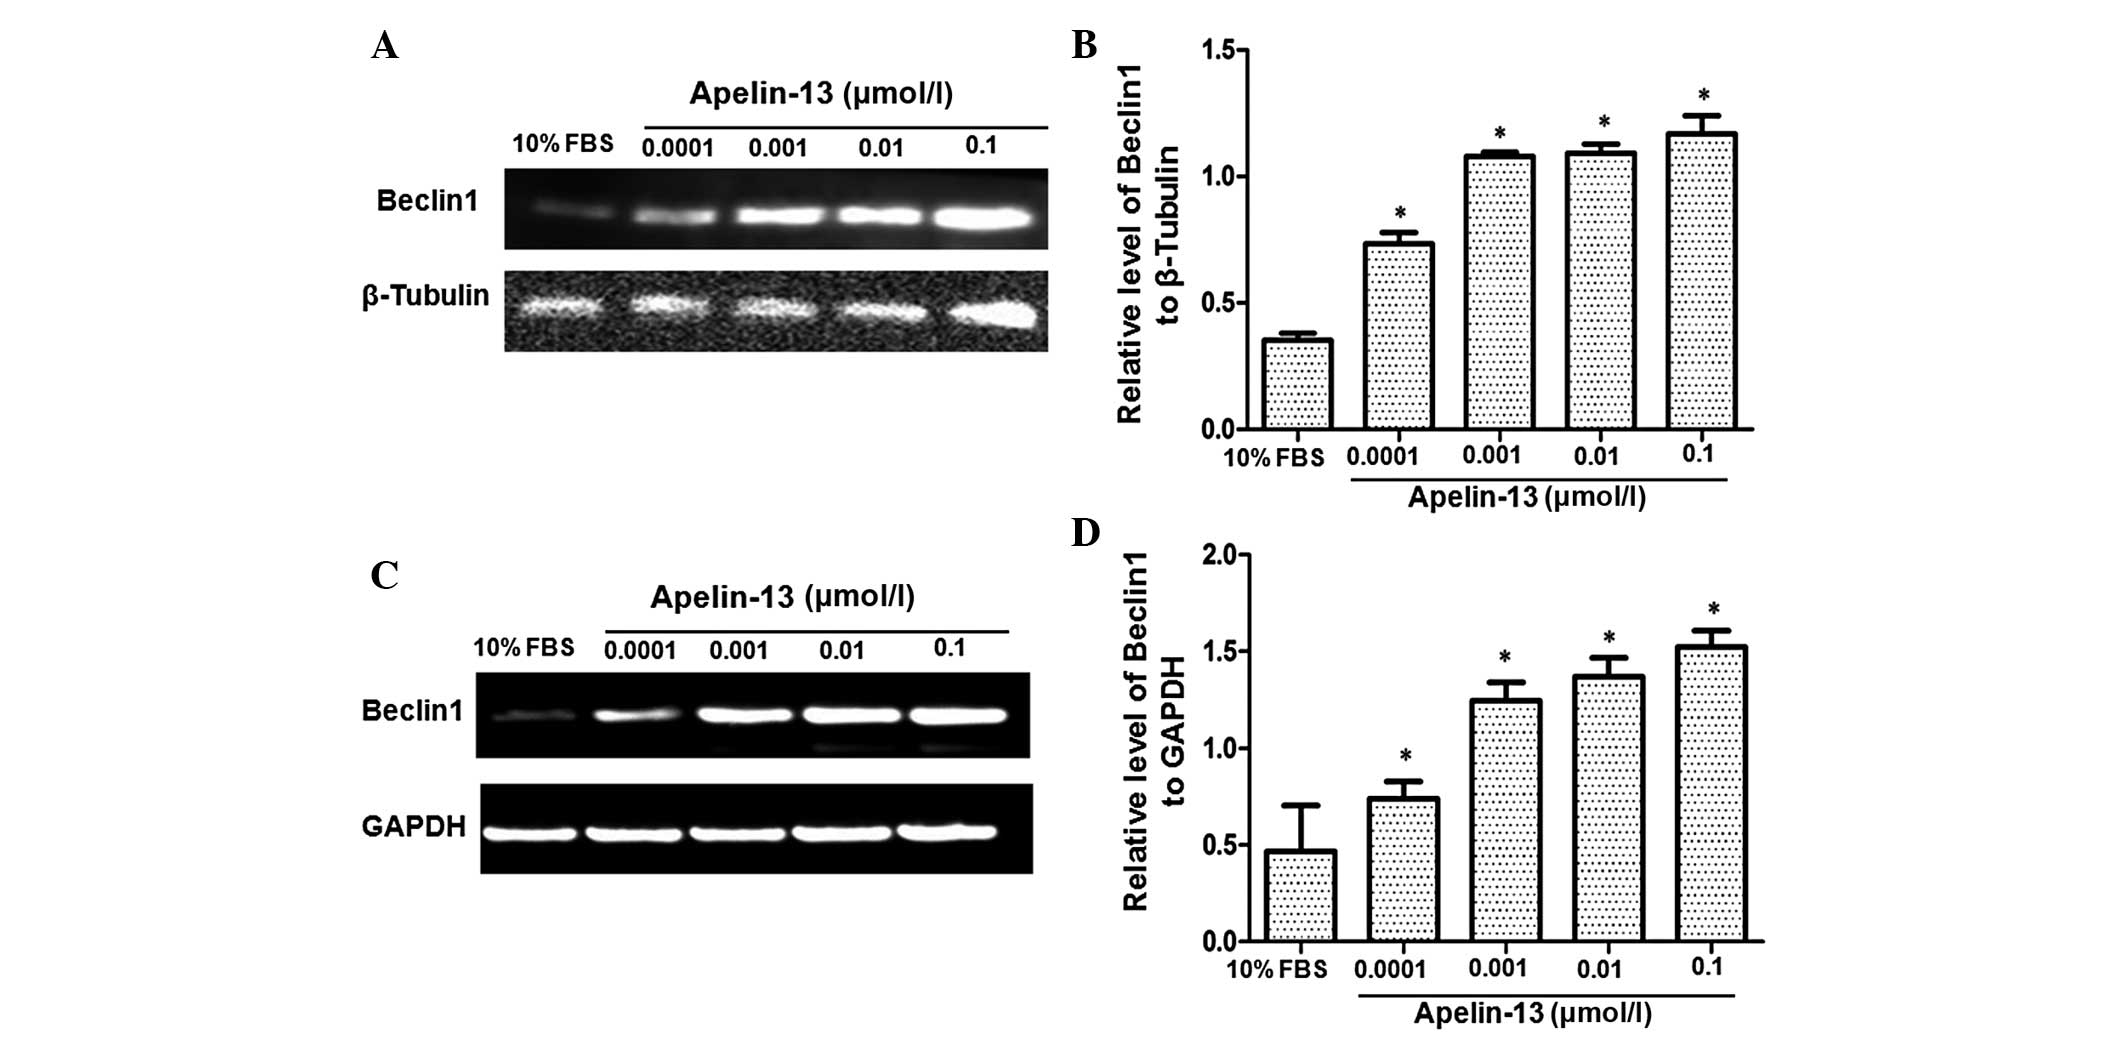
To analyze the effect of Apelin-13 on the expression
of Beclin1 protein, western blot analysis was performed using HepG2
cells treated with 0.0001, 0.001, 0.01 and 0.1 µmol/l Apelin-13.
The negative control was performed using 10% FBS. Fig 2A presents the representative western
blot results and Fig. 2B reports the
quantitative western blot results. In the cells treated with 10%
FBS, Beclin1 protein expression was extremely low. However, the
protein expression of Beclin1 increased significantly subsequent to
Apelin-13 treatment. The increase was dose-dependent. Subsequent to
quantification, the relative expression of the Beclin1 protein in
cells treated with 10% FBS and with 0.0001, 0.001, 0.01 and 0.1
µmol/l Apelin-13 were 0.354±0.010, 0.734±0.017, 1.080±0.068,
1.092±0.014 and 1.168±0.024, respectively. Compared with the cells
treated with 10% FBS, the cells treated with Apelin-13 demonstrated
significantly increased levels of Beclin1 expression
(P<0.05).
In addition, the effect of Apelin-13 on Beclin1 mRNA
expression was also investigated by RT-PCR. GAPDH was used as an
internal control. Similarly, Beclin1 mRNA was barely detectable in
cells treated with 10% FBS, whereas the expression became gradually
upregulated in cells treated with various concentrations of
Apelin-13 (Fig. 2C and D).
Quantitatively, the Beclin1 mRNA level was 0.466±0.095 in cells
treated with 10% FBS, and the Beclin1 mRNA levels were 0.737±0.038,
1.246±0.038, 1.370±0.039 and 1.522±0.034 in cells treated with
0.0001, 0.001, 0.01 and 0.1 µmol/l Apelin-13, respectively.
Statistically, there were significantly higher levels of Beclin1
mRNA in cells treated with Apelin-13 compared with the cells
treated with 10% FBS (P<0.05). Overall, these results suggest
that Apelin-13 stimulated the expression of Beclin1 at the protein
and mRNA level in a dose-dependent manner.
Apelin-13 inhibitor PD98095 suppresses
the phosphorylation of pERK1/2 and expression of Beclin1 induced by
Apelin-13
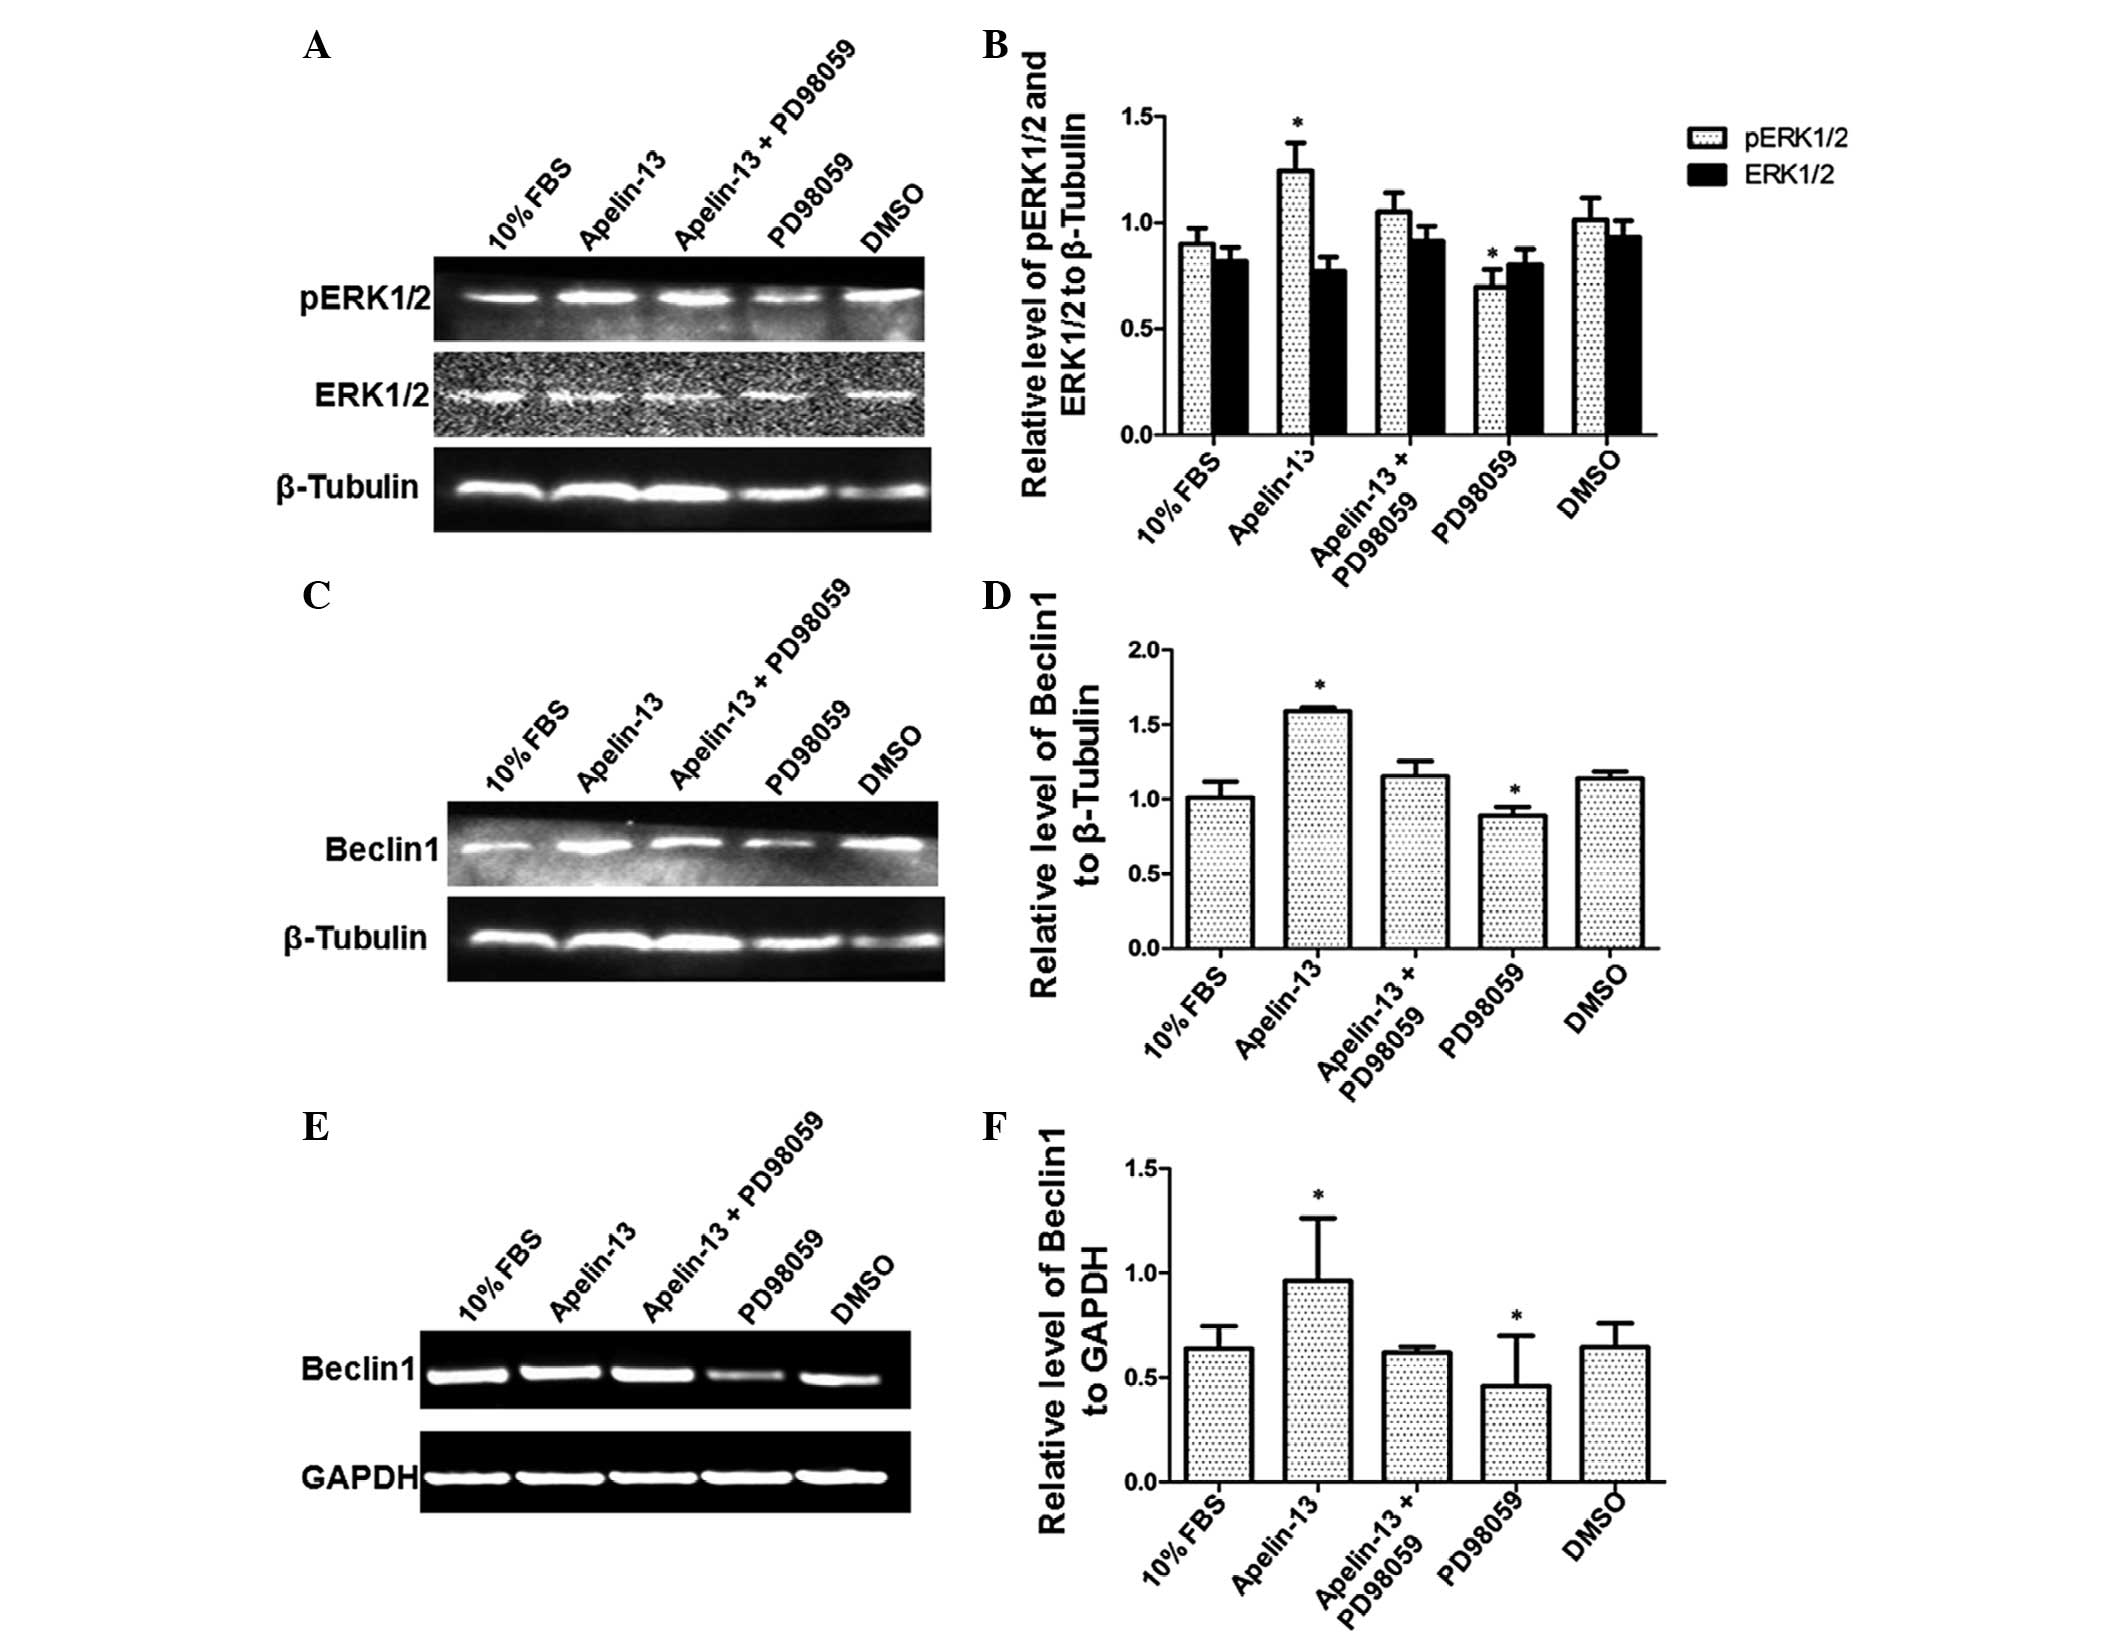
To further verify the effect of Apelin-13 on pERK1/2
and Beclin1, the HepG2 cells were treated with the Apelin-13
inhibitor PD98059. As aforementioned, the most notable effect of
Apelin-13 was observed at the concentration of 0.1 µmol/l.
Therefore, 0.1 µmol/l Apelin-13 was used in the present study. The
concentration of PD98059 used was 10 µmol/l. First, western blot
analysis was performed to assess the effect of Apelin-13 and
PD98059 on pERK1/2 expression (Fig. 3A
and B). Consistently, cells treated with Apelin-13 alone
demonstrated increased levels of pERK1/2. The relative levels of
pERK1/2 in the control cells treated with 10% FBS and DMSO were
1.169±0.010 and 1.087±0.053, respectively. The relative pERK1/2
level was 1.511±0.044 in cells treated with Apelin-13 alone.
However, the relative pERK1/2 level decreased to 1.1435±0.041 in
cells treated with Apelin-13 and PD98059. In cells treated with
PD98059 alone, the pERK1/2 relative level was 0.955±0.023. Compared
with other treatments, the administration of Apelin-13 alone
resulted in the highest level of pERK1/2, whereas the
administration of PD98059 alone resulted in the lowest level of
pERK1/2 (P<0.01). Therefore, this result reveals that the
Apelin-13 inhibitor PD98059 decreased the level of ERK1/2
phosphorylation induced by Apelin-13, further confirming the effect
of Apelin-13 on ERK1/2 phosphorylation.
Subsequently, the level of Beclin1 protein and mRNA
was detected following treatment with Apelin-13 and PD98059.
Consistently, western blot analysis revealed elevated levels of
Beclin1 protein in cells treated with Apelin-13 alone, with a
relative level of 1.590±0.010 (Fig. 3C
and D). By contrast, the upregulation of Beclin1 expression was
blocked in PD98059-treated cells, with a relative level of
0.889±0.024. The relative expression of the Beclin1 protein in
cells treated with 10% FBS, Apelin-13 and PD98059, and DMSO were
1.009±0.045, 1.155±0.039 and 1.141±0.018, respectively.
Statistically, there was a significantly increased level of Beclin1
protein in Apelin-13-treated cells and a significantly decreased
level of Beclin1 protein in PD98059-treated cells (P<0.01). In
addition, Beclin1 expression at the mRNA level revealed a similar
pattern to the expression of the Beclin1 protein, as revealed by
RT-PCR (Fig. 3E and F). The relative
expression levels of Beclin1 mRNA in cells treated with 10% FBS,
Apelin-13, Apelin-13 and PD98059, PD98059 and DMSO were
1.068±0.056, 1.582±0.017, 1.132±0.028, 0.917±0.023 and 1.133±0.008,
respectively. The differences between Apelin-13-treated,
PD98059-treated and control cells were statistically significant
(P<0.01). Thus, these results indicate that the Apelin-13
inhibitor PD98059 inhibited the upregulation of Beclin1 protein and
mRNA induced by Apelin-13, further verifying the effect of
Apelin-13 on Beclin1 expression.
Apelin-13 promotes and PD98059
inhibits the formation of the autophagosome in HepG2 cells
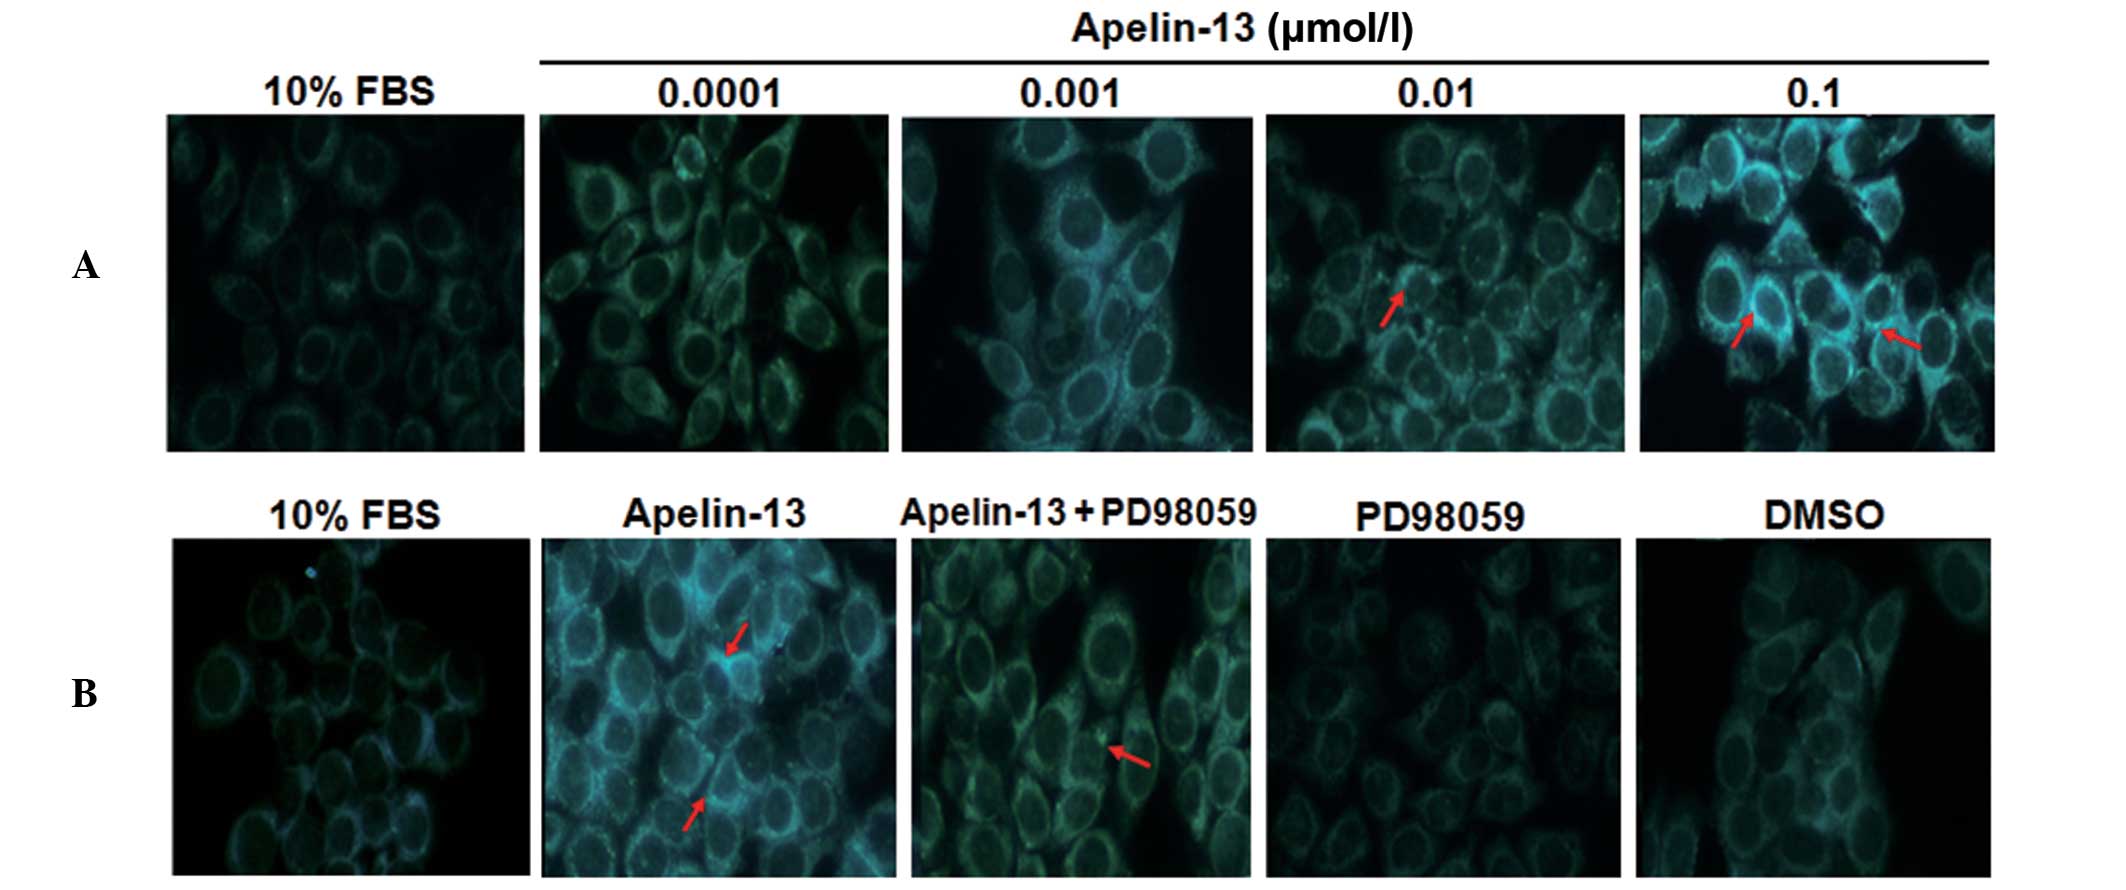
The aforementioned results indicate that Apelin-13
promotes the formation of the autophagosome in HepG2 cells. In the
present study, the autophagy of HepG2 cells following treatment
with Apelin-13 and PD98059 was evaluated by MDC staining.
Representative results of MDC staining are shown in Fig. 4. The autophagosome was stained with
blue and green fluorescence. As shown in Fig. 4A, there was no evident blue or green
luminescence in cells treated with 10% FBS, indicating that no
autophagosome was formed. Following treatment with Apelin-13, blue
and green fluorescence was evident in the HepG2 cells, indicating
that autophagosomes were formed. With the increasing concentration
of Apelin-13, more blue and green luminescence autophagosomes were
detected in HepG2 cells under inverted fluorescence microscopy. By
contrast, in PD98059-treated HepG2 cells, the formation of
autophagosomes decreased significantly compared with
Apelin-13-treated cells (Fig. 4B).
Red arrows indicate representative clusters of fluorescent
autophagosomes in the cytoplasm. These data suggest that Apelin-13
induces autophagy in HepG2 cells and that the Apelin-13 inhibitor
PD98095 efficiently inhibits the formation of autophagosomes in
HepG2 cells treated with Apelin-13.
Discussion
Hepatocellular carcinoma is a disease that leads to
mortality worldwide and is one of the cancers with the highest
level of cancer-associated morbidity. This disease is also the
third most invasive cancer worldwide (10). In China, hepatocellular carcinoma is
the second most invasive cancer (11). Therefore, studies have paid increasing
attention to the development of more efficient treatments for this
carcinoma. Autophagy is a process through which cells use the
lysosome to degrade damaged organelles and macromolecules.
Autophagy is an important conservative cellular pathway and
includes macroautophagy, microautophagy and chaperone-mediated
autophagy (12,13). In the present study, the effect of
Apelin-13 on HepG2 cells was observed. Through MDC staining, it was
found that treatment with Apelin-13 induced autophagy in HepG2
cells in a dose-dependent manner. In addition, the increase in
autophagy was inhibited by the Apelin-13 inhibitor PD98059. This
data indicates that Apelin-13 may inhibit hepatocellular carcinoma
cells through inducing autophagy and that Apelin-13 may be used to
treat hepatocellular carcinoma.
Apelin-13 was also observed to upregulate the
expression levels of pERK1/2 and Beclin1 in a dose-dependent
manner. In 1999, Beclin1 was observed to be the key gene in the
induction of autophagy, and it was the first gene that was
identified to inhibit tumors through lysosome degradation (2). Studies have revealed that Beclin1
expression is decreased in cervical cancer (14), ovarian cancer (15) and cerebral tumors (16). Downregulation of Beclin1 expression
significantly reduces autophagy in cancer cells (17,18).
Therefore, upregulating the expression of Beclin1 may induce
autophagy and therefore promote tumor cell death. The present
results indicate that activation of the ERK1/2 signaling pathway
effectively upregulates the expression of Beclin1 in hepatocellular
carcinoma, indicating that the ERK1/2 signaling pathway is one of
the mechanisms that mediates the expression of Beclin1. Therefore,
the present results indicate that Apenlin-13 may promote autophagy
through upregulating Beclin1 and that Apenlin-13 may upregulate
Beclin1 expression through the ERK1/2 signaling pathway. Subsequent
to treatment with the Apelin-13 inhibitor PD98059, the level of
autophagy and pERK1/2 and Beclin1 expression were decreased. This
further verified the promoting effect of Apelin-13 on autophagy and
Beclin1 expression. However, whether Apelin-13 regulates autophagy
and Beclin1 expression through other pathways requires additional
investigation.
In summary, the present study found that Apelin-13
induced autophagy in hepatoma cells through ERK1/2 signaling
pathway-dependent upregulation of Beclin1. Fundamental low-level
autophagy activity is vital to maintain a steady state in normal
and tumor cells. Excessive autophagy may lead to the death of cells
(19). Additionally, autophagy plays
dual roles in tumor development (20). As a regulatory protein of autophagy,
Beclin1 efficiently inhibits the development of tumors by
inhibiting angiogenesis (21).
Therefore, the present results provide experimental evidence for
the use of Apelin-13 in the treatment of hepatocellular
carcinoma.
Acknowledgements
This study was supported by grants from the National
Natural Science Foundation of China (grant nos. 81102230 and
81270420).
References
|
1
|
Meijer AJ and Codogno P: Regulation and
role of autophagy in mammalian cells. Int J Biochem Cell Biol.
36:2445–2462. 2004. View Article : Google Scholar : PubMed/NCBI
|
|
2
|
Liang XH, Jackson S, Seaman M, Brown K,
Kempkes B, Hibshoosh H and Levine B: Induction of autophagy and
inhibition of tumorigenesis by beclin 1. Nature. 402:672–676. 1999.
View Article : Google Scholar : PubMed/NCBI
|
|
3
|
Shoji-Kawata S, Sumpter R, Leveno M,
Campbell GR, Zou Z, Kinch L, Wilkins AD, Sun Q, Pallauf K, MacDuff
D, et al: Identification of a candidate therapeutic
autophagy-inducing peptide. Nature. 494:201–206. 2013. View Article : Google Scholar : PubMed/NCBI
|
|
4
|
Furuya N, Yu J, Byfield M, Pattingre S and
Levine B: The evolutionarily conserved domain of Beclin 1 is
required for Vps34 binding, autophagy and tumor suppressor
function. Autophagy. 1:46–52. 2005. View Article : Google Scholar : PubMed/NCBI
|
|
5
|
Pattingre S, Bauvy C and Codogno P: Amino
acids interfere with the ERK1/2-dependent control of macroautophagy
by controlling the activation of Raf-1 in human colon cancer HT-29
cells. J Biol Chem. 278:16667–16674. 2003. View Article : Google Scholar : PubMed/NCBI
|
|
6
|
Huang YC, Hung WC, Chen WT, Yu HS and Chai
CY: Sodium arsenite-induced DAPK promoterhypermethylation and
autophagy via ERK1/2 phosphorylation in humanuroepithelial cells.
Chem Biol Interact. 181:254–262. 2009. View Article : Google Scholar : PubMed/NCBI
|
|
7
|
Tatemoto K, Hosoya M, Habata Y, Fujii R,
Kakegawa T, Zou MX, Kawamata Y, Fukusumi S, Hinuma S, Kitada C, et
al: Isolation and characterization of a novel endogenous peptide
ligand for the human APJ receptor. Biochem Biophys Res Commun.
251:471–476. 1998. View Article : Google Scholar : PubMed/NCBI
|
|
8
|
Li F, Li L, Qin X, Pan W, Feng F, Chen F,
Zhu B, Liao D, Tanowitz H, Albanese C, et al: Apelin-induced
vascular smooth muscle cell proliferation: The regulation of cyclin
D1. Front Biosci. 13:3786–3792. 2008. View
Article : Google Scholar : PubMed/NCBI
|
|
9
|
Biederbick A, Kern HF and Elsässer HP:
Monodansylcadaverine (MDC) is a specific in vivo marker for
autophagic vacuoles. Eur J Cell Biol. 66:3–14. 1995.PubMed/NCBI
|
|
10
|
D'Alessandro LA, Meyer R and Klingmüller
U: Hepatocellular carcinoma A systems biology perspective. Front
Physiol. 4:282013. View Article : Google Scholar : PubMed/NCBI
|
|
11
|
He J, Gu D, Wu X, Reynolds K, Duan X, Yao
C, Wang J, Chen CS, Chen J, Wildman RP, et al: Major causes of
death among men and women in China. N Engl J Med. 353:1124–1134.
2005. View Article : Google Scholar : PubMed/NCBI
|
|
12
|
Klionsky DJ: The molecular machinery of
autophagy: U nanswered questions. J Cell Sci. 118:7–18. 2005.
View Article : Google Scholar : PubMed/NCBI
|
|
13
|
Massey AC, Zhang C and Cuervo AM:
Chaperone-mediated autophagy in aging and disease. Curr Top Dev
Biol. 73:205–235. 2006. View Article : Google Scholar : PubMed/NCBI
|
|
14
|
Wang ZH, Xu L, Duan ZL, Zeng LQ, Yan NH
and Peng ZL: Beclin 1 mediated macroautophagy involves regulation
of caspase-9 expression in cervical cancer HeLa cells. Gynecol
Oncol. 107:107–113. 2007. View Article : Google Scholar : PubMed/NCBI
|
|
15
|
Duan ZL, Peng ZL and Wang ZH: Expression
and involved sign alransduction pathway of autophagy gene Beclin 1
in epithelial ovarian cancer. Sichuan Da Xue Xue Bao Yi Xue Ban.
38:239–242. 2007.(In Chinese). PubMed/NCBI
|
|
16
|
Miracco C, Cosci E, Oliveri G, Luzi P,
Pacenti L, Monciatti I, Mannucci S, De Nisi MC, Toscano M,
Malagnino V, et al: Protein and mRNA expression of autophagy gene
Beclin 1 in human brain tumours. Int J Oncol. 30:429–436.
2007.PubMed/NCBI
|
|
17
|
Roesly HB, Khan MR, Chen HD, Hill KA,
Narendran N, Watts GS, Chen X and Dvorak K: The decreased
expression of Beclin-1 correlates with progression to esophageal
adenocarcinoma, The role of deoxycholic acid. Am J Physiol
Gastrointest Liver Physiol. 302:G864–G872. 2012. View Article : Google Scholar : PubMed/NCBI
|
|
18
|
Zhou WH, Tang F, Xu J, Wu X, Yang SB, Feng
ZY, Ding YG, Wan XB, Guan Z, Li HG, et al: Low expression of Beclin
1, associated with high Bcl-XL, predicts a malignant phenotype and
poor prognosis of gastric cancer. Autophagy. 8:389–400. 2012.
View Article : Google Scholar : PubMed/NCBI
|
|
19
|
Yang Z and Klionsky DJ: Eaten alive: A
history of macroautophagy. Nat Cell Biol. 12:814–822. 2010.
View Article : Google Scholar : PubMed/NCBI
|
|
20
|
Apel A, Zentgraf H, Büchler MW and Herr I:
Autophagy - a double-edged sword in oncology. Int J Cancer.
125:991–995. 2009. View Article : Google Scholar : PubMed/NCBI
|
|
21
|
Lee SJ, Kim HP, Jin Y, Choi AM and Ryter
SW: Beclin 1 deficiency is associated with increased
hypoxia-induced angiogenesis. Autophagy. 7:829–839. 2011.
View Article : Google Scholar : PubMed/NCBI
|