Introduction
Pancreatic ductal adenocarcinoma (PDAC) ranks among
the most malignant of human cancers (1). Currently, the annual number of
associated mortalities is similar to the disease's annual incidence
(2). The poor prognosis of PDAC is
correlated with the nonspecificity of symptoms, advanced disease at
presentation and lack of effective adjuvant and systemic therapy
(3). Currently, surgical extirpation
for localized disease offers the only chance of long-term survival
(3). Therefore, understanding the
pathological mechanisms to detect PDAC as early as possible is an
urgent requirement to enable further advances in therapeutic
modalities and agents.
Previous studies have identified that the
development of PDAC may involve certain genetic factors including
the overexpression of oncogenes, inactivation of tumor suppressor
genes or the deregulation of various signaling pathways (4). For instance, kirsten rat sarcoma viral
oncogene homolog mutations have been observed to occur with
increasing frequency in progressively later stages of pancreatic
adenocarcinoma (5). Iacobuzio-Donahue
et al demonstrated that tumor antigen p97, cathepsin L2 and
kallikrein 10 were differentially expressed among PDACs (6). Additionally, the phosphoinositide
3-kinase signaling pathway is known to be activated in pancreatic
cancer, which is due to the aberrant expression of phosphatase and
tensin homolog. Progress achieved in understanding the mechanism of
PDAC is likely to contribute to the treatment of this disease.
However, no breakthrough treatments have been identified, so the
present knowledge would appear to be insufficient.
In the present study, we downloaded microarray data
of GSE43795 and identified the differentially expressed genes
(DEGs) between PDAC and non-neoplastic pancreatic tissue (NN)
samples to explore the molecular mechanisms of PDAC. Park et
al (7) used the dataset GSE43795
to study the characterization of gene expression and activated
signaling pathways in solid pseudopapillary neoplasms of the
pancreas. However, the functional annotation and protein-protein
interaction (PPI) of DEGs are still far from being clear. In the
present study, we performed functional enrichment analyses and
functional annotation. Finally, PPI networks and sub-networks were
constructed and analyzed to study and identify target genes for the
diagnosis and treatment of PDAC. We aimed to explore the underlying
genes and pathways associated with PDAC. The findings from this
study are likely to play a significant role in PDAC genesis and may
potentially serve as biomarkers in the diagnosis and treatment of
PDAC.
Materials and methods
Affymetrix microarray data
The microarray data of GSE43795 were downloaded from
the Gene Expression Omnibus (http://www.ncbi.nlm.nih.gov/geo/) database based on
the platform of GPL10558 Illumina HumanHT-12 V4.0 expression
beadchip. A total of six PDAC and five NN samples were used in this
study to develop the Affymetrix microarray data (Affymetrix, Inc.,
Santa Clara, CA, USA).
Data pre-processing and differential
expression analysis
Background correction, quartile data normalization
and probe summarization were performed for the original array data,
then they were converted into expression measures by the robust
multiarray average (8) algorithm in
the R affy package (9) (http://www.bioconductor.org).
For the GSE43795 dataset, the limma eBayes (10) method in Bioconductor (http://www.bioconductor.org) was used to identify
genes which were differentially expressed between PDAC and NN
samples. The log2-fold change (log2FC) was
calculated. |log2FC| ≥3 and false discovery rate (FDR)
<0.01 were considered as the cutoff values for DEG
screening.
Gene ontology and pathway enrichment
analyses
Gene ontology (GO) (11) is a tool used for collecting a large
number of gene annotation terms. The Kyoto Encyclopedia of Genes
and Genomes (KEGG) knowledge database (12) is a collection of online databases
dealing with genomes, enzymatic pathways and biological chemicals.
The Database for Annotation, Visualization and Integrated Discovery
(DAVID) (13), as a comprehensive set
of functional annotation tools, has been developed for relating the
functional terms with gene lists using a clustering algorithm. In
order to analyze the DEGs at the functional level, we performed GO
and KEGG pathway enrichment analyses using the DAVID online tool to
obtain the enriched biological processes (BPs) and pathways.
P<0.01 was set as the threshold value.
Functional annotation of DEGs
Based on the data information of transcription
factors (TFs), the DEGs were selected and annotated to determine
whether these genes had the function of transcriptional regulation.
The tumor suppressor gene database (TSGene) (14) integrates TSGs with large-scale
experimental evidence to provide a comprehensive resource for the
further investigation of TSGs and their molecular mechanisms in
cancer. The tumor-associated gene (TAG) database (15) is used to save new genes that play a
role in carcinogenesis. In this study, we extracted all known
oncogenes and TSGs from the TAG and TSG databases.
PPI network construction and
sub-network identification
The Search Tool for the Retrieval of Interacting
Genes (STRING) database (16) is a
precomputed global resource which was designed to evaluate PPI
information. In the PPI network, each node stands for a gene and
the edges represent the interactions between nodes. The degree
indicates the number of edges linked to a given node and the nodes
with a high degree are defined as the hub genes that possess
essential biological functions. In this study, the STRING online
tool was applied to analyze the PPI network of DEGs and only those
experimentally validated interactions with a combined score >0.9
were selected as significant.
The BioNet package (http://www.bioconductor.org/packages/release/bioc/html/BioNet.html)
(17) provides a comprehensive set of
methods for the integrated analysis of gene expression data and
biological networks. In the current study, we used BioNet to
identify the sub-network in the PPI network with FDR
<1.0E-06.
Based on the DEGs in the sub-network, we performed
KEGG pathway enrichment analysis with P<0.01.
Results
Identification of DEGs
For the dataset GSE43795, a total of 979 transcripts
were obtained following data pre-processing. Among them, 393 were
downregulated transcripts corresponding to 374 DEGs and 586 were
upregulated transcripts which corresponded to 559 DEGs.
GO and pathway enrichment
analyses
Following GO and pathway analyses for down- and
upregulated DEGs, the top five GO BP terms were collected and are
shown in Table I. The GO terms
enriched by downregulated DEGs were mainly related to digestion,
transport and signaling while the GO terms enriched by upregulated
DEGs were mainly associated with the cell cycle and mitosis.
 | Table I.Gene ontology functional enrichment
analysis for down- and upregulated differentially expressed genes
(top 5). |
Table I.
Gene ontology functional enrichment
analysis for down- and upregulated differentially expressed genes
(top 5).
| Term | Pathway | Count | P-value |
|---|
| Downregulated
DEGs |
|
|
|
| GO:
0007586 | Digestion | 18 | 1.16E-10 |
| GO:
0006811 | Ion transport | 53 | 1.73E-08 |
| GO:
0007267 | Cell-cell
signaling | 53 | 2.21E-08 |
| GO:
0044765 | Single-organism
transport | 104 | 3.34E-08 |
| GO:
0006810 | Transport | 114 | 7.52E-07 |
| Upregulated
DEGs |
|
|
|
| GO:
0000280 | Nuclear
division | 44 | 6.22E-15 |
| GO:
0007067 | Mitosis | 44 | 6.22E-15 |
| GO:
0000278 | Mitotic cell
cycle | 71 | 1.64E-14 |
| GO:
0048285 | Organelle
fission | 44 | 9.46E-14 |
| GO:
0051301 | Cell division | 48 | 9.29E-12 |
The pathways enriched by downregulated DEGs were
mainly related to digestion, absorption and metabolism, and
included protein digestion and absorption and metabolism of
xenobiotics by cytochrome P450. The pathways enriched by
upregulated DEGs were mainly related to the occurrence and spread
of cancer, including the cell cycle and p53 signaling pathways
(Table II).
| Table II.Pathway functional enrichment
analysis for down- and upregulated differentially expressed
genes. |
Table II.
Pathway functional enrichment
analysis for down- and upregulated differentially expressed
genes.
| Term | Pathway | Count | P-value |
|---|
| Downregulated
DEGs |
|
|
|
|
04972 | Pancreatic
secretion | 19 | 4.79E-12 |
|
04974 | Protein digestion
and absorption | 13 | 9.90E-08 |
|
00260 | Glycine, serine and
threonine metabolism | 8 | 9.43E-07 |
|
04964 | Proximal tubule
bicarbonate reclamation | 6 | 1.78E-05 |
|
04950 | Maturity onset
diabetes of the young | 6 | 2.99E-05 |
|
00980 | Metabolism of
xenobiotics by cytochrome P450 | 8 | 4.11E-04 |
|
00982 | Drug
metabolism-cytochrome P450 | 8 | 4.97E-04 |
|
00480 | Glutathione
metabolism | 6 | 1.58 E-03 |
|
04971 | Gastric acid
secretion | 7 | 2.65 E-03 |
|
04973 | Carbohydrate
digestion and absorption | 5 | 4.96 E-03 |
|
04020 | Calcium signaling
pathway | 11 | 5.38 E-03 |
|
04610 | Complement and
coagulation cascades | 6 | 8.03 E-03 |
|
00250 | Alanine, aspartate
and glutamate metabolism | 4 | 8.44 E-03 |
|
00750 | Vitamin B6
metabolism | 2 | 9.09 E-03 |
|
04976 | Bile secretion | 6 | 9.21 E-03 |
| Upregulated
DEGs |
|
|
|
|
04110 | Cell cycle | 15 | 9.27E-06 |
|
04115 | p53 signaling
pathway | 11 | 9.35E-06 |
|
04512 | ECM-receptor
interaction | 10 | 3.77E-04 |
|
05200 | Pathways in
cancer | 20 | 4.11E-03 |
|
05146 | Amoebiasis | 9 | 7.08E-03 |
|
05412 | Arrhythmogenic
right ventricular cardiomyopathy | 7 | 9.61E-03 |
Functional annotation of DEGs
After researching the expression of TFs and TAGs, 15
TFs were downregulated, including prospero homeobox 1 and
PBX/knotted 1 homeobox 2, and 19 TFs were upregulated, including
vitamin D receptor and upstream transcription factor 1. In
addition, among the downregulated DEGs, 22 genes were TAGs. Of
these, 3 were oncogenes, 16 were TSGs and the effect of other 3
genes was uncertain. In the upregulated DEGs, 12 were oncogenes,
including pituitary tumor-transforming 1 (PTTG1), 32 were TSGs and
the effect of other 11 genes was uncertain (Table III).
| Table III.Results of functional annotation of
differentially expressed genes. |
Table III.
Results of functional annotation of
differentially expressed genes.
| TF count | TF name | TAG count | TAG name |
|---|
| Downregulated
DEGs |
|
|
|
| 15 | PROX1, PKNOX2,
PBX1, PAX6, ONECUT1, NR5A2, NR4A2, NKX2.5, NKX2.2, LMO3, KLF15,
INSM1, GATA4, FOSB, ESRRG | 22 | TAG oncogenes:
PBX1, GATA4, FGFR1; |
|
|
|
| TSGs: ZBTB16,
WNK2, SFRP5, SFRP1, SERPINI2, PROX1, PLCE1, PAX6, ONECUT1, NRCAM,
GNMT, DIRAS3, C2orf40, BTG2, BEX2, ARID3B; |
|
|
|
| Others: SLC43A1,
NR4A2, CHRM3 |
| Upregulated
DEGs |
|
|
|
| 19 | VDR, USF1, SPI1,
RUNX2, RUNX1, PITX1, MYCBP, LEF1, HOXC4, HOXB8, HOXB7, HOXA13,
HOXA10, FOXM1, FOXF2, FOXD2, FOXD1, FOXA1, E2F7 | 55 | TAG oncogenes:
WISP1, TNFRSF6B, SPI1, RUNX2, PTTG1, NRAS, LCN2, LAMC2, HOXA10,
HMMR, CEP55, CCNA2; |
|
|
|
| TSGs: TES, SFN,
SERPINB5, SEC14L2, RASAL1, RARRES3, RARRES1, PYCARD, PRODH, MMP11,
MFHAS1, JUP, ISG15, INPP4B, IGFBP3, HTRA1, HPGD, HOPX, GPRC5A,
GLIPR1, GJB2, FANCD2, EGLN3, CHEK1, CEACAM1, CDH11, CASP8, CAPG,
BUB1B, BLM, BIK, ABLIM3; |
|
|
|
| Others: TFAP2A,
TACC3, RUNX1, PTK6, OAS1, ITGB4, FHL2, DHDH, CCNE2, BUB1,
BIRC5; |
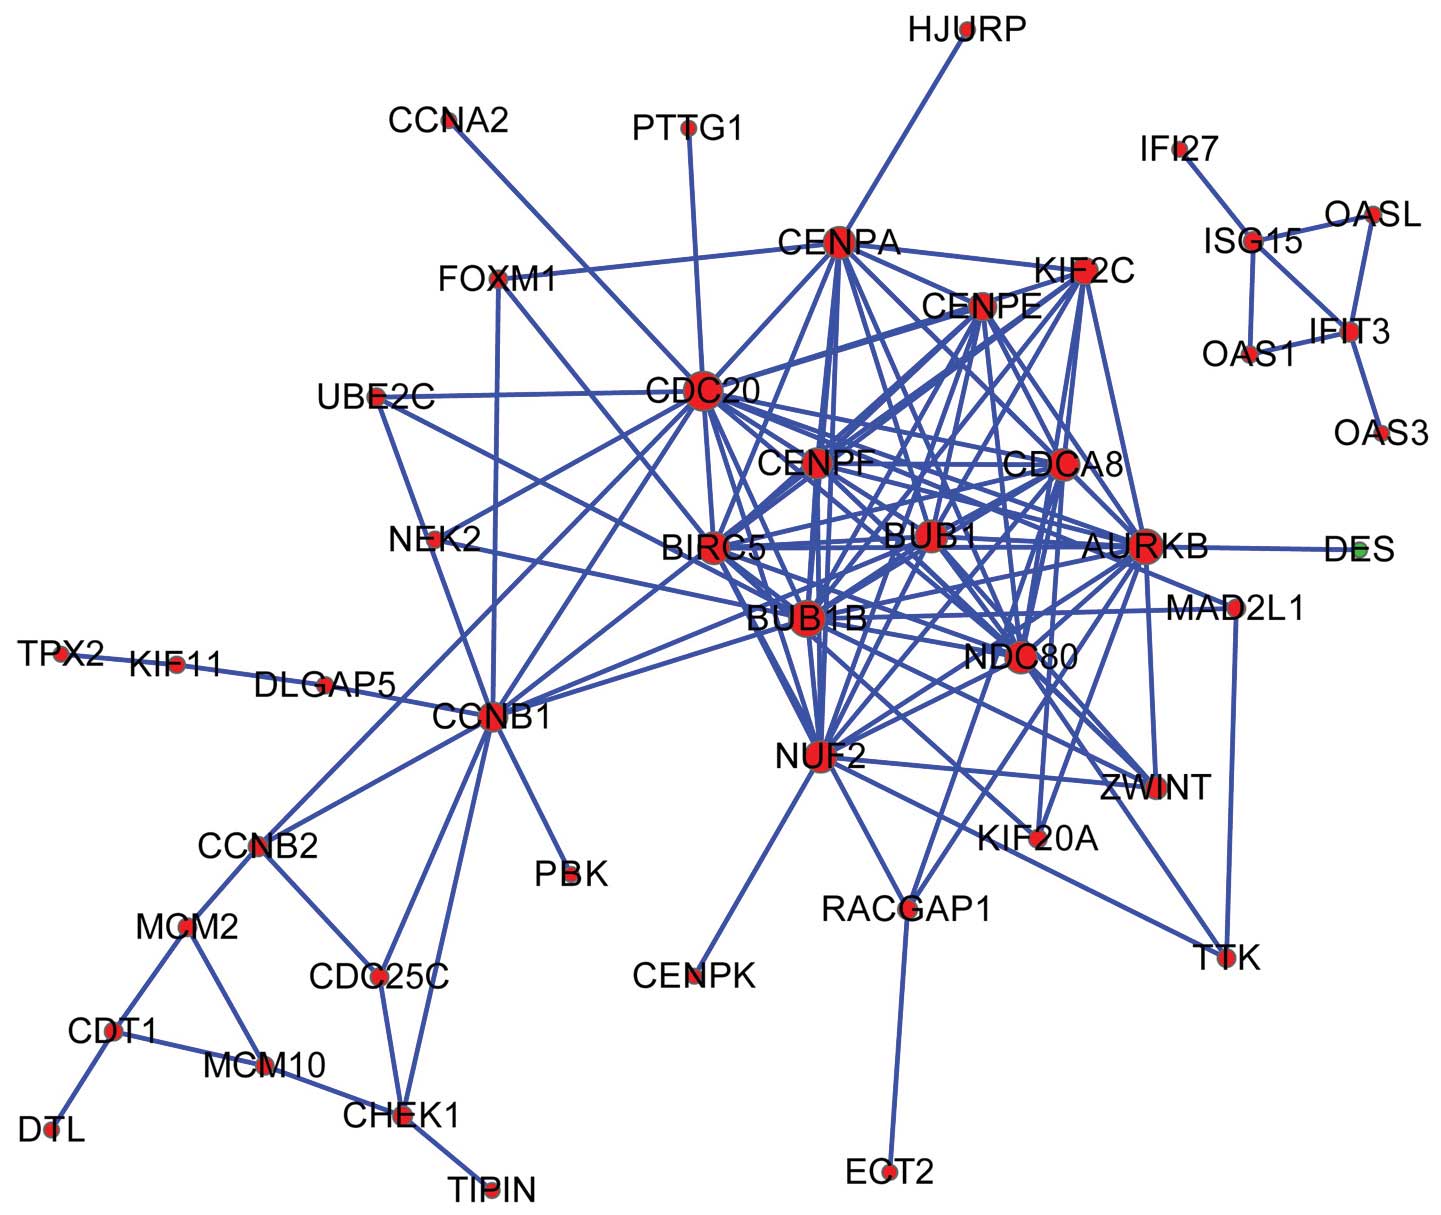
PPI network construction and
sub-network pathway enrichment analysis
Based on data from the STRING database, the PPI
network was constructed (Fig. 1). Ten
nodes were selected as hub genes (degree ≥12), including cell
division cycle 20 (CDC20, degree=18) and BUB1 mitotic checkpoint
serine/threonine kinase B (BUB1B, degree=16).
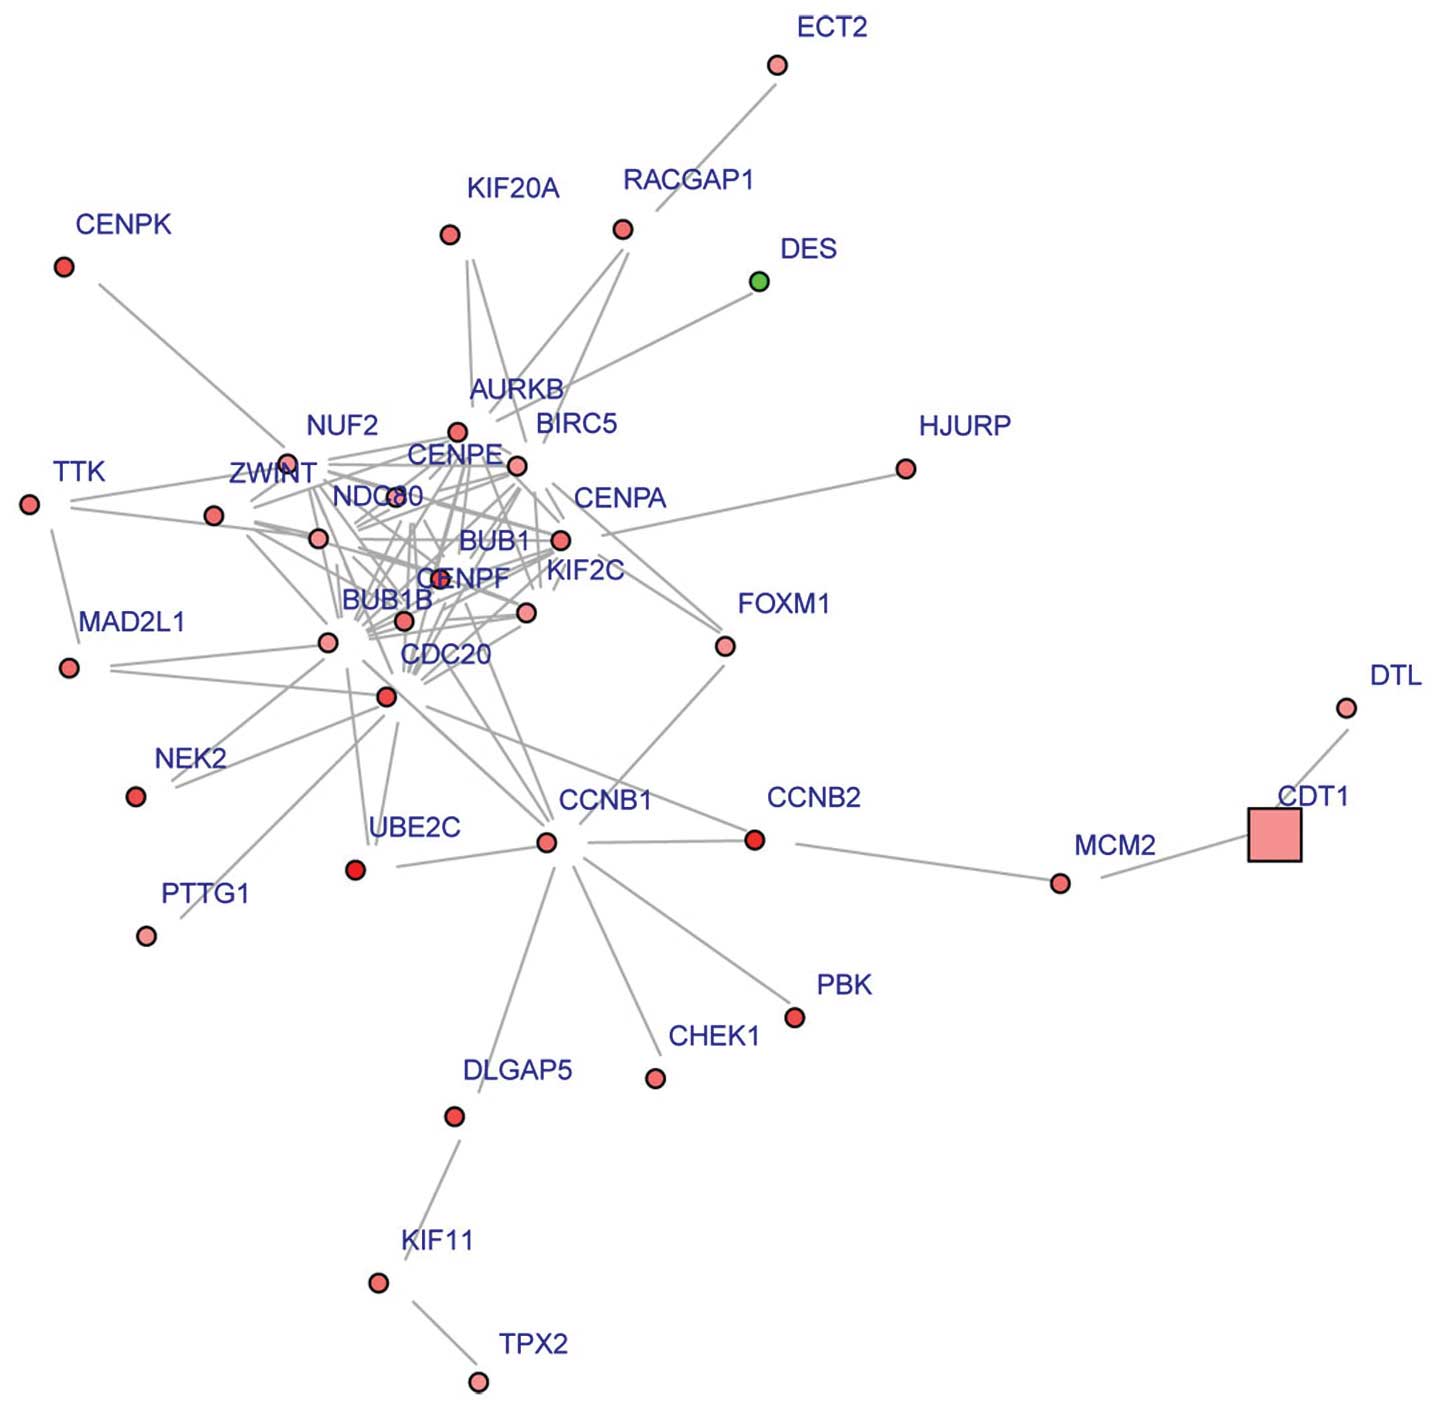
Using the BioNet package, sub-neworks with 34 nodes
were detected. Fig. 2 shows that
CDC20 was a hub gene with degree=16.
Following KEGG pathway enrichment analyses of the
DEGs in the sub-network, we observed that these DEGs including
cyclin B1 (CCNB1) were mainly enriched in the cell cycle,
p53 signaling and oocyte meiosis pathways.
Discussion
The identification of DEGs in PDAC is critical to
the development of novel strategies to detect and treat this highly
malignant cancer. In the present study, a total of 933 DEGs were
identified between PDAC and NN samples through gene expression
profiling of GSE43795. The downregulated DEGs were mainly enriched
in the BP terms associated with digestion, transport and signaling,
and pathways associated with digestion, absorption and metabolism.
The upregulated DEGs were mainly enriched in the BP terms
associated with cell cycle and mitosis, and in the cell cycle and
p53 signaling pathways. The oncogene PTTG1 was upregulated
following functional annotation. In the PPI network, the hub genes
CDC20 and BUB1B had higher connectivity degrees.
Additionally, CCNB1, CDC20 and BUB1B were
enriched in several pathways in the sub-networks. This result
suggested that these genes and pathways may play significant roles
in the progression of PDAC.
Cancer is characterized by uncontrolled cell
proliferation, and tumor cells have typically acquired damage to
genes that directly regulate their cell cycles (18). Research has revealed that the loss of
appropriate cell cycle regulation leads to genomic instability
(19). The cell cycle is believed to
play a role in the etiology of spontaneous cancers (20). In the present study, the cell cycle
pathway was observed to be enriched by several upregulated DEGs,
including CDC20 and BUB1B, which were also hub genes
in the PPI network and sub-network. CDC20 is one of the regulators
of spindle checkpoints, and appears to act as a regulatory protein
interacting with several other proteins at multiple points in the
cell cycle (21). In mammals, CDC20
is involved in anaphase onset and late mitotic events (22) and its expression is essential for cell
division (23). At present, CDC20 is
frequently reported to be upregulated in numerous types of
malignancies including pancreatic cancer (23). Chang et al suggested that CDC20
expression may play a role in facilitating PDAC cell mitosis. For
the other DEG, BUB1B, its encoded protein is also a key
protein in the mitotic spindle checkpoint (24). It has been reported that
overexpression of spindle assembly checkpoint molecules may result
in DNA aneuploidy and carcinogenesis in mice (25). The high expression of BUB1B has
often been reported to be associated with chromosomal instability
in several malignancies, including kidney carcinomas, breast cancer
and bladder cancer (24,26,27). Our
results further confirm that aberrant CDC20 and BUB1B
expression and cell cycle pathways in which the two DEGs
participated may play key roles in PDAC tumorigenesis and
progression and may thus be useful as therapeutic targets.
In this study, the p53 signaling pathway was also
observed to be enriched by upregulated DEGs including CCNB1.
The p53 protein inhibits malignant transformation through direct
and indirect regulation of transcription of the genes associated
with the cell cycle and apoptosis (21). Presently, TP53 is the most
frequently mutated gene in human cancer and its mutation frequency
is up to 96% in pancreatic adenocarcinoma (28,29). CCNB1
is a regulatory protein involved in mitosis, and plays an essential
role in cell proliferation (30). In
normal tissues, the expression level of CCNB1 is low; however, it
was noted to be overexpressed in tumors with TP53 mutation,
including colorectal, cervical and pancreatic cancer (31–33). In
addition, TP53 has been demonstrated to regulate the
promoter of CCNB1 in opposing ways (34). Briefly, the p53 signaling pathway and
its enriched DEGs including CCNB1 were closely associated
with PDAC; thus, this pathway and these genes may be used as
potential targets for PDAC treatment.
The results of functional annotation of DEGs
revealed that the PTTG1 oncogene was upregulated; in
addition, it was noted to participate in the PPI network and
sub-network. Our findings also revealed that PTTG1 was
enriched in the BP terms associated with mitosis. PTTG1 is a
regulatory protein, and plays a central role in chromosome
stability, cell transformation and gene regulation (35,36). In
particular, PTTG1 is a critical mitotic checkpoint protein that
helps hold sister chromatids together before entering anaphase
(37). Research has identified that
PTTG1 expression is highly activated in rapidly proliferating cells
(38). To date, the overexpression of
PTTG1 has been identified in numerous cancers tissues as well as in
cell lines, including colon, ovarian, breast and various other
solid tumors (39–41). In our study, the overexpression of
PTTG1 is consistent with the observations above. Taken
together, these data support the hypothesis that PTTG1 may
be a candidate molecular marker associated with PDAC progression
and prognosis.
Although bioinformatics technologies have the
potential to identify and validate candidate agents for critical
diseases, certain limitations remain in this study. Firstly, the
sample size for microarray analysis was small, which may have
caused a high rate of false positive results. Secondly, this study
lacked experimental verification. Further genetic and experimental
studies with a larger sample size are still required in the future
to confirm the results.
However, our data provide a comprehensive
bioinformatics analysis of the DEGs and pathways which may be
involved in PDAC. The findings of the present study may contribute
to our understanding of the underlying molecular mechanisms of
PDAC. DEGs including CDC20, BUB1B, CCNB1 and
PTTG1 as well as the cell cycle pathway and p53 signaling pathway
have the potential to be used as targets for PDAC diagnosis and
treatment.
Acknowledgements
The authors wish to express thanks to Fenghe
(Shanghai) Information Technology Co., Ltd. Their ideas and
assistance provided a valuable added dimension to this
research.
References
|
1
|
Aguirre AJ, Bardeesy N, Sinha M, Lopez L,
Tuveson DA, Horner J, Redston MS and DePinho RA: Activated Kras and
Ink4a/Arf deficiency cooperate to produce metastatic pancreatic
ductal adenocarcinoma. Genes Dev. 17:3112–3126. 2003. View Article : Google Scholar : PubMed/NCBI
|
|
2
|
Garcia M, Jemal A, Ward EM, Center MM, Hao
Y, Siegel RL and Thun MJ: Global Cancer Facts & Figures 2007.
Atlanta, GA: American Cancer Society. 2007.
|
|
3
|
Conlon KC, Klimstra DS and Brennan MF:
Long-term survival after curative resection for pancreatic ductal
adenocarcinoma. Histopathology. Ann Surg. 223:273–279. 1996.
View Article : Google Scholar : PubMed/NCBI
|
|
4
|
Sarkar FH, Banerjee S and Li Y: Pancreatic
cancer, pathogenesis, prevention and treatment. Toxicol Appl
Pharmacol. 224:326–336. 2007. View Article : Google Scholar : PubMed/NCBI
|
|
5
|
Berthelemy P, Bouisson M, Escourrou J,
Vaysse N, Rumeau JL and Pradayrol L: Identification of K-ras
mutations in pancreatic juice in the early diagnosis of pancreatic
cancer. Ann Intern Med. 123:188–191. 1995. View Article : Google Scholar : PubMed/NCBI
|
|
6
|
Iacobuzio-Donahue CA, Ashfaq R, Maitra A,
Adsay NV, Shen-Ong GL, Berg K, Hollingsworth MA, Cameron JL, Yeo
CJ, Kern SE, et al: Highly expressed genes in pancreatic ductal
adenocarcinomas: a comprehensive characterization and comparison of
the transcription profiles obtained from three major technologies.
Cancer Res. 63:8614–8622. 2003.PubMed/NCBI
|
|
7
|
Park M, Kim M, Hwang D, Park M, Kim WK,
Kim SK, Shin J, Park ES, Kang CM, Paik YK and Kim H:
Characterization of gene expression and activated signaling
pathways in solid-pseudopapillary neoplasm of pancreas. Mod Pathol.
27:580–593. 2014. View Article : Google Scholar : PubMed/NCBI
|
|
8
|
Irizarry RA, Hobbs B, Collin F,
Beazer-Barclay YD, Antonellis KJ, Scherf U and Speed TP:
Exploration, normalization and summaries of high density
oligonucleotide array probe level data. Biostatistics. 4:249–264.
2003. View Article : Google Scholar : PubMed/NCBI
|
|
9
|
Gautier L, Cope L, Bolstad BM and Irizarry
RA: Affy-analysis of Affymetrix GeneChip data at the probe level.
Bioinformatics. 20:307–315. 2004. View Article : Google Scholar : PubMed/NCBI
|
|
10
|
Smyth GK: Limma: linear models for
microarray data. Bioinformatics and Computational Biology Solutions
using R and Bioconductor. Gentleman R, Carey V, Dudoit S, Irizarry
R and Huber W: (New York, Springer). Springer. 397–420. 2005.
View Article : Google Scholar
|
|
11
|
The Gene Ontology Consortium. Ashburner M,
Ball CA, Blake JA, Botstein D, Butler H, Cherry JM, Davis AP,
Dolinski K, Dwight SS, Eppig JT, et al: Gene Ontology: tool for the
unification of biology. Nat Genet. 25:25–29. 2000. View Article : Google Scholar : PubMed/NCBI
|
|
12
|
Kanehisa M and Goto S: KEGG: Kyoto
encyclopedia of genes and genomes. Nucleic Acids Res. 28:27–30.
2000. View Article : Google Scholar : PubMed/NCBI
|
|
13
|
Huang DW, Sherman BT, Tan Q, Collins JR,
Alvord WG, Roayaei J, Stephens R, Baseler MW, Lane HC and Lempicki
RA: The DAVID Gene Functional Classification Tool, a novel
biological module-centric algorithm to functionally analyze large
gene lists. Genome Biol. 8:R1832007. View Article : Google Scholar : PubMed/NCBI
|
|
14
|
Zhao M, Sun J and Zhao Z: TSGene: a web
resource for tumor suppressor genes. Nucleic Acids Res. 41(Database
issue): D970–D976. 2013. View Article : Google Scholar : PubMed/NCBI
|
|
15
|
Chen JS, Hung WS, Chan HH, Tsai SJ and Sun
HS: In silico identification of oncogenic potential of fyn-related
kinase in hepatocellular carcinoma. Bioinformatics. 29:420–427.
2013. View Article : Google Scholar : PubMed/NCBI
|
|
16
|
Franceschini A, Szklarczyk D, Frankild S,
Kuhn M, Simonovic M, Roth A, Lin J, Minguez P, Bork P, von Mering C
and Jensen LJ: STRING v9.1: protein-protein interaction networks,
with increased coverage and integration. Nucleic Acids Res.
41(Database issue): D808–D815. 2013. View Article : Google Scholar : PubMed/NCBI
|
|
17
|
Beisser D, Klau GW, Dandekar T, Müller T
and Dittrich MT: BioNet an R-Package for the functional analysis of
biological networks. Bioinformatics. 26:1129–1130. 2010. View Article : Google Scholar : PubMed/NCBI
|
|
18
|
Sherr CJ: Cancer cell cycles. Science.
274:1672–1677. 1996. View Article : Google Scholar : PubMed/NCBI
|
|
19
|
Hartwell LH and Kastan MB: Cell cycle
control and cancer. Science. 266:1821–1828. 1994. View Article : Google Scholar : PubMed/NCBI
|
|
20
|
Hunter T and Pines J: Cyclins and cancer
II: cyclin D and CDK inhibitors come of age. Cell. 79:573–582.
1994. View Article : Google Scholar : PubMed/NCBI
|
|
21
|
Kidokoro T, Tanikawa C, Furukawa Y, et al:
CDC20, a potential cancer therapeutic target, is negatively
regulated by p53. Oncogene. 27:1562–1571. 2008. View Article : Google Scholar : PubMed/NCBI
|
|
22
|
Fung TK and Poon RY: A roller coaster ride
with the mitotic cyclins. Semin Cell Dev Biol. 16:335–342. 2005.
View Article : Google Scholar : PubMed/NCBI
|
|
23
|
Chang DZ, Ma Y, Ji B, Liu Y, Hwu P,
Abbruzzese JL, Logsdon C and Wang H: Increased CDC20 expression is
associated with pancreatic ductal adenocarcinoma differentiation
and progression. J Hematol Oncol. 5:152012. View Article : Google Scholar : PubMed/NCBI
|
|
24
|
Yamamoto Y, Matsuyama H, Chochi Y, Okuda
M, Kawauchi S, Inoue R, Furuya T, Oga A, Naito K and Sasaki K:
Overexpression of BUBR1 is associated with chromosomal instability
in bladder cancer. Cancer Genet Cytogenet. 174:42–47. 2007.
View Article : Google Scholar : PubMed/NCBI
|
|
25
|
van Deursen: JM:R b loss causes cancer by
driving mitosis mad. Cancer cell. 11:1–3. 2007. View Article : Google Scholar : PubMed/NCBI
|
|
26
|
Pinto M, Vieira J, Ribeiro FR, Soares MJ,
Henrique R, Oliveira J, Jerónimo C and Teixeira MR: Overexpression
of the mitotic checkpoint genes BUB1 and BUBR1 is associated with
genomic complexity in clear cell kidney carcinomas. Cell Oncol.
30:389–395. 2008.PubMed/NCBI
|
|
27
|
Scintu M, Vitale R, Prencipe M, Gallo AP,
Bonghi L, Valori VM, Maiello E, Rinaldi M, Signori E, Rabitti C, et
al: Genomic instability and increased expression of BUB1B and
MAD2L1 genes in ductal breast carcinoma. Cancer Lett. 254:298–307.
2007. View Article : Google Scholar : PubMed/NCBI
|
|
28
|
Petitjean A, Mathe E, Kato S, Ishioka C,
Tavtigian SV, Hainaut P and Olivier M: Impact of mutant p53
functional properties on TP53 mutation patterns and tumor
phenotype, lessons from recent developments in the IARC TP53
database. Hum Mutat. 28:622–629. 2007. View Article : Google Scholar : PubMed/NCBI
|
|
29
|
Hingorani SR, Wang L, Multani AS, Combs C,
Deramaudt TB, Hruban RH, Rustgi AK, Chang S and Tuveson DA:
Trp53R172H and KrasG12D cooperate to promote chromosomal
instability and widely metastatic pancreatic ductal adenocarcinoma
in mice. Cancer Cell. 7:469–483. 2005. View Article : Google Scholar : PubMed/NCBI
|
|
30
|
Suzuki T, Urano T, Miki Y, Moriya T,
Akahira J, Ishida T, Horie K, Inoue S and Sasano H: Nuclear cyclin
B1 in human breast carcinoma as a potent prognostic factor. Cancer
Sci. 98:644–651. 2007. View Article : Google Scholar : PubMed/NCBI
|
|
31
|
Wang A, Yoshimi N, Ino N, Tanaka T and
Mori H: Overexpression of cyclin B1 in human colorectal cancers. J
Cancer Res Clin Oncol. 123:124–127. 1997. View Article : Google Scholar : PubMed/NCBI
|
|
32
|
El-Ghobashy AA, Shaaban AM, Herod J, et
al: Overexpression of cyclins A and B as markers of neoplastic
glandular lesions of the cervix. Gynecol Oncol. 92:628–634. 2004.
View Article : Google Scholar : PubMed/NCBI
|
|
33
|
Weissmueller S, Manchado E, Saborowski M,
et al: Mutant p53 drives pancreatic cancer metastasis through
cell-autonomous PDGF receptor β signaling. Cell. 157:382–394. 2014.
View Article : Google Scholar : PubMed/NCBI
|
|
34
|
Yin XY, Grove L, Datta NS, Katula K, Long
MW and Prochownik EV: Inverse regulation of cyclin B1 by c-Myc and
p53 and induction of tetraploidy by cyclin B1 overexpression.
Cancer Res. 61:6487–6493. 2001.PubMed/NCBI
|
|
35
|
Zhang X, Horwitz GA, Prezant TR, et al:
Structure, expression and function of human pituitary
tumor-transforming gene (PTTG). Mol Endocrinol. 13:156–166. 1999.
View Article : Google Scholar : PubMed/NCBI
|
|
36
|
Pei L and Melmed S: Isolation and
characterization of a pituitary tumor-transforming gene (PTTG). Mol
Endocrinol. 11:433–441. 1997. View Article : Google Scholar : PubMed/NCBI
|
|
37
|
Ying H, Furuya F, Zhao L, Araki O, West
BL, Hanover JA, Willingham MC and Cheng SY: Aberrant accumulation
of PTTG1 induced by a mutated thyroid hormone β receptor inhibits
mitotic progression. J Clin Invest. 116:2972–2984. 2006. View Article : Google Scholar : PubMed/NCBI
|
|
38
|
Genkai N, Homma J, Sano M, Tanaka R and
Yamanaka R: Increased expression of pituitary tumor-transforming
gene (PTTG)-1 is correlated with poor prognosis in glioma patients.
Oncol Rep. 15:1569–1574. 2006.PubMed/NCBI
|
|
39
|
Heaney AP, Singson R, McCabe CJ, Nelson V,
Nakashima M and Melmed S: Expression of pituitary-tumour
transforming gene in colorectal tumours. Lancet. 355:716–719. 2000.
View Article : Google Scholar : PubMed/NCBI
|
|
40
|
Solbach C, Roller M, Fellbaum C, Nicoletti
M and Kaufmann M: PTTG mRNA expression in primary breast cancer, a
prognostic marker for lymph node invasion and tumor recurrence.
Breast. 13:80–81. 2004. View Article : Google Scholar : PubMed/NCBI
|
|
41
|
Puri R, Tousson A, Chen L and Kakar SS:
Molecular cloning of pituitary tumor transforming gene 1 from
ovarian tumors and its expression in tumors. Cancer Lett.
163:131–139. 2001. View Article : Google Scholar : PubMed/NCBI
|