Introduction
Renal angiomyolipoma (AML) is the most common type
of benign solid renal tumor and may be diagnosed by computed
tomography (CT) imaging, relying on the detection of macroscopic
fat with negative attenuation measurements (1). However, CT examination is unable to
detect intratumoral fat content in ~4.5% of AMLs, including minimal
fat and lipid-poor AMLs (1). On
unenhanced CT images, the appearance of lipid-poor AML has been
described as homogeneous and hyperattenuating compared with its
surrounding renal parenchyma (1).
However, such hyperattenuation is nonspecific: Other renal masses,
such as metastases, venous infarctions, leiomyomas and 22% of clear
cell renal cell carcinomas (CCRCCs) also exhibit this feature on CT
images (2,3). Patients with lipid-poor AML typically
receive unnecessary surgery for suspected renal cell carcinoma
(RCC) when a diagnosis is not specifically established
prospectively. Various strategies have been proposed to
differentiate lipid-poor AML from RCC on the basis of imaging
characteristics. These approaches have included attenuation
measurement histogram analysis (4–7), analysis
of contrast enhancement patterns (3),
and chemical-shift magnetic resonance imaging (8).
A previous study reported that biphasic helical CT
imaging may be useful in differentiating lipid-poor AML from RCC,
with homogeneous tumor enhancement and prolonged enhancement
patterns being the most valuable CT findings (3). Several studies have attempted to assess
the washout characteristics of adrenal and pulmonary lesions on
contrast-enhanced CT, and this is suggested to be helpful in
differentiating malignant from benign tumors (9–13). Washout
refers to the reduction of the attenuation values of lesions on CT
during a variable period subsequent to the intravenous injection of
a bolus of contrast material (12).
To the best of our knowledge, no evaluation of the washout
characteristics of lipid-poor AML and CCRCC on dynamic
contrast-enhanced CT has been reported. The purpose of the present
study was to compare the wash-in and washout characteristics of
lipid-poor AML and CCRCC, and to assess the potential clinical
value of wash-in and washout values on dynamic CT scanning for the
differentiation of lipid-poor AML from CCRCC.
Materials and methods
Patients
Between September 2009 and September 2011, a total
of 96 patients with renal masses underwent dynamic enhanced CT
examination at Shanghai PLA No. 85 Hospital (Shanghai, China) and
Ningbo Beilun People's Hospital (Ningbo, China). From this, 82
patients (42 men and 40 women; age range, 24–84 years; mean age,
53.0±13.6 years; median age, 55 years) with a total of 83 lesions
had been pathologically confirmed to have either lipid-poor AML (34
AMLs in 33 patients, with no identifiable macroscopic fat on CT
images) or CCRCC (49 tumors in 49 patients). Patients were excluded
according to the following criteria: (i) Absence of surgical
pathological results; (ii) presence of identifiable macroscopic fat
on CT images.
CT examinations
Four-phase CT examinations were performed on a
64-slice multidetector CT scanner (LightSpeed VCT; GE Medical
Systems, Milwaukee, WI, USA) or a dual-source CT scanner (Somatom
Definition; Siemens AG, Medical Solutions, Forchheim, Germany). A
90-ml volume of nonionic contrast agent [iopamidol (Iopamiro® 370);
Bracco Imaging S.p.A., Milan, Italy] was administered by a power
injector at a rate of 3 ml/sec. The scanning protocol included data
acquisition in four phases: The unenhanced phase, the
corticomedullary phase (30-sec delay following contrast injection),
the nephrographic phase (90-sec delay following contrast injection)
and the delay phase (5-min delay following contrast injection. The
scanning parameters were as follows: Pitch, 0.625; X-ray tube
voltage, 120 kV; and tube current, 200–400 mA. The slice thickness
of axial and coronal images was 5 mm. Coronal multiplanar
reconstruction imaging was routinely performed for the
corticomedullary and nephrographic phases.
Image analysis
Renal mass enhancement on dynamic CT images was
measured on circular, operator-defined regions of interest (ROIs)
on the selected image for each cluster at each time point (i.e.,
from the unenhanced image to the image acquired at 5-min). Each
ROI, covering 50–80% of the tumor surface area, was examined. Large
ROIs were selected in order to incorporate solid-appearing parts of
a tumor, and to exclude obvious cystic or necrotic areas.
From the mean Hounsfield unit (HU) value in each ROI
of the renal mass on the dynamic and delayed CT scans, the peak
enhancement attenuation value, net enhancement attenuation value
(wash-in), enhancement ratio, and absolute and relative loss of
enhancement (washout value and washout ratio) were calculated. The
wash-in value was calculated by subtracting the pre-enhancement
attenuation value from peak enhancement attenuation value. Washout
value was calculated by subtracting the attenuation value at 5-min
from peak enhancement attenuation value. Washout ratio was
calculated as follows: 1 - (attenuation value at 5-min/peak
enhancement attenuation value) × 100%.
Threshold values were retrospectively used to define
different types of time-attenuation curves: Type A with wash-in
<70 HU and any washout; type B with persistent enhancement (no
washout); type C with wash-in ≥70 HU and washout >50 HU; and
type D with wash-in ≥70 HU and washout ≤50 HU.
Statistical analysis
Statistical analysis was performed using SPSS
software (version 10.0; SPSS, Inc., Chicago, IL, USA). Statistical
analyses of the differences between each enhancement characteristic
in lipid-poor AMLs and CCRCCs were performed with the Mann-Whitney
U test. Receiver operating characteristic (ROC) analysis was
performed to evaluate the usefulness of the unenhanced CT
attenuation, net enhancement and washout values as markers for
differentiating CCRCCs from AMLs. The area under the ROC curve
(AUC) was calculated, and ranged from 0.5 to 1.0, increasing when
diagnostic performance approached that of the reference standard
(in this study, determination of CCRCCs). The χ2 test or
Fisher's exact test were used to analyze statistically significant
time-attenuation curve differences between lipid-poor AML and
CCRCC. Two-sided tests were used and P<0.05 was considered to
indicate a statistically significant difference.
Results
Of the 83 renal masses, 49 (59.0%) proved to be
CCRCCs and 34 (41.0%) proved to be lipid-poor AMLs. The mean
diameter of the renal masses was 4.6±2.2 cm (range, 1.5–10.0 cm;
median, 4.5 cm). The mean attenuation value of lipid-poor AMLs
(mean 37.8±14.8 HU; range 6.7–58.0 HU) on unenhanced CT scans was
significantly higher than that of CCRCCs (mean 30.9±7.4; range
15.8–48.9 HU) (Mann-Whitney U test, P=0.003). The ROC analysis
result revealed an AUC of 0.674 using the attenuation value on
unenhanced CT scans for differentiating CCRCCs from lipid-poor
AMLs. The threshold of ≤37 HU determined for the attenuation value
on unenhanced CT scans was associated with a sensitivity of 78.7%
and specificity of 62.5%.
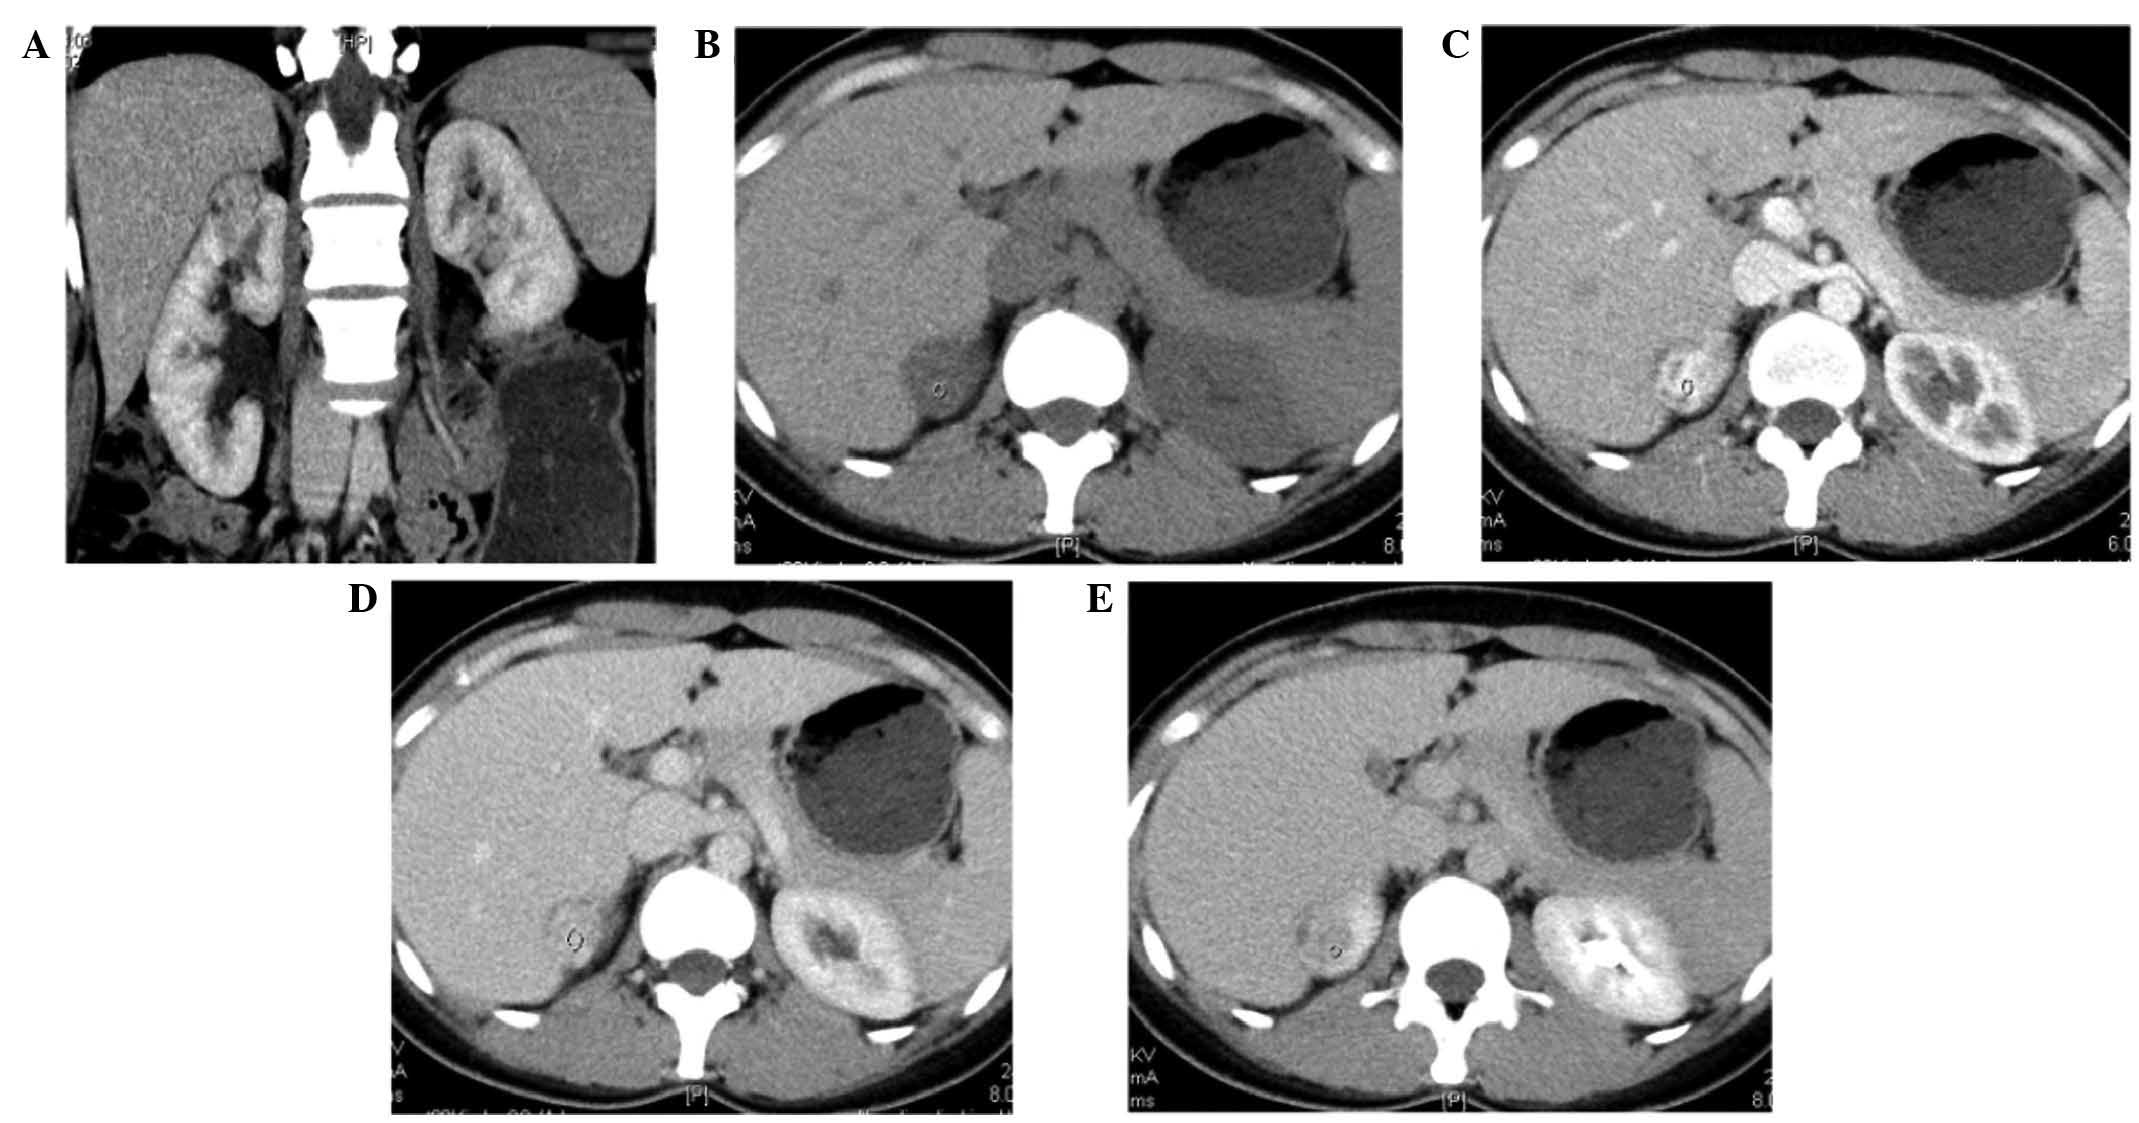
Early enhancement CT and wash-in of
contrast material
The characteristics of the enhancement dynamics of
renal masses on early phase contrast-enhanced CT are summarized in
Table I. The net enhancement
attenuation (wash-in) of the 34 lipid-poor ALMs on early
contrast-enhanced CT scans was 70.9±43.4 HU, and enhancement ratio
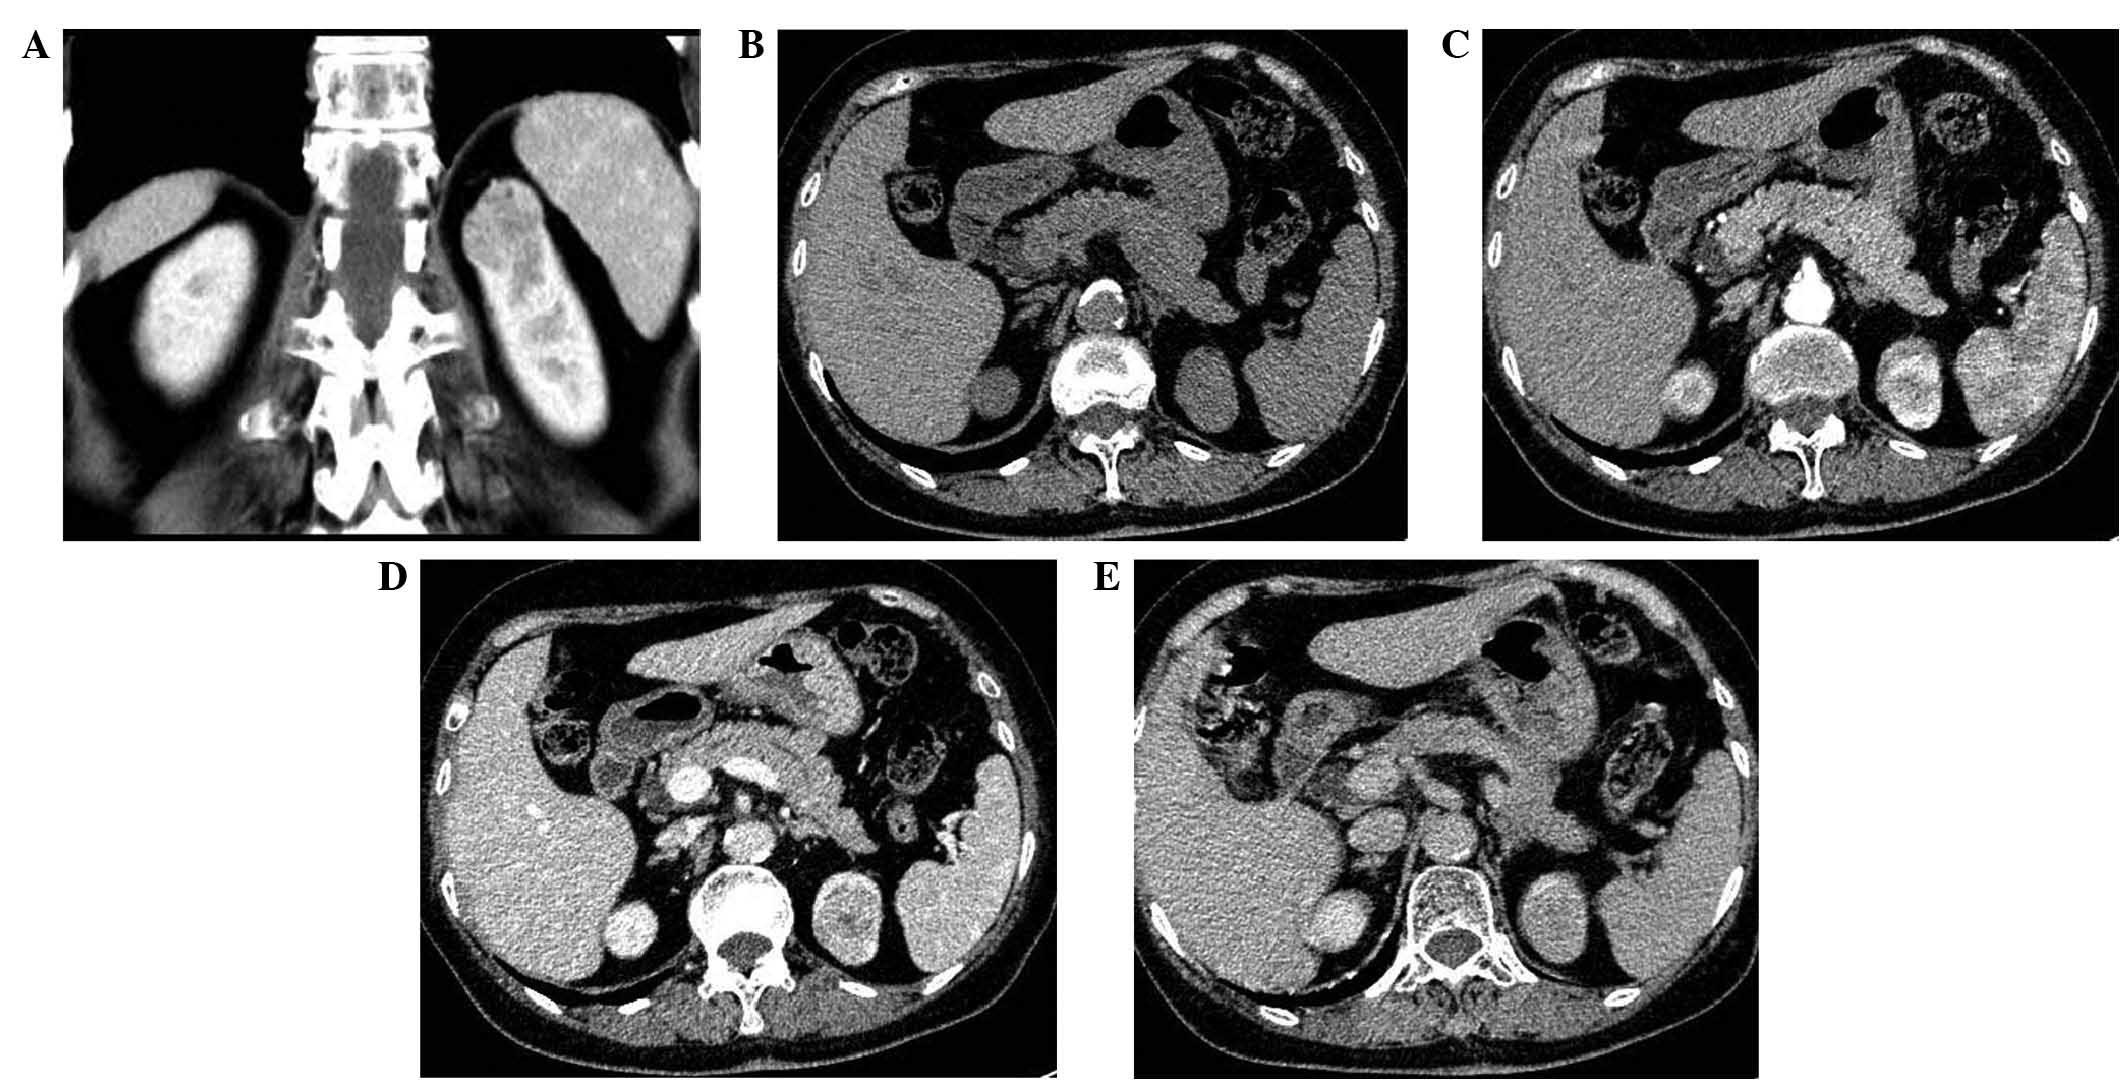
was 62.8±19.2% (Fig. 1). The net
enhancement attenuation (wash-in) of the 49 CCRCCs on enhanced CT
scans was 96.2±35.6 HU, and enhancement ratio was 73.7±9.3%
(Fig. 2). Significant differences
were observed between lipid-poor AMLs and CCRCCs with regard to the
net enhancement attenuation (wash-in) (Mann-Whitney U test,
P=0.001) and enhancement ratio (Mann-Whitney U test, P=0.010) on
contrast-enhanced CT scans. The ROC analysis yielded an AUC of
0.722 for the use of wash-in for differentiating CCRCCs from
lipid-poor AMLs. The threshold value of ≥84 HU determined for
wash-in was associated with sensitivity of 61.7% and specificity of
81.2%.
 | Table I.Lesion characteristics on early
enhancement computed tomography. |
Table I.
Lesion characteristics on early
enhancement computed tomography.
| Characteristic | Clear cell renal cell
carcinoma (n=49) | Renal angiomyolipoma
(n=34) | P-valuea |
|---|
| Pre-enhancement value
(HU) |
|
| 0.003 |
| Mean ±
SD | 30.9±7.4 | 37.8±14.8 |
|
|
Median | 30.1 | 40.5 |
|
|
Range | 15.8–48.9 | 6.7–58.0 |
|
| Net enhancement value
(HU) |
|
| 0.001 |
| Mean ±
SD | 96.2±35.6 | 70.9±42.7 |
|
|
Median | 94.5 | 60.7 |
|
|
Range | 18.5–177.3 | 15.8–195.1 |
|
| Enhancement ratio
(%) |
|
| 0.010 |
| Mean ±
SD | 73.7±9.3 | 62.8±18.9 |
|
|
Median | 75.1 | 63.7 |
|
|
Range | 52.7–89.2 | 21.4–89.8 |
|
Delayed contrast-enhanced CT and
relative percentage washout of contrast material
Lipid-poor AMLs exhibited a reduced washout of
contrast enhancement (washout value, 35.8±32.7 HU; washout ratio,
29.4±0.187%) compared with that of CCRCCs (washout value, 48.3±28.4
HU; washout ratio, 35.7±0.148%) (Mann-Whitney U test, P=0.037 and
P=0.204, respectively) (Figs. 1 and
2). The ROC analysis result revealed
an AUC of 0.639 for the use of washout to differentiate CCRCCs from
lipid-poor AMLs. The threshold value of ≥40 HU determined for
washout was associated with a sensitivity of 61.7% and specificity
of 62.5%.
Types of time-attenuation curves
The most common type of time-attenuation curve for
CCRCCs was type C (≥70 HU wash-in and >50 HU washout) (20/49
lesions; 40.8%), whilst for lipid-poor ALMs, type A (<70 HU
wash-in and any washout) was the most common (14/34 lesions;
41.2%). Type B (no washout) occurred in 2.0% of CCRCCs (1/49
lesions) and 35.3% of lipid-poor ALMs (12/34 lesions)
(χ2 test, P<0.001). Type D (≥70 HU wash-in and ≤50 HU
washout) occurred in 38.8% of CCRCCs (19/49 lesions) and 8.8% of
lipid-poor ALMs (3/34 lesions) (χ2 test, P=0.039)
(Table II).
| Table II.Patterns of nodule enhancement at
early and delayed enhancement computed tomography. |
Table II.
Patterns of nodule enhancement at
early and delayed enhancement computed tomography.
|
| Number of
lesions |
|
|---|
|
|
|
|
|---|
| Pattern of
enhancement | Clear cell renal cell
carcinoma (n=49) | Renal angiomyolipoma
(n=34) | P-valuea |
|---|
| Type A: wash-in
<70 HU and any washout | 9 | 14 |
0.022 |
| Type B: persistent
enhancement (no washout) | 1 | 12 | <0.001 |
| Type C: wash-in ≥70
HU and washout >50 HU | 20 | 2 | <0.001 |
| Type D: wash-in ≥70
HU and washout ≤50 HU | 19 | 6 |
0.039 |
Discussion
Solid renal masses lacking macroscopic fat remain a
diagnostic dilemma. Various strategies have been proposed to
differentiate lipid-poor AML from RCC on the basis of imaging
characteristics (4–8). In the current study, the results
indicated that the combination of wash-in and washout
characteristics on contrast-enhanced multi-detector row CT may be
useful for the differentiation of CCRCC from lipid-poor AML.
The definition of lipid-poor AML is generally
established on the basis of findings on unenhanced CT scans;
however, such tumors are actually observed to have intratumoral fat
upon microscopic examination (4).
Previous studies reported that high tumor attenuation in the
unenhanced phase may be a finding specific to lipid-poor AML
(4,14,15),
whereas CCRCC has a lower unenhanced phase attenuation (16). In the present study, the mean
attenuation value of AMLs (37.8±14.8 HU) on unenhanced CT scans was
significantly higher than that of CCRCCs (mean, 30.9±7.4 HU)
(Mann-Whitney U test, P=0.003). The ROC analysis showed that the
AUC is 0.674 using the attenuation value on unenhanced CT scans for
differentiating CCRCCs from AMLs.
Multiphasic contrast enhancement is another method
that researchers have proposed for the differentiation of
lipid-poor AML from RCC. However, previous studies have produced
variable results (3,16), thus limiting the utility of this
approach. These conflicting results may predominantly stem from the
different subtypes of RCC, which exhibit varying enhancement
patterns. A previous study has also demonstrated that homogeneous
enhancement and a prolonged enhancement pattern were the most
valuable CT findings for differentiating lipid-poor AML from RCC
(3). In the current study, in
general, CCRCCs tended to enhance substantially more than
lipid-poor AMLs. Net enhancement attenuation (wash-in) of CCRCCs on
early contrast-enhanced CT scans was higher than that of AMLs (96.2
vs. 70.9 HU, P=0.001). The ROC analysis revealed an AUC of 0.722
using net enhancement attenuation (wash-in) for differentiating
CCRCCs from lipid-poor AMLs. Using a cut-off value of 84 HU net
enhancement, the diagnostic sensitivity for CCRCCs is 61.7%, and
specificity is 81.2%. The washout of contrast enhancement on 5-min
contrast-enhanced CT scans was also higher in CCRCCs than in
lipid-poor AMLs (48.3 vs. 35.8 HU, P=0.037). The ROC analysis
result showed AUC is 0.639 using washout of contrast enhancement on
5-min contrast-enhanced CT scans for differentiating CCRCCs from
lipid-poor AMLs. Using a cut-off value of 40 HU net enhancement,
the diagnostic sensitivity for CCRCCs is 61.7% and specificity is
62.5%.
The biological basis for the observed differences in
wash-in and washout characteristics between CCRCCs and lipid-poor
AMLs may be postulated as follows. The bio-distribution of
nonspecific contrast medium is determined by the relative level of
vascular perfusion of different tissues and their capillary
permeability (12). The majority of
malignant tumors have a high level of vascular perfusion and a
large extracellular space, which would contribute to intense
enhancement in early enhanced CT scans (12). As for the majority of AMLs, distorted
blood vessel and blood sinusoids would contribute to the retention
of contrast medium in delay enhanced CT scans (15). This explanation may apply to CCRCCs
with intense enhancement and larger washout than lipid-poor AMLs on
multiphasic contrast-enhanced CT scans.
In conclusion, the differential diagnosis of CCRCCs
and lipid-poor AMLs may be achieved using wash-in and washout
characteristics on contrast-enhanced CT. Larger wash-in and washout
values of contrast enhancement are predictors that a lesion is
CCRCC. However, the sensitivity and specificity of the dynamic CT
in the current study were not high enough; thus, further studies,
particularly involving multivariate analysis, are required.
Acknowledgements
This study was partly supported by the Science
Technology Commission of Shanghai Municipality (grant no.
124119a0100) and the National Natural Science Foundation of China
(grant nos. 81301218 and 81301262).
References
|
1
|
Choyke PL, Glenn GM, Walther MM, Zbar B
and Linehan WM: Hereditary renal cancers. Radiology. 226:33–46.
2003. View Article : Google Scholar : PubMed/NCBI
|
|
2
|
Hafron J, Fogarty JD, Hoenig DM, Li M,
Berkenblit R and Ghavamian R: Imaging characteristics of minimal
fat renal angiomyolipoma with histologic correlations. Urology.
66:1155–1159. 2005. View Article : Google Scholar : PubMed/NCBI
|
|
3
|
Kim JK, Park SY, Shon JH and Cho KS:
Angiomyolipoma with minimal fat: Differentiation from renal cell
carcinoma at biphasic helical CT. Radiology. 230:677–684. 2004.
View Article : Google Scholar : PubMed/NCBI
|
|
4
|
Simpfendorfer C, Herts BR, Motta-Ramirez
GA, Lockwood DS, Zhou M, Leiber M and Remer EM: Angiomyolipoma with
minimal fat on MDCT. Can counts of negative-attenuation pixels aid
diagnosis? AJR Am J Roentgenol. 192:438–443. 2009. View Article : Google Scholar : PubMed/NCBI
|
|
5
|
Simpson E and Patel U: Diagnosis of
angiomyolipoma using computed tomography-region of interest <
or=−10 HU or 4 adjacent pixels < or=−10 HU are recommended as
the diagnostic thresholds. Clin Radiol. 61:410–416. 2006.
View Article : Google Scholar : PubMed/NCBI
|
|
6
|
Kim JY, Kim JK, Kim N and Cho KS: CT
histogram analysis: Differentiation of angiomyolipoma without
visible fat from renal cell carcinoma at CT imaging. Radiology.
246:472–479. 2008. View Article : Google Scholar : PubMed/NCBI
|
|
7
|
Catalano OA, Samir AE, Sahani DV and Hahn
PF: Pixel distribution analysis: Can it be used to distinguish
clear cell carcinomas from angiomyolipomas with minimal fat?
Radiology. 247:738–746. 2008. View Article : Google Scholar : PubMed/NCBI
|
|
8
|
Kim JK, Kim SH, Jang YJ, Ahn H, Kim CS,
Park H, Lee JW, Kim S and Cho KS: Renal angiomyolipoma with minimal
fat: Differentiation from other neoplasms at double-echo chemical
shift FLASH MR imaging. Radiology. 239:174–180. 2006. View Article : Google Scholar : PubMed/NCBI
|
|
9
|
Jeong YJ, Lee KS, Jeong SY, Chung MJ, Shim
SS, Kim H, Kwon OJ and Kim S: Solitary pulmonary nodule:
Characterization with combined wash-in and washout features at
dynamic multidetector row CT. Radiology. 237:675–683. 2005.
View Article : Google Scholar : PubMed/NCBI
|
|
10
|
Pena CS, Boland GW, Hahn PF, Lee MJ and
Mueller PR: Characterization of indeterminate (lipid-poor) adrenal
masses: Use of washout characteristics at contrast-enhanced CT.
Radiology. 217:798–802. 2000. View Article : Google Scholar : PubMed/NCBI
|
|
11
|
Caoili EM, Korobkin M, Francis IR, Cohan
RH, Platt JF, Dunnick NR and Raghupathi KI: Adrenal masses:
Characterization with combined unenhanced and delayed enhanced CT.
Radiology. 222:629–633. 2002. View Article : Google Scholar : PubMed/NCBI
|
|
12
|
Ye XD, Ye JD, Yuan Z, Dong S and Xiao XS:
Characterization of solitary pulmonary nodules: Use of washout
characteristics at contrast-enhanced computed tomography. Oncol
Lett. 3:672–676. 2012.PubMed/NCBI
|
|
13
|
Ye XD, Ye JD, Yuan Z, Li WT and Xiao XS:
Dynamic CT of solitary pulmonary nodules: Comparison of contrast
medium distribution characteristic of malignant and benign lesions.
Clin Transl Oncol. 16:49–56. 2014. View Article : Google Scholar : PubMed/NCBI
|
|
14
|
Jinzaki M, Tanimoto A, Narimatsu Y, Ohkuma
K, Kurata T, Shinmoto H, Hiramatsu K, Mukai M and Murai M:
Angiomyolipoma: Imaging findings in lesions with minimal fat.
Radiology. 205:497–502. 1997. View Article : Google Scholar : PubMed/NCBI
|
|
15
|
Silverman SG, Mortele KJ, Tuncali K,
Jinzaki M and Cibas ES: Hyperattenuating renal masses: Etiologies,
pathogenesis and imaging evaluation. Radiographics. 27:1131–1143.
2007. View Article : Google Scholar : PubMed/NCBI
|
|
16
|
Zhang J, Lefkowitz RA, Ishill NM, Wang L,
Moskowitz CS, Russo P, Eisenberg H and Hricak H: Solid renal
cortical tumors: Differentiation with CT. Radiology. 244:494–504.
2007. View Article : Google Scholar : PubMed/NCBI
|