Introduction
Cholangiocarcinoma (CCA) is an uncommon tumor that
may originate from anywhere in the biliary epithelium (1). In America, the incidence of this disease
is 1.4–1.7 per 100,000 individuals (1,2), whilst
Chinese patients with CCA account for >55% of cases worldwide
(3). Complete tumor resection is
considered to be the most efficient therapy for CCA; however, only
10% of patients are regarded as candidates for surgical resection
as CCA may be highly malignant and progress rapidly, making
surgical resection no longer an option for the majority of patients
upon diagnosis (1). Long-term
survival remains poor in patients that are not candidates for
surgical resection, and the 5-year survival rate is ~5% (4).
Reverse transcription-quantitative polymerase chain
reaction (RT-qPCR) is regarded, at present, as the gold standard
for efficient and sensitive analysis of gene expression (5–7). In order
to produce reliable data, however, gene expression levels must be
normalized using two or more reference genes (8–10). Ideal
reference genes are those which are stable, unregulated and
invariable under the conditions of the experiment. Thus, it is
important to conduct validation experiments to assess reference
gene expression stability for each target tissue and disease
(11,12). To the best of our knowledge, studies
on the selection of suitable reference genes for use in target gene
profiling in CCA tissues and cell lines have not been previously
published.
The aim of the present study was to identify the
most suitable reference gene or set of genes for target gene
profiling of CCA. The stability of 12 common reference genes were
validated in CCA tissues and paired normal tissues from 20 patients
with CCA. In addition, the stability of the reference genes was
validated in one CCA cell line. Three common programs, GeNorm
(8) NormFinder (13) and BestKeeper (14), were employed for analysis of the
reference genes. In order to determine the validity of the
reference genes, a target gene, KRAS, which is closely associated
with CCA (15), was used as a
normalizer. The present study provides useful information regarding
the selection of a suitable reference gene to utilize in future
gene expression studies in CCA tissues and cell lines.
Materials and methods
CCA samples
A total of 20 tissue samples were obtained from
patients that were treated for CCA by resection surgery between
January 2009 and December 2013 at China-Japan Union Hospital of
Jilin University (Changchun, China). Written informed consent was
obtained from the patients for the use of their tissues in the
present study. Paired normal samples were collected from tissues
adjacent to the tumor. All samples were snap-frozen in liquid
nitrogen immediately following excision and stored at −80°C until
required. All tumors were histopathologically diagnosed and staged
according to the American Joint Committee on Cancer (16). The characteristics of the patients are
summarized in Table I. The study
protocol was approved by the Ethics Committee of the China-Japan
Union Hospital.
 | Table I.Clinicopathological characteristics of
20 patients with cholangiocarcinoma. |
Table I.
Clinicopathological characteristics of
20 patients with cholangiocarcinoma.
| Characteristic | Value |
|---|
| Age, years; mean ±
standard deviation | 54±16.7 |
| Gender, n |
|
| Male | 12 |
|
Female | 8 |
| Histopathological
type, n |
|
|
Adenocarcinoma | 20 |
| Squamous
cell carcinoma | 0 |
| TNM
stagea, n |
|
|
T1aN0M0 | 4 |
|
TlbN0M0 | 6 |
|
T2aN1M0 | 6 |
|
T2bN1M0 | 4 |
Cell lines
The human CCA cell line QBC939 was purchased from
the Cell Bank of Type Culture Collection of Chinese Academy of
Sciences (Shanghai, China) and was cultured in RPMI-1640
(Invitrogen®; Thermo Fisher Scientific, Inc., Waltham, MA, USA)
supplemented with 10% fetal bovine serum and 0.02 mg/ml kanamycin
(both Gibco®; Thermo Fisher Scientific, Inc.).
RNA extraction and RT
Tissue samples and the cell line were homogenized in
Trizol® Reagent (Invitrogen®; Thermo Fisher Scientific, Inc.) and
purified with the RNeasy® Mini kit (Qiagen, Inc., Valencia, CA,
USA). DNase I (Qiagen, Inc., Valencia, CA, USA) was used to
eliminate genomic DNA contamination. Concentrations and quality of
the isolated RNA were measured using a Synergy™ HT microplate
reader (Bio-Tek Instruments, Inc., Winooski, VT, USA) at a
A260/A280 ratio. The quality standard of the RNA samples was
1.9–2.2. The integrity of RNA samples was determined using
electrophoresis on a 1% agarose gel (Invitrogen; Thermo Fisher
Scientific, Inc.). RT was performed using an All-in-One™
First-Strand complementary (c)DNA Synthesis kit (GeneCopoeia, Inc.,
Rockville, MD, USA) in a total volume of 25 µl, following the
manufacturer's protocol.
qPCR
Primer pairs of 12 putative reference genes were
designed using Primer Premier version 5.0 (Premier Biosoft
International, Palo Alto, CA, USA) and were synthesized by Sangon
Biotech Co., Ltd. (Shanghai, China) (Table II). A LightCycler® 480 Real-Time PCR
System (Roche Diagnostics GmbH, Mannheim, Germany) was used for
qPCR. Reactions were performed with All-in-One™ qPCR Mix
(GeneCopoeia, Inc.), according to the manufacturer's protocol. All
samples were run in triplicate on 96-well plates. The total PCR
volume was 20 µl, comprising 2 µl cDNA. The following cycling
conditions were used: 55°C for 5 min; 95°C for 5 min, then 40
cycles of 95°C for 20 sec, 55°C for 20 sec and 72°C for 4 min. The
cycle was followed by melting curve analysis, and baseline and
cycle threshold values (Cq values) were automatically determined
for all samples using Roche LightCycler 480 software (version 1.5).
A standard curve was constructed for each primer pair to determine
product specificity. Cq values were identified using quantitative
comparison of the amplification of the candidate genes. Cq values
were calculated to relative quantities for data analysis according
to the PCR efficiencies of the candidate genes using the following
equation (17): Q = 2-ΔCq.
| Table II.Primer sequences, product size and PCR
efficiency of 12 reference genes and KRAS, a target gene. |
Table II.
Primer sequences, product size and PCR
efficiency of 12 reference genes and KRAS, a target gene.
|
| Primer sequences,
5′-3′ |
|
|
|---|
|
|
|
|
|
|---|
| Gene | Forward | Reverse | Product size, bp | PCR efficiency |
|---|
| 18SrRNA |
CGGCTACCACATCCAAGGAA |
GCTGGAATTACCGCGGCT | 186 | 2.12 |
| GAPDH |
GACAGTCAGCCGCATCTTCT |
TTAAAAGCAGCCCTGGTGAC | 127 | 1.98 |
| B2M |
AGCGTACTCCAAAGATTCAGGTT |
ATGATGCTGCTTACATGTCTCGT | 206 | 1.96 |
| ACTB |
AGAAAATCTGGCACCACACC |
TAGCACAGCCTGGATAGCAA | 173 | 1.98 |
| ALAS1 |
GGCAGCACAGATGAATCAGA |
CCTCCATCGGTTTTCACACT | 150 | 2.01 |
| GUSB |
AGCCAGTTCCTCATCAATGG |
GGTAGTGGCTGGTACGGAAA | 160 | 1.88 |
| HPRT1 |
GACCAGTCAACAGGGGACAT |
CCTGACCAAGGAAAGCAAAG | 132 | 1.96 |
| PBGD |
AGTGTGGTGGGAACCAGC |
CAGGATGATGGCACTGAACTC | 144 | 2.11 |
| PPIA |
AGACAAGGTCCCAAAGAC |
ACCACCCTGACACATAAA | 118 | 1.96 |
| PUM1 |
CAGGCTGCCTACCAACTCAT |
GTTCCCGAACCATCTCATTC | 211 | 2.01 |
| RPL29 |
GGCGTTGTTGACCCTATTTC |
GTGTGTGGTGTGGTTCTTGG | 120 | 2.00 |
| TBP |
TGCACAGGAGCCAAGAGTGAA |
CACATCACAGCTCCCCACCA | 132 | 2.16 |
| KRAS |
ACCGGAAGCAGGTGGTCAT |
CTTGGTGTTGTTGATGGCAAA | 146 | 1.97 |
PCR efficiency
A random pool of cDNA was selected from the 20
patient samples and was 2-fold serially diluted (range,
1:1-1:100,000). The PCR efficiencies were calculated using the
slopes of the calibration curves and the following formula: E =
10-1/slope (18). PCR efficiencies
are presented in Table II.
Evaluation of reference gene
stability
Statistical analyses were conducted with GraphPad
Prism software (version 5.0; GraphPad Software, Inc., La Jolla, CA,
USA) and SPSS 16.0 (SPSS Inc., Chicago, IL, USA). In order to
evaluate the differential expression of target genes, one-way
analysis of variance with the Dunnett's test was used. P<0.05
was considered to indicate a statistically significant
difference.
The samples were divided into the following six
groups: CCA tissue; adjacent non-neoplastic tissue; CCA cell line;
matched pairs of adjacent non-neoplastic and CCA tissues; CCA
tissue and cell line group; and total samples. Subsequently, to
improve the evaluation of the stability of the reference genes,
three frequently used programs were selected: GeNorm (genorm.cmgg.be/), NormFinder (moma.dk/normfinder-software) and BestKeeper
(gene-quantification.de/bestkeeper.html). GeNorm has
been designed to establish reference genes for RT-qPCR and analyzes
and determines the M-value of reference genes. The M-value is the
stability of reference gene expression. The higher the M-value, the
poorer the stability of the reference gene; the default value
suggested by GeNorm is M=1.5. If the M-value is >1.5, it is not
suitable to be used as a stable and reliable reference gene
(8).
GeNorm software may also be used to analyze the
pairwise variation value of the normalization factor (V), which has
a default value of 0.15. Pairwise variation (Vn/n+1) was calculated
between the two sequential normalization factors (NFn and NFn+1)
for all samples to determine the optimal number of reference genes
for reliable normalization. The value of Vn/Vn+1 may be used to
determine if adding a new reference gene may greatly affect the
normalization of the Fact-value. If the value of Vn/Vn+1 is
>0.15, n+1 reference genes are required as internal controls. If
Vn/Vn+1 is <0.15, then it is not required to use new reference
genes. NormFinder software has also been designed to identify the
optimal reference gene among a set of candidate genes and it has a
similar operation principle to GeNorm. It analyzes expression data,
ranks a set of candidate normalization genes according to their
expression stability and considers the gene with the minimum
expression data as the most stable gene. This software may also be
used to compare the stability of inter- and intra-group reference
genes. BestKeeper evaluates candidate reference gene stability
based on the standard deviation (SD) and correlation coefficient
(r-value). If the SD is >1, the gene is not suitable to be used
as a stable and reliable reference gene, and the higher the
r-value, the more stable the reference gene.
Target gene relative expression
analysis
KRAS is a proto-oncogene and is important in CCA
development (15). The present study
evaluated KRAS as a target gene, and the primer sequence is shown
in Table II. The analysis of the 20
paired CCA tissue samples for target gene relative expression was
calculated according to the 2-∆∆Cq method (19) using various candidate reference genes
as the standard.
Results
RNA quality
In order to avoid erroneous results, only
high-quality RNA samples were used in the present study. Total RNA
samples were assessed for concentration, purity and integrity. The
mean A260/A280 ratio of the RNA samples was 2.01±0.045. The
integrity of RNA samples was characterized by the 28S/18S ratio,
which was >1.5, on 1% agarose gels.
The sequences of primers, corresponding length of
the amplified products and the PCR amplification efficiency are
shown in Table II. The present study
used two methods to verify the specificity of the primers. Firstly,
qPCR amplification products were detected using 1% agarose gel
electrophoresis (Fig. 1). Gel imaging
demonstrated that the size of the amplified fragments of the
reference genes was as expected; the bands were clear and there
were no primer dimers or nonspecific banding. In addition, by
observing the melting curve of each amplified gene fragment using
qPCR, it was demonstrated that all curves had single signal peaks.
For the candidate reference genes and the target gene, the
amplification efficiency of the standard curve was 1.88–2.16, and
all r-values were >0.98.
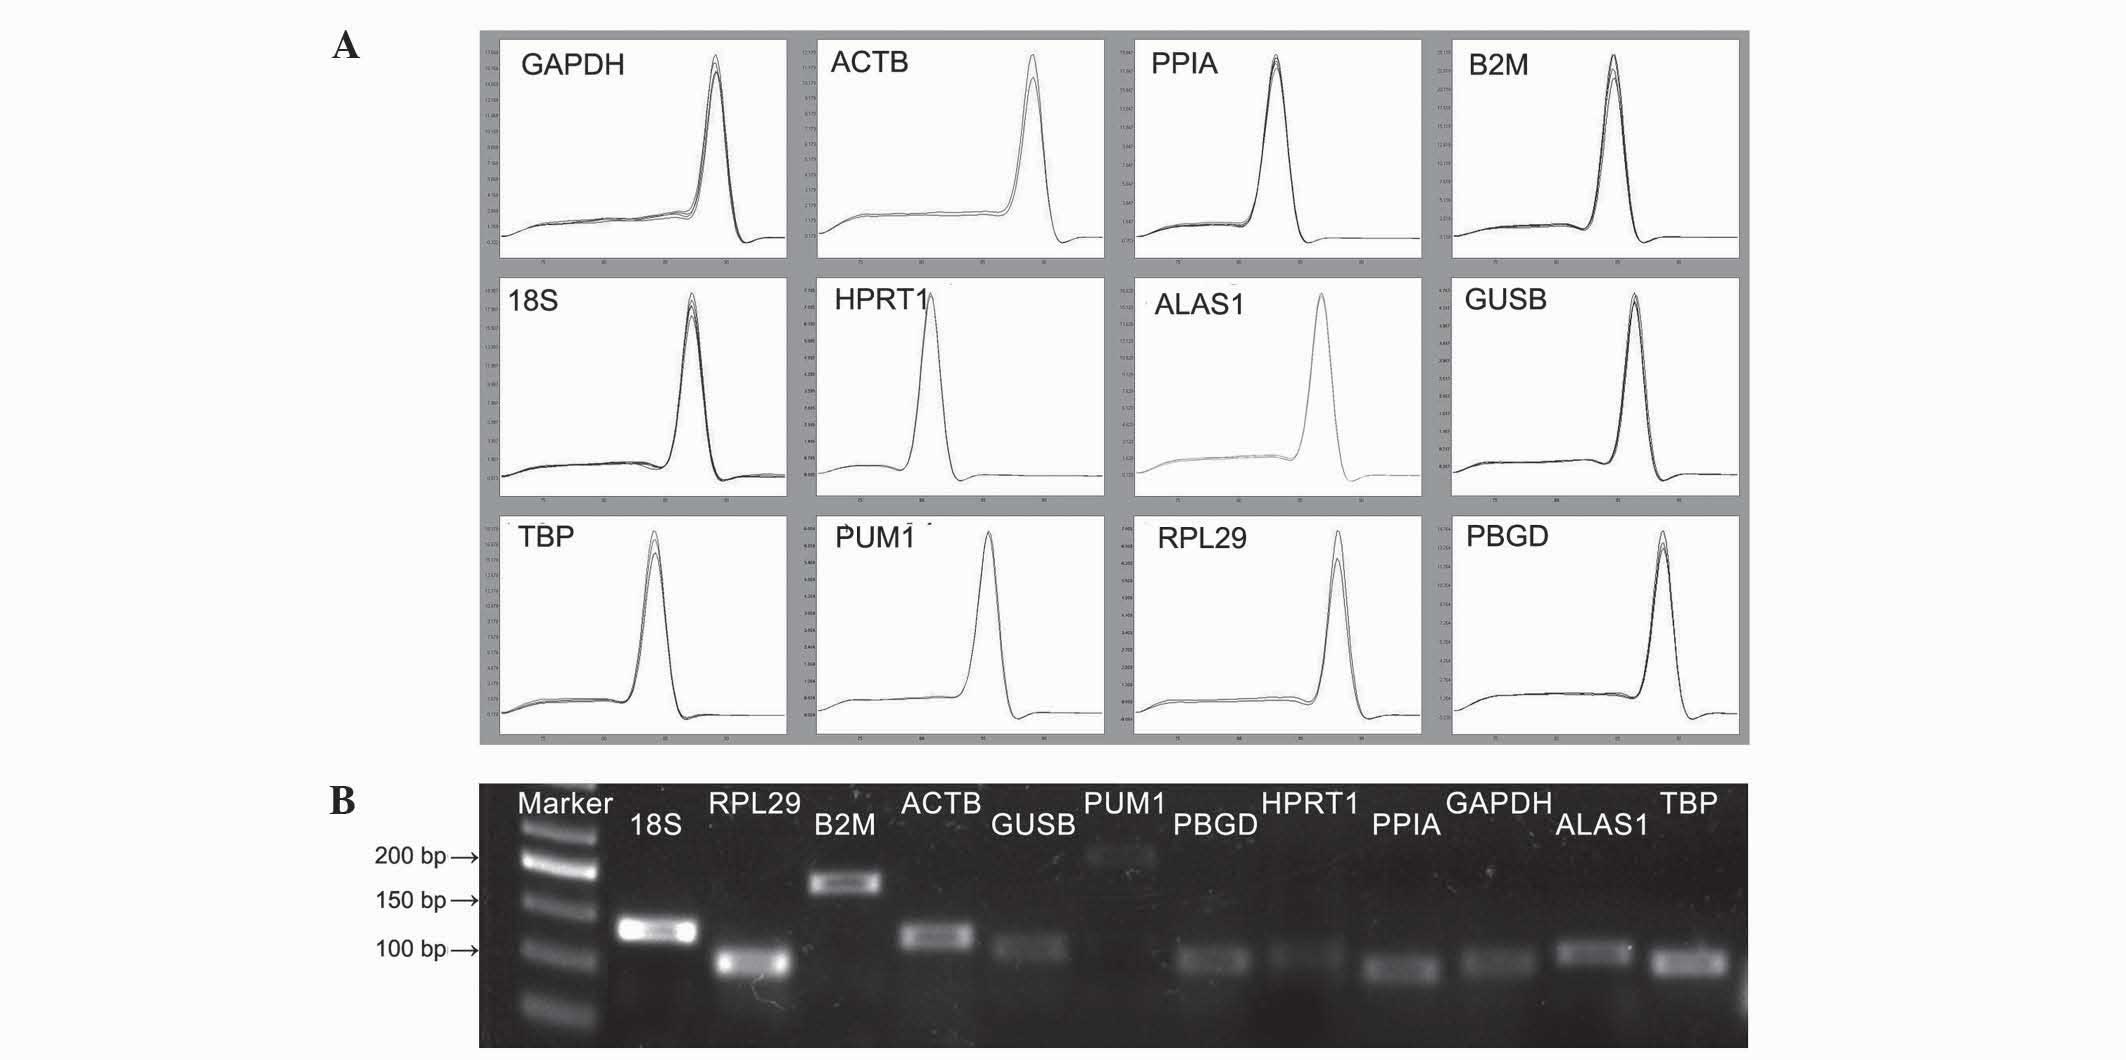 | Figure 1.Specificity of RT-qPCR amplification.
(A) Melting curves of RT-qPCR amplification products. (B) RT-qPCR
amplification products were detected using 1% agarose gel
electrophoresis. RT-qPCR, reverse transcription-quantitative
polymerase chain reaction; GAPDH, glyceraldehyde 3-phosphate
dehydrogenase; ACTB, actin-β; PPIA, peptidylprolyl isomerase A;
B2M, β-2-microglobulin; 18S, 18S ribosomal RNA; HPRT1, hypoxanthine
phosphoribosyltransferase 1; ALAS1, 5′-aminolevulinate synthase 1;
GUSB, glucuronidase-β; TBP, TATA-box binding protein; PUM1, pumilio
RNA binding family member 1; RPL29, ribosomal protein L29; PBGD,
porphobilinogen deaminase. |
Gene expression
The expression level of the candidate reference
genes was determined by the Cq value, which is inversely
proportional to the expression level of a gene; the greater the Cq
value, the smaller the expression quantity, and vice versa. As
shown in Fig. 2, the Cq value of all
the samples ranged from 24.52±4.52 to 35.74±3.67. In all the
groups, glyceraldehyde 3-phosphate dehydrogenase (GAPDH) had the
smallest Cq value and porphobilinogen deaminase (PBGD; also known
as hydroxymethylbilane synthase) had the largest. There was a
significant difference in the expression level of the candidate
reference genes between the CCA tissues and the paired normal
tissues (Cq, 24.12±0.38 vs. 26.6±0.16 in CAA vs. non-neoplasyic
tissues, respectively; P=0.003). The alteration in the Cq value of
each group of candidate genes indicated that the expression level
of the genes may differ between various experimental
conditions.
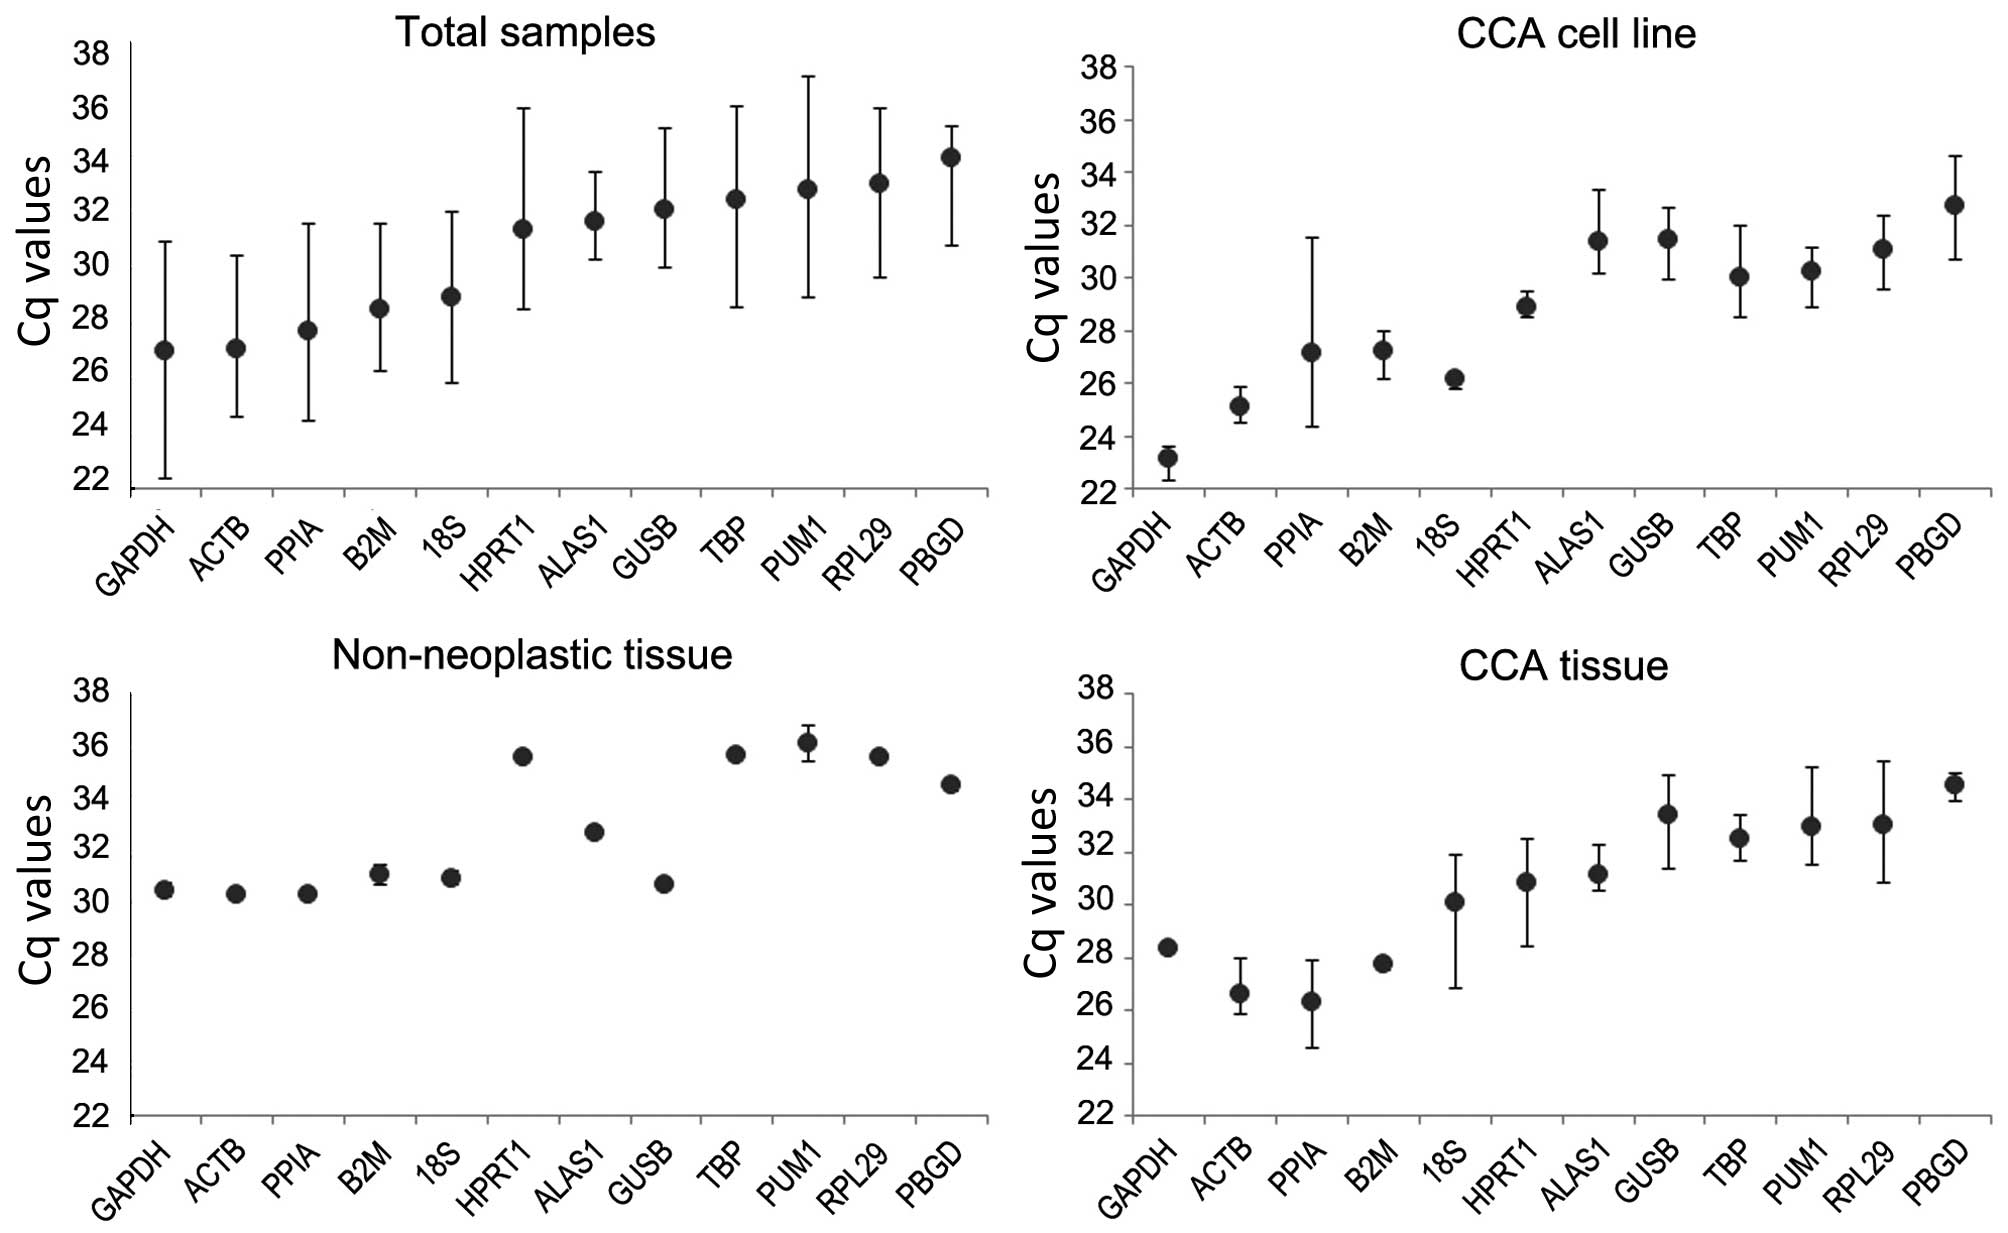 | Figure 2.Mean Cq values of reference genes in
various samples: Total samples group, CCA cell line, adjacent
non-neoplastic tissue group and CCA tissue group. Whiskers
represent the ranges for 20 matched samples. The results are
presented as the mean ± standard deviation. Cq, quantification
cycle; CCA, cholangiocarcinoma; GAPDH, glyceraldehyde 3-phosphate
dehydrogenase; ACTB, actin-β; PPIA, peptidylprolyl isomerase A;
B2M, β-2-microglobulin; 18S, 18S ribosomal RNA; HPRT1, hypoxanthine
phosphoribosyltransferase 1; ALAS1, 5′-aminolevulinate synthase 1;
GUSB, glucuronidase-β; TBP, TATA-box binding protein; PUM1, pumilio
RNA binding family member 1; RPL29, ribosomal protein L29; PBGD,
porphobilinogen deaminase. |
Stability analysis of the candidate
reference genes using GeNorm analysis
GeNorm was used to select the optimal reference
genes. Two parameters were considered to quantify reference gene
stability: M-value (average expression stability) and Vn/Vn+1
(pair-wise variation). GeNorm software eliminates the gene with the
highest M-value and repeats the process until only two genes
remain. The M-values of the 12 candidate reference genes in each
group are shown in Fig. 3. The
software analysis indicated that pumilio RNA binding family member
1 (PUM1) and ribosomal protein L29 (RPL29) were the most stable
reference genes of the total samples group and the CCA cell line
group. Similarly, in the CCA tissue and cell line group, PUM1 and
RPL29 were the most stable, followed by actin-β (ACTB). In the
adjacent non-neoplastic group, ACTB and hypoxanthine
phosphoribosyltransferase 1 (HPRT1) were the most stable. In CCA
and adjacent non-neoplastic tissue groups, ACTB and TATA-box
binding protein (TBP) were the most stable reference genes. In the
CCA tissue group, the most stable reference genes were
β-2-microglobulin (B2M) and GAPDH.
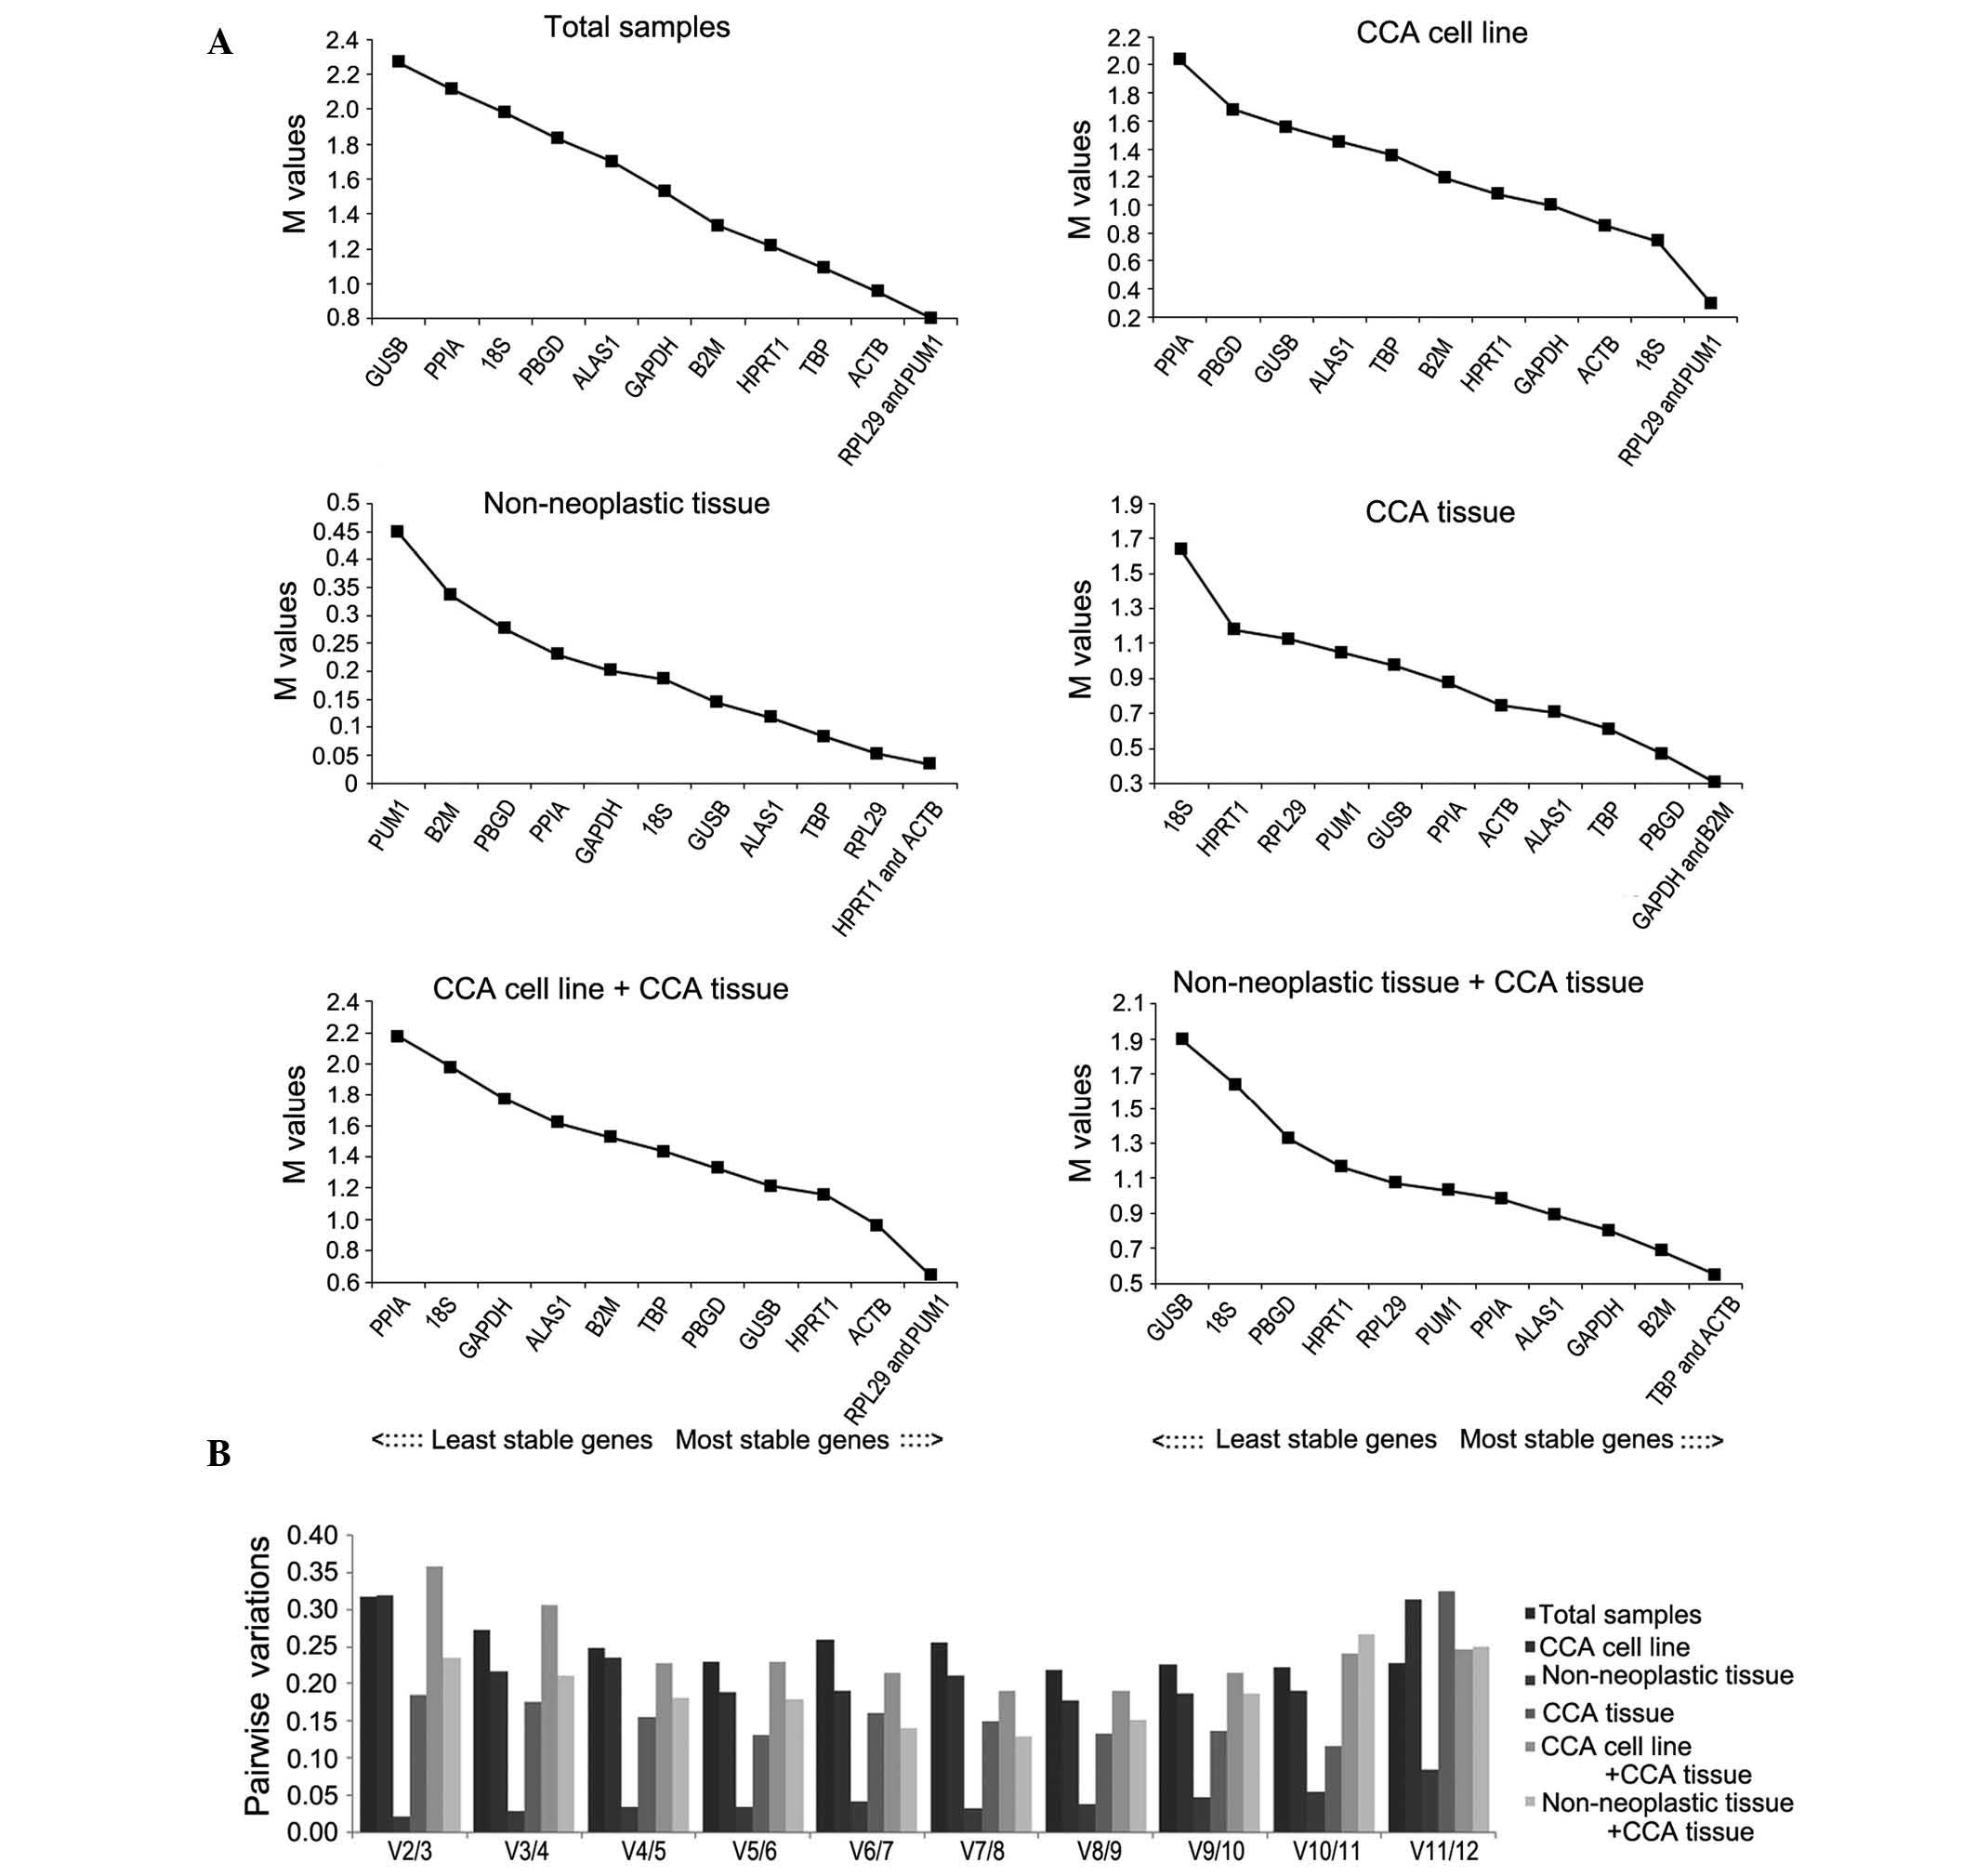 | Figure 3.GeNorm analysis of 12 candidate
reference genes. Results are presented according to the output file
of the GeNorm program. (A) Stepwise exclusion of the least stable
genes calculating the average expression stability as measured by
the M-value in various samples. The x-axis from left to right
indicates the ranking of the reference genes according to
expression stability and the y-axis indicates the stability as
measured by the M-value. (B) Determination of the optimal number of
reference genes for normalization based on the geNorm algorithm. V
value defines the pairwise variation between two sequential
normalization. V, variable; CCA, cholangiocarcinoma; GAPDH,
glyceraldehyde 3-phosphate dehydrogenase; ACTB, actin-β; PPIA,
peptidylprolyl isomerase A; B2M, β-2-microglobulin; 18S, 18S
ribosomal RNA; HPRT1, hypoxanthine phosphoribosyltransferase 1;
ALAS1, 5′-aminolevulinate synthase 1; GUSB, glucuronidase-β; TBP,
TATA-box binding protein; PUM1, pumilio RNA binding family member
1; RPL29, ribosomal protein L29; PBGD, porphobilinogen
deaminase. |
To determine the optimal number of required
reference genes for each group, Vn/Vn+1 was evaluated using GeNorm;
the default threshold value is 0.15. However, as stated by Wan
et al (20), 0.15 is not an
absolute cutoff value, but rather an ideal value, which is
dependent on the expression of the genes and the diversity of the
samples tested. The number of reference genes recommended to be
used in each group is shown in Fig.
3B. The combination of 8 reference genes in the total sample
group is the optimum (V8/9=0.219), while 7 is the optimum in the
CCA tissue group (V7/8=0.150); in addition, the adjacent
non-neoplastic tissue group has an optimum combination of 11
reference genes (V11/12=0.107). The combination of 8 reference
genes in the CCA cell line group is the optimum (V8/9=0.178), while
6 is the optimum in matched pairs of adjacent non-neoplastic and
CCA tissues group (V6/7=0.140). The CCA tissue and cell line group
has an optimum combination of 7 reference genes (V7/8=0.191).
Stability analysis of candidate
reference genes using NormFinder analysis
NormFinder was used to validate the most stable
genes (Fig. 4). According to the
analysis, in the total samples group, the most stable reference
gene was RPL29, followed by TBP, and the recommended combination
was ACTB and PBGD. In the CCA cell line group, the most stable
reference gene was 18S ribosomal RNA (18SrRNA), followed by PUM1.
In the CCA cell line and CCA tissue group, ACTB was the most stable
followed by TBP. In the adjacent non-neoplastic group, HPRT1 was
the most stable gene, followed by ACTB. In CCA tissue and adjacent
non-neoplastic tissue group, GAPDH was the most stable reference
gene, followed by 5′-aminolevulinate synthase 1 (ALAS1). In CCA
tissue group, the most stable reference gene was TBP followed by
ALAS1.
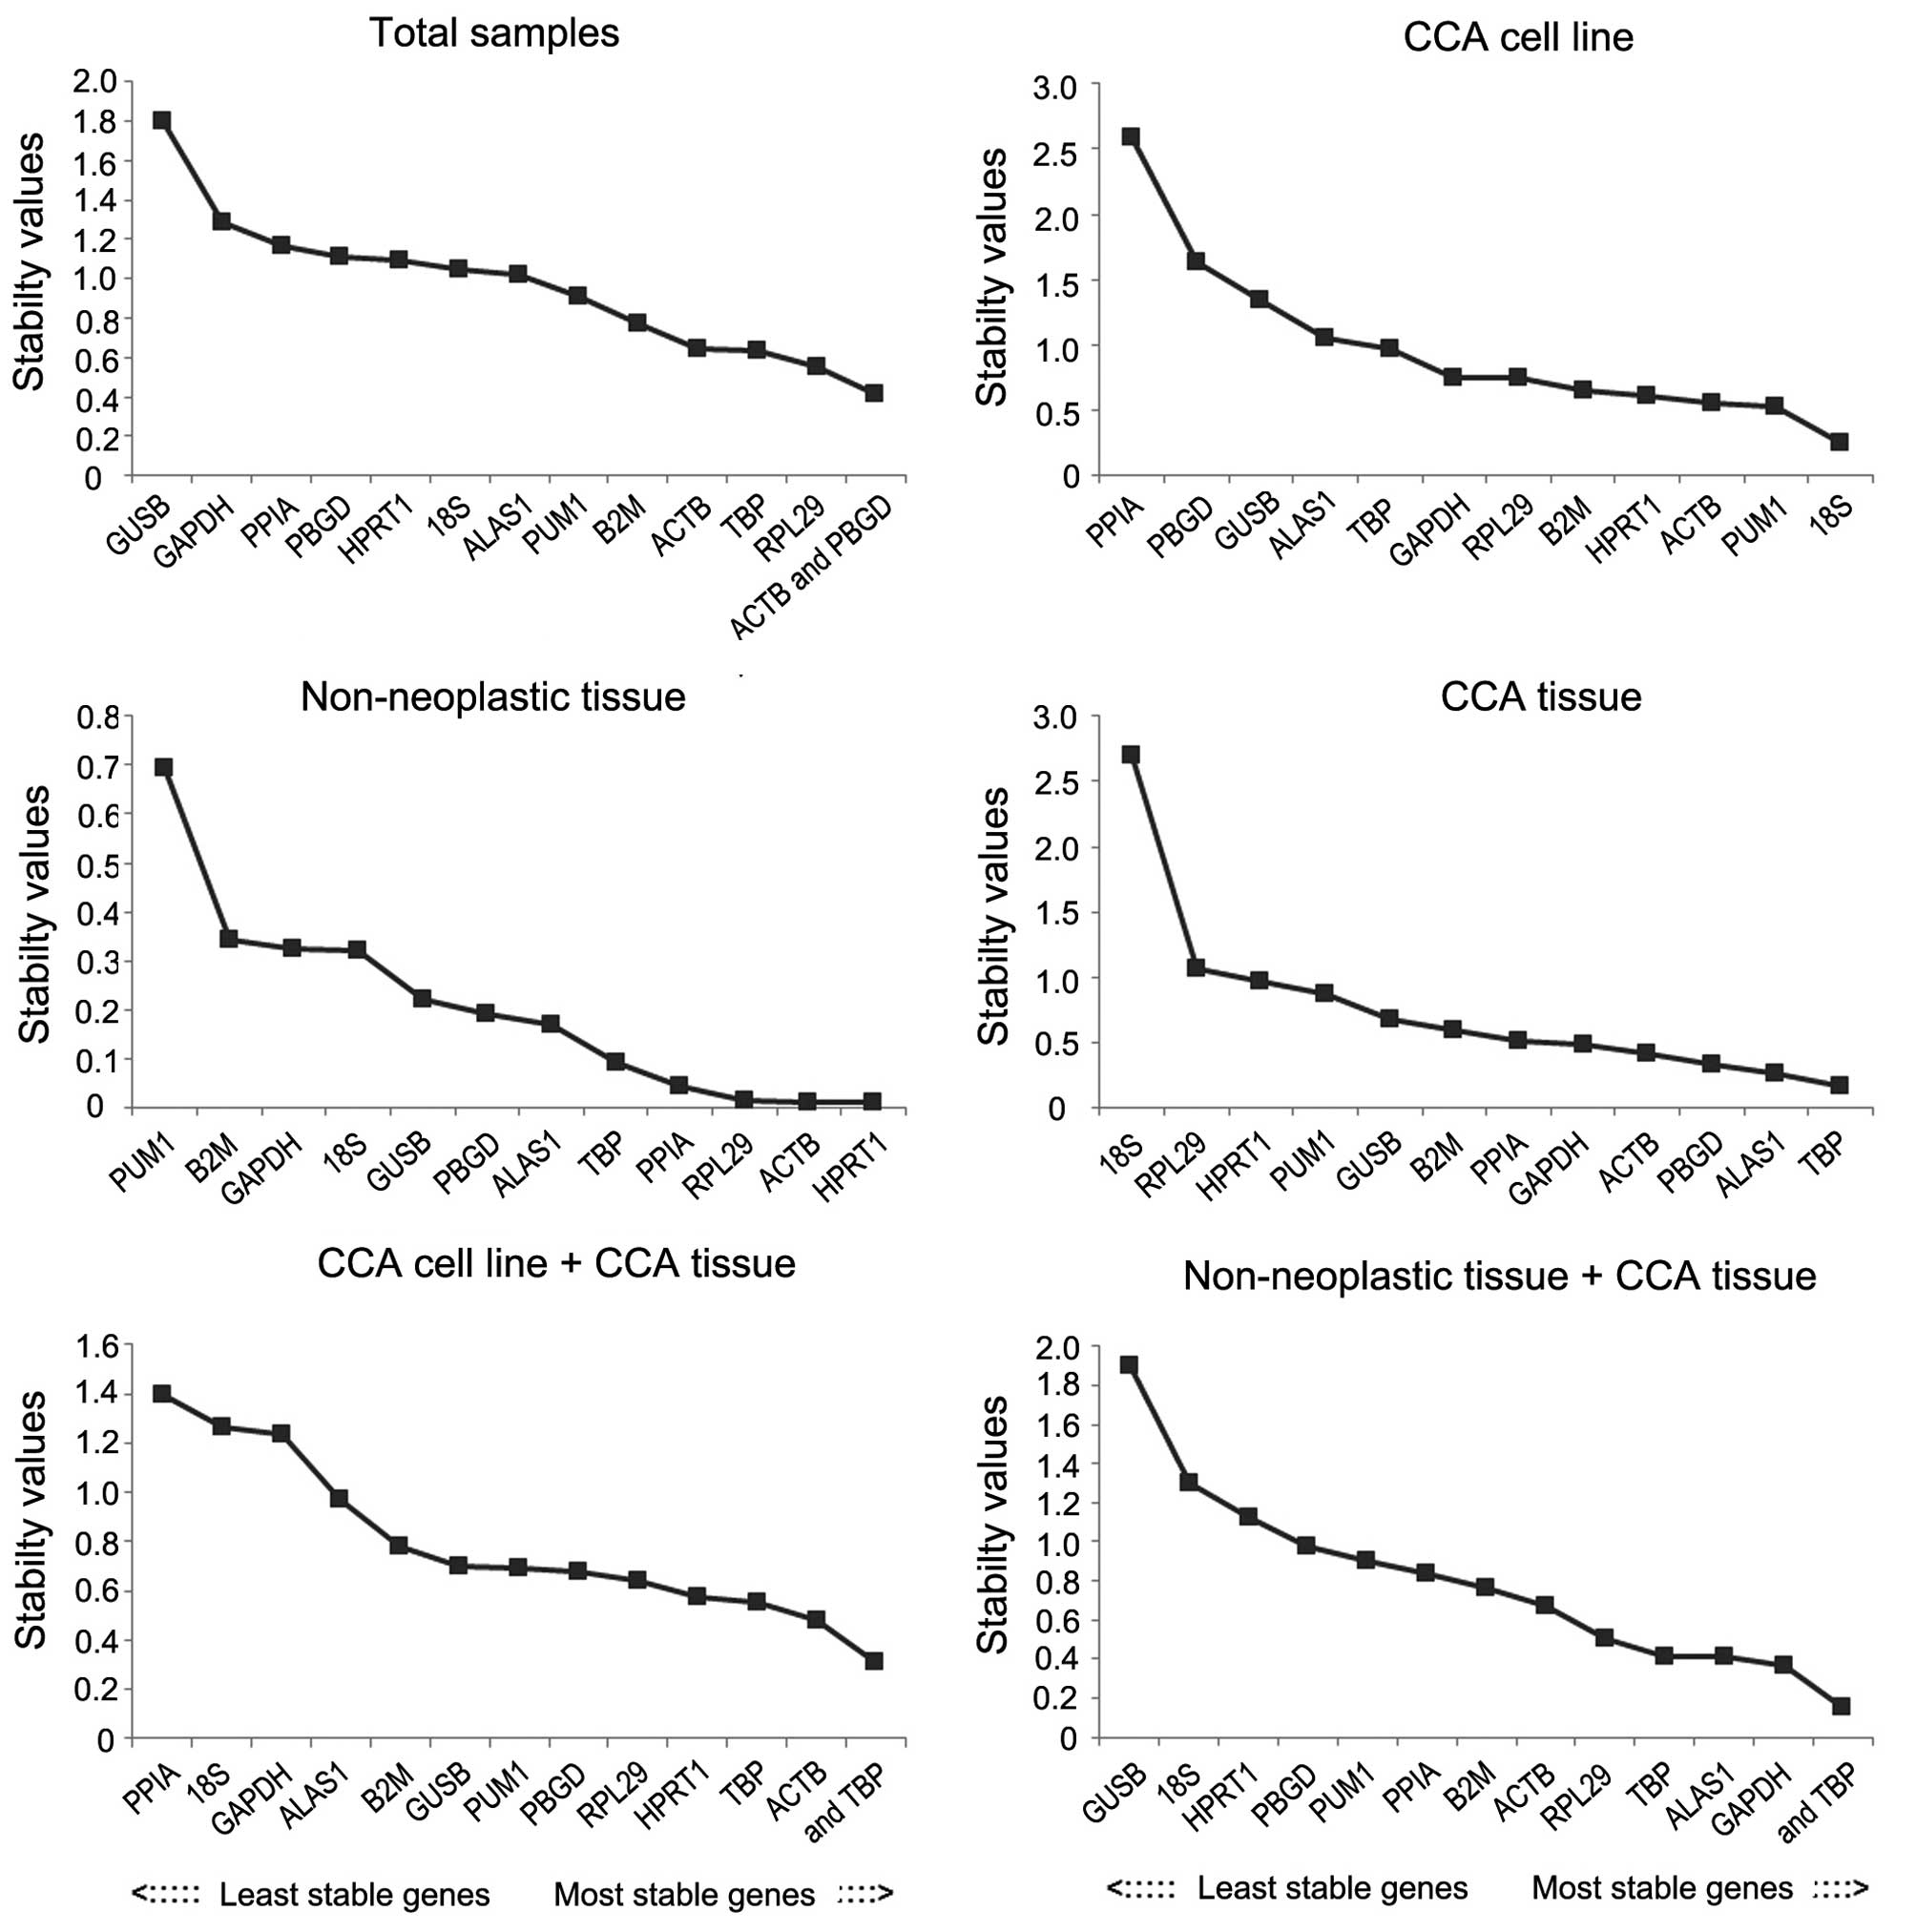 | Figure 4.Candidate reference genes for
normalization according to their expression stability calculated
using NormFinder in various groups. The x-axis from left to right
represents the ranking of stability of the reference genes. CCA,
cholangiocarcinoma; GAPDH, glyceraldehyde 3-phosphate
dehydrogenase; ACTB, actin-β; PPIA, peptidylprolyl isomerase A;
B2M, β-2-microglobulin; 18S, 18S ribosomal RNA; HPRT1, hypoxanthine
phosphoribosyltransferase 1; ALAS1, 5′-aminolevulinate synthase 1;
GUSB, glucuronidase-β; TBP, TATA-box binding protein; PUM1, pumilio
RNA binding family member 1; RPL29, ribosomal protein L29; PBGD,
porphobilinogen deaminase. |
Stability analysis of the candidate
reference genes using BestKeeper analysis
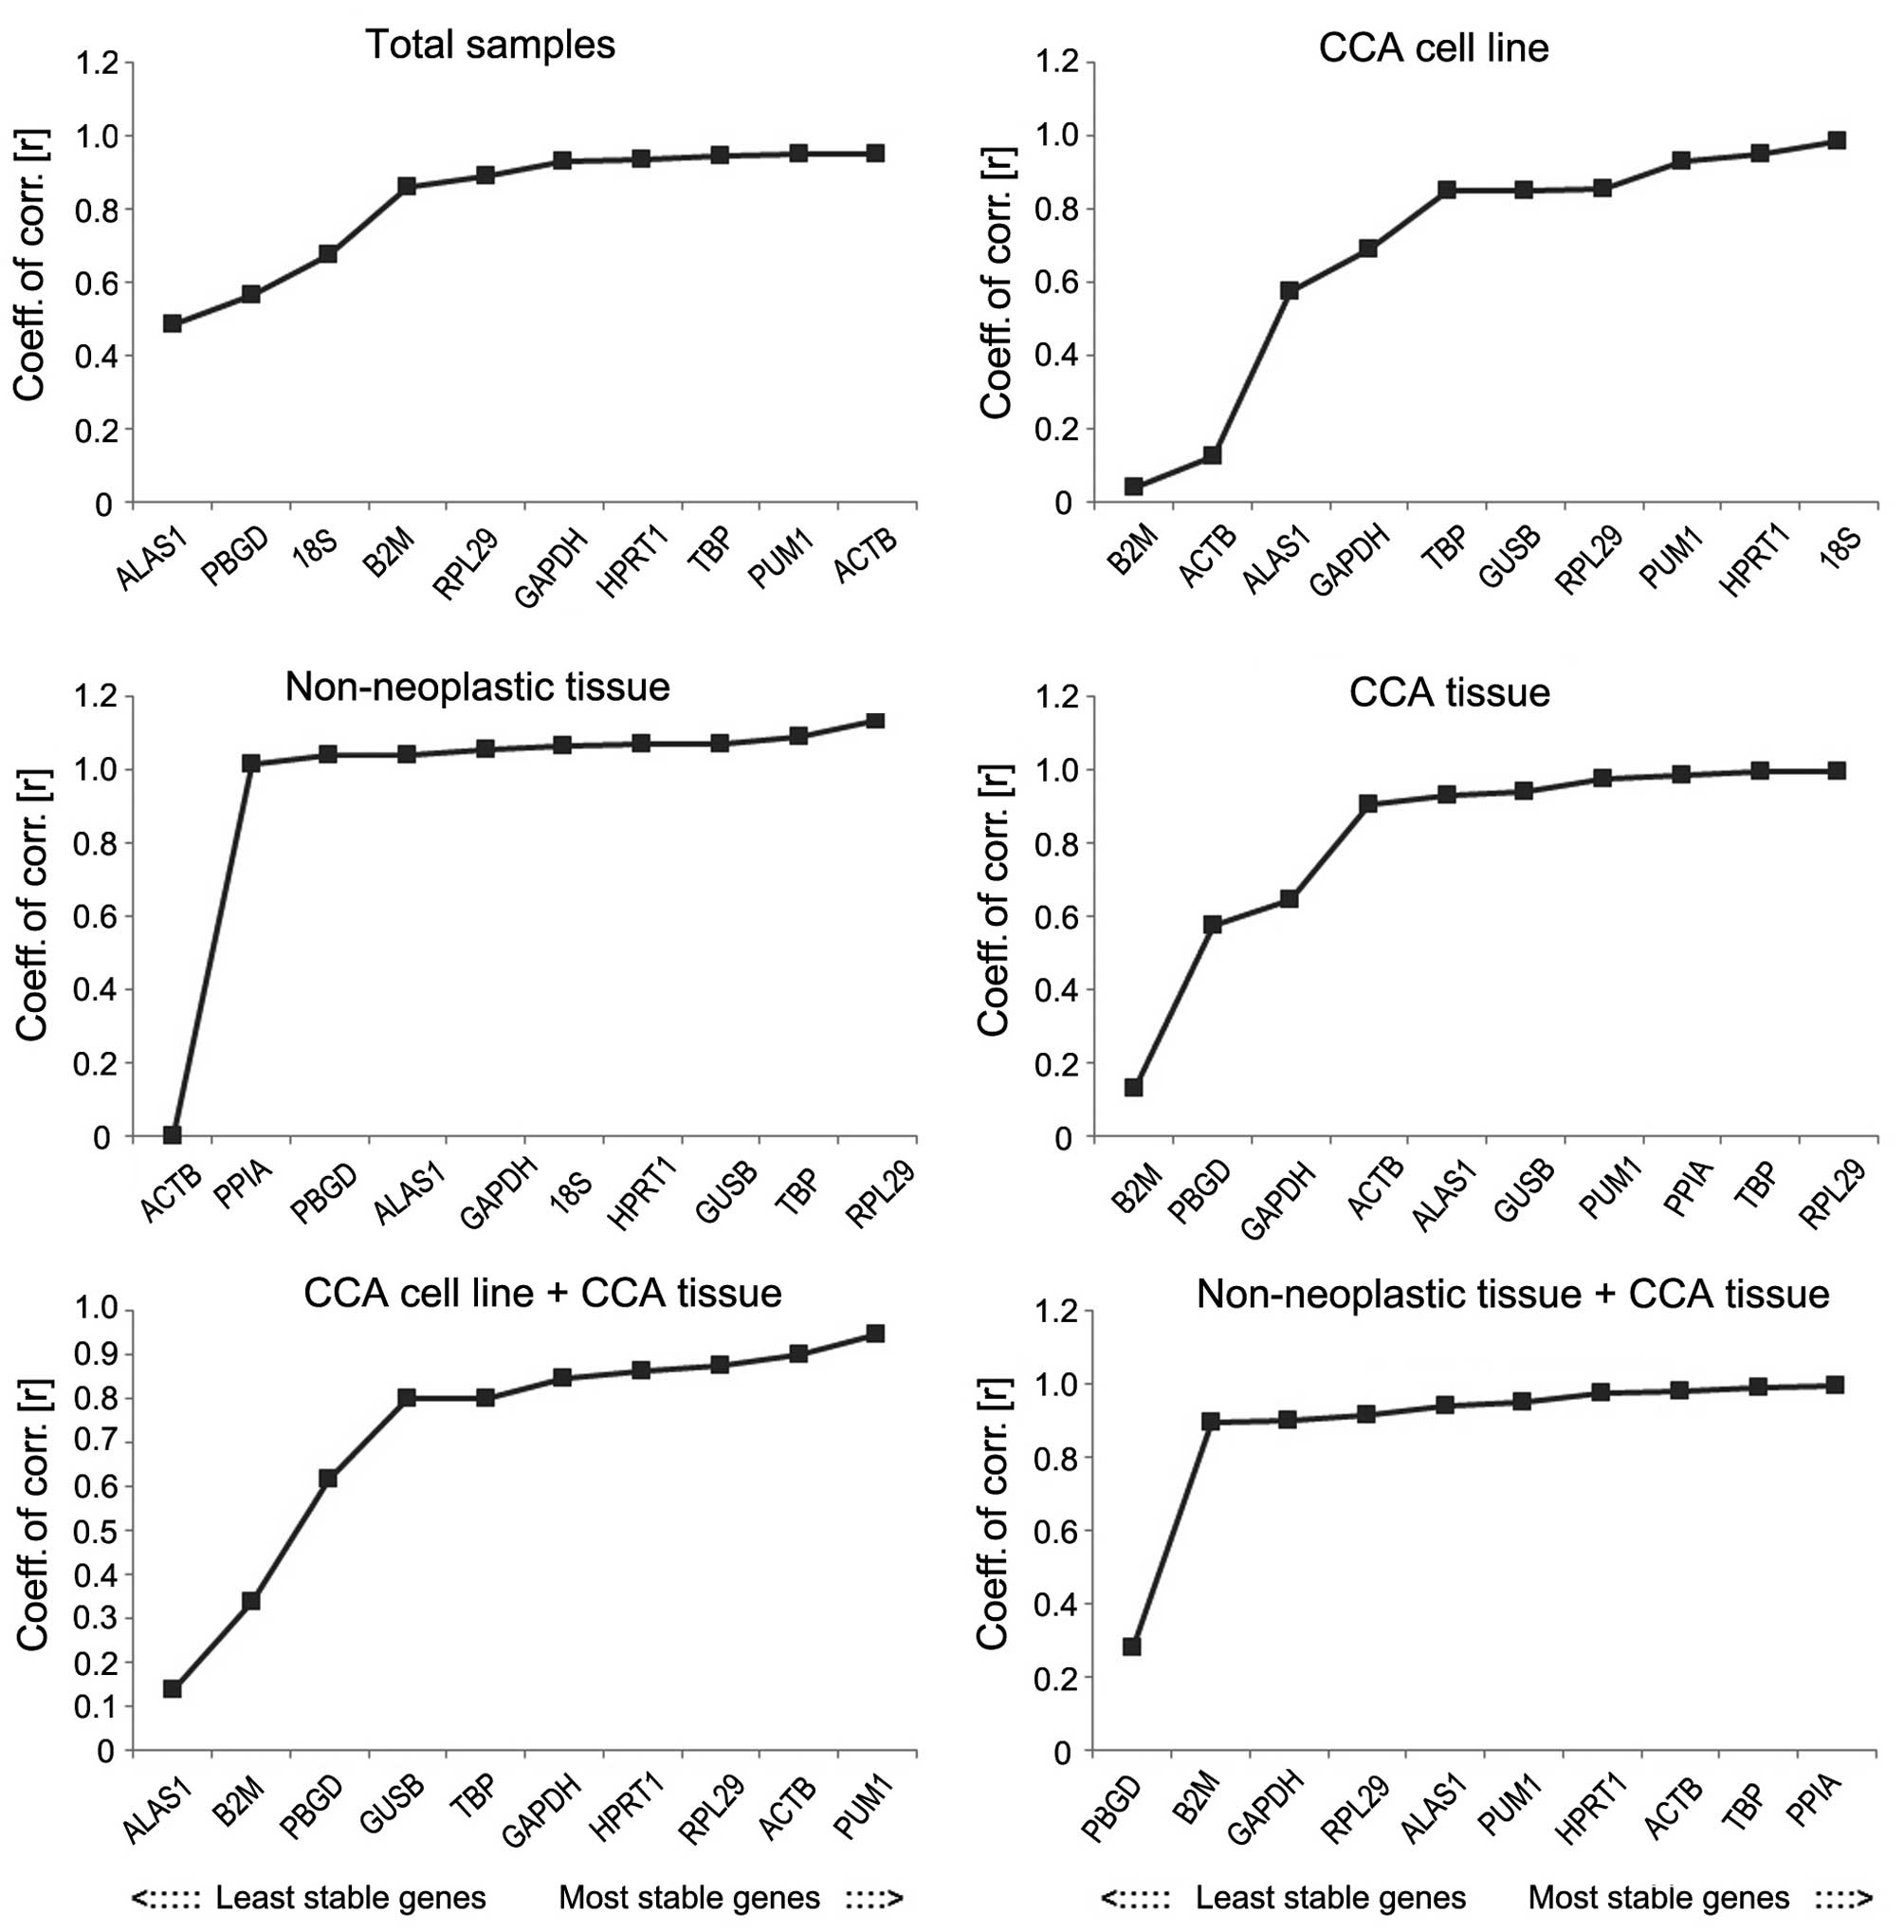
BestKeeper also identified the most stably expressed
genes by comparing the r-value and the SD as shown in Figs. 5 and 6.
The number of candidate reference genes that could be analyzed by
this software was limited (14);
therefore, only 10 candidate reference genes were analyzed for each
group, based on the result of GeNorm. The analysis demonstrated
that the SD value in the total samples group was >1, which does
not necessarily indicate that the 10 candidate internal reference
genes are all unstable, as results from a single software program
is not sufficient to confirm this. According to the r-value, the
most stable internal reference gene in the total samples group was
ACTB. In the CCA cell line group, the most stable reference gene
was 18SrRNA, followed by PUM1. In the CCA cell line and tissue
group, ACTB was the most stable reference gene followed by B2M. In
the adjacent non-neoplastic group, RPL29 was the most stable gene,
followed by TBP. In CCA tissue and adjacent non-neoplastic tissue
group, ALAS1 was the most stable reference gene, followed by PBGD.
In CCA tissue group, the most stable reference gene was TBP,
followed by ALAS1.
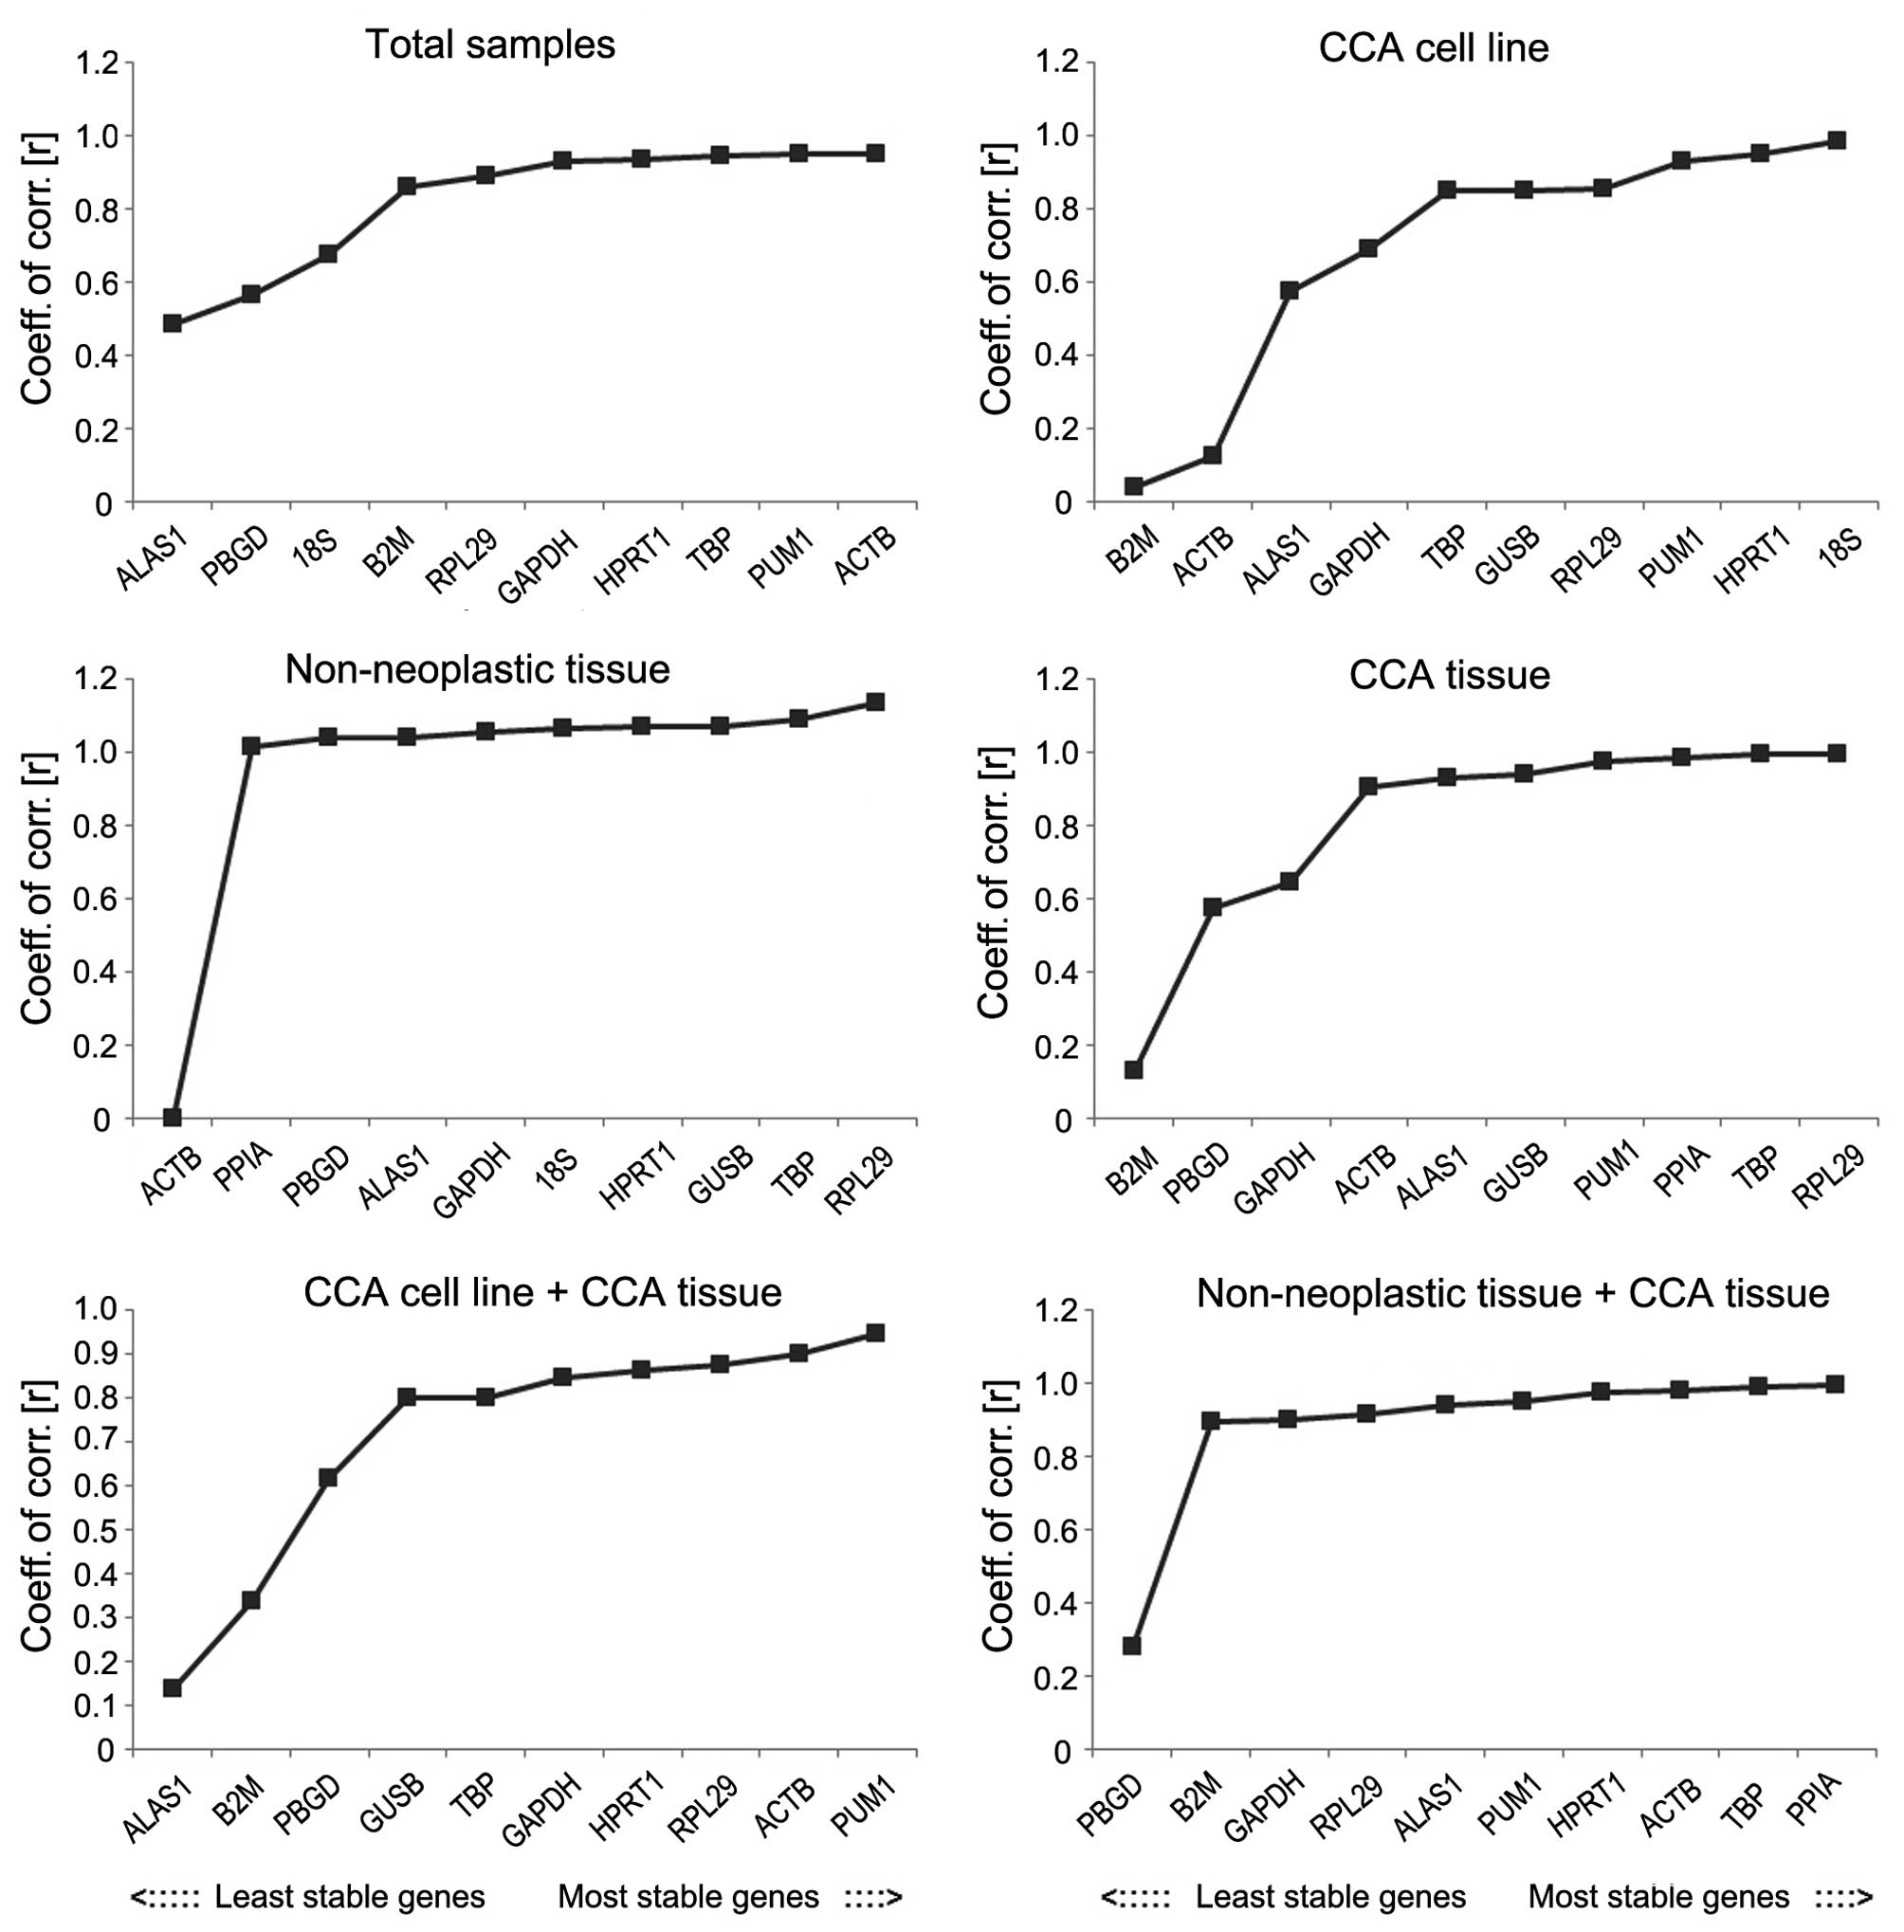 | Figure 5.Stability values of the candidate
reference genes evaluated using BestKeeper in various groups, which
shows the r-values of the candidate reference genes; the higher the
r-value, the more stability the reference gene possesses. CCA,
cholangiocarcinoma; r-value, coefficient of correlation; GAPDH,
glyceraldehyde 3-phosphate dehydrogenase; ACTB, actin-β; PPIA,
peptidylprolyl isomerase A; B2M, β-2-microglobulin; 18S, 18S
ribosomal RNA; HPRT1, hypoxanthine phosphoribosyltransferase 1;
ALAS1, 5′-aminolevulinate synthase 1; GUSB, glucuronidase-β; TBP,
TATA-box binding protein; PUM1, pumilio RNA binding family member
1; RPL29, ribosomal protein L29; PBGD, porphobilinogen
deaminase. |
 | Figure 6.Stability values of the candidate
reference genes evaluated using BestKeeper in various groups, which
shows standard deviation values of the candidate reference genes.
CCA, cholangiocarcinoma; GAPDH, glyceraldehyde 3-phosphate
dehydrogenase; ACTB, actin-β; PPIA, peptidylprolyl isomerase A;
B2M, β-2-microglobulin; 18S, 18S ribosomal RNA; HPRT1, hypoxanthine
phosphoribosyltransferase 1; ALAS1, 5′-aminolevulinate synthase 1;
GUSB, glucuronidase-β; TBP, TATA-box binding protein; PUM1, pumilio
RNA binding family member 1; RPL29, ribosomal protein L29; PBGD,
porphobilinogen deaminase. |
Relative KRAS expression
The analysis of a target gene's relative expression
is affected by the selection of reference genes (7). As shown in Fig. 7, when TBP, GAPDH, ACTB and ALAS1,
which are recommended by the present study, were used as reference
genes for KRAS (a target gene), there was no significant difference
in the expression of the KRAS gene. The level of expression of KRAS
in CCA tissue did not vary when these samples were normalized using
TBP (P=0.161), GAPDH (P=0.156), ACTB (P=0.128) or ALAS1 (P=0.157).
However, when glucuronidase-β (GUSB; P=0.004) was selected as the
reference gene for normalization, the relative expression of KRAS
in CCA tissue was clearly different, compared to the other
candidate reference genes.
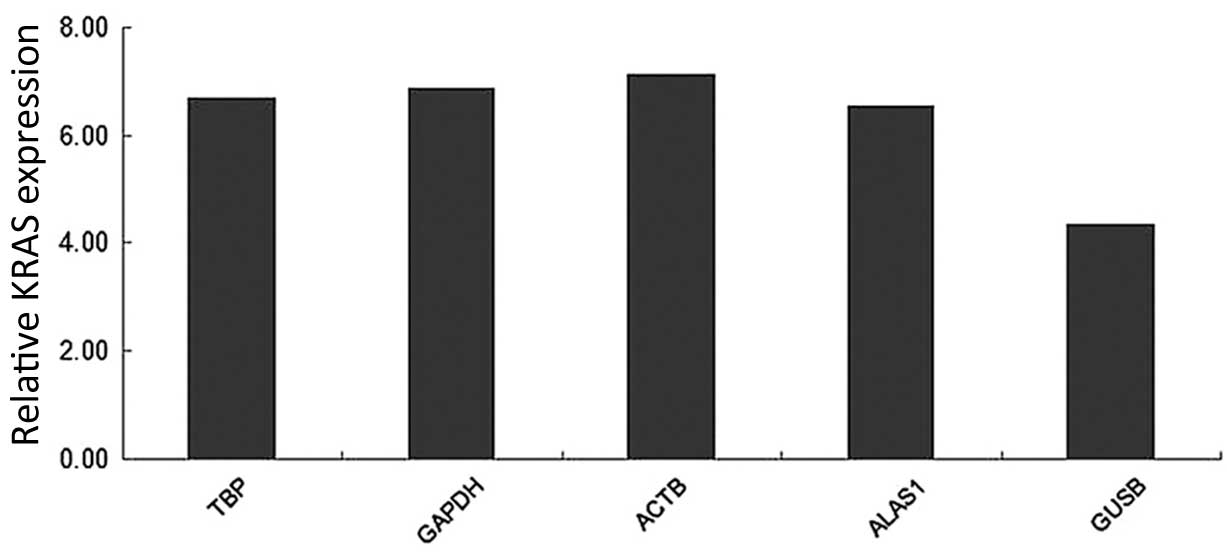 | Figure 7.Relative quantification of KRAS, as
normalized by TBP, GAPDH, ACTB, ALAS1 and GUSB in 20 matched pairs
of adjacent non-neoplastic and cholangiocarcinoma tissues. KRAS,
Kirsten rat sarcoma viral oncogene homolog; TBP, TATA-box binding
protein; GAPDH, glyceraldehyde 3-phosphate dehydrogenase; ACTB,
actin-β; ALAS1, 5′-aminolevulinate synthase 1; GUSB,
glucuronidase-β. |
Discussion
Since RT-qPCR is fast, has a high sensitivity and
provides quantifiable data, it is commonly used for the analysis of
gene expression (17). However,
during the RT-qPCR process, the difference in quality and quantity
of RNA and synthetic efficiency of cDNA and PCR amplification may
lead to significant deviations of the results. Therefore, during
the detection of target gene expression, a gene with a stable
expression is required as a reference. Recent studies have revealed
defects in all commonly used reference genes, which often vary
greatly in expression quantity in various types of cells and
tissues, stages of cell amplification and organ development and
in vitro culture and experimental conditions (9,10,20–22). To
the best of our knowledge, there have been no systematic
comparisons performed concerning the stability of commonly-used
reference genes in CCA tissues and cell lines. Early diagnosis of
CCA is challenging, and it is problematic to achieve a satisfactory
therapeutic effect in patients (2,3). In
addition, evaluating the prognosis of patients with CCA is
inaccurate. Therefore, with the development of CCA-associated
studies using gene profiling, it is essential to determine stable
and reliable reference genes.
In order to acquire accurate experimental data and
reliable conclusions, the present study was designed with following
features: Matching of malignant and non-malignant specimens from
the same patient was adopted so as to reduce individual
differences; the specimens were not collected according to the
grade and stage of tumors, and as previous studies indicate, the
expression of a reference gene is not directly associated with the
grade and stage of malignant tumors (21); the selected samples were all
characterized as malignant tissue samples by the pathology
department of the China-Japan Union Hospital of Jilin University,
and the pathology observed in the samples indicated the most common
pathological type of CCA, adenocarcinoma; the QBC939 cell line was
also used as it is a commonly used human CCA cell line; the
stability evaluation on reference genes for the selected
histological samples and cell lines of human CCA was implemented to
make the experimental results more comprehensive, compared with
previous studies (9,10,21,22) where
the stability evaluation on reference genes was restricted on
ceratin tissues or cell lines; and the stability of 12 common
reference genes was compared.
The present study utilized GeNorm to analyze the
reference genes. This software is based on a pairwise-comparison
statistical model. By calculating the M- and V-values, the present
study determined the two most stable reference genes and the best
reference gene combination for various tissue groups and the CCA
cell line. By calculating the value of V, the optimal reference
genes combination number for each group was greater than six.
Therefore, considering a previous study (8), the present study recommends three
internal genes as the most appropriate. NormFinder, which uses
analysis of variance as the statistical model, demonstrated similar
results to those observed with GeNorm. Finally, in order to reduce
the one-sidedness of GeNorm and NormFinder, the present study also
used BestKeeper for analysis. However, the analysis results of
BestKeeper are different to those observed with GeNorm and
NormFinder. Previous studies hypothesize that this may be due to
differences in the statistical model that BestKeeper uses;
therefore, it is less effective for ranking reference gene
stability compared with GeNorm and NormFinder (20–22). Based
on comparisons of results among the three programs, the present
study recommends the following most stable reference genes, which
have been confirmed through analysis by ≥2 programs: Total samples
group, RPL29; CCA tissue group, TBP; CCA cell line and CCA tissue
group, ACTB; CCA cell line group, 18SrRNA; CCA tissue and adjacent
non-neoplastic tissue group, ALAS1; and adjacent non-neoplastic
tissue group, HPRT1.
The observation that KRAS gene expression depended
on the normalization method used illustrates the significance of
reference genes for obtaining dependable expression data. If RAS
genes mutate, the encoded P21 protein conformation may alter,
leading to excessive cell proliferation and eventually causing the
development of cancer (23). The RAS
gene most associated with CCA is KRAS (23), followed by NRAS. The present study
selected the most stable reference genes recommended by GeNorm,
NormFinder and BestKeeper, and also GUSB, which has poor stability,
as the standard for relative quantification analysis (8). The results indicated that the relative
expression quantities of KRAS varied significantly, illustrating
that a suitable reference gene is essential for gene profiling of
CCA. Similar erroneous normalizations have been observed in other
tissue types, including gastric cancer, when inadequate control
genes or normalizing strategies are performed (24).
In conclusion, the present study recommends the most
suitable reference genes and reference gene combinations for human
CCA tissue and cell lines to aid in performing gene expression
profile analysis. A reliable normalization strategy in such studies
may contribute to an improved understanding of the biology of these
rare tumors. Elucidation of the molecular expression signatures may
lead to more accurate diagnostics as well as identification of
prognostic factors and, ultimately, targets for future therapeutics
for patients with CCA.
Acknowledgements
The present study was supported by the Key
Foundation of Jilin Provincial Science and Technology Department
(grant nos., 20130727038YY and 20100942; Changchun, China) and
Jilin Provincial Development and Reform Commission (grant no.,
20101928; Changchun, China).
References
|
1
|
Lazaridis KN and Gores GJ:
Cholangiocarcinoma. Gastroenterology. 128:1655–1667. 2005.
View Article : Google Scholar : PubMed/NCBI
|
|
2
|
Friman S: Cholangiocarcinoma - current
treatment options. Scand J Surg. 100:30–34. 2011.PubMed/NCBI
|
|
3
|
Cardinale V, Semeraro R, Torrice A, Gatto
M, Napoli C, Bragazzi MC, Gentile R and Alvaro D: Intra-hepatic and
extra-hepatic cholangiocarcinoma: New insight into epidemiology and
risk factors. World J Gastrointest Oncol. 2:407–416. 2010.
View Article : Google Scholar : PubMed/NCBI
|
|
4
|
Brown KM: Multidisciplinary approach to
tumors of the pancreas and biliary tree. Surg Clin North Am.
89:115–131. 2009. View Article : Google Scholar : PubMed/NCBI
|
|
5
|
Bustin SA: Absolute quantification of mRNA
using real-time reverse transcription polymerase chain reaction
assays. J Mol Endocrinol. 25:169–193. 2000. View Article : Google Scholar : PubMed/NCBI
|
|
6
|
Bustin SA, Benes V, Nolan T and Pfaffl MW:
Quantitative real-time RT-PCR-a perspective. J Mol Endocrinol.
34:597–601. 2005. View Article : Google Scholar : PubMed/NCBI
|
|
7
|
Derveaux S, Vandesompele J and Hellemans
J: How to do successful gene expression analysis using real-time
PCR. Methods. 50:227–230. 2010. View Article : Google Scholar : PubMed/NCBI
|
|
8
|
Vandesompele J, De Preter K, Pattyn F,
Poppe B, Van Roy N, De Paepe A and Speleman F: Accurate
normalization of real-time quantitative RT-PCR data by geometric
averaging of multiple internal control genes. Genome Biol.
3:RESEARCH00342002. View Article : Google Scholar : PubMed/NCBI
|
|
9
|
de Jonge HJ, Fehrmann RS, de Bont ES,
Hofstra RM, Gerbens F, Kamps WA, de Vries EG, van der Zee AG, te
Meerman GJ and ter Elst A: Evidence based selection of housekeeping
genes. PLoS One. 2:e8982007. View Article : Google Scholar : PubMed/NCBI
|
|
10
|
Ho-Pun-Cheung A, Bascoul-Mollevi C,
Assenat E, Bibeau F, Boissière-Michot F, Cellier D, Ychou M and
Lopez-Crapez E: Validation of an appropriate reference gene for
normalization of reverse transcription-quantitative polymerase
chain reaction data from rectal cancer biopsies. Anal Biochem.
388:348–350. 2009. View Article : Google Scholar : PubMed/NCBI
|
|
11
|
Bustin SA and Mueller R: Real-time reverse
transcription PCR (qRT-PCR) and its potential use in clinical
diagnosis. Clin Sci (Lond). 109:365–379. 2005. View Article : Google Scholar : PubMed/NCBI
|
|
12
|
Hruz T, Wyss M, Docquier M, Pfaffl MW,
Masanetz S, Borghi L, Verbrugghe P, Kalaydjieva L, Bleuler S, Laule
O, et al: RefGenes: Identification of reliable and condition
specific reference genes for RT-qPCR data normalization. BMC
Genomics. 12:1562011. View Article : Google Scholar : PubMed/NCBI
|
|
13
|
Kimmitt PT, Tabrizi SN, Crosatti M,
Garland SM, Schober PC, Rajakumar K and Chapman CA: Pilot study of
the utility and acceptability of tampon sampling for the diagnosis
of Neisseria gonorrhoeae and Chlamydia trachomatis infections by
duplex realtime polymerase chain reaction in United Kingdom sex
workers. Int J STD AIDS. 21:279–282. 2010. View Article : Google Scholar : PubMed/NCBI
|
|
14
|
Pfaffl MW, Tichopad A, Prgomet C and
Neuvians TP: Determination of stable housekeeping genes,
differentially regulated target genes and sample integrity:
BestKeeper-Excel-based tool using pair-wise correlations.
Biotechnol Lett. 26:509–515. 2004. View Article : Google Scholar : PubMed/NCBI
|
|
15
|
Tannapfel A, Benicke M, Katalinic A,
Uhlmann D, Köckerling F, Hauss J and Wittekind C: Frequency of
p16(INK4A) alterations and K-ras mutations in intrahepatic
cholangiocarcinoma of the liver. Gut. 47:721–727. 2000. View Article : Google Scholar : PubMed/NCBI
|
|
16
|
Edge SB and Compton CC: The American Joint
Committee on Cancer: The 7th edition of the AJCC cancer staging
manual and the future of TNM. Ann Surg Oncol. 17:1471–1474. 2010.
View Article : Google Scholar : PubMed/NCBI
|
|
17
|
Livak KJ and Schmittgen TD: Analysis of
relative gene expression data using real-time quantitative PCR and
the 2(−Delta Delta C(T)) Method. Methods. 25:402–408. 2001.
View Article : Google Scholar : PubMed/NCBI
|
|
18
|
Ginzinger DG: Gene quantification using
real-time quantitative PCR: An emerging technology hits the
mainstream. Exp Hematol. 30:503–512. 2002. View Article : Google Scholar : PubMed/NCBI
|
|
19
|
Livak KJ and Schmittgen TD: Analysis of
relative gene expression data using real-time quantitative PCR and
the 2(−Delta Delta C(T)) Method. Methods. 25:402–408. 2001.
View Article : Google Scholar : PubMed/NCBI
|
|
20
|
Wan H, Zhao Z, Qian C, Sui Y, Malik AA and
Chen J: Selection of appropriate reference genes for gene
expression studies by quantitative real-time polymerase chain
reaction in cucumber. Anal Biochem. 399:257–261. 2010. View Article : Google Scholar : PubMed/NCBI
|
|
21
|
Ohl F, Jung M, Xu C, Stephan C, Rabien A,
Burkhardt M, Nitsche A, Kristiansen G, Loening SA, Radonić A and
Jung K: Gene expression studies in prostate cancer tissue: Which
reference gene should be selected for normalization? J Mol Med
(Berl). 83:1014–1024. 2005. View Article : Google Scholar : PubMed/NCBI
|
|
22
|
Liu S, Zhu P, Zhang L, Ding S, Zheng S,
Wang Y and Lu F: Selection of reference genes for RT-qPCR analysis
in tumor tissues from male hepatocellular carcinoma patients with
hepatitis B infection and cirrhosis. Cancer Biomark. 13:345–349.
2013.PubMed/NCBI
|
|
23
|
Isa T, Tomita S, Nakachi A, Miyazato H,
Shimoji H, Kusano T, Muto Y and Furukawa M: Analysis of
microsatellite instability, K-ras gene mutation and p53 protein
overexpression in intrahepatic cholangiocarcinoma.
Hepatogastroenterology. 49:604–608. 2002.PubMed/NCBI
|
|
24
|
Kumar V, Sharma R, Trivedi PC, Vyas GK and
Khandelwal V: Traditional and novel references towards systematic
normalization of qRT-PCR data in plants. Australian J Crop Sci.
5:1455–1468. 2011.
|


