Introduction
Nasopharyngeal carcinoma (NPC) is a malignant
neoplasm and retains a high incidence in Southeast Asia and
Southern China (1). An accurate
tumor-node-metastasis (TNM) staging system is important for
estimating the prognosis of malignant carcinoma, constructing
treatment plans, and for predicting the 5-year overall survival
rate (OS) of NPC (2). The 5-year OS
rates of stage I, II, III, and IV NPC are 94, 87, 77 and 65%,
respectively (3). It can be difficult
to make an early diagnosis of this lesion due to the anatomical
position of NPC. At present, the protocols used for NPC staging
include flexible fiberoptic nasopharyngoscopy pathological biopsy,
blood EB-DNA test, computed tomography (CT) of the chest, magnetic
resonance imaging (MRI) of the nasopharynx and neck, bone emission
computed tomography (ECT) and position emission tomography. These
diagnostic processes are invasive, inconvenient, and
time-consuming. Therefore, an improved diagnostic method for NPC is
required, that can overcome the above disadvantages.
Raman spectroscopy (RS) makes use of the inelastic
scattering of light, and provides a spectrographic signature of the
structure and conformation of specific molecular species, such as
proteins, nucleic acids and lipids (4). At present, the application of RS is used
extensively to identify cancer by analyzing excised tissue, blood
plasma, saliva, urine, and seminal fluid (5–9). Tissue
samples obtained timely and even continually during treatment of
previously diagnosed patients, are the ideal material for
confirming a precise diagnosis (10).
Hitherto, RS has been widely utilized to verify diagnoses using
excised samples of cancer tissues, such as esophageal cancer, lung
cancer, and gastric cancer (11–13).
Furthermore, Raman spectroscopy endoscopic analysis of tissues
in vivo has demonstrated the potential for detecting cancers
such as laryngeal cancer, esophageal cancer, lung cancer,
colorectal cancer and bladder cancer (14–18). Thus,
RS endoscopy may constitute an ideal technology for the diagnosis
of a number of cancer types in the near future.
We have previously studied the applications of RS in
nasopharyngeal cancer tissues using excised nasopharyngeal tissue
samples. These have been limited to in vitro experiments,
and were conducted to establish preliminary data prior to
performing integrated RS combined with white-light reflectance
endoscope imaging (19,20). To the best of our knowledge, no other
previous studies have examined RS using NPC samples. We were able
to previously differentiate noncancerous and cancerous
nasopharyngeal tissues by using micro RS, which yielded a
diagnostic sensitivity of 92% and a specificity of 82%. These were
performed using the principal components analysis and linear
discriminant analysis (PCA-LDA) diagnostic algorithms (21). This encouraging preliminary result
motivated us to conduct a more systematic study, by classifying the
differentiation stages of the samples based on the TNM staging
system of early (I–II) and advanced (III–IV) nasopharyngeal
tissues.
The aim of the present study is to discriminate the
spectral differences between tissues of early stage and advanced
stage NPC, and to assess the non-invasive diagnosis of NPC at
different stages using RS method. The current study employs
multivariate statistical methods such as (PCA-LDA), to generate
multi-class diagnostic algorithms for classifying Raman spectra of
different stage nasopharyngeal tissue types.
Materials and methods
Subjects
Two groups of tissue samples were examined in this
study: One group of 30 NPC patients at early stages (I–II), and a
second group of 46 NPC patients with advanced stages (III–IV). The
patients had been previously treated at the Fujian Provincial
Cancer Hospital, were of similar ethnic and socioeconomic
backgrounds and had been diagnosed with NPC by histopathology. The
tissue samples were obtained from each patient by nasopharyngeal
endoscopy and cut into pathological sections (3–10 µm thick), which
were stained using hematoxylin and eosin (HE), and confirmed by
pathologists. If the pathological sections were unclear using HE,
immunohistochemical staining for cytokeratin 5/6 and Epstein-Barr
virus-encoded RNA was used for additional verification. Each
patient was diagnosed by at least two pathologists. The staging
classification used was the Chinese 2008 staging system for NPC
(21). Ethical approval and informed
consent from all patients were obtained for the present study. The
tissue samples were stored in a −80°C freezer and were defrosted at
room temperature prior to experimental RS measurements being
taken.
RS measurements
Tissue samples were fixed onto a sheer aluminum
plate, and all RS measurements were recorded from 800–1750
cm−1, with an integration time of 30s, using an inVia
micro-Raman system (Renishaw PLC, Wotton-under-Edge, UK) with a 50x
objective. The tissue samples were excited using a 785 nm diode
laser with a maximum power output of 30 mW.
Data Processing
All raw RS data were processed to fit the broad
autofluorescence background using a fifth-order polynomial fitting
method, based on that described in our previous study (22). This polynomial, essentially
representing the autofluorescence, was subtracted from the raw
spectrum to acquire the Raman spectrum of the tissue sample. Each
RS was then normalized to the integrated area under the curve for
making comparisons of spectral shapes and correcting variations in
spectral intensity. Additionally, multivariate statistical analysis
was performed on the pre-processed Raman data using the SPSS
software package (version 15.0; SPSS Inc., Chicago, IL, USA).
Multivariate statistical analysis
Efficient diagnostic algorithms for differentiating
RS spectra between the early and advanced stages of NPC patients
were applied using PCA and LDA, as described in our previous study
(23). Briefly, to decrease the
dimensions of the spectral data, PCA is used to extract a set of
orthogonal principal components (PCs) that interpret the maximum
difference in the dataset, for further diagnosis and
characterization. The most diagnostically valuable PCs (P<0.05)
were determined by the independent-sample t-test, which were then
input for the development of LDA for tissue discrimination. The
performance of the diagnostic algorithms, rendered using the
PCA–LDA models for precisely forecasting the tissue groups (e.g.,
normal vs. cancer) was evaluated in an unbiased manner using the
leave-one subject-out, cross-validation method on all model
spectra. In this way, one sample (i.e., one spectrum) was excluded
from the dataset, and the algorithm based on PCA-LDA was
redeveloped using the remaining tissue spectra. To compare the
performance of the PCA-LDA model for the different NPC stage
classification using the Raman spectroscopic data set, receiver
operating characteristic (ROC) curves were generated by
successively varying the thresholds to determine discrimination
sensitivity and specificity for all samples.
Results
Ramen spectra of early and advanced
stage NPC
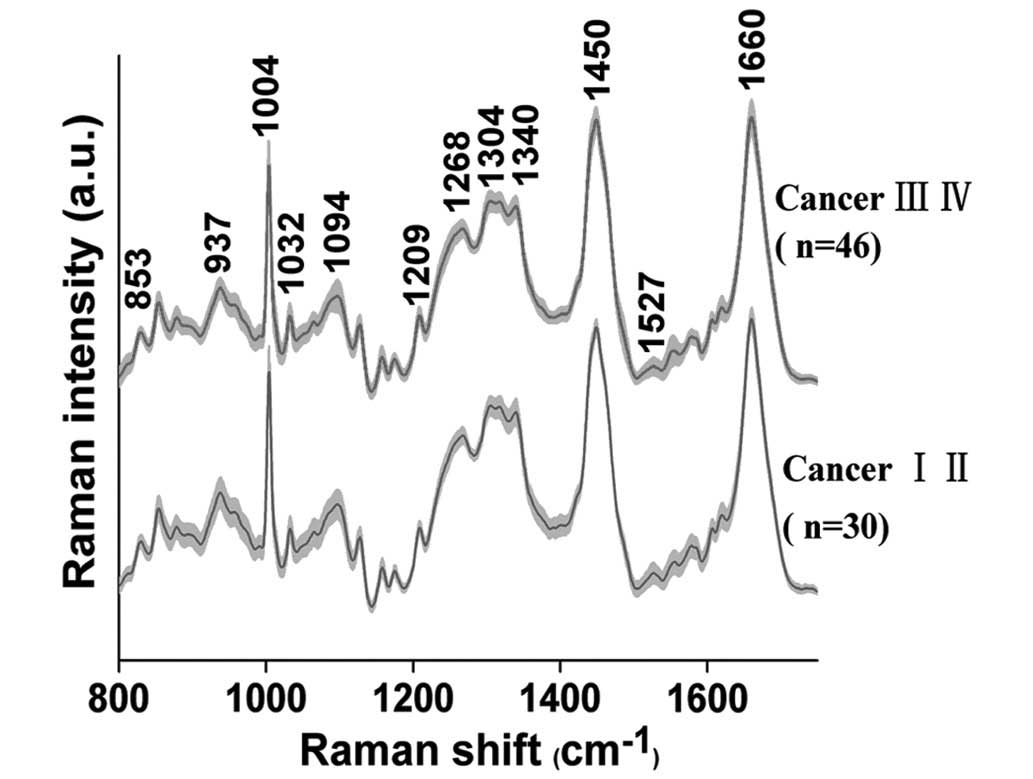
The average RS, obtained from 76 NPC patients (early
stage, n=30 and advanced stage, n=46), are presented in Fig. 1. In both groups of tissue samples,
characteristic bands are observed at 853, 937, 1004, 1032, 1094,
1209, 1268, 1304, 1340, 1450, 1527 and 1660 cm−1.
Spectral differences between early and
advances stage NPC
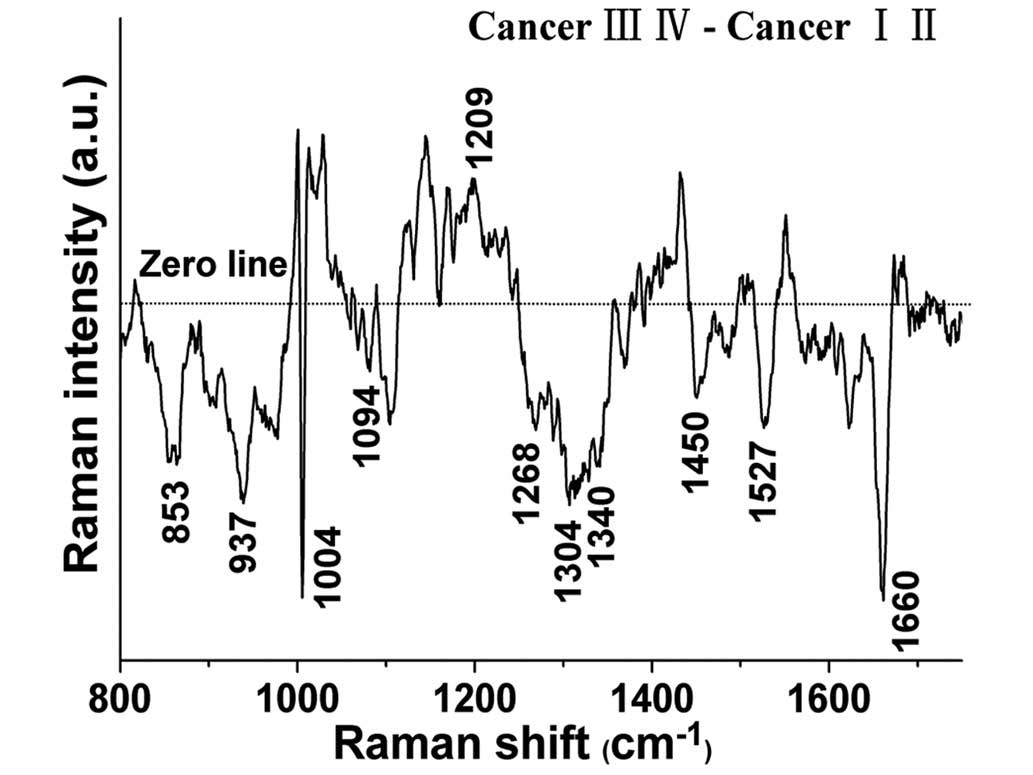
The spectral differences between the early and the
advanced tissue samples were examined (Fig. 2), and the results indicate that RS
possesses diagnostic potential for identifying different stages of
differentiation in NPC. The significantly different bands
(P<0.05) are shown at 853, 937, 1004, 1032, 1094, 1209, 1268,
1304, 1340, 1450, 1527 and 1660 cm−1. In particular, the
band intensities located at 1032 and 1209cm−1 were
significantly higher in the advanced tissues than those in the
early tissues (P<0.05), while the band intensities located at
853, 937, 1004, 1094, 1268, 1304, 1340, 1450, 1527 and 1660
cm−1 were significantly lower (P<0.05) in the
advanced tissues. These intensity differences suggest that in
different stage NPC tissue, there are significant increases and
decreases of specific biomolecules that leave an RS signature, and
are correlated with the total Raman-active components.
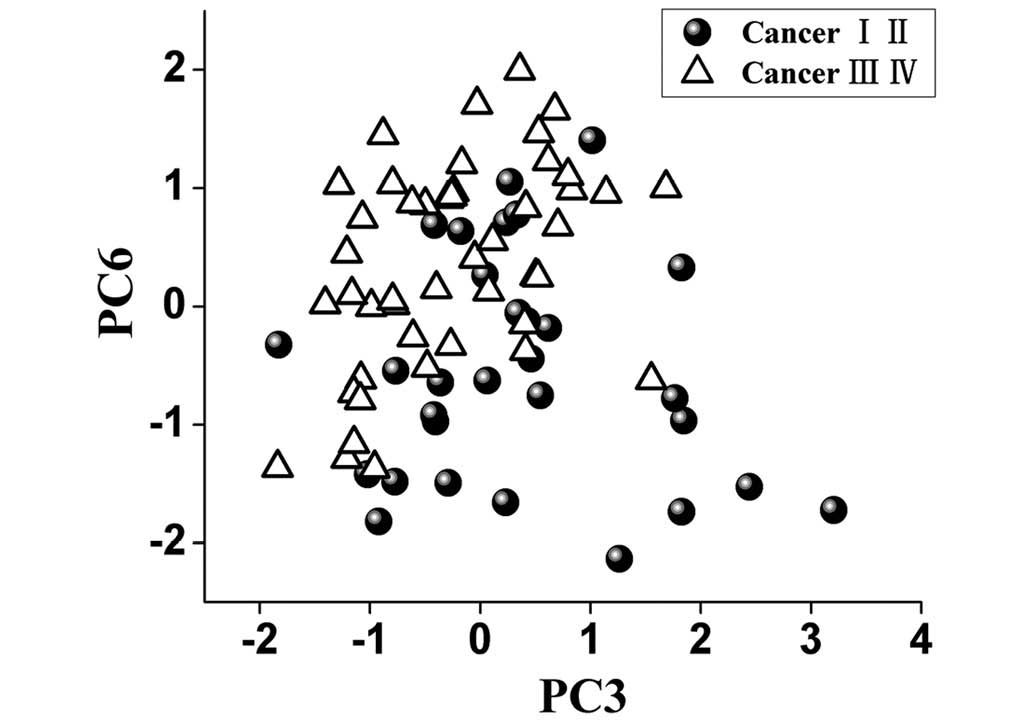
Multivariate analysis
To identify the most significant Raman features for
tissue analysis and identification, the multivariate statistical
technique PCA-LDA accompanied with independent-sample t-test was
carried out, and revealed that only two PCs (PC3 and PC6,
P<0.05) were diagnostically significant (Fig. 3).
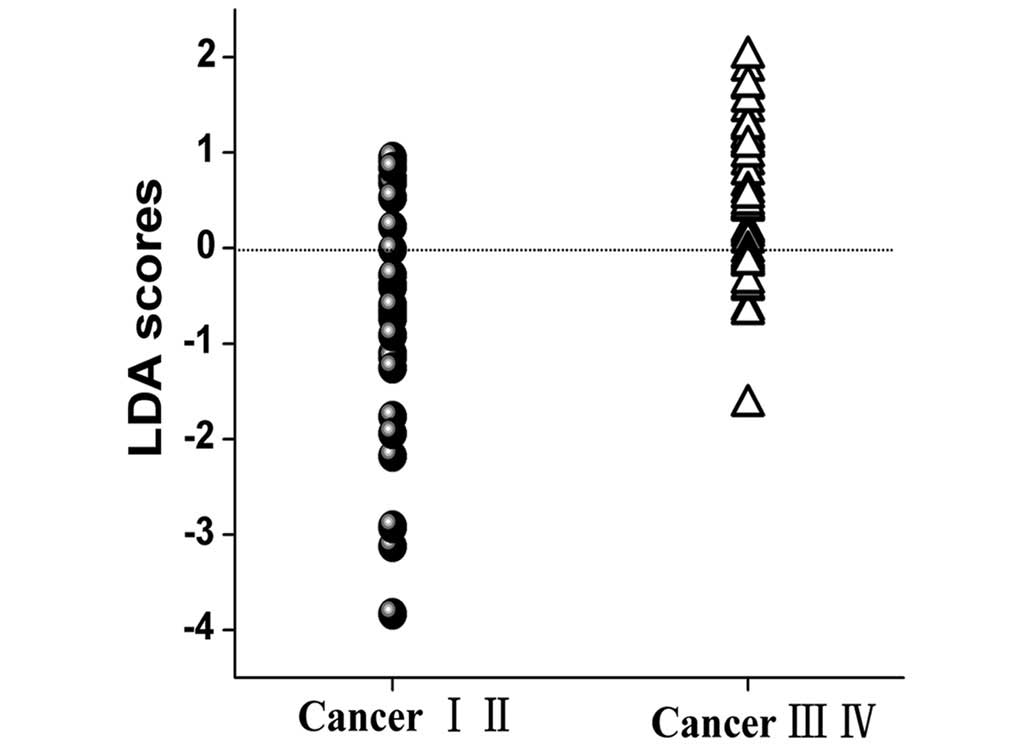
PCA-LDA analysis
To classify different stages of NPC tissue, the two
diagnostically significant PCs were fed into the LDA model,
associated with the leave-one subject-out, cross-validation
technique. PCA–LDA algorithms based on the tissue Raman data
calculated a diagnostic sensitivity of 70% (21/30) and specificity
of 78% (36/46) for discriminating between the early and the
advanced NPC tissues (Fig. 4).
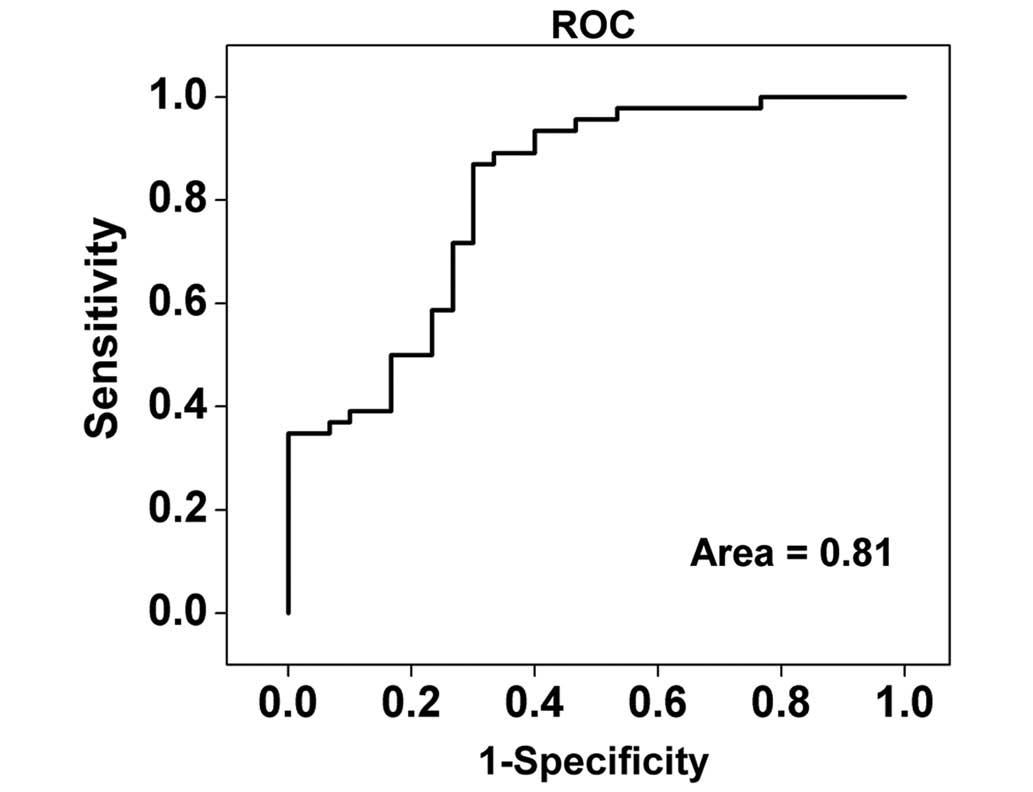
ROC curve analysis
For further evaluation of the efficacy of the
PCA–LDA diagnostic algorithm for different stage NPC tissue
diagnosis, receiver operating characteristic (ROC) curves (Fig. 5) were constructed from the scatter
plots in Fig. 4. The area under the
ROC curve was 0.81, indicating that use of the PCA-LDA diagnostic
algorithm based on Raman spectroscopy is viable for clinical
diagnosis at the molecular level in the different stages of NPC.
The predictive accuracy 75% (57/76) [sensitivity of 70% (21/30) and
specificity of 78% (36/46)] could be determined for the independent
validation dataset, proving the efficacy of the PCA-LDA algorithms
based on Raman spectroscopy diagnosis of early and advanced stage
in NPC patients.
Discussion
Raman spectroscopy is a non-invasive technique that
can be used to detect NPC based on the quantitative information it
provides about the specific biochemical differences between early
and advanced staged tissues in terms of their unique proteins, DNA,
and lipids. In the present study a diagnostic sensitivity of 70%
(21/30) and specificity of 78% (36/46) was obtained for different
stage cancer identification on the basis of the PCA-LDA algorithms,
while a predictive accuracy of 75% (57/76) was demonstrated,
indicating that RS combined with the PCA-LDA algorithms is a
potential technique for distinguishing the early and the advanced
stage nasopharyngeal carcinoma tissues.
Lin et al (20)
previously reported good classification based on blood plasma
surface-enhanced Raman spectroscopy (SERS) technique among early T
(T1 stage) NPC, advanced T (T2-T4 stage) NPC and healthy blood.
Furthermore, the authors reported a diagnostic sensitivity,
specificity, and accuracy of 64, 63 and 63%, respectively, for the
classification of T1 stage and T2-T4 stages NPC. An important
difference between the present study and that of Lin et al
is that our study verifies the NPC stages. Additionally, our
results are based on the TNM classification, which is currently the
most common, accurate and appropriate method available for NPC
staging (21), whereas Lin et
al performed their study exclusively on the basis of the T
classification. Therefore, the present study proposes that TNM
classification may be more appropriate than any other
classification in the assessment of NPC staging and the detection
of different stages NPC.
RS has been used recently for cancer detection,
based on the quantitative information provided about the specific
biochemical differences between the noncancerous and cancerous
blood plasma or tissue samples, particularly in terms of unique
proteins, DNA, and lipids (10,20,22).
Typical and tentative assignments for the observed Raman bands may
provide a better understanding of the molecular basis of the
diagnosis, as shown in Table I.
Characteristic spectral features and relative intensity
differences, which can be considered as molecular and cellular
changes accompanied by malignant transformation in a different
stages of NPC were observed between the early and advanced NPC
tissue groups. For example, the Raman peak intensity at 1004
cm−1, due to the νs(C-C) breathing of phenylalanine
exhibited lower signal levels for the advanced stage tissues when
compared to the spectrum of the early stage tissues. A decrease in
RS signal at 1004 cm−1 was also observed in our previous
study, when comparing cancerous and noncancerous samples,
indicating a decrease in the percentage of phenylalanine relative
to the total RS-active constituents in cancer tissues (10). This indicates that changes in
protein-related RS peaks at 1004 cm−1that are generally
associated with differential stage development likely reflect
special changes of protein content and conformation. Furthermore,
the Raman peak at 1004 cm−1, which can reflect the
changes of phenylalanine in tissue, cell, blood and other tissue
samples, has been demonstrated previously to be a prominent and
stable RS signal (9,10,23).
Recently, we have conducted SERS studies of blood plasma samples
from healthy volunteers and NPC patients with different T stages.
Lin et al observed a decrease of phenylalanine in T2–4 stage
cancer blood samples in NPC compared to that of T1 stage by SERS
(20). Therefore, the peak at 1004
cm−1 has the potential to serve as a biomarker for the
differentiation between the early and advanced stage NPC.
 | Table I.Peak positions and tentative
assignments of the major Raman bands of early and advanced stage
NPC tissue samples. |
Table I.
Peak positions and tentative
assignments of the major Raman bands of early and advanced stage
NPC tissue samples.
| Peak position,
cm−1 | Vibrational mode | Major
assignments |
|---|
| 853 | ν (C-C) | Pro |
| 937 | ν (C-C) in α-helix
conformation | Pro and Val |
| 1004 | νs (C-C)
breathing | Phe |
| 1094 | ν (C-N) | Lipids, DNA |
| 1209 | ν (C-C6H5) | Tryp and Phe |
| 1268 | δ (=C-H), δ
(N-H) | PLPs, amide III |
| 1304 | δ (CH2) | Proteins and
lipids |
| 1340 | (CH3CH2) wagging | Proteins and nucleic
acids |
| 1450 | δ (CH2) | PLPs and
collagen |
| 1660 | ν (C=C) | Lipids |
The RS bands at 1209 cm−1 are
characteristic of the ν(C-C6H5) of tryptophan and phenylalanine,
and their percentage signals are markedly reduced in early staged
tissues, indicating an increase in the percentage of tryptophan and
phenylalanine contents relative to the total Raman-active
components in advanced stage tissue. Our previous study
demonstrated that the band intensity located at 1209
cm−1 for healthy tissues was significantly lower than
for cancerous tissues (10). An
additional study has also observed an increase in phenylalanine in
gastric cancer blood plasma using SERS (24). Thus, we hypothesize the carcinoma is
undergoing a transformation process with a gradual increase in
tryptophan and phenylalanine content. However, further studies are
required in order to prove this.
Raman spectroscopy is a convenient, quick, and
repeatable technique. The differences in RS spectra between early
and advanced stage NPC tissue samples may validate biomolecular
changes correlated with the development of the cancer. RS
demonstrates a good ability to distinguish between the early and
advanced staged tissues in NPC for the first time. Furthermore, the
feasibility of RS in differentially staged NPC tissue, classified
by the TNM staging system, indicates a meaningful tool in the early
diagnosis NPC. It may also improve the efficacy of treatment and
the prognosis of NPC.
There are several limitations of the present study
that should be addressed. First, our stratified study had a small
sample, and therefore, further trials with larger sample sizes
should be conducted to test to improve the reproducibility and
efficacy of this method so that it may translate to clinical use.
Secondly, as the spectroscopic instrument is of research grade,
while this is useful for the development of methodology and a pilot
application for NPC staging detection, it presents a challenge for
future clinical applications. In the future, RS analysis may be
complementary to pathological biopsy for the detection of NPC at an
early stage and non-invasively. SERS is more sensitive than normal
RS, and may therefore be more appropriate for the acquisition of
cancer-related results. We are currently exploring the practical
feasibility of using the SERS method for NPC stage determination in
a preliminary study. The ability of RS has been demonstrated in the
utilization of Raman imaging (RI) as a routine optical biopsy tool,
to accurately characterize cancer tissues and distinguish these
from healthy tissues (25). Thus, the
integrated endoscopy system based on RS for NPC detection may be
developed for the diagnosis of NPC in the near future.
In conclusion, Raman spectroscopy (RS) combined with
the PCA-LDA algorithms is able to distinguish early and the
advanced stage NPC tissues in a non-invasive and rapid manner.
Acknowledgements
The authors of the present study thank Professor Su
Ying, Department of Radiation Biological Laboratory, Fujian
Provincial Cancer Hospital for the NPC tissues restore and her
scientific advice. The current study was funded by the National
Clinical Key Specialty Construction Program (grant no. 61210016),
the Key Clinical Specialty Discipline Construction Program of
Fujian (grant no. 61178090), People's Republic of China and Fujian
Provincial Key Laboratory of Translational Cancer Medicine (grant
no. 61178083), the National Natural Science Foundation of China
(grant no. 61405036), the Science and Technology Project of Fujian
Province (grant no. WKJ-FJ-01), the Fujian Province Health
Commission Young and Middle-aged Talent Training Project (grant no.
2014-ZQN-JC-6), the Program for Chang jiang Scholars and Innovative
Research Team in University (grant no. IRT1115) and the Provincial
Natural Science Foundation (grant nos. 2015J01436 and
2015J0105).
References
|
1
|
Zhang L, Chen Q-Y, Liu H, Tang L-Q and Mai
H-Q: Emerging treatment options for nasopharyngeal carcinoma. Drug
Des Devel Ther. 7:37–52. 2013.PubMed/NCBI
|
|
2
|
Lo KW, To KF and Huang DP: Focus on
nasopharyngeal carcinoma. Cancer Cell. 5:423–428. 2004. View Article : Google Scholar : PubMed/NCBI
|
|
3
|
OuYang PY, Su Z, Ma XH, Mao YP, Liu MZ and
Xie FY: Comparison of TNM staging systems for nasopharyngeal
carcinoma, and proposal of a new staging system. Br J Cancer.
109:2987–2997. 2013. View Article : Google Scholar : PubMed/NCBI
|
|
4
|
Kudelski A: Analytical applications of
Raman spectroscopy. Talanta. 76:1–8. 2008. View Article : Google Scholar : PubMed/NCBI
|
|
5
|
Fox SA, Shanblatt AA, Beckman H,
Strasswimmer J and Terentis AC: Raman spectroscopy differentiates
squamous cell carcinoma (SCC) from normal skin following treatment
with a high-powered CO2 laser. Lasers Surg Med. 46:757–772. 2014.
View Article : Google Scholar : PubMed/NCBI
|
|
6
|
Feng S, Chen R, Lin J, Pan J, Chen G, Li
Y, Cheng M, Huang Z, Chen J and Zeng H: Nasopharyngeal cancer
detection based on blood plasma surface-enhanced Raman spectroscopy
and multivariate analysis. Biosens Bioelectron. 25:2414–2419. 2010.
View Article : Google Scholar : PubMed/NCBI
|
|
7
|
Li XZ, Yang TY and Ding JH: Surface
enhanced Raman spectroscopy (SERS) of saliva for the diagnosis of
lung cancer. Guang Pu Xue Yu Guang Pu Fen Xi. 32:391–393. 2012.(In
Chinese). PubMed/NCBI
|
|
8
|
Canetta E, Mazilu M, De Luca AC,
Carruthers AE, Dholakia K, Neilson S, Sargeant H, Briscoe T,
Herrington CS and Riches AC: Modulated Raman spectroscopy for
enhanced identification of bladder tumor cells in urine samples. J
Biomed Opt. 16:0370022011. View Article : Google Scholar : PubMed/NCBI
|
|
9
|
Huang Z, Chen X, Chen Y, Chen J, Dou M,
Feng S, Zeng H and Chen R: Raman spectroscopic characterization and
differentiation of seminal plasma. J Biomed Opt. 16:1105012011.
View Article : Google Scholar : PubMed/NCBI
|
|
10
|
Li Y, Pan J, Chen G, Li C, Lin S, Shao Y,
Feng S, Huang Z, Xie S, Zeng H and Chen R: Micro-Raman spectroscopy
study of cancerous and normal nasopharyngeal tissues. J Biomed Opt.
18:270032013. View Article : Google Scholar : PubMed/NCBI
|
|
11
|
Almond LM, Hutchings J, Kendall C, Day JC,
Stevens OA, Lloyd GR, Shepherd NA, Barr H and Stone N: Assessment
of a custom-built Raman spectroscopic probe for diagnosis of early
oesophageal neoplasia. J Biomed Opt. 17:081421–1. 2012. View Article : Google Scholar : PubMed/NCBI
|
|
12
|
Wang L, Zhang Z, Huang L, Li W, Lu Q, Wen
M, Guo T, Fan J, Wang X, Zhang X, et al: Evaluation of Raman
spectroscopy for diagnosing EGFR mutation status in lung
adenocarcinoma. Analyst (Lond). 139:455–463. 2014. View Article : Google Scholar
|
|
13
|
Luo S, Chen C, Mao H and Jin S:
Discrimination of premalignant lesions and cancer tissues from
normal gastric tissues using Raman spectroscopy. J Biomed Opt.
18:0670042013. View Article : Google Scholar : PubMed/NCBI
|
|
14
|
Lin K, Cheng DLP and Huang Z: Optical
diagnosis of laryngeal cancer using high wavenumber Raman
spectroscopy. Biosens Bioelectron. 35:213–217. 2012. View Article : Google Scholar : PubMed/NCBI
|
|
15
|
Almond LM, Hutchings J, Lloyd G, Barr H,
Shepherd N, Day J, Stevens O, Sanders S, Wadley M, Stone N and
Kendall C: Endoscopic Raman spectroscopy enables objective
diagnosis of dysplasia in Barrett's esophagus. Gastrointest Endosc.
79:37–45. 2014. View Article : Google Scholar : PubMed/NCBI
|
|
16
|
Short MA, Lam S, McWilliams AM, Ionescu DN
and Zeng H: Using laser Raman spectroscopy to reduce false
positives of autofluorescence bronchoscopies: A pilot study. J
Thorac Oncol. 6:1206–1214. 2011. View Article : Google Scholar : PubMed/NCBI
|
|
17
|
Wang W, Zhao J, Short M and Zeng H:
Real-time in vivo cancer diagnosis using Raman spectroscopy. J
Biophotonics. 8:527–545. 2015. View Article : Google Scholar : PubMed/NCBI
|
|
18
|
Praveen BB, Mazilu M, Marchington RF,
Herrington CS, Riches A and Dholakia K: Optimisation of wavelength
modulated Raman spectroscopy: Towards high throughput cell
screening. PLoS One. 8:e672112013. View Article : Google Scholar : PubMed/NCBI
|
|
19
|
Feng S, Lin J, Cheng M, Li YZ, Chen G,
Huang Z, Yu Y, Chen R and Zeng H: Gold nanoparticle based
surface-enhanced Raman scattering spectroscopy of cancerous and
normal nasopharyngeal tissues under near-infrared laser excitation.
Appl Spectrosc. 63:1089–1094. 2009. View Article : Google Scholar : PubMed/NCBI
|
|
20
|
Lin D, Pan J, Huang H, Chen G, Qiu S, Shi
H, Chen W, Yu Y, Feng S and Chen R: Label-free blood plasma test
based on surface-enhanced Raman scattering for tumor stages
detection in nasopharyngeal cancer. Sci Rep. 4:47512014.PubMed/NCBI
|
|
21
|
Pan J, Xu Y, Qiu S, Zong J, Guo Q, Zhang
Y, Lin S and Lu JJ: A comparison between the Chinese 2008 and the
7th edition. AJCC staging systems for nasopharyngeal carcinoma. Am
J Clin Oncol. 38:189–196. 2015. View Article : Google Scholar : PubMed/NCBI
|
|
22
|
Lin D, Feng S, Pan J, Chen Y, Lin J, Chen
G, Xie S, Zeng H and Chen R: Colorectal cancer detection by gold
nanoparticle based surface-enhanced Raman spectroscopy of blood
serum and statistical analysis. Opt Express. 19:13565–13577. 2011.
View Article : Google Scholar : PubMed/NCBI
|
|
23
|
Huang Z, Bergholt MS, Zheng W, Lin K, Ho
KY, Teh M and Yeoh KG: In vivo early diagnosis of gastric dysplasia
using narrow-band image-guided Raman endoscopy. J Biomed Opt.
15:0370172010. View Article : Google Scholar : PubMed/NCBI
|
|
24
|
Feng S, Pan J, Wu Y, Lin D, Chen Y, Xi G,
Lin J and Chen R: Study on gastric cancer blood plasma based on
surface-enhanced Raman spectroscopy combined with multivariate
analysis. Sci China Life Sci. 54:828–834. 2011. View Article : Google Scholar : PubMed/NCBI
|
|
25
|
Abramczyk H, Brozek-Pluska B, Surmacki J,
Jablonska-Gajewicz J and Kordek R: Raman ‘optical biopsy’ of human
breast cancer. Prog Biophys Mol Biol. 108:74–81. 2012. View Article : Google Scholar : PubMed/NCBI
|