Introduction
Laryngeal squamous cell carcinoma (LSCC) is the most
prevalent malignant tumor in the head and neck (1,2). Due to
the key functions of the larynx in respiration and phonation, LSCC
can seriously affect the daily life of patients (3). At present, surgical intervention,
chemotherapy and radiotherapy can be used in the treatment of
primary LSCC, however, these methods have poor effects in advanced
patients (4). Thus, there is an
urgent requirement to identify genes involved in LSCC and to
develop novel therapeutic schedules.
Cox proportional hazards analysis has shown that
cyclin-dependent kinase inhibitor 2A point mutation is associated
with disease relapse and mortality, thus, it may serve as a key
biomolecular indicator in LSCC (5,6).
Downregulated human leukocyte antigen class I can reduce the
survival time of patients with LSCC and can be used as an
independent prognostic marker (7).
The overexpression and/or co-overexpression of cyclin D1 and
cyclin-dependent kinase 4 (CDK4) may be implicated in the
biological behavior of LSCC and have a valuable prognostic
significance (8,9). The expression of S100 calcium binging
protein A2 is associated with cytokeratin expression, cell
commitment to squamous differentiation and overall survival in LSCC
(10). Recombinant lentivirus
mediated siRNA silencing of matrix metallopeptidase 2
(MMP-2) can suppress growth and invasion of LSCC, therefore,
MMP-2 may function in the gene therapy of LSCC (11,12).
Overexpressed stomatin-like protein 2 promotes cell growth,
tumorigenicity and adhesion, and has a correlation with clinical
stage in human LSCC (13,14). In spite of studies performed to
investigate LSCC, the mechanisms of LSCC remain unclear.
In the present study, to further reveal the
mechanisms of LSCC, differentially-expressed genes (DEGs) were
screened. Additionally, a weighted co-expression network was
constructed for the DEGs and a module analysis was conducted.
Additionally, the potential functions of DEGs in modules were
analyzed by pathway enrichment analysis.
Materials and methods
Microarray data
The expression profile of GSE51958, which was
downloaded from Gene Expression Omnibus (http://www.ncbi.nlm.nih.gov/geo/), was based on the
platforms of GPL17869 CytoSure Human Custom Oligonucleotide 4×180 k
Array v.031035 and GPL17870 CytoSure Human Custom Oligonucleotide
4×180 k Array v.025990. GSE51958 included a collection of LSCC
tissue samples and matched adjacent non-cancerous tissue samples
from 10 patients.
DEG screening
Once GSE51958 was downloaded, normalized microarray
data was obtained. The probes with low expression in ≥20
microarrays were excluded. According to the annotation files,
probes that were corresponding to any genes were eliminated.
Subsequently, the limma (linear models for microarray data) package
(15) (http://www.bioconductor.org) was used to screen the
DEGs between the LSCC samples and matched adjacent non-cancerous
samples. The adjusted P-value of <0.05 and |logfold change
(FC)|≥1 were used as the cut-off criteria.
Weighted co-expression network
construction
The WGCNA package (16) in R was used to construct weighted
co-expression networks for the DEGs. Briefly, Pearson's correlation
coefficients between the DEGs were calculated using their
expression matrices. The correlation coefficient of ≥0.8 was
defined as the weighting coefficient.
A hierarchical clustering tree was constructed for
the DEGs using the hybrid dynamic shear tree method (17), and branches of the clustering tree
represented the gene modules. Each module had to be involved with
at least 10 genes. Afterwards, the feature vector of each module
(module eigengenes) was calculated and cluster analysis was
performed for the modules. The closed modules (difference of
feature vectors <0.15) were merged into new modules.
Furthermore, correlation analysis between modules and LSCC was
performed. Gene significance (GS) and module significance (MS; the
mean value of all GS values) were calculated. The module with the
highest MS had a closer correlation with LSCC.
Pathway enrichment analysis
The Kyoto Encyclopedia of Genes and Genomes (KEGG)
is a reference knowledge base involving systems information,
genomic information and chemical information (18). Using the clusterProfiler package
(19) (http://bioconductor.org/packages/release/bioc/html/clusterProfiler.html),
KEGG pathway enrichment analyses were conducted separately for the
DEGs in the modules. A P-value of <0.1 was used as the cut-off
criterion.
Results
DEG analysis
When compared with the adjacent non-cancerous
samples, a total of 959 DEGs were screened from the LSCC samples,
including 553 upregulated and 406 downregulated genes. Evidently,
there were more upregulated genes than downregulated genes.
Weighted co-expression network
construction
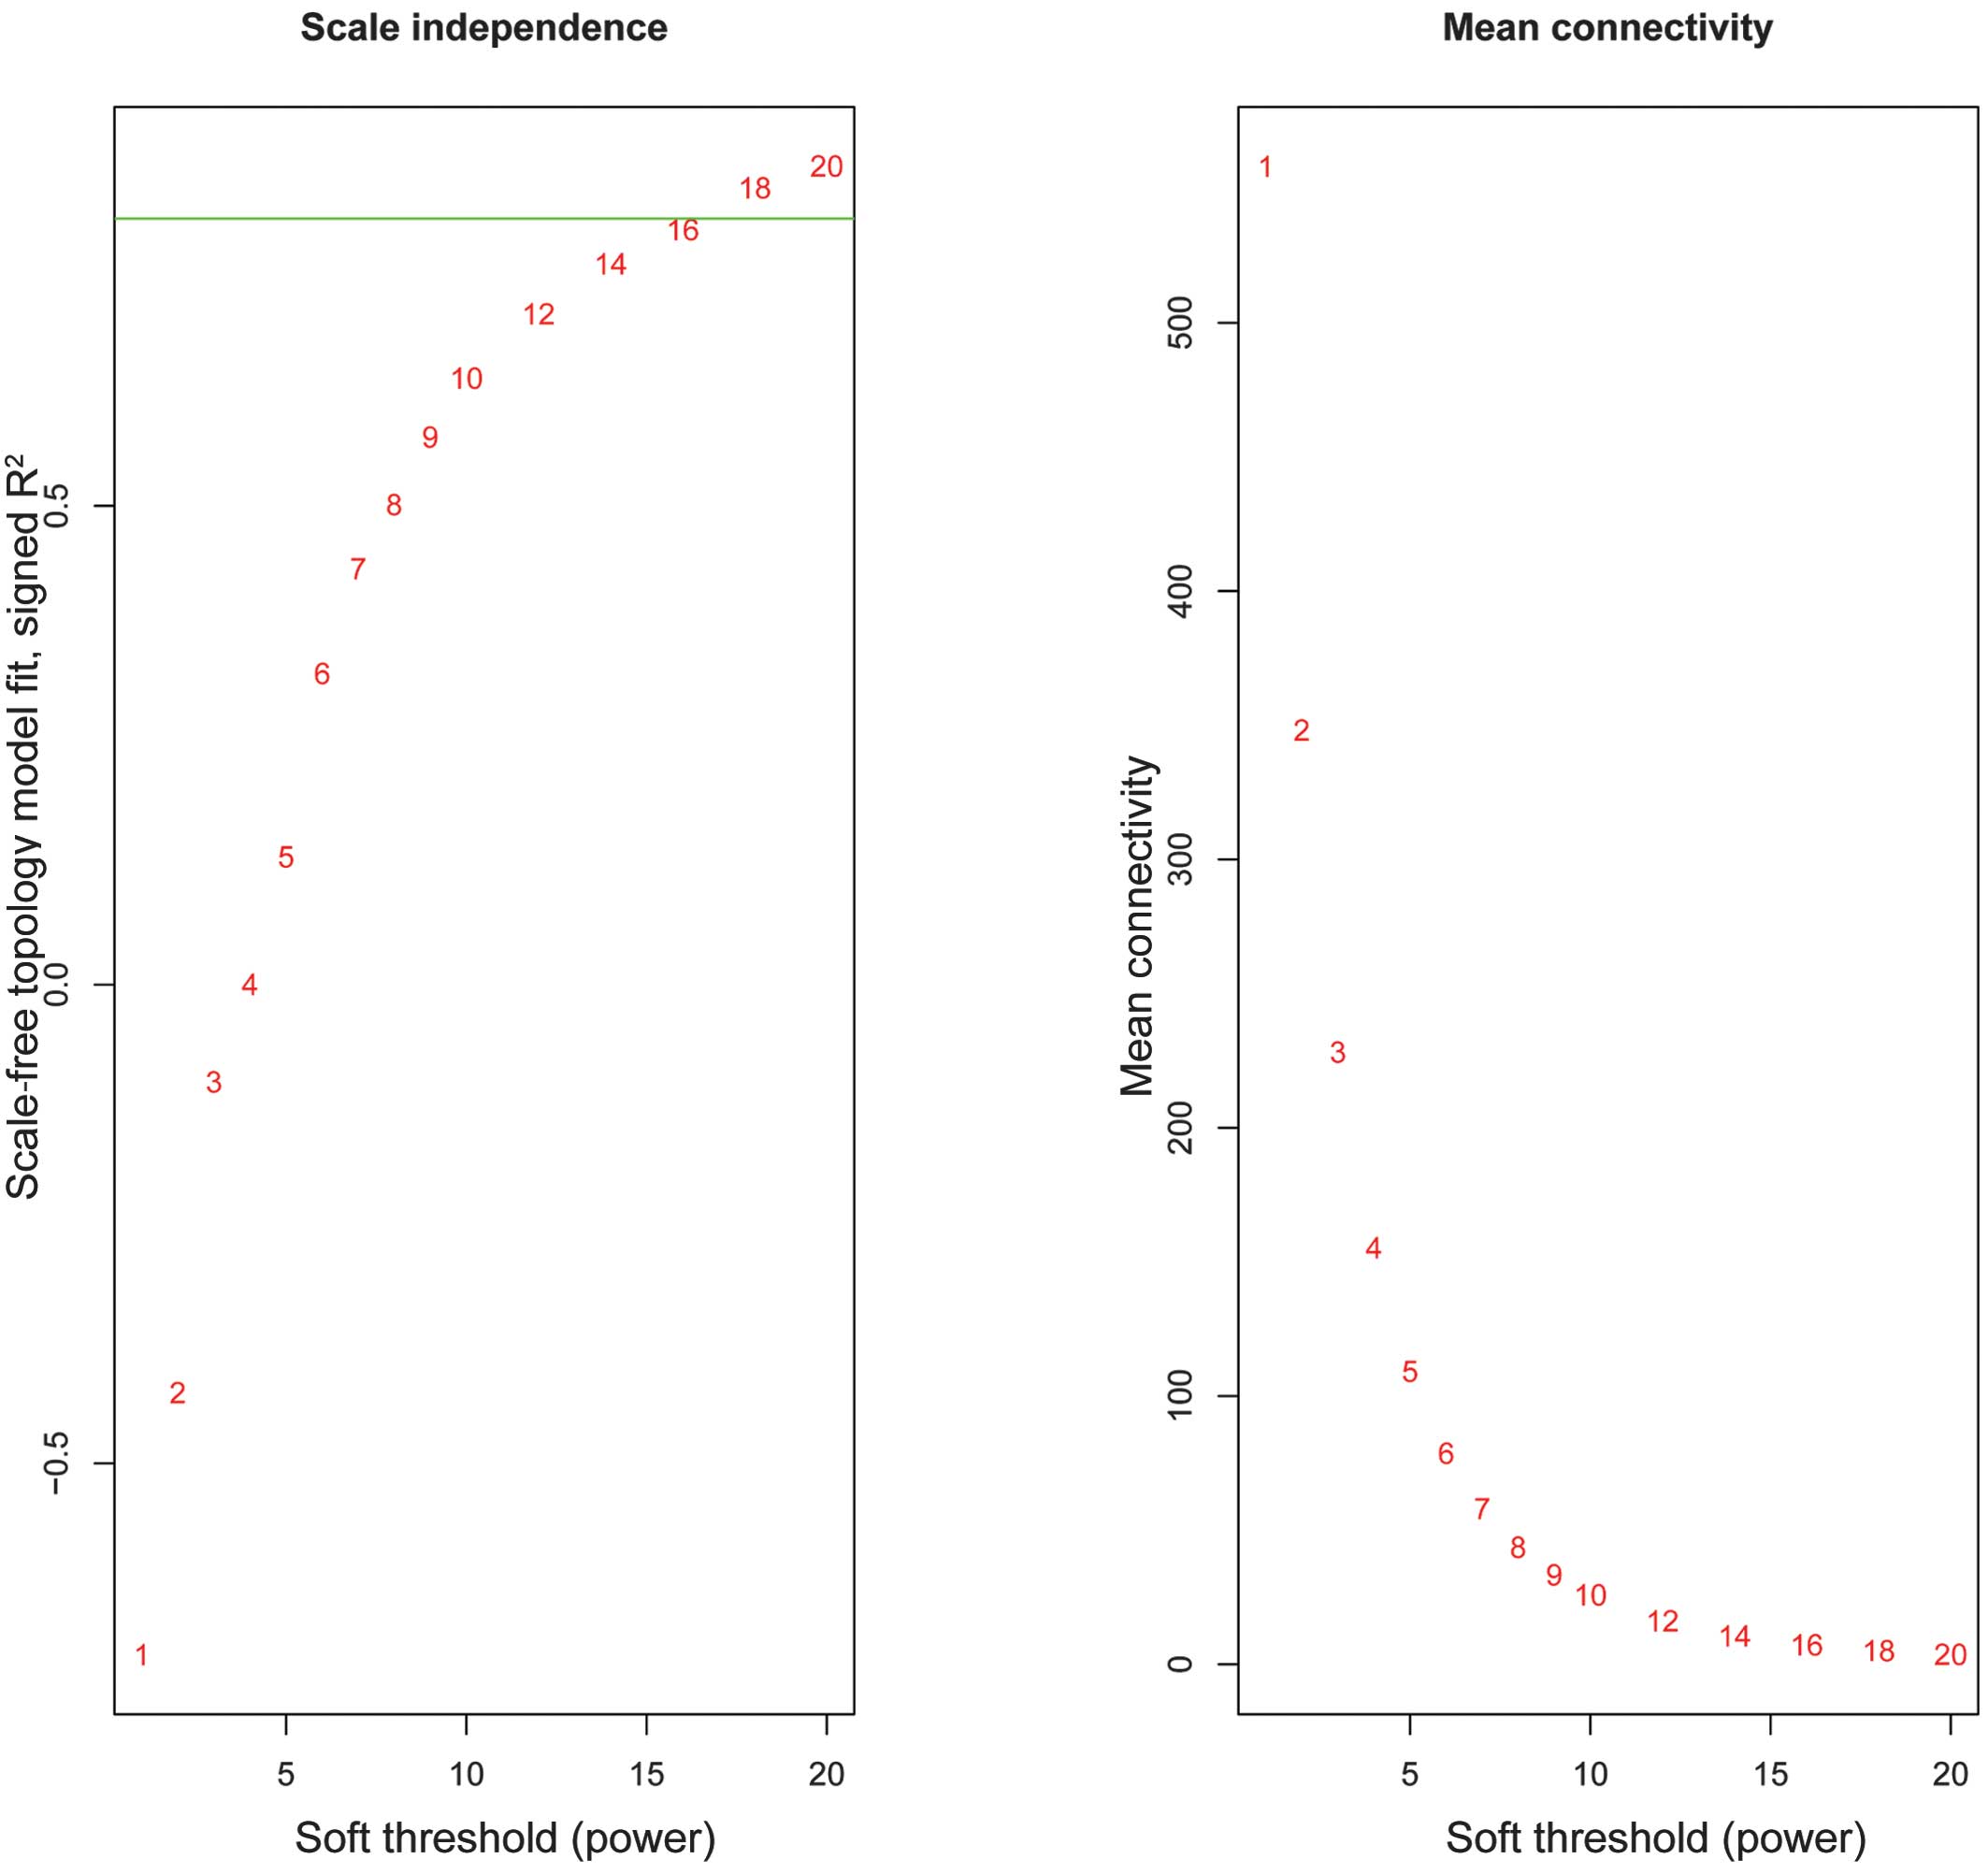
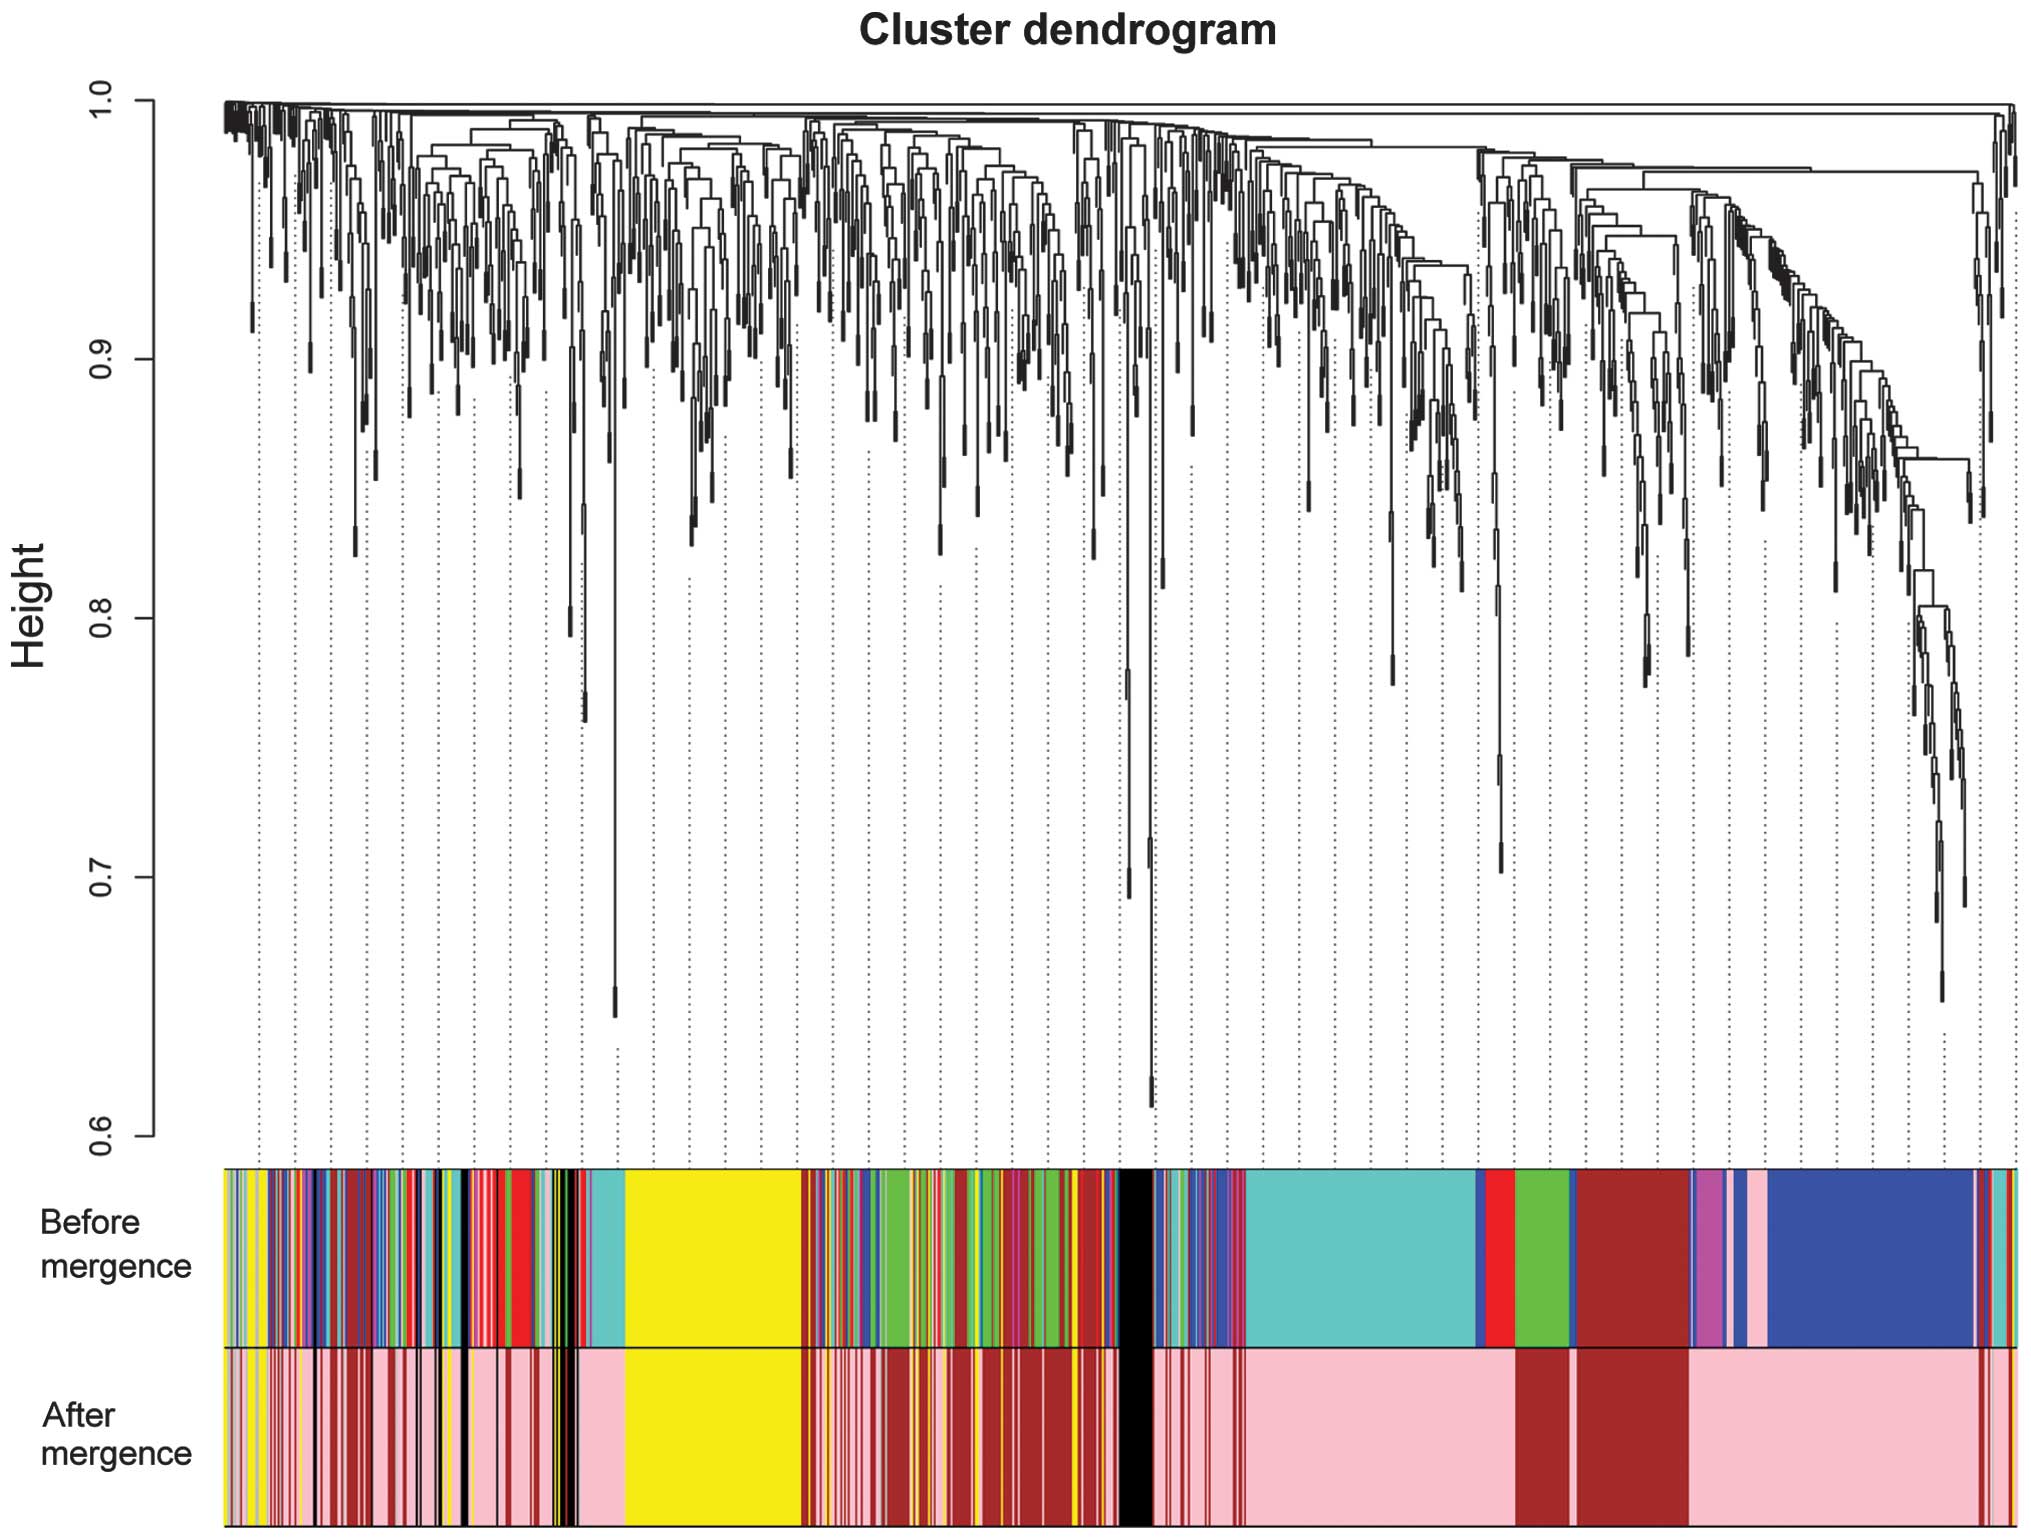
The weighted co-expression network was constructed
and the weighting coefficient was set as 17 (Fig. 1). Modules were identified from the
weighted co-expression network. After these closed modules were
merged, a total of 5 modules (appointed the black, brown, gray,
pink and yellow modules to distinguish the 5 modules) were screened
for the DEGs (Fig. 2). According to
the result of the correlation analysis, their MS values were
approximately the same (Table I). The
pink and black modules contained mainly upregulated genes. By
contrast, the brown and yellow modules mainly contained
downregulated genes. Furthermore, the numbers of upregulated genes
and downregulated genes were the same in the gray module.
 | Table I.Statistics for the five modules
(black, brown, gray, pink and yellow modules). |
Table I.
Statistics for the five modules
(black, brown, gray, pink and yellow modules).
|
| Size | ME-LSCC
correlation |
|
|---|
|
|
|
|
|
|---|
| Module | Upregulated | Downregulated | Absoulute
coefficient | P-value | MS |
|---|
| Black | 40 |
1 | 0.81 |
1.82×10⁻⁵ | 0.68 |
| Pink | 414 | 104 | 0.86 |
1.21×10⁻⁶ | 0.69 |
| Brown | 55 | 203 | −0.85 |
2.36×10⁻⁶ | 0.69 |
| Yellow | 36 | 90 | −0.84 |
4.26×10⁻⁶ | 0.69 |
| Gray |
8 |
8 | −0.92 |
9.84×10⁻⁹ | 0.65 |
Pathway enrichment analysis
Using the clusterProfiler package, pathway
enrichment analyses were conducted separately for the DEGs in each
module. However, only the DEGs in the brown, pink and yellow
modules were involved in pathways. For the DEGs in the brown and
yellow modules, the enriched pathways were the cytokine-cytokine
receptor interaction and metabolic pathways, respectively. There
were 13 enriched pathways for the DEGs in the pink module,
including cell cycle (P=2.05×10⁻⁸), pathways in cancer
(P=1.86×10⁻²) and focal adhesion
(P=5.93×10⁻²) (Table
II).
| Table II.Pathways enriched for
differentially-expressed genes in the pink, brown and yellow
module. |
Table II.
Pathways enriched for
differentially-expressed genes in the pink, brown and yellow
module.
| Module | Category | Term | Description | Gene number | Gene | P-value |
|---|
| Pink | KEGG | 03030 | DNA replication | 12 | FEN1, MCM2, MCM3,
MCM4, RFC5, RFC4, DNA2, POLA2, RNASEH2A, PRIM2, POLE2, PRIM1 |
6.02×10⁻¹⁰ |
|
| KEGG | 04110 | Cell cycle | 19 | CDK4, CDK2, MCM2,
PRKDC, MCM3, MCM4, CDC25B, ORC1, PKMYT1, CDC25A, SKP2, CDC20, TTK,
MAD2L1, CDC45, CHEK1, CCNB1, CCNE1, CDK6 |
2.05×10⁻⁸ |
|
| KEGG | 05222 | Small cell lung
cancer | 10 | CDK4, CDK2, LAMA3,
COL4A1, LAMB3, LAMC2, COL4A2, SKP2, |
3.81×10⁻⁴ |
|
| KEGG | 00240 | Pyrimidine
metabolism | 10 | CCNE1, CDK6, NME1,
UCK2, TK1, POLA2, PRIM2, POLR3D, POLE2, TYMP, TYMS, PRIM1 |
1.28×10⁻³ |
|
| KEGG | 04115 | P53 signaling
pathway | 8 | SESN3, CDK4, CDK2,
IGFBP3, CHEK1, CCNB1, CCNE1, CDK6 |
1.61×10⁻³ |
|
| KEGG | 04512 | ECM-receptor
interaction | 8 | SPP1, LAMA3,
COL4A1, TNC, LAMB3, LAMC2, COL4A2, ITGB4 |
5.98×10⁻³ |
|
| KEGG | 05200 | Pathways in
cancer | 18 | CDK4, CDK2, LAMA3,
PDGFB, COL4A1, SLC2A1, LAMB3, LAMC2, COL4A2, SKP2, BIRC5, DVL3,
EGFR, AR, WNT3, WNT7B, CCNE1, CDK6 |
1.86×10⁻² |
|
| KEGG | 04510 | Focal adhesion | 11 | SPP1, LAMA3, PDGFB,
COL4A1, TNC, LAMB3, LAMC2, COL4A2, CAV2, EGFR, ITGB4 |
5.93×10⁻³ |
| Brown | KEGG | 04060 | Cytokine-cytokine
receptor interaction | 7 | CXCL12, LEPR,
CCL15, CCL28, CCL14, KIT, TNFRSF12A |
5.05×10⁻² |
| Yellow | KEGG | 01100 | Metabolic
pathways | 14 | ATP6V0A4, FUT6,
ST6GALNAC1, GCNT3, ACSM3, EPHX2, AKR1B1, GGT6, GALE, FUT2, MGLL,
TM7SF2, CYP3A5, B3GNT3 |
1.34×10⁻² |
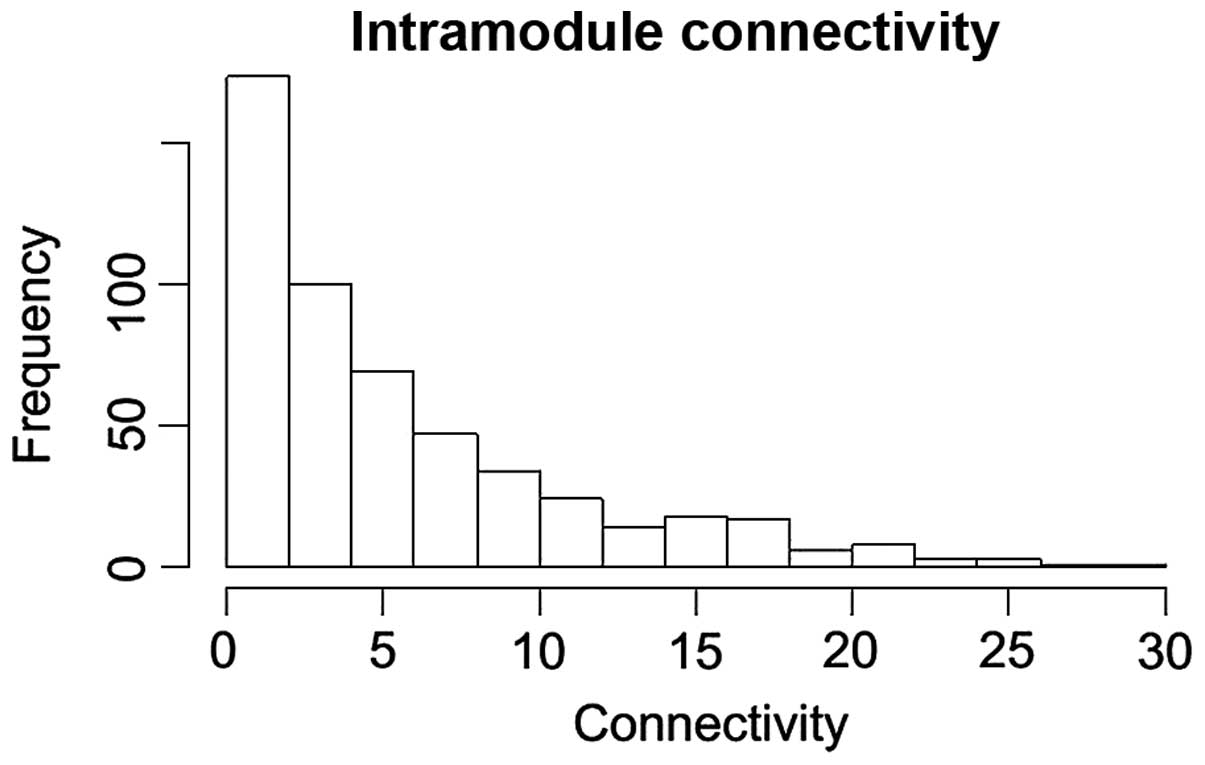
The connectivity distribution of the DEGs in the
pink module is shown in Fig. 3. In
the pink module, the DEGs with connectivity degrees >20 were
upregulated in LSCC samples. In particular, TPX2,
microtubule-associated homolog (TPX2; degree, 25),
minichromosome maintenance complex component 2 (MCM2;
degree, 25), ubiquitin-like with PHD and ring finger domains 1
(UHRF1; degree, 22), cyclin-dependent kinase 2 (CDK2;
degree, 20) and protein regulator of cytokinesis 1 (PRC1;
degree, 20) exhibited high connectivity degrees in the pink
module.
Discussion
In the present study, a total of 959 DEGs, including
553 upregulated genes and 406 downregulated genes, were screened
from LSCC samples compared with adjacent non-cancerous samples. A
total of 5 modules (the black, brown, gray, pink and yellow
modules) were screened for the DEGs in the weighted co-expression
network. The DEGs in the pink module were involved in the most
pathways. TPX2 (degree, 25), MCM2 (degree, 25),
UHRF1 (degree, 22), CDK2 (degree, 20) and PRC1
(degree, 20) may be of great importance in LSCC, as they had high
connectivity degrees in the pink module.
As a serine-threonine kinase gene, Aurora-A may
correlate with TPX2 during spindle assembly, and TPX2
functions in targeting Aurora-A to the spindle apparatus (20). Aurora-A and TPX2 are often
co-overexpressed, therefore, certain functions of Aurora-A in cell
transformation and tumorigenesis can be a result of the oncogenic
activation of the Aurora-A/TPX2 complex (21). Upregulated Aurora-A may play important
roles in the tumor progression and prognosis of head and neck
squamous cell carcinoma (22). By
enhancing the invasion ability and chromosomal instability,
overexpressed Aurora-A may promote the carcinogenesis and
progression of LSCC (4,23). Thus, the expression level of
TPX2 may be associated with LSCC.
As a biomarker for showing the proliferation of
laryngeal carcinoma cells, MCM2 can play a role in the
occurrence, progression and prognosis of laryngeal carcinoma
(24). It has been reported that
overexpressed UHRF1 may function in the progression of LSCC
and may be used as a promising marker for the prognosis of LSCC
(25). By transforming cell cycle
progression, promoting apoptosis and weakening the DNA damage
repair capacity, the inhibition of UHRF1 can be implicated
in the radioresistance of esophageal SCC (26). The results indicate that MCM2
and UHRF1 may have a close correlation with LSCC.
Cyclin D1, cyclin E and their catalytic subunits,
CDK4 and CDK2, often are overexpressed in a number of
human esophageal SCC cases (27). The
overexpression of combined CDK2 and proliferating cell
nuclear antigen indicates a poor overall survival time, and
CDK2 expression may be associated with the biological
behavior of LSCC (28). Overexpressed
cyclin E has a correlation with poor clinicopathological parameters
and can serve as an biomarker for cell proliferation and prognosis
in patients with LSCC (29). These
results may indicate that the expression level of CDK2 is
associated with LSCC. As a protein implicated in cytokinesis, PRC1
is a good in vivo substrate for several CDKs (30), indicating that PRC1 may also
play a role in LSCC through CDK2.
In conclusion, the present study performed an
integrated bioinformatics analysis of genes that may be associated
with LSCC. A total of 959 DEGs were screened from LSCC samples
compared with adjacent non-cancerous samples. Furthermore,
TPX2, MCM2, UHRF1, CDK2 and PRC1
may play a role in LSCC. However, further studies are required to
reveal their specific functions in LSCC.
References
|
1
|
Batsakis JG: Tumors of the head and neck:
Clinical and pathological considerations (2nd). Williams &
Wilkins. Baltimore: 1979. View Article : Google Scholar
|
|
2
|
Million R, Cassisi N and Clark J: Cancer
of the head and neck. Cancer: Principles and Practice of Oncology
(3rd). (JB Lippincott, PA). 488–590. 1989.
|
|
3
|
Hunter KD, Parkinson EK and Harrison PR:
Profiling early head and neck cancer. Nat Rev Cancer. 5:127–135.
2005. View
Article : Google Scholar : PubMed/NCBI
|
|
4
|
Zhang H, Chen X, Jin Y, Liu B and Zhou L:
Overexpression of Aurora-A promotes laryngeal cancer progression by
enhancing invasive ability and chromosomal instability. Eur Arch
Otorhinolaryngol. 269:607–614. 2012. View Article : Google Scholar : PubMed/NCBI
|
|
5
|
Bazan V, Zanna I, Migliavacca M,
Sanz-Casla MT, Maestro ML, Corsale S, Macaluso M, Dardanoni G,
Restivo S, Quintela PL, et al: Prognostic significance of p16INK4a
alterations and 9p21 loss of heterozygosity in locally advanced
laryngeal squamous cell carcinoma. J Cell Physiol. 192:286–293.
2002. View Article : Google Scholar : PubMed/NCBI
|
|
6
|
Rocco JW and Sidransky D: p16
(MTS-1/CDKN2/INK4a) in cancer progression. Exp Cell Res. 264:42–55.
2001. View Article : Google Scholar : PubMed/NCBI
|
|
7
|
Ogino T, Shigyo H, Ishii H, Katayama A,
Miyokawa N, Harabuchi Y and Ferrone S: HLA class I antigen
down-regulation in primary laryngeal squamous cell carcinoma
lesions as a poor prognostic marker. Cancer Res. 66:9281–9289.
2006. View Article : Google Scholar : PubMed/NCBI
|
|
8
|
Dong Y, Sui L, Sugimoto K, Tai Y and
Tokuda M: Cyclin D1-CDK4 complex, a possible critical factor for
cell proliferation and prognosis in laryngeal squamous cell
carcinomas. Int J Cancer. 95:209–215. 2001. View Article : Google Scholar : PubMed/NCBI
|
|
9
|
Vielba R, Bilbao J, Ispizua A, Zabalza I,
Alfaro J, Rezola R, Moreno E, Elorriaga J, Alonso I, Baroja A and
de la Hoz C: p53 and cyclin D1 as prognostic factors in squamous
cell carcinoma of the larynx. Laryngoscope. 113:167–172. 2003.
View Article : Google Scholar : PubMed/NCBI
|
|
10
|
Lauriola L, Michetti F, Maggiano N, Galli
J, Cadoni G, Schäfer BW, Heizmann CW and Ranelletti FO: Prognostic
significance of the Ca(2+) binding protein S100A2 in laryngeal
squamous-cell carcinoma. Int J Cancer. 89:345–349. 2000. View Article : Google Scholar : PubMed/NCBI
|
|
11
|
Sun Y, Liu M, Yang B, Li B and Lu J: Role
of siRNA silencing of MMP-2 gene on invasion and growth of
laryngeal squamous cell carcinoma. Eur Arch Otorhinolaryngol.
265:1385–1391. 2008. View Article : Google Scholar : PubMed/NCBI
|
|
12
|
Liu WW, Zeng ZY, Wu QL, Hou JH and Chen
YY: Overexpression of MMP-2 in laryngeal squamous cell carcinoma: A
potential indicator for poor prognosis. Otolaryngol Head Neck Surg.
132:395–400. 2005. View Article : Google Scholar : PubMed/NCBI
|
|
13
|
Cao WF, Zhang LY, Liu MB, Tang PZ, Liu ZH
and Sun BC: Prognostic significance of stomatin-like protein 2
overexpression in laryngeal squamous cell carcinoma: Clinical,
histologic and immunohistochemistry analyses with tissue
microarray. Hum Pathol. 38:747–752. 2007. View Article : Google Scholar : PubMed/NCBI
|
|
14
|
Cao WF, Zhang LY, Zhang B, Liu MB, Liu ZH
and Sun BC: Relationship between SLP-2 expression and prognosis in
laryngeal squamous cell carcinoma and mammary invasive carcinoma.
Zhonghua Bing Li Xue Za Zhi. 39:332–337. 2010.(In Chinese).
PubMed/NCBI
|
|
15
|
Smyth GK Limma: Linear models for
microarray data. Bioinformatics and Computational Biology Solutions
using R and Bioconductor. Gentleman R, Carey V, Dudoit S, Irizarry
R and Huber W: Springer. (New York). 397–420. 2005. View Article : Google Scholar
|
|
16
|
Langfelder P and Horvath S: WGCNA: An R
package for weighted correlation network analysis. BMC
Bioinformatics. 9:5592008. View Article : Google Scholar : PubMed/NCBI
|
|
17
|
Janssens F, Zhang L, De Moor B and Glänzel
W: Hybrid clustering for validation and improvement of
subject-classification schemes. Inform Process Manag. 45:683–702.
2009. View Article : Google Scholar
|
|
18
|
Kanehisa M, Goto S, Sato Y, Furumichi M
and Tanabe M: KEGG for integration and interpretation of
large-scale molecular data sets. Nucleic Acids Res. 40(Database
Issue): D109–D114. 2012. View Article : Google Scholar : PubMed/NCBI
|
|
19
|
Yu G, Wang LG, Han Y and He QY:
ClusterProfiler: An R package for comparing biological themes among
gene clusters. OMICS. 16:284–287. 2012. View Article : Google Scholar : PubMed/NCBI
|
|
20
|
Kufer TA, Silljé HH, Körner R, Gruss OJ,
Meraldi P and Nigg EA: Human TPX2 is required for targeting
Aurora-A kinase to the spindle. J Cell Biol. 158:617–623. 2002.
View Article : Google Scholar : PubMed/NCBI
|
|
21
|
Asteriti IA, Rensen WM, Lindon C, Lavia P
and Guarguaglini G: The Aurora-A/TPX2 complex: A novel oncogenic
holoenzyme? Biochim Biophys Acta. 1806:230–239. 2010.PubMed/NCBI
|
|
22
|
Reiter R, Gais P, Jütting U, Steuer-Vogt
MK, Pickhard A, Bink K, Rauser S, Lassmann S, Höfler H, Werner M
and Walch A: Aurora kinase A messenger RNA overexpression is
correlated with tumor progression and shortened survival in head
and neck squamous cell carcinoma. Clin Cancer Res. 12:5136–5141.
2006. View Article : Google Scholar : PubMed/NCBI
|
|
23
|
Guan Z, Wang XR, Zhu XF, Huang XF, Xu J,
Wang LH, Wan XB, Long ZJ, Liu JN, Feng GK, et al: Aurora-A, a
negative prognostic marker, increases migration and decreases
radiosensitivity in cancer cells. Cancer Res. 67:10436–10444. 2007.
View Article : Google Scholar : PubMed/NCBI
|
|
24
|
Chatrath P, Scott IS, Morris LS, Davies
RJ, Rushbrook SM, Bird K, Vowler SL, Grant JW, Saeed IT, Howard D,
et al: Aberrant expression of minichromosome maintenance protein-2
and Ki67 in laryngeal squamous epithelial lesions. Br J Cancer.
89:1048–1054. 2003. View Article : Google Scholar : PubMed/NCBI
|
|
25
|
Pi JT, Lin Y, Quan Q, Chen LL, Jiang LZ,
Chi W and Chen HY: Overexpression of UHRF1 is significantly
associated with poor prognosis in laryngeal squamous cell
carcinoma. Med Oncol. 30:6132013. View Article : Google Scholar : PubMed/NCBI
|
|
26
|
Yang C, Wang Y, Zhang F, Sun G, Li C, Jing
S, Liu Q and Cheng Y: Inhibiting UHRF1 expression enhances
radiosensitivity in human esophageal squamous cell carcinoma. Mol
Biol Rep. 40:5225–5235. 2013. View Article : Google Scholar : PubMed/NCBI
|
|
27
|
Matsumoto M, Furihata M, Ishikawa T,
Ohtsuki Y and Ogoshi S: Comparison of deregulated expression of
cyclin D1 and cyclin E with that of cyclin-dependent kinase 4
(CDK4) and CDK2 in human oesophageal squamous cell carcinoma. Br J
Cancer. 80:256–261. 1999. View Article : Google Scholar : PubMed/NCBI
|
|
28
|
Dong Y, Sui L, Tai Y, Sugimoto K and
Tokuda M: The overexpression of cyclin-dependent kinase (CDK) 2 in
laryngeal squamous cell carcinomas. Anticancer Res. 21:103–108.
2000.
|
|
29
|
Dong Y, Sui L, Tai Y, Sugimoto K, Hirao T
and Tokuda M: Prognostic significance of cyclin E overexpression in
laryngeal squamous cell carcinomas. Clin Cancer Res. 6:4253–4258.
2000.PubMed/NCBI
|
|
30
|
Jiang W, Jimenez G, Wells NJ, Hope TJ,
Wahl GM, Hunter T and Fukunaga R: PRC1: A human mitotic
spindle-associated CDK substrate protein required for cytokinesis.
Mol Cell. 2:877–885. 1998. View Article : Google Scholar : PubMed/NCBI
|