Introduction
Nasopharyngeal carcinoma (NPC) is a
non-lymphomatous, squamous-cell carcinoma that is particularly
prevalent in Southeast Asia and North Africa (1,2). Previous
studies have suggested that differentially expressed genes and
microRNAs (miRNAs or miRs), and the corresponding genes and miRNAs
associated with them, participate in the pathogenesis of NPC
(1,3).
Transcription factors (TFs) and miRNAs are important
regulators of gene expression (4).
TFs are proteins capable of activating or repressing the
transcription of numerous genes by binding to cis-regulatory
elements located in the upstream region of these genes (5). TFs may regulate gene expression at the
transcriptional level alone or in cooperation with other proteins
(6).
miRNAs participate in various biological processes,
including proliferation and mutation, by targeting particular genes
(6,7).
miRNAs may repress the translation of messenger (m)RNAs or degrade
mRNAs, thus regulating gene expression at the post-transcriptional
level (8).
Host genes are the genes where miRNAs are located
(9). Rodriguez et al (9) indicated that miRNAs are transcribed in
parallel with their host transcripts, and two different types of
miRNAs (termed exonic and intronic) were identified by the authors.
miRNAs and their host genes are closely associated, and usually
function together in different biological processes (7).
Although numerous studies on NPC exist in the
literature, the majority of studies conducted to date have only
focused on one element (either a gene or a miRNA), thus impeding
the systematic analysis of the nosogenesis of NPC (1,3,6). In the present study, the associations
between all the elements that participate in NPC were investigated
by building three networks, which clearly displayed the identified
associations between the different NPC elements. The present study
focused on the study of the associations existing between miRNAs
located on host genes, genes regulating miRNAs and miRNAs targeting
target genes. The differentially expressed genes and other elements
analyzed in the present study were selected based on previous
studies on NPC available in the literature and pertinent databases
(1,10). Subsequently, three regulatory networks
were constructed, which were termed differentially expressed
network, associated network and global network, respectively.
However, the global network was observed to be too complex to
provide any useful information, since it was constructed by using
almost all the elements involved in NPC that had been
experimentally validated in previous studies. Therefore, the
present study focused on the analysis of the pathways involving
differentially expressed genes and relevant TFs. The associations
between these elements were analyzed in order to identify the
important molecules and signaling pathways involved in the
development of NPC.
Materials and methods
Data identification and
processing
The experimentally validated dataset of human miRNAs
and their target genes used in the present study was obtained from
TarBase 7.0 (http://diana.imis.athena-innovation.gr/DianaTools/index.php?r=tarbase/index)
and miRTarBase (http://mirtarbase.mbc.nctu.edu.tw/). The names used in
the present study to unify each gene and miRNA are available at the
National Center for Biotechnology Information (NCBI) database
(http://www.ncbi.nlm.nih.gov/gene/).
TransmiR (http://www.cuilab.cn/transmir) (10) was used to identify experimentally
validated datasets of human TFs and their regulated miRNAs, while
miRBase (http://www.mirbase.org/) (11) and the aforementioned NCBI database
were used to identify host genes of human miRNAs. Differentially
expressed genes in NPC were identified from CancerGenetics Web
(http://www.cancerindex.org/geneweb/),
NCBI dbSNP database (http://www.ncbi.nlm.nih.gov/projects/SNP/index.html)
and previous studies on NPC available in the literature (12). NPC-associated genes were identified
from the information contained in the GeneCards database
(http://www.genecards.org/) (13) and previous studies on NPC published in
the literature (1). Relevant TFs were
extracted by the P-Match method (14). Of these, the present study only
focused on those TFs that appeared in TransmiR, which were
considered to be NPC-associated genes. The promoter region
sequences (of 1,000 nt in length) of the targets of the
differentially expressed genes were downloaded from the UCSC
database (http://hgdownload.soe.ucsc.edu/downloads.html)
(15). The P-Match method, which
combines pattern matching and weight matrix approaches, was used to
identify transcription factor binding sites (TFBSs) in the above
1,000-nt promoter region sequences, and mapped these TFBSs onto the
promoter region of the target genes. Since P-Match uses the matrix
library and sets of known TFBSs available at TRANSFAC®
(http://www.gene-regulation.com/pub/databases.html),
this method enables to search for multiple TFBSs. Furthermore, the
standard matrix and restricted high quality criterion were used for
the aforementioned matrix.
Differentially expressed miRNAs were identified from
the information available at mir2Disease (http://www.mir2disease.org/) (3) and published studies on NPC, while
NPC-associated miRNAs were mainly identified in the relevant
literature (12).
Networks construction
In the present study, three regulatory networks of
NPC were constructed, namely, the differentially expressed network,
the NPC-associated network and the global network. All the
regulatory associations between host genes, target genes, miRNAs
and TFs were extracted and combined to construc the global
regulatory network. The differentially expressed elements were
extracted, and the associations between them were selected from the
global network in order to construct the differentially expressed
network. The associated elements and the selected associations
between them were extracted from the global network in order to
construct the NPC-associated network.
Results
Differentially expressed network of
NPC
Fig. 1 represents
various significant regulatory pathways and elements involved in
NPC. This differentially expressed network of NPC includes 2 TFs, 9
targets of miRNAs and 40 miRNAs with their host genes. All the
elements are differentially expressed in NPC, with the exception of
host genes. Three types of associations were identified in this
network, including those existing between miRNAs and their target
genes, between host genes and host miRNAs, and between genes that
regulate miRNAs and these miRNAs. Particular pathways were also
identified in this network. Notably, one host gene may host ≥1
miRNAs, and the miRNAs that target a particular host gene may also
target other genes. For example, MIR195 hosts Homo sapiens
(hsa)-miR-195, while hsa-miR-195 targets vascular endothelial
growth factor A (VEGFA) and cyclin D1 (CCND1). In addition, one
miRNA may locate in one or several genes. For example, hsa-miR-145
locates in MIR145 and MIR143 host gene (HG). Additional significant
associations were identified. For example, CCND1 regulates both
hsa-miR-20a and hsa-miR-17, while in turn these miRNAs target
CCND1. Therefore, hsa-miR-20a and CCND1, and hsa-miR-17 and CCND1
exhibit a self-adaptation type of association. Hsa-miR-15a and
hsa-miR-16 both target tumor protein p53 (TP53), cell adhesion
molecule 1 (CADM1), B-cell lymphoma 2 (BCL2), VEGFA and CCND1, but
are not regulated by any differentially expressed gene. VEGFA is
targeted by 10 different miRNAs (namely, hsa-miR-145, hsa-miR-150,
hsa-miR-15a, hsa-miR-16, hsa-miR-17, hsa-miR-195, hsa-miR-20a,
hsa-miR-29b, hsa-miR-34b and hsa-miR-93), but does not regulate any
miRNA. CADM1 is targeted by 3 miRNAs (hsa-miR-15a, hsa-miR-16 and
hsa-miR-192), but does not regulate any miRNA. Retinoblastoma-like
2 (RBL2) is targeted by 3 miRNAs (hsa-miR-192, hsa-miR-17 and
hsa-miR-20a), but does not regulate any miRNA. BCL2 is targeted by
14 miRNAs, but does not regulate any miRNA. This differentially
expressed network partly explains the regulatory mechanism of
NPC.
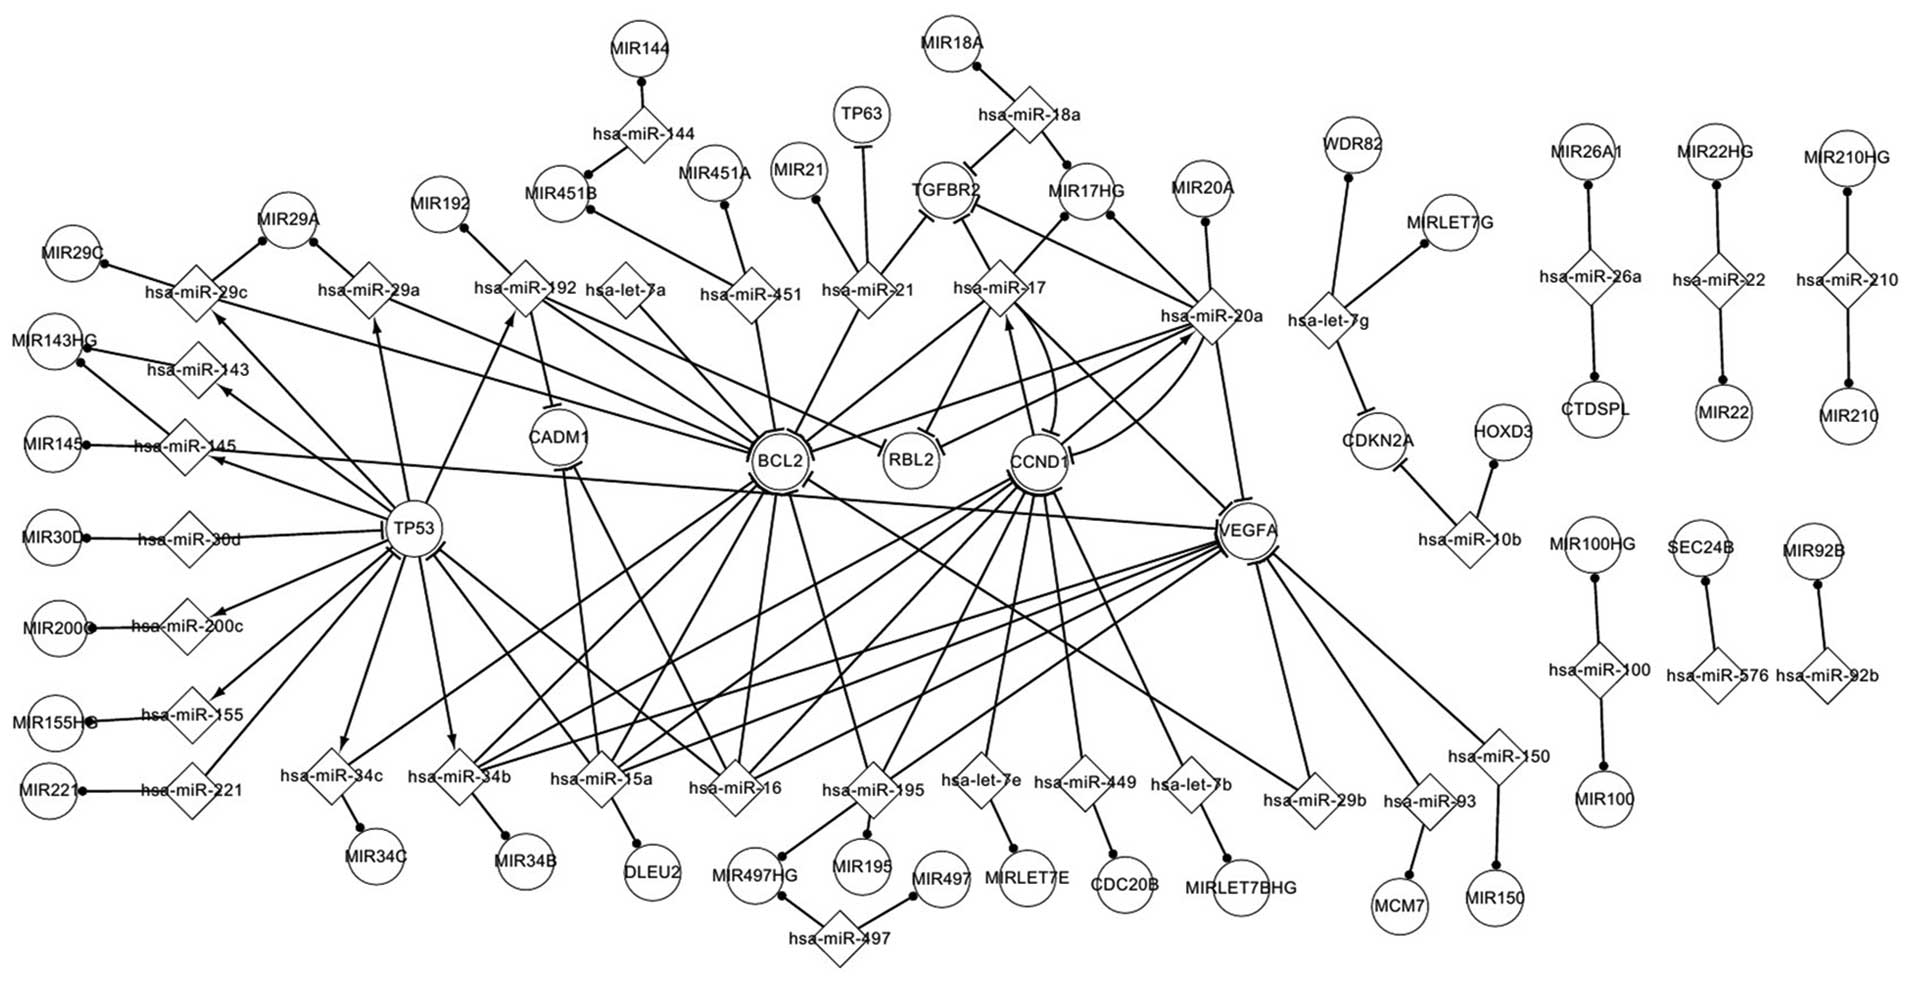 | Figure 1.Differentially expressed network in
nasopharyngeal carcinoma. MIR, microRNA; miR, microRNA; hsa,
Homo sapiens; HG, host gene; TP63, tumor protein p63; WDR82,
WD repeat domain 82; TGFBR2, transforming growth factor, beta
receptor II; TP53, tumor protein p53; CADM1, cell adhesion molecule
1; BCL2, B-cell lymphoma 2; RBL2, retinoblastoma-like 2; CCDN1,
cylin D1; VEGFA, vascular endothelial growth factor A; CDKN2A,
cyclin-dependent kinase inhibitor 2A; HOXD3, homeobox D3; CTDSPL,
carboxy-terminal domain, RNA polymerase II, polypeptide A small
phosphatase-like; SEC24B, SEC24 family member B; DLEU2, deleted in
lymphocytic leukemia 2; CDC20B, cell division cycle 20 homolog B;
MCM7, minichromosome maintenance complex component 7. |
Associated network of NPC
Since NPC-associated elements include differentially
expressed elements, the above differentially expressed regulatory
network forms part of the NPC-associated network. The associated
network constructed in the present study reveals additional
pathways involving genes and miRNAs, and may contribute to further
understanding the pathogenesis of NPC. As depicted in Fig. 2, more signaling pathways are observed
in the associated network than in the differentially expressed
regulatory network. For instance, v-myc avian myelocytomatosis
viral oncogene homolog (MYC) and hsa-miR-26a form a self-adaptation
type of association. In addition, MYC regulates hsa-miR-29c and
hsa-miR-29a, which both target BCL2.
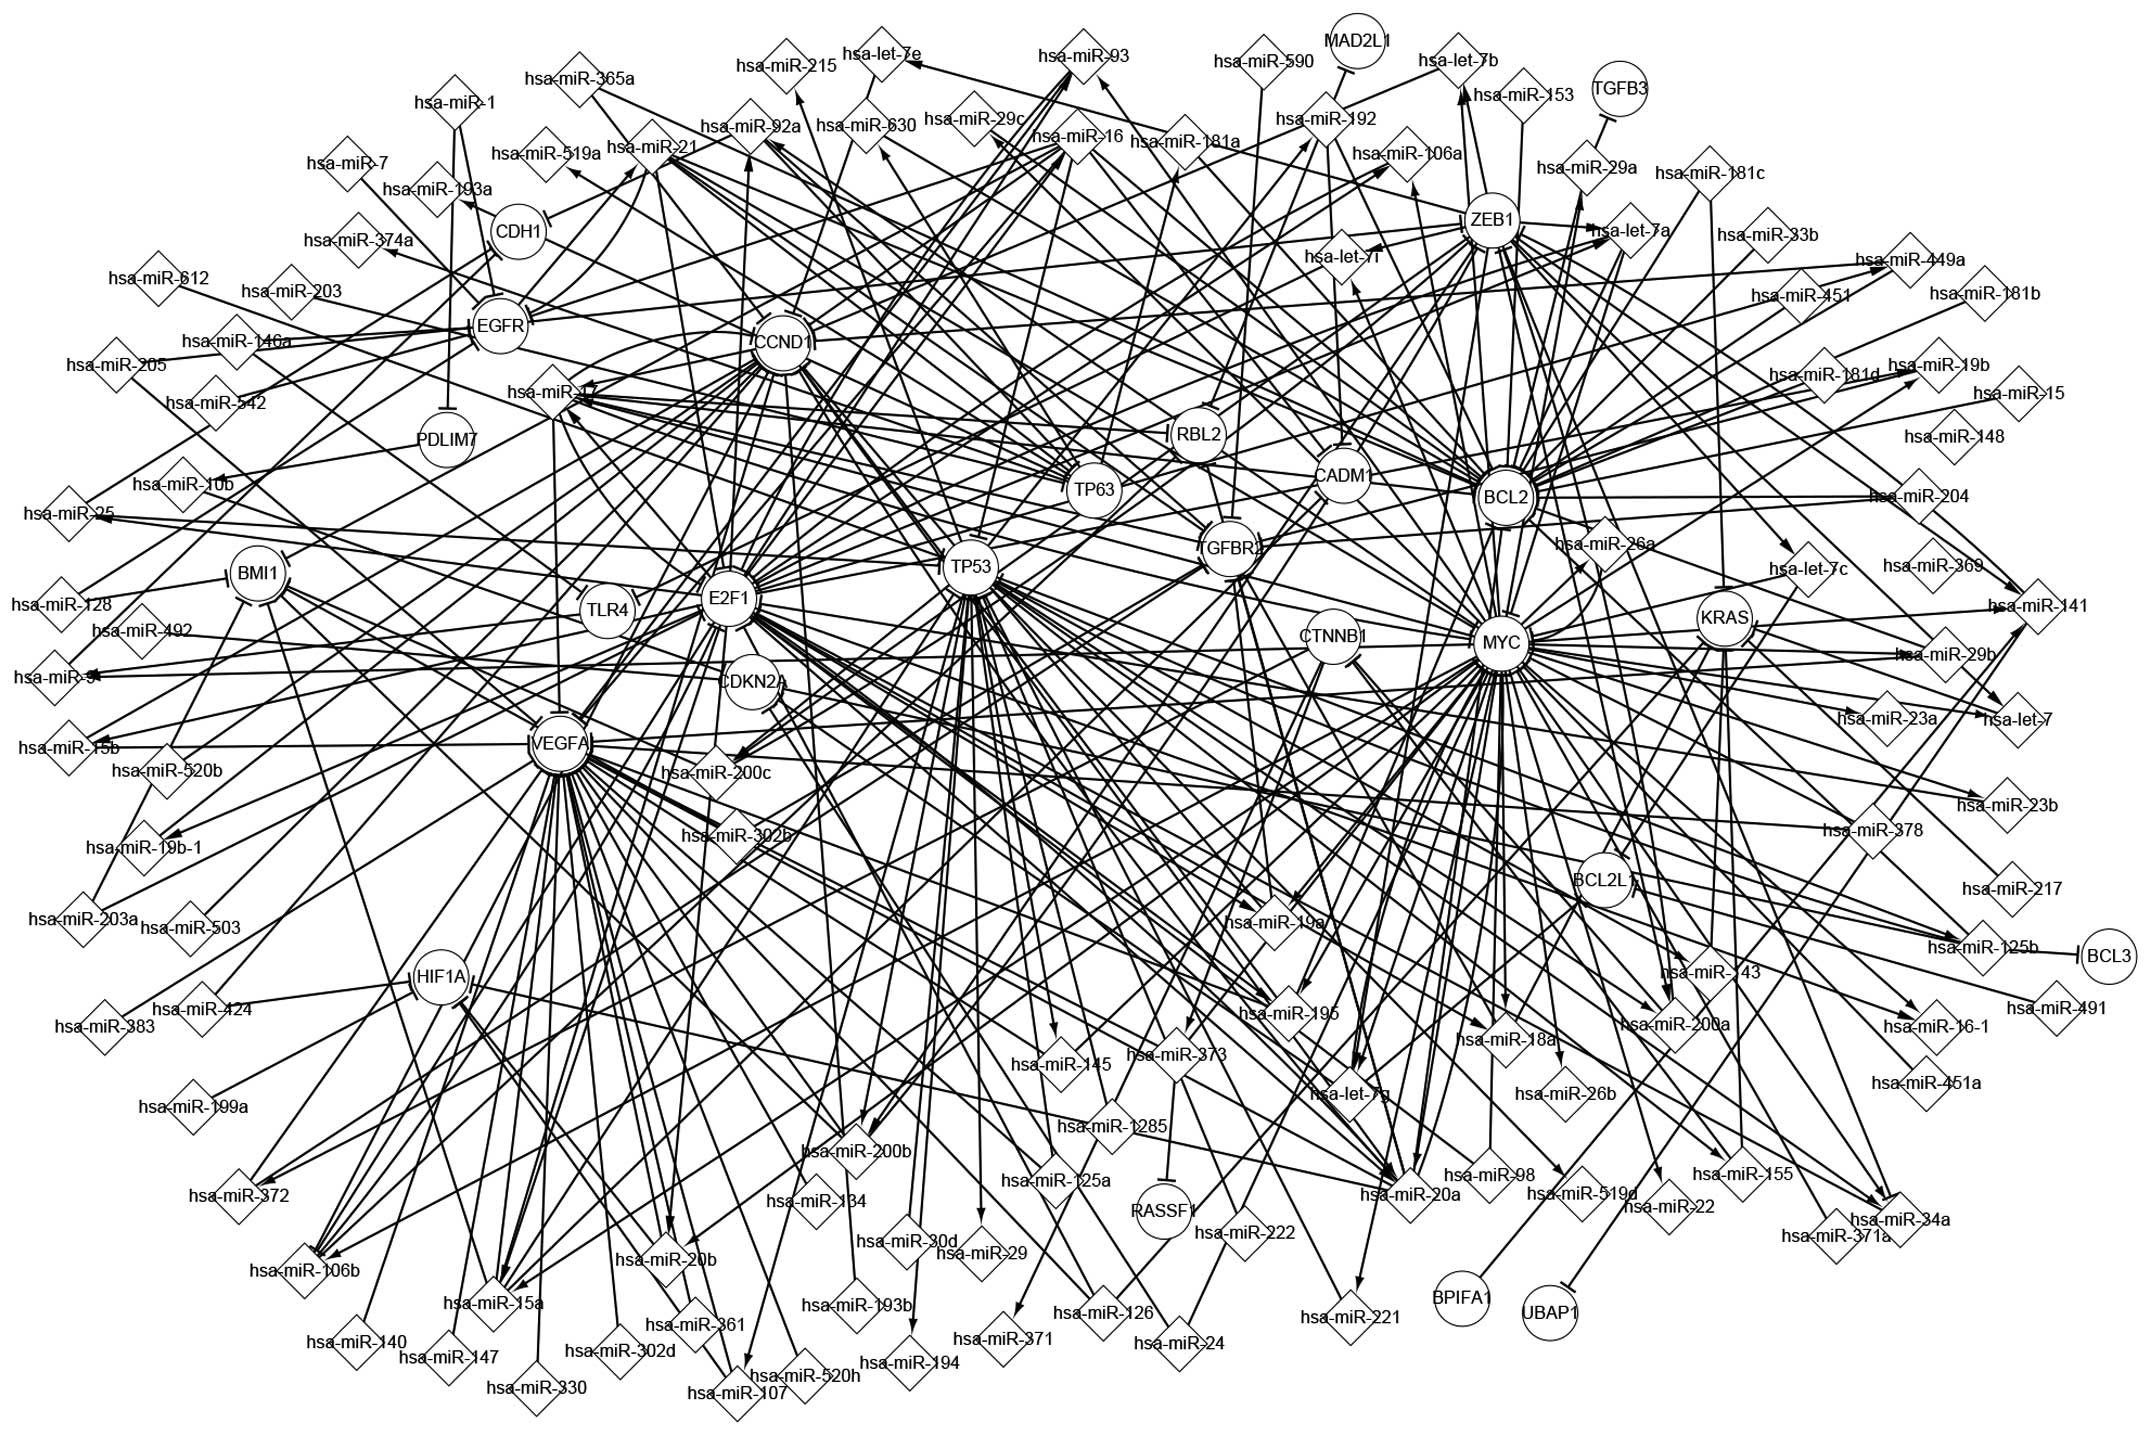 | Figure 2.Associated network in nasopharyngeal
carcinoma. MIR, microRNA; miR, microRNA; hsa, Homo sapiens;
HG, host gene; MAD2L1, mitotic arrest deficient-like 1; TGFB3,
transforming growth factor, beta 3; CDH1, cadherin 1; ZEB1, zinc
finger E-box binding homeobox 1; EGFR, epidermal growth factor
receptor; CCND1, cyclin D1; PDLIM7, PDZ and LIM domain 7 (enigma);
RBL2, retinoblastoma-like 2; TP63, tumor protein p63; CADM1, cell
adhesion molecule 1; BCL2, B-cell lymphoma 2; TGFBR2, transforming
growth factor, beta receptor II; BMI1, B lymphoma Mo-MLV insertion
region 1 homolog; TLR4, Toll-like receptor 4; E2F1, E2F
transcription factor 1; CDKN2A, cyclin-dependent kinase inhibitor
2A; CTNNB1, catenin beta 1; MYC, v-Myc avian myelocytomatosis viral
oncogene homolog; KRAS, Kirsten rat sarcoma viral oncogene homolog;
BCL2L11, BCL2-like 11; HIF1A, hypoxia inducible factor 1, alpha
subunit; RASSF, Ras association domain family; BPIFA1, bactericidal
permeability-increasing fold containing family A, member 1; UBAP1,
ubiquitin associated protein 1; BCL3, B-cell lymphoma 3. |
Global network of NPC
The global network includes the differentially
expressed network and the associated network, and contains more
regulatory associations than the above two networks. The global
network may be interpreted as an overall experimentally validated
biological network of NPC in the human body. However, due to their
complexity, the data associated with this network are not shown.
Instead, the present study focused on the analysis of the
differentially expressed and NPC-associated networks.
Host genes and their miRNAs in
NPC
In the differentially expressed network, all the
elements were differentially expressed, with the exception of host
genes. To analyze the associations between these elements, it must
be considered that the host genes are differentially expressed when
their miRNAs are differentially expressed. These associations are
represented in Fig. 3.
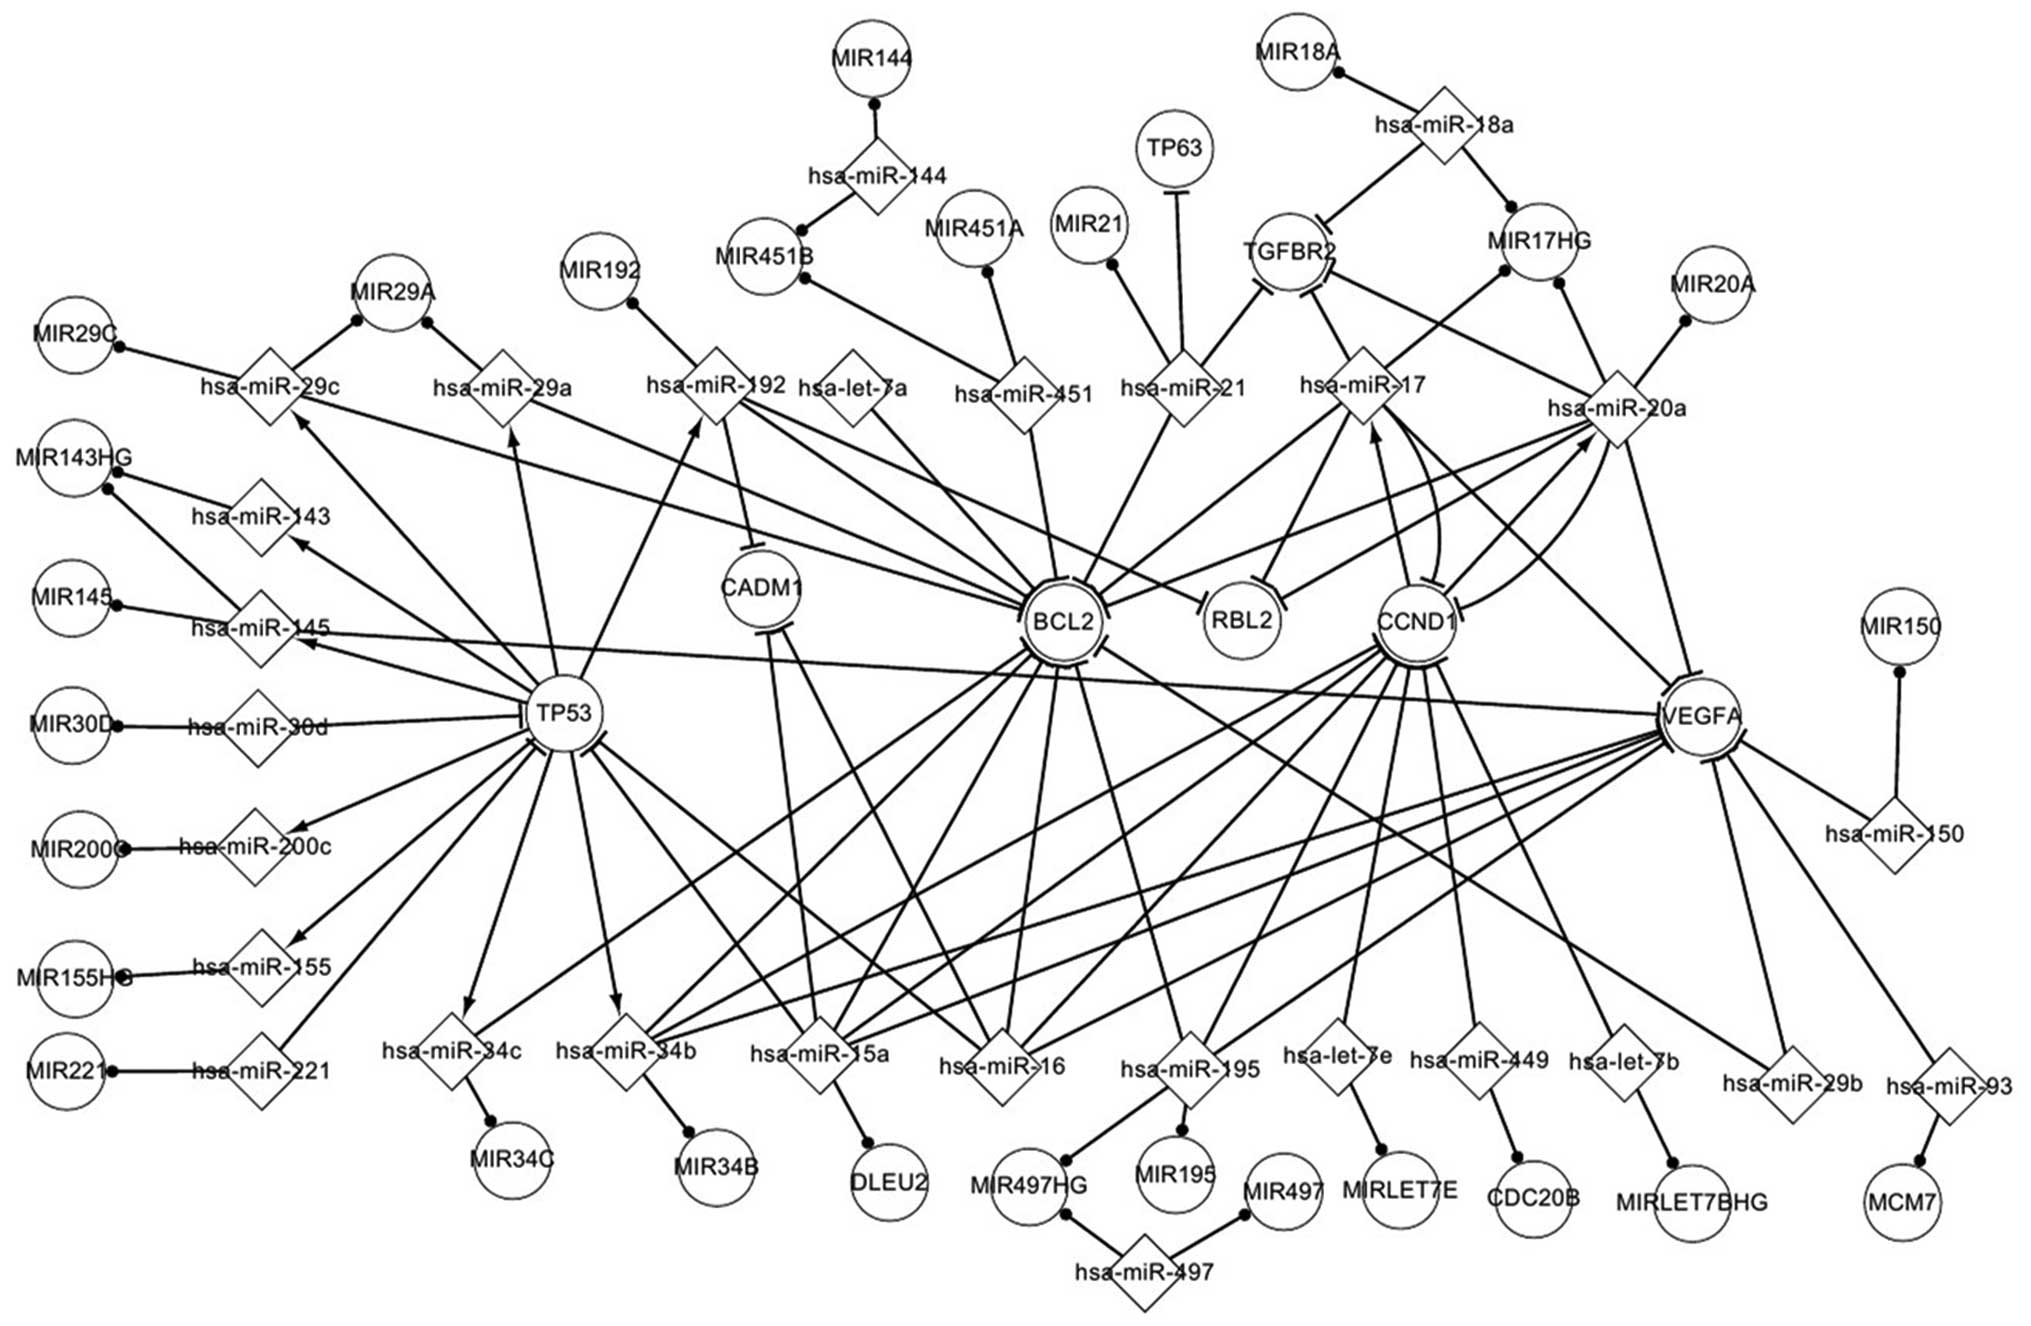 | Figure 3.Important associations between host
genes and their microRNAs in nasopharyngeal carcinoma. MIR,
microRNA; miR, microRNA; hsa, Homo sapiens; HG, host gene;
TP63, tumor protein p63; TGFBR2, transforming growth factor, beta
receptor II; CADM1, cell adhesion molecule 1; BCL2, B-cell lymphoma
2; RBL2, retinoblastoma-like 2; CCND1, cyclin D1; VEGFA, vascular
endothelial growth factor A; TP53, tumor protein p53; DLEU2,
deleted in lymphocytic leukemia 2; CDC20B, cell division cycle 20
homolog B; MCM7, minichromosome maintenance complex component
7. |
When the associations in the differentially
expressed network were analyzed, significant features were noted.
Thus, it was observed that one host gene may host several miRNAs
that target one gene each or target one gene together. For example,
MIR17HG hosts 3 miRNAs (hsa-miR-18a, hsa-miR-20a and hsa-miR-17),
which together target transforming growth factor beta receptor II
(TGFBR2). Deleted in lymphocytic leukemia 2 hosts hsa-miR-15a,
which targets TP53, CADM1, BCL2, CCND1 and VEGFA. It has been
previously suggested that the associations between host genes and
their miRNAs may aid to understand the pathogenesis of NPC
(3,7).
Transcriptional network of TFs and
differentially expressed miRNAs
The association between differentially expressed
miRNAs and TFs in NPC was analyzed in the present study. Fig. 4 represents the regulatory associations
existing between the relevant differentially expressed TFs and
miRNAs in NPC. As observed in Fig. 4,
these elements influence their successors by targeting or
regulating them. For example, CCND1 regulates 2 miRNAs (hsa-miR-17
and hsa-miR-20a), and is targeted by 9 miRNAs (hsa-miR-34b,
hsa-miR-15a, hsa-miR-16, hsa-miR-195, hsa-miR-7e, hsa-miR-449,
hsa-miR-7b, hsa-miR-17 and hsa-miR-20a). Thus, hsa-miR-17 and
CCND1, and hsa-miR-20a and CCND1, form a self-adaptation type of
association. CCND1 regulates hsa-miR-20a, which targets BCL2, RBL2,
CCND1 and VEGFA. TP53 is targeted by 4 miRNAs (hsa-miR-30d,
hsa-miR-221, hsa-miR-15a and hsa-miR-16), and regulates 9 miRNAs
(hsa-miR-192, hsa-miR-29a, hsa-miR-29c, hsa-miR-143, hsa-miR-145,
hsa-miR-200c, hsa-miR-155, hsa-miR-34c and hsa-miR-34b). These
miRNAs, alone or together, target other TFs, including hsa-miR-192,
hsa-miR-15a and hsa-miR-16, which target CADM1; hsa-miR-29c,
hsa-miR-29a, hsa-miR-192, hsa-miR-34c and hsa-miR-34b, which target
BCL2; hsa-miR-192, which targets RBL2; hsa-miR-34b, which targets
CCND1; and hsa-miR-34b, which targets VEGFA. Overall, these data
suggest that TP53 and CCND1 participate in NPC. These associations
between TFs and miRNAs may contribute to further understanding the
pathogenesis of NPC.
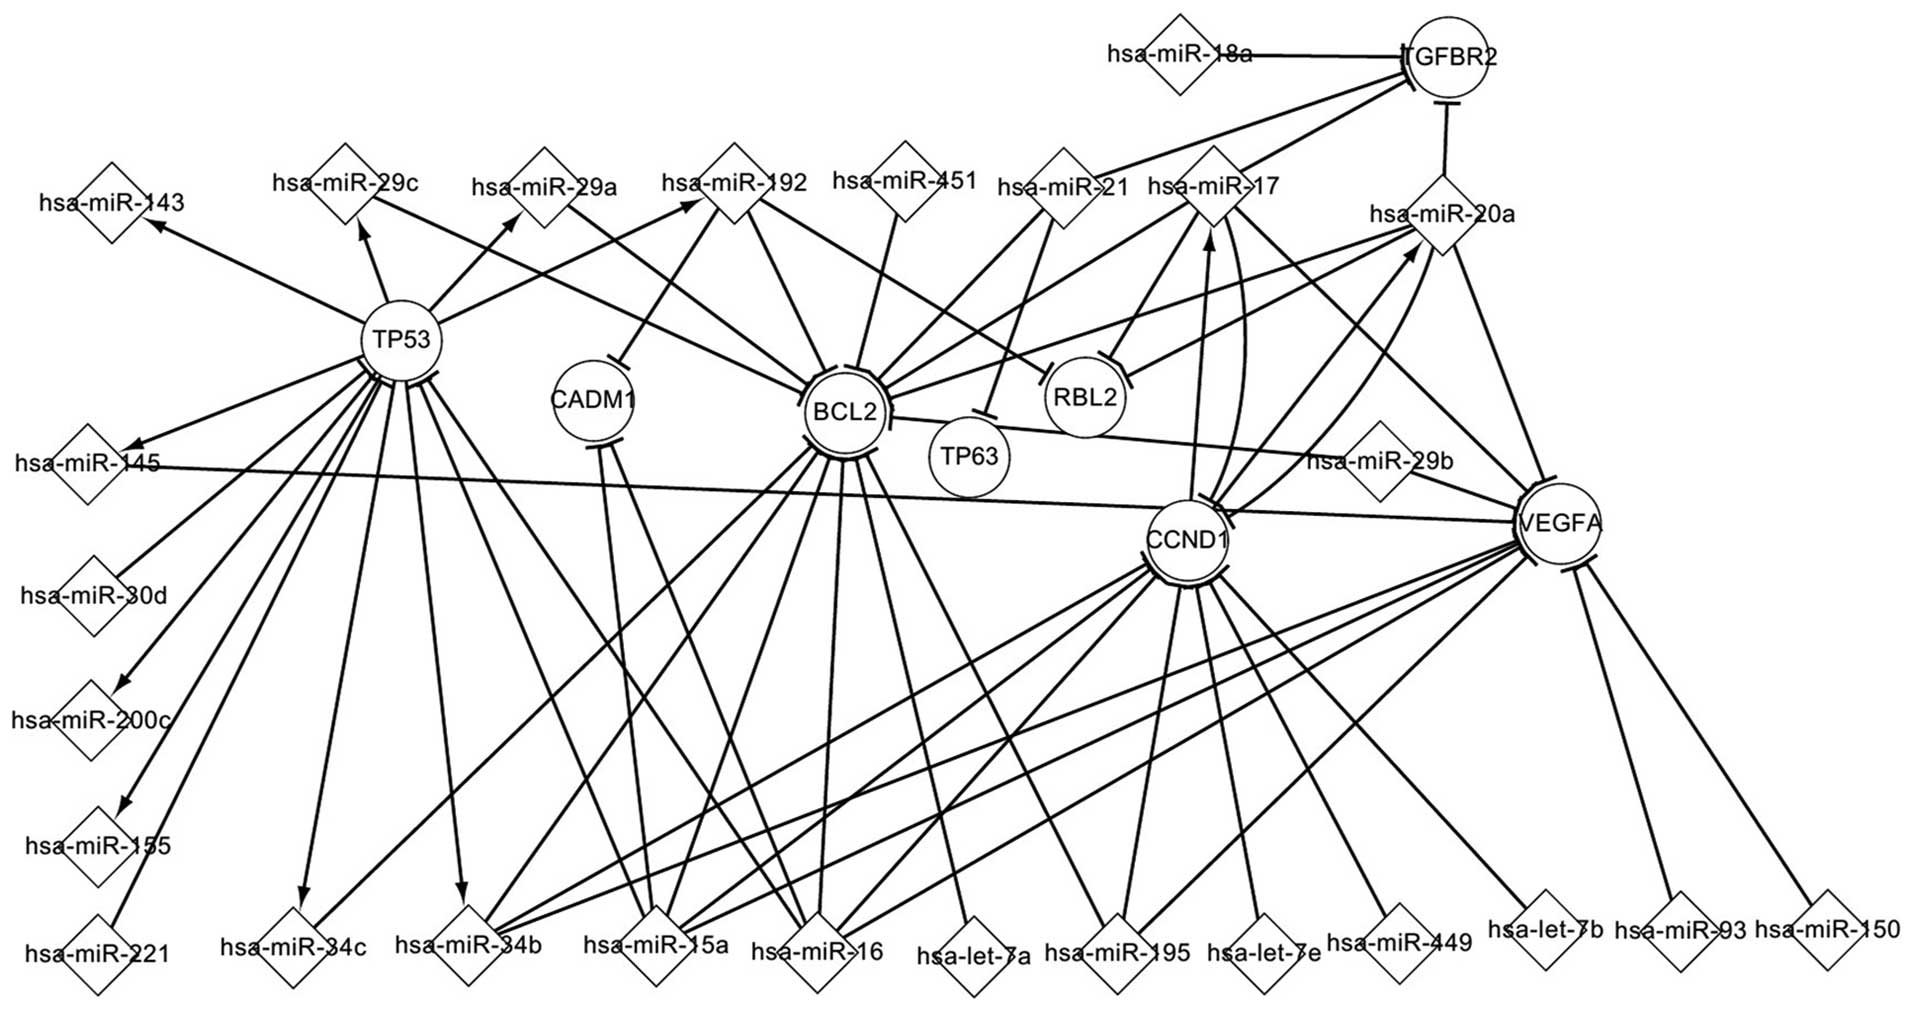 | Figure 4.Transcriptional network of
transcription factors and differentially expressed microRNAs in
nasopharyngeal carcinoma. MIR, microRNA; miR, microRNA; hsa,
Homo sapiens; HG, host gene; TGFBR2, transforming growth
factor, beta receptor II; TP53, tumor protein p53; CADM1, cell
adhesion molecule 1; BCL2, B-cell lymphoma 2; TP63, tumor protein
p63; RBL2, retinoblastoma-like 2; CCND1, cyclin D1; VEGFA, vascular
endothelial growth factor A. |
Regulatory pathways involving
differentially expressed genes
In order to describe the regulatory network of NPC
more clearly, the upstream and downstream nodes of the important
elements involved in NPC were extracted, including differentially
expressed genes, differentially expressed miRNAs and relevant TFs
identified by the P-Match method. Upon extraction of the successor
and precursor nodes of the differentially expressed genes of NPC
from the three constructed networks, the results obtained were
listed in a table, and certain pathways were highlighted.
Of the TFs identified, including CCND1 and TP53, the
present study only focused on CCND1 as a representative example.
Notably, CCND1 and its target miRNAs form a self-adaptation type of
association. In Table I, the
precursors and successors of CCND1 in the differentially expressed,
associated and global networks are listed. In the differentially
expressed network, CCND1 regulates 2 miRNAs and is targeted by 9
miRNAs. In the associated network, CCND1 regulates 4 miRNAs and is
targeted by 9 miRNAs. In the global network, CCND1 regulates 2
miRNAs and is targeted by 28 miRNAs. Notably, CCND1 exhibits a
self-adaptation type of association with a number of miRNAs. For
example, hsa-miR-20a and hsa-miR-17 target CCND1, while CCND1
regulates them. CCND1 can influence other genes via regulation of
its miRNAs. For example, CCND1 regulates hsa-miR-17, which in turn
targets RBL2 and VEGFA. In addition, CCND1 can also be influenced
by other genes. For example, TP53 regulates hsa-miR-34b, which
targets CCND1.
 | Table I.Regulatory associations between miRNAs
and the CCND1 gene. |
Table I.
Regulatory associations between miRNAs
and the CCND1 gene.
| miRNAs that target
CCND1 | miRNAs that are
regulated by CCND1 |
|---|
|
|
|---|
| Differentially
expressed network | Associated
network | Global network | Differentially
expressed network | Associated
network | Global network |
|---|
| hsa-let-7b | hsa-let-7b | hsa-let-7b | hsa-miR-17 | hsa-miR-17 | hsa-miR-17 |
| hsa-let-7e | hsa-let-7e | hsa-let-7e | hsa-miR-20a | hsa-miR-20a | hsa-miR-91 |
| hsa-miR-15a | hsa-miR-106b | hsa-miR-106b |
|
| hsa-miR-20 |
| hsa-miR-16 | hsa-miR-15a | hsa-miR-15a |
|
| hsa-miR-20a |
| hsa-miR-17 | hsa-miR-15b | hsa-miR-15b |
|
|
|
| hsa-miR-195 | hsa-miR-16 | hsa-miR-16 |
|
|
|
| hsa-miR-20a | hsa-miR-17 | hsa-miR-17 |
|
|
|
| hsa-miR-34b | hsa-miR-193b | hsa-miR-193b |
|
|
|
| hsa-miR-449 | hsa-miR-195 | hsa-miR-195 |
|
|
|
|
| hsa-miR-19b-1 | hsa-miR-19b-1 |
|
|
|
|
| hsa-miR-20a | hsa-miR-20a |
|
|
|
|
| hsa-miR-34b | hsa-miR-302a |
|
|
|
|
| hsa-miR-365a | hsa-miR-302c |
|
|
|
|
| hsa-miR-424 | hsa-miR-322 |
|
|
|
|
| hsa-miR-449 | hsa-miR-34a |
|
|
|
|
| hsa-miR-503 | hsa-miR-34b |
|
|
|
|
| hsa-miR-520b | hsa-miR-365a |
|
|
|
|
|
| hsa-miR-424 |
|
|
|
|
|
| hsa-miR-449 |
|
|
|
|
|
| hsa-miR-449a |
|
|
|
|
|
| hsa-miR-503 |
|
|
|
|
|
| hsa-miR-520b |
|
|
|
|
|
| hsa-miR-91 |
|
|
|
Regulatory pathways involving
differentially expressed miRNAs
The pathways of differentially expressed miRNAs were
analyzed as described above. As an example, the results obtained
for hsa-miR-17 are discussed below.
Upon analysis of the three constructed networks,
hsa-miR-17 was observed to display 6 types of adjacent nodes (3
predecessors and 3 successors). Other miRNAs were also identifed to
exhibit 6 types of adjacent nodes, including hsa-miR-34a,
hsa-miR-17, hsa-miR-192, hsa-miR-29a, hsa-miR-29c and hsa-miR-20a.
The present study only focused on hsa-miR-17, as a representative
example. In Table II, the precursors
and successors of hsa-miR-17 identified in the differentially
expressed, associated and global networks are listed. In the
differentially expressed network, there was 1 gene regulating
hsa-miR-17, which targeted 5 genes. In the associated network,
there were 2 genes regulating hsa-miR-17, which targeted 6 genes.
In the global network, there were 13 genes regulating hsa-miR-17,
which targeted 43 genes. In addition, CCND1 and hsa-miR-17 formed a
self-adaptation type of association, and hsa-miR-17 was capable of
influencing other miRNAs via TFs. For example, hsa-miR-17 targeted
CCND1, while CCND1 regulated hsa-miR-20a. Furthermore, hsa-miR-17
may also be influenced by other miRNAs. For example, hsa-miR-195
targets CCND1, which regulates hsa-miR-17.
| Table II.Regulatory associations between
hsa-miR-17 and its target genes. |
Table II.
Regulatory associations between
hsa-miR-17 and its target genes.
| Genes that regulate
hsa-miR-17 | Target genes of
hsa-miR-17 |
|---|
|
|
|---|
| Differentially
expressed network | Associated
network | Global network | Differentially
expressed network | Associated
network | Global network |
|---|
| CCND1 | CCND1 | CCND1 | BCL2 | BCL2 | APP, BCL2,
BCL2L11 |
|
| MYC | E2F1 | CCND1 | CCND1 | BMPR2, CCL1,
CCND1 |
|
|
| MIR17HG | RBL2 | RBL2 | CCND2, CDKN1A,
DNAJC27 |
|
|
| MYC | VEGFA | VEGFA | E2F1, E2F3,
FBXO31 |
|
|
| MYCN | TGFBR2 | TGFBR2 | GPR137B, GPX2,
ICAM1 |
|
|
| NFKB1 |
| MYC | JAK1, MAP3K12,
MAPK9 |
|
|
| NKX2–5 |
|
| MEF2D, MUC17,
MYC |
|
|
| SPI1 |
|
| NCOA3, NPAT,
OBFC2A |
|
|
| STAT5B |
|
| PKD2, PTEN,
PTPRO |
|
|
| TLX1 |
|
| RB1, RBL1,
RBL2 |
|
|
| TLX3 |
|
| RUNX1, SELE,
SMAD4 |
|
|
| TNF |
|
| SOD2, TGFBR2,
THBS1 |
|
|
|
|
|
| TNFSF12, TXNRD2,
VEGFA |
|
|
|
|
|
| VIM, WEE1, YES1,
ZNFX1 |
Other miRNAs were identified to exhibit <6 types
of adjacent nodes. For example, hsa-miR-29b displayed 5 types of
adjacent nodes, and had no successors in the differentially
expressed network. These miRNAs can be analyzed as described
above.
Regulatory pathways involving relevant
TFs
Relevant TFs, which were extracted with the P-Match
method, were analyzed in the associated network. A number of these
TFs, including zinc finger E-box binding homeobox 1 (ZEB1) and E2F
transcription factor 1 (E2F1), form self-adaptation associations
with their miRNAs. Certain TFs have 3 types of successors
(differentially expressed, associated and global), in addition to 3
types of predecessors. As a representative example, ZEB1 is
discussed in the present study. In Table III, the 3 types of successors and 3
types of predecessors of ZEB1 are listed. ZEB1 is targeted by 1
differentially expressed miRNA (hsa-miR-200c), and regulates 4
differentially expressed miRNAs (hsa-let-7a, hsa-let-7b, hsa-let-7e
and hsa-miR-200c). In addition, ZEB1 is targeted by 5 associated
miRNAs, and regulates 13 associated miRNAs, while 17 miRNAs target
ZEB1 and 21 miRNAs are regulated by ZEB1 in the global network.
According to Table III, ZEB1 forms
self-adaptation associations with hsa-miR-141, hsa-miR-200a,
hsa-miR-200b and hsa-miR-200c in the associated network. Other TFs
that exhibit <3 types of successors or predecessors in the
associated network can be analyzed as described above.
| Table III.Regulatory associations between
miRNAs and the ZEB1 gene. |
Table III.
Regulatory associations between
miRNAs and the ZEB1 gene.
| miRNAs that target
ZEB1 | miRNAs that are
regulated by ZEB1 |
|---|
|
|
|---|
| Differentially
expressed network | Associated
network | Global network | Differentially
expressed network | Associated
network | Global network |
|---|
| hsa-miR-200c | hsa-miR-141 | hsa-miR-141 | hsa-let-7a | hsa-let-7 | hsa-let-7 |
|
| hsa-miR-200a | hsa-miR-200 | hsa-let-7b | hsa-let-7a | hsa-let-7a |
|
| hsa-miR-200b | hsa-miR-200a | hsa-let-7e | hsa-let-7b | hsa-let-7a-1 |
|
| hsa-miR-200c | hsa-miR-200a | hsa-miR-200c | hsa-let-7c | hsa-let-7a-2 |
|
| hsa-miR-205 | hsa-miR-200a |
| hsa-let-7d | hsa-let-7a-3 |
|
|
|
hsa-miR-200a-3p |
| hsa-let-7e | hsa-let-7b |
|
|
| hsa-miR-200b |
| hsa-let-7g | hsa-let-7c |
|
|
| hsa-miR-200b |
| hsa-let-7i | hsa-let-7d |
|
|
| hsa-miR-200b |
| hsa-miR-141 | hsa-let-7e |
|
|
|
hsa-miR-200b-3p |
| hsa-miR-200a | hsa-let-7f |
|
|
| hsa-miR-200c |
| hsa-miR-200b | hsa-let-7f-1 |
|
|
| hsa-miR-200c |
| hsa-miR-200c | hsa-let-7f-2 |
|
|
| hsa-miR-200c |
| hsa-miR-34a | hsa-let-7g |
|
|
|
hsa-miR-200c-3p |
|
| hsa-let-7i |
|
|
| hsa-miR-205 |
|
| hsa-miR-141 |
|
|
| hsa-miR-205 |
|
| hsa-miR-200a |
|
|
| hsa-miR-429 |
|
| hsa-miR-200b |
|
|
|
|
|
| hsa-miR-200c |
|
|
|
|
|
| hsa-miR-34 |
|
|
|
|
|
| hsa-miR-34a |
|
|
|
|
|
| hsa-miR-34b |
Discussion
The signaling pathways identified in the
differentially expressed network constructed in the present study
suggest that the TP53 and CCND1 signaling pathways should be
further investigated in connection with NPC in future studies,
since CCND1 forms self-adaptation associations with hsa-miR-17 and
hsa-miR-20a in the differentially expressed network. Furthermore,
both hsa-miR-17 and hsa-miR20a target TGFBR2. In addition, TP53 was
observed to regulate 9 differentially expressed miRNAs, and these
miRNAs (alone or together) targeted CADM1, BCL2, RBL2, CCND1 and
VEGFA. These significant associations may contribute to further
understanding the mechanism of NPC pathogenesis. In addition, the
TFs identified by the P-Match method suggest potential associations
between differentially expressed miRNAs and TFs, which remain to be
experimentally validated.
In conclusion, three regulatory networks were
constructed in the present study, which revealed the associations
between the different elements involved in NPC. Experimentally
validated data regarding NPC was collected in order to build these
networks. The associations observed in the three networks were
analyzed, including various successors and precursors of a number
of key elements involved in NPC. All the elements in the
differentially expressed network were differentially expressed,
which suggests that the tumorigenesis of NPC may be prevented by
modifying the aberrant expression exhibited by these differentially
expressed elements. In addition, the P-Match method was used to
elaborate certain hypotheses, which may provide valuable
information for future studies on experimentally validated data of
NPC.
Acknowledgements
The present study was supported by grants from the
National Natural Science Foundation of China (Beijing, China; grant
no. 60973091) and the Science and Technology Development Plan of
Jilin Province (Changchun, China; grant no. 20130101166JC).
Glossary
Abbreviations
Abbreviations:
|
miRNA
|
microRNA
|
|
TFs
|
transcription factors
|
|
targets
|
target genes
|
|
NCBI
|
National Center for Biotechnology
Information
|
|
TFBSs
|
transcription factor binding sites
|
References
|
1
|
Wong EY, Wong SC, Chan CM, Lam EK, Ho LY,
Lau CP, Au TC, Chan AK, Tsang CM, Tsao SW, et al: TP53-induced
glycolysis and apoptosis regulator promotes proliferation and
invasiveness of nasopharyngeal carcinoma cells. Oncol Lett.
9:569–574. 2015.PubMed/NCBI
|
|
2
|
Pan C, Tao Y, Zhao M, Li W, Huang Z, Gao
J, Wu Y, Yu J, Wu P, Xia Y and Lu J: Comparative serum proteomic
analysis involving liver organ-specific metastasis-associated
proteins of nasopharyngeal carcinoma. Exp Ther Med. 3:1055–1061.
2012.PubMed/NCBI
|
|
3
|
Chekmenev DS, Haid C and Kel AE: P-Match:
Transcription factor binding site search by combining patterns and
weight matrices. Nucleic Acids Res. 33:W432–W437. 2005. View Article : Google Scholar : PubMed/NCBI
|
|
4
|
Hobert O: Gene regulation by transcription
factors and microRNAs. Science. 319:1785–1786. 2008. View Article : Google Scholar : PubMed/NCBI
|
|
5
|
Tran DH, Satou K, Ho TB and Pham TH:
Computational discovery of miR-TF regulatory modules in human
genome. Bioinformation. 4:371–377. 2010. View Article : Google Scholar : PubMed/NCBI
|
|
6
|
Song C, Xu Z, Jin Y, Zhu M, Wang K and
Wang N: The network of microRNAs, transcription factors, target
genes and host genes in human renal cell carcinoma. Oncol Lett.
9:498–506. 2015.PubMed/NCBI
|
|
7
|
Baskerville S and Bartel DP: Microarray
profiling of microRNAs reveals frequent coexpression with
neighboring miRNAs and host genes. RNA. 11:241–247. 2005.
View Article : Google Scholar : PubMed/NCBI
|
|
8
|
Guo H, Ingolia NT, Weissman JS and Bartel
DP: Mammalian microRNAs predominantly act to decrease target mRNA
levels. Nature. 466:835–840. 2010. View Article : Google Scholar : PubMed/NCBI
|
|
9
|
Rodriguez A, Griffiths-Jones S, Ashurst JL
and Bradley A: Identification of mammalian microRNA host genes and
transcription units. Genome Res. 14:1902–1910. 2004. View Article : Google Scholar : PubMed/NCBI
|
|
10
|
Wang J, Lu M, Qiu C and Cui Q: TransmiR: A
transcription factor-microRNA regulation database. Nucleic Acids
Res. 38(Suppl 1): D119–D122. 2010. View Article : Google Scholar : PubMed/NCBI
|
|
11
|
Kozomara A and Griffiths-Jones S: miRBase:
Integrating microRNA annotation and deep-sequencing data. Nucleic
Acids Res. 39:D152–D157. 2011. View Article : Google Scholar : PubMed/NCBI
|
|
12
|
Li T, Chen JX, Fu XP, Yang S, Zhang Z,
Chen KhH and Li Y: microRNA expression profiling of nasopharyngeal
carcinoma. Oncol Rep. 25:1353–1363. 2011.PubMed/NCBI
|
|
13
|
Safran M, Dalah I, Alexander J, Rosen N,
Iny Stein T, Shmoish M, Nativ N, Bahir I, Doniger T, Krug H, et al:
GeneCards Version 3: The human gene integrator. Database (Oxford).
2010:baq0202010. View Article : Google Scholar : PubMed/NCBI
|
|
14
|
Fujita PA, Rhead B, Zweig AS, Hinrichs AS,
Karolchik D, Cline MS, Goldman M, Barber GP, Clawson H, Coelho A,
et al: The UCSC Genome Browser database: Update 2011. Nucleic Acids
Res. 39:D876–D882. 2011. View Article : Google Scholar : PubMed/NCBI
|
|
15
|
Bao J, Li D, Wang L, Wu J, Hu Y, Wang Z,
Chen Y, Cao X, Jiang C, Yan W and Xu C: MicroRNA-449 and
microRNA-34b/c function redundantly in murine testes by targeting
E2F transcription factor-retinoblastoma protein (E2F-pRb) pathway.
J Biol Chem. 287:21686–21698. 2012. View Article : Google Scholar : PubMed/NCBI
|


