Introduction
Colorectal cancer (CRC) is one of the most common
causes of cancer-associated mortality and is the second and third
leading cause of cancer-associated mortality in Western countries
and the USA, respectively (1,2). In 2014, ~137,000 individuals in the USA
were diagnosed with CRC and ~50,000 patients succumbed to CRC. In
addition, more than one-third of all CRC-associated mortalities
(29% in men and 43% in women) occurred in individuals aged ≥80
years (1). Lynch syndrome (LS),
previously termed hereditary non-polyposis colorectal cancer
(HNPCC), accounts for 3% of all CRCs and is caused by a germline
mutation in one of the mismatch repair (MMR) genes mutL homolog 1
(MLH1), mutS homolog (MSH) 2, MSH6 and PMS1
homolog 2, mismatch repair system component (PMS2), and LS
is the most common hereditary form of CRC (3–5).
Numerous studies have been published since the first
case of hereditary CRC was reported in 1861 (6). Numerous microRNAs (miRNAs) and genes
involved in the tumorigenesis of LS have been identified, such as
miR-622, miR-1238 (3), insulin like
growth factor 2 (7),
phosphatase and tensin homolog (PTEN) (8), and PMS2 (4). In addition, certain cellular signaling
pathways involved in the tumorigenesis of LS have been identified,
including the AKT/mammalian target of rapamycin (mTOR) signaling
pathways (8), axon guidance (9), and DNA repair pathways, such as the p53
pathway (10). In LS, somatic
mutations of PTEN, which results in the upregulation of the
AKT pathway, have been found and intervention against AKT or
towards downstream targets, such as mTOR, resulted in a decreased
incidence of LS, suggesting that AKT may be an effective approach
for the prevention of HNPCC in patients (8,9). However,
the molecular mechanisms of LS remain to be elucidated.
In the study performed by Balaguer et al
(3), hsa-miR-622, hsa-miR-1238 and
hsa-miR-192 were identified as differentially expressed miRNAs
(DEMs) in LS, compared with the sporadic microsatellite
instability. However, the signatures of the identified target genes
(TGs) of DEMs were not analyzed. In order to study the regulatory
mechanisms of LS, the microarray data deposited by Balaguer et
al were downloaded to identify key DEMs and their TGs. In
addition, functional and pathway enrichment analyses were performed
for TGs.
Materials and methods
miRNA microarray data
miRNA expression microarray data of GSE30454
(3) was downloaded from the Gene
Expression Omnibus (GEO; http://www.ncbi.nlm.nih.gov/geo/), based on platform
GPL8179 (Illumina Human v2 MicroRNA expression beadchip; Illumina
Inc., San Diego, CA, USA). A total of 20 normal colonic tissue
samples (N-C group) and 13 LS tumor samples, consisting of 4 with a
germline mutation in MLH1, 5 with a germline mutation in
MSH2, 3 with a germline mutation in MSH6 and 1 with
EpCam deletion (LS group) were selected (3). The raw data and the probe annotation
files were downloaded for further analysis.
Data preprocessing and identification
of LS-associated DEMs
Firstly, probe sets were mapped to the corresponding
miRNAs. If there were multiple probe sets that corresponded to the
same miRNA, the expression values of those probe sets were
averaged. Then, the t-test method in the Linear Models for
Microarray Data package of R (11)
(limma version 3.22.7; www.bioconductor.org/packages/3.0/bioc/html/limma.html)was
used to identify the DEMs between the N-C and LS groups. Next, the
t-test P-value was adjusted to the false discovery rate (FDR) by
the Benjamini-Hochberg procedure (12). The cut-off criteria for DEMs were
|log2 fold change (FC) |>1 and FDR <0.01. Finally,
the LS-associated DEMs were screened using the Human microRNA
Disease Database (http://cmbi.bjmu.edu.cn/hmdd), which is a collection
of experimentally supported human miRNA and disease associations
(13).
Predication of TGs
From the standpoint of high confidence, the TGs of
the LS-associated DEMs were predicted using 5 databases, as
follows: miRanda (14); MirTarget2
(15); PicTar (16); PITA (17); and TargetScan (18). The intersections of the 5 databases
were regarded as the final predicted TGs.
Functional and pathway enrichment
analysis
Gene ontology (GO) analysis (http://www.geneontology.org/) is a functional method
for the analysis of large-scale transcriptomic or genomic data
(19). The Kyoto Encyclopedia of
Genes and Genomes (KEGG) pathway database (http://www.genome.jp/kegg/pathway.html) contains
information on the mechanism of molecules or genes (20). In order to investigate the biofunction
of TGs in tumor progression, the Database for Annotation,
Visualization and Integrated Discovery (DAVID; https://david.ncifcrf.gov/), a high-throughput and
integrated data-mining environment (21), was used to perform the GO functional
and KEGG pathway enrichment analyses for the TGs, based on the
hypergeometric distribution. P<0.01 was selected as the
threshold.
Identification of transcription
factors (TFs), tumor-associated genes (TAGs) and tumor suppressor
genes (TSGs) among TGs
The TRANSFAC database (http://www.gene-regulation.com/pub/databases.html) is
a database of eukaryotic transcription-regulating DNA sequence
elements and the TFs binding to and acting through these elements
(22). In order to determine whether
the TGs had transcription regulation function, the TRANSFAC
database was used to identify the TFs.
The Tumor Associated Gene (TAG) database (http://www.binfo.ncku.edu.tw/TAG/) is a
semi-automatic information retrieving engine that was built to
collect specific information on TGs from various resources
(23). Additionally, Tumor Suppressor
Gene (TSGene) database (http://bioinfo.mc.vanderbilt.edu/TSGene/) provides not
only a comprehensive resource of TSGs for studies on cancer and to
further experimental design, but also a comprehensive TSG catalog
biology-based analyses of advanced systems (24). In order to identify the functions of
the TGs that may function during genesis of LS, the TSGene and TAG
databases were used to perform the identification of TSGs and TAGs
among the TGs, respectively.
Construction of regulatory network. DEMs with
>100 TGs were considered as key DEMs. According to the
regulatory associations between key DEMs and TGs, the regulatory
network containing key DEMs and their TGs was constructed and
visualized by Cytoscape 2.8.2 software (25).
Statistical analysis
The t-test method in the Linear Models for
Microarray Data package of R (limma, version 3.22.7) was used for
the DEM selection. The P-value is adjusted as the FDR, and the
selection criteria were |log2 fold change (FC)|>1 and FDR
<0.01. DAVID, based on the hypergeometric distribution, was used
to perform GO and KEGG pathway enrichment analyses. P<0.01 was
considered to indicate a statistically significant difference.
Results
DEM identification and TG
predication
A total of 159 DEMs were identified between the N-C
and LS groups. There were 105 upregulated DEMs and 54 downregulated
DEMs, of which only 13 DEMs were predicted to be associated with
LS. Furthermore, 3 key DEMs were identified, including 2
upregulated miRNAs (hsa-miR-137 and hsa-miR-590-3p) and 1
downregulated miRNA (hsa-miR-520e). A total of 159 TGs for
hsa-miR-137, including NCK adaptor protein 1 (NCK1), AKT
serine/threonine kinase 2 (AKT2), Krüppel-like factor
(KLF) 4, metal-responsive transcription factor 1
(MTF1) and zinc finger protein (ZNF) 217, 273 TGs for
hsa-miR-590-3p, including NCK1, hypoxia-inducible factor 1α
(HIF1A), KLF13, nuclear factor I B (NFIB) and
ZNF800 and 132 TGs for hsa-miR-520e, such as KLF13,
NFIB, MTF1, ZNF800 and rapamycin-insensitive
companion of mTOR (RICTOR), were identified.
Functional and pathway enrichment
analysis
Through the GO functional enrichment analysis of
biological processes, certain TGs, including NCK1, HIF1A, MTF1,
KLF13, KLF4 and AKT2, were found to be involved in the
regulation of gene expression (P<0.001). Certain TGs, including
NCK1, MTF1, KLF4, KLF13, HIF1A, AKT2 and RICTOR, were
involved in the regulation of macromolecule metabolic processes
(P<0.001) and the regulation of primary metabolic processes
(P<0.001) (Table I). Through the
GO functional enrichment analysis of cellular components, certain
TGs, including MTF1, KLF13, NCK1, HIF1A and AKT2,
were found to be enriched in the nucleus (P<0.001). Certain TGs,
including HIF1A, MTF1, KLF4, KLF13 and ZNF800, were
enriched in intracellular membrane-bound organelles (P<0.001);
certain TGs, including MTF1, KLF13, NCK1, HIF1A and
ZNF800, were enriched in membrane-bound organelles
(P<0.001) (Table I). Through the
GO functional enrichment analysis of molecular function, certain
TGs, such as MTF1, KLF4, KLF13, HIF1A, ZNF800, and cancer
susceptibility candidate 3 (CASC3), were involved in nucleic
acid binding (P<0.001). In addition, certain TGs, such as
MTF1, KLF4, TEA domain transcription factor 1
(TEAD1), zinc finger protein 148, and HIF1A, were
involved in nucleic acid binding TF activity (P<0.001). Certain
TGs, such as MTF1, KLF4, KLF13, HIF1A, AKT2 and
ZNF800, were involved in heterocyclic compound binding
(P<0.001) (Table I).
 | Table I.GO enrichment analysis of the target
genes. |
Table I.
GO enrichment analysis of the target
genes.
| Category | ID | Description | Count | Genes | P-value |
|---|
| Biological | GO:0010468 | Regulation of gene
expression | 183 | MTF1, NCK1,
AKT2, HIF1A, ZNF800, KLF4, KLF13 | <0.001 |
| process | GO:0060255 | Regulation of
macromolecule metabolic process | 211 | ZNF800, EPHA7,
NCK1, AKT2, MTF1, RICTOR, HIF1A, KLF4, KLF13 | <0.001 |
|
| GO:0080090 | Regulation of
primary metabolic process | 216 | ZNF800, NCK1,
KLF4, KLF13, RICTOR, HIF1A, AKT2, MTF1 | <0.001 |
|
| GO:0031323 | Regulation of
cellular metabolic process | 216 | ZNF800, KLF4,
KLF13, HMGA2, RICTOR, HIF1A, EPHA7, AKT2, MTF1 | <0.001 |
|
| GO:0044260 | Cellular
macromolecule metabolic process | 286 | ZNF146, HMGA2,
NCK1, HIF1A, RICTOR, KLF4, KLF13, EPHA7, MTF1 | <0.001 |
| Cellular | GO:0005634 | Nucleus | 274 | KLF4, KLF13,
MEF2A, NCK1, ZNF800, HIF1A, AKT2, MTF1 | <0.001 |
| component | GO:0031981 | Nuclear lumen | 109 | KLF4, MEF2A,
HMGA2, USP7, HIF1A, MTF1, FYN | <0.001 |
|
| GO:0044428 | Nuclear part | 123 | KLF4, TEAD1,
MTF1, MEF2A, ZNF146, HMGA2, HIF1A, RNF6, NCK1 | <0.001 |
|
| GO:0043231 | Intracellular
membrane-bounded organelle | 342 | KLF4, KLF13,
TEAD1, ZNF800, HIF1A, MTF1 | <0.001 |
|
| GO:0043227 | Membrane-bounded
organelle | 342 | NCK1, ZNF800,
HIF1A, KLF4, KLF13, MTF1 | <0.001 |
| Molecular | GO:0003676 | Nucleic acid
binding | 168 | ZNF800, KLF4,
KLF13, ZNF146, HMGA2, CASC3, MTF1 | <0.001 |
| function | GO:0001071 | Nucleic acid
binding transcription factor activity | 78 | TEAD1, MEF2A,
HIF1A, HMGA2, MTF1, KLF4 | <0.001 |
|
| GO:1901363 | Heterocyclic
compound binding | 230 | EPHA7, KLF4,
KLF13, ZNF800, HIF1A, AKT2, MTF1 | <0.001 |
|
| GO:0003700 | Sequence-specific
DNA binding transcription factor activity | 77 | HIF1A, MEF2A,
HMGA2, ZNF148, ZNF396, MTF1, KLF4 | <0.001 |
|
| GO:0097159 | Organic cyclic
compound binding | 231 | KLF4, KLF13,
MTF1 HIF1A, AKT2, EPHA7 | <0.001 |
According to the KEGG pathway enrichment analysis,
TGs were significantly enriched in 3 pathways: mTOR signaling
pathway, including RICTOR, HIF1A and AKT2
(P=0.001); RNA transport, including eukaryotic translation
initiation factor (EIF) 3 subunit E, CASC3 and
EIF3J (P=0.008); and axon guidance, including NCK1,
FYN proto-oncogene, Src family tyrosine kinase (FYN) and EPH
receptor A7 (EPHA7) (P=0.010) (Table II).
| Table II.Kyoto Encyclopedia of Genes and
Genomes pathway enrichment of the target genes. |
Table II.
Kyoto Encyclopedia of Genes and
Genomes pathway enrichment of the target genes.
| ID | Description | Count | Genes | P-value |
|---|
| 4150 | mTOR signaling
pathway | 6 | CAB39, RICTOR,
HIF1A, AKT2, RPS6KA3, ULK1 | 0.001 |
| 3013 | RNA transport | 9 | PAIP1, EIF3E,
EIF4A2, EIF5, PABPC1, CASC3, EIF3J, NXT2, RANBP2 | 0.008 |
| 4360 | Axon guidance | 8 | NCK1, FYN,
EPHA7, SEMA3C, SEMA3E, PAK7, PPP3R1, CFL2 | 0.010 |
Identification of TFs, TSGs and
TAGs
A total of 12 TGs, consisting of TEAD1,
ZNF146, high mobility group AT-hook 2 (HMGA2),
FYN, v-crk avian sarcoma virus CT10 oncogene homolog-like,
receptor-like tyrosine kinase, ZNF217, KIT proto-oncogene
receptor tyrosine kinase, AKT2, chromosome segregation 1
like, interferon regulatory factor 2 and B-cell CLL/lymphoma 6
(BCL6), were identified as oncogenes, according to the TSGene
database and TAG database. Among these identified oncogenes, 4
genes, consisting of TEAD1, ZNF146, HMGA2 and BCL6,
were identified as TFs based on the TRANSFAC database.
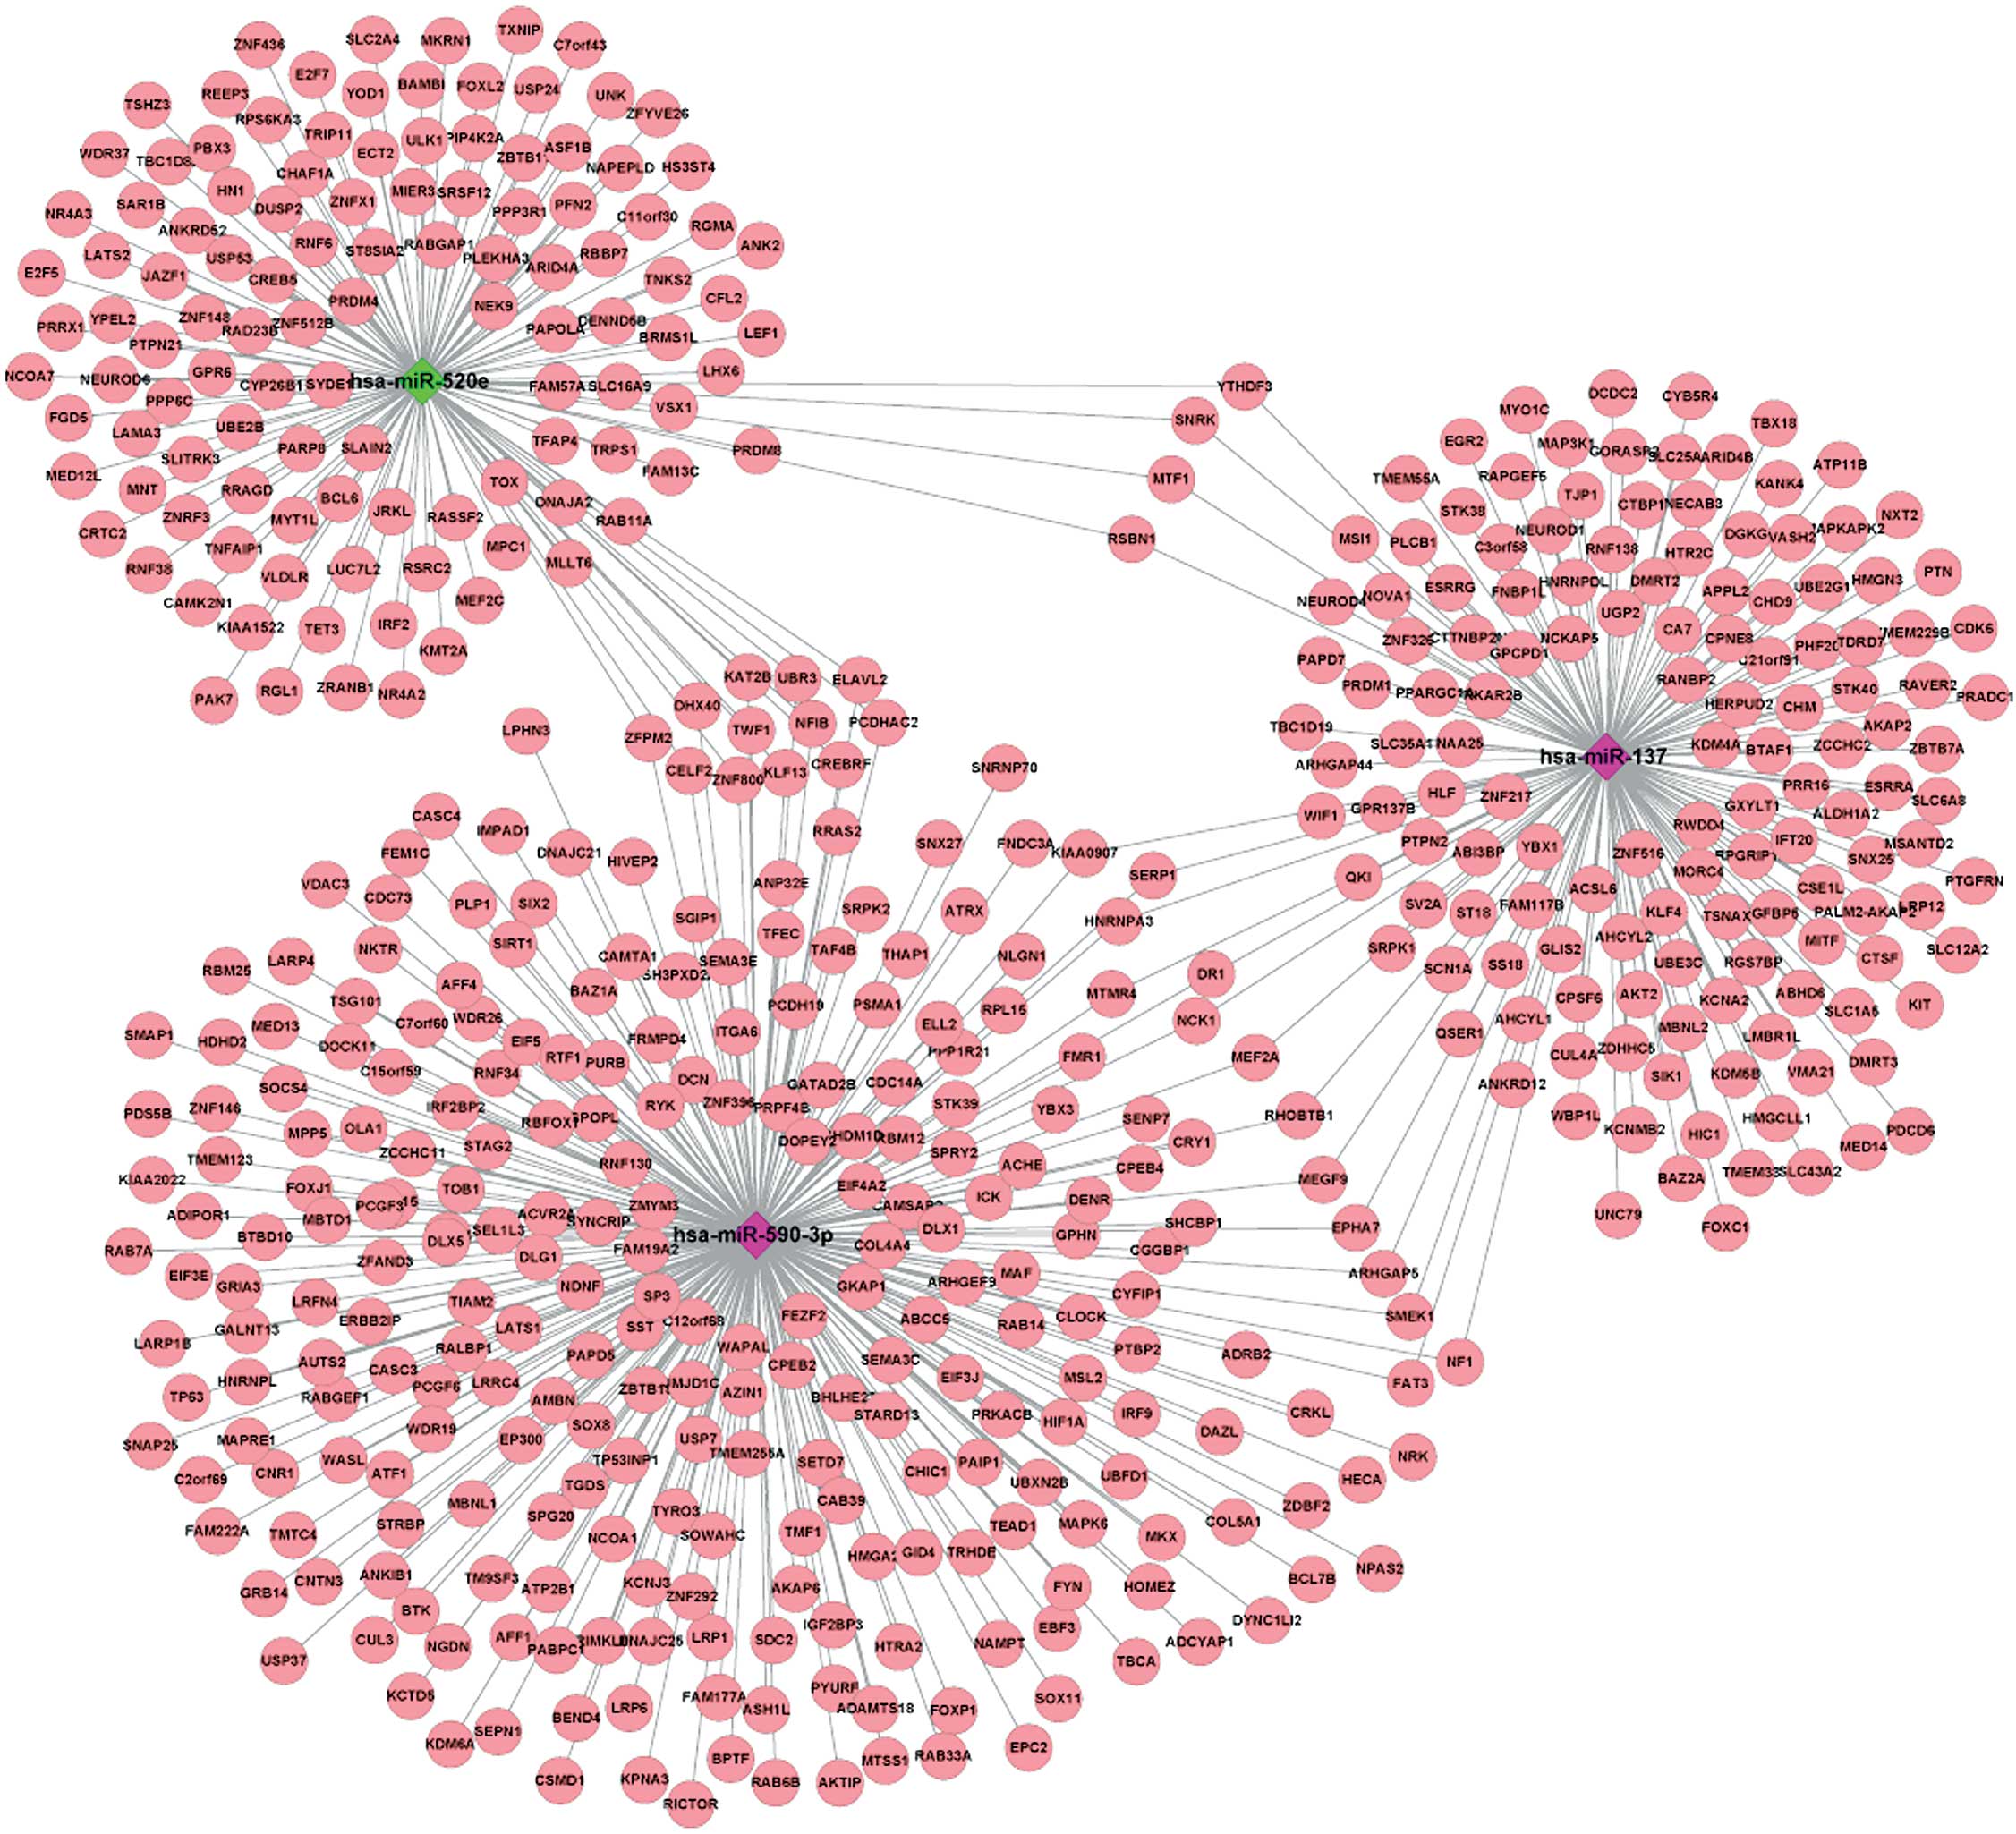
Regulatory network construction
The visualized regulatory network of the key DEMs
and the TGs of these DEMs showed that hsa-miR-520e and hsa-miR-137
had 4 common TGs, consisting of SNF related kinase (SNRK),
MTF1, round spermatid basic protein 1 (RSBN1) and YTH
N6-methyladenosine RNA binding protein 3 (YTHDF3),
hsa-miR-590-3p and hsa-miR-137 had 14 common TGs, including
NCK1, EPHA7, stress-associated endoplasmic reticulum protein
1 (SERP1) and myocyte enhancer factor 2A (MEF2A), and
hsa-miR-590-3p and hsa-miR-520e had 12 common TGs, including
KLF13, twinfilin actin binding protein 1 (TWF1),
NFIB and ZNF800 (Fig.
1).
Discussion
In the current study, 2 upregulated miRNAs,
consisting of hsa-miR-137 and hsa-miR-590-3p, and 1 downregulated
miRNA, hsa-miR-520e, were screened as key DEMs. Hsa-miR-520e and
hsa-miR-137 had 4 common TGs, consisting of SNRK,
MTF1, RSBN1 and YTHDF3. Through functional
enrichment analysis, MTF1 was identified as involved in the
regulation of gene expression and macromolecule metabolic
processes, intracellular membrane-bound organelles, and
sequence-specific DNA binding TF activity. As previously reported,
MTF1 binds specifically to heavy metal-responsive DNA
sequence elements in the enhancer/promoter region of
metallothionein (MT) genes to regulate their expression (26,27). MT
genes, such as MT1X and MT2A, encode small
cysteine-rich proteins that scavenge heavy metals, such as Zn (II),
Cd (II) and Cu (I), and reactive oxygen species (28,29).
Arriaga et al (30) found that
the expression of 5 isoforms of MTs, consisting of MT1G, MT1E,
MT1F, MT1H and MT1M, were lost during the transition between normal
colorectal mucosa and CRC, and the expression of MTs was associated
with a shorter survival time in CRC patients (30). In addition, the MT1X gene
showed a high sensitivity for the identification of patients with
LS or CRC with sporadic defective in MMR (31). This suggests that hsa-miR-520e and
hsa-miR-137 may have crucial roles in LS by regulating TGs.
In the present study, hsa-miR-590-3p and
hsa-miR-520e had 12 common TGs, including KLF13,
TWF1, NFIB and ZNF800, while KLF4 was
the TG of hsa-miR-137. Using functional enrichment analysis,
KLF4 and KLF13 were identified as involved in the
regulation of gene expression, heterocyclic compound binding, and
regulation of the cellular metabolic process. LOR-253, a compound
that stimulates KLF4 through the inhibition of the human
MTF1, is currently used in an early stage of colon cancer
(32). The KLF proteins are zinc
finger-containing TFs that exert important functions in regulating
diverse biological processes, such as growth and cell proliferation
(33). KLF4, formerly termed
GKLF, encodes a TF associated with tumor suppression and
oncogenesis (34). In LS, KLF4
and KLF5 were expressed and predominantly localized to the
epithelial cells of the tumors (35).
Overexpression of KLF4 in the colon cancer cell lines
resulted in reduced tumorigenesis (36). Additionally, a previous study reported
that the loss of heterozygosity in the KLF6 locus in
patients with sporadic CRC and LS was 0–35% and 0%, respectively
(37). These data suggested that loss
of heterozygosity of the KLF6 locus was rarely involved in
the carcinogenesis of CRC in patients with LS (38). This revealed that hsa-miR-590-3p and
hsa-miR-520e, in addition to hsa-miR-137, may have important roles
in the cellular metabolic process and proliferation in LS by
targeting their TGs.
Additionally, the common TGs, including NCK1,
EPHA7, SERP1 and MEF2A, were simultaneously
regulated by hsa-miR-590-3p and hsa-miR-137. The enrichment
analysis showed that NCK1 was significantly enriched in the
axon guidance pathway. As previously reported, AKT executes double
roles in protecting motoneuronal survival and promoting nerve
regeneration in vivo, and the dominant overexpression of
AKT in adult hypoglossal neurons showed accelerated axonal
regeneration (39). However, the
phosphorylation of AKT was partially reduced in
NCK1-deficient B cells, and it was almost completely absent
in NCK1-NCK2-deficient B cells. This revealed that the
activation of the phosphoinositide 3-kinase (PI3K)/AKT pathway was
restrained in the NCK1-NCK2-knockout B cells (40). Furthermore, ectopic expression of
hsa-miR-137 in CRC cells inhibited the phosphorylation of
mitogen-activated protein kinase (MAPK) and AKT, which reduced the
invasiveness of CRC cells by inhibiting signaling via the P13K/AKT
and MAPK pathways (41).
Hsa-miR-590-3p was also found to activate the PI3K/AKT signaling
pathway by downregulating PTEN, a TSG-activated P13K
pathway, and then provide strong growth and survival signals to
tumor cells (42). Thus, these
results suggested that hsa-miR-590-3p and hsa-miR-137 may play
important roles in LS by regulating their target genes through the
axon guidance pathway.
The functional and pathway enrichment analyses
showed that certain TGs of the key DEMs, including HIF1A,
AKT2 and RICTOR, participated in the mTOR signaling
pathway. mTOR is a member of the PI3K/AKT/mTOR pathway, whose
activation stimulates protein and lipid biosynthesis and it is
constitutively activated in LS (43).
The mTOR signaling pathway senses and integrates a variety of
environmental cues to regulate numerous major cellular processes
(44,45). As previously shown, the mTOR complex 2
protein RICTOR was highly overexpressed in CRC tissues, and the
inhibition of RICTOR resulted in growth inhibition and
induced apoptosis in CRCs (46,47).
Additionally, AKT2, a component of the PI3K/AKT/mTOR
pathway, is proposed as an oncogene for pancreatic cancer that
always occurs in the context of LS (48), and the overexpression of the
AKT2 proto-oncogene is an early event during sporadic colon
cancer (47,49). In addition, mTOR directly stimulated
HIF1A, downstream of PI3K/AKT/mTOR, and indirectly causes
other metabolic changes by activating HIF1A (50,51). The
subsequent HIF1-dependent metabolic changes are a major determinant
of the glycolytic phenotype, including the Warburg effect (50,51). The
Warburg effect in CRC results in the accumulation of a glycolytic
metabolite, pyruvate, which provides the CRC cells with an
environment that is a competitive advantage for invasion (52). Overexpression of HIF1A has also
been reported to be significantly associated with shorter
CRC-specific survival and overall survival times (53). In the present study, AKT2 was a
TG of hsa-miR-137, while RICTOR and HIF1A were TGs of
hsa-miR-590-3p. All these genes were enriched in the regulation of
the metabolic process. Therefore, it may be hypothesized that the
important roles of hsa-miR-137 and hsa-miR-590-3p in regulating
metabolic process occur by regulating the expression of their TGs
in LS.
In the present study, 3 key DEMs, consisting of
hsa-miR-520e, hsa-miR-590-3p and hsa-miR-137 were identified.
Hsa-miR-590-3p and hsa-miR-520e had 12 common TGs, including
KLF13. Hsa-miR-590-3p and hsa-miR-137 had 14 common TGs,
including NCK1. Hsa-miR-520e and hsa-miR-137 had 4 common
TGs, including MTF1. Functional and pathway enrichment
analysis showed that these TGs were significantly enriched in
important functions, such as the regulation of metabolic processes,
including regulation of macromolecule metabolic process, regulation
of primary metabolic process, regulation of cellular metabolic
process and cellular macromolecule metabolic process, mTOR
signaling, and the axon guidance pathway, which were crucial for
the growth and regulation of LS cancer cells. The present study
showed the potential crucial role of hsa-miR-520e, hsa-miR-590-3p
and hsa-miR-137 in LS.
In conclusion, the present study identified that
hsa-miR-137, hsa-miR-520e and hsa-miR-590-3p are key DEMs.
Hsa-miR-520e and hsa-miR-137 had 4 common TGs, consisting of
SNRK, MTF1, RSBN1 and YTHDF3.
Hsa-miR-590-3p and hsa-miR-137 had 14 common TGs, including
NCK1, EPHA7 and SERP1. Hsa-miR-590-3p and
hsa-miR-520e had 12 common TGs, including KLF13, TWF1
and NFIB. These regulatory interactions may provide
biomarkers for LS detection and prognosis.
References
|
1
|
Siegel R, DeSantis C and Jemal A:
Colorectal cancer statistics, 2014. CA Cancer J Clin. 64:104–117.
2014. View Article : Google Scholar : PubMed/NCBI
|
|
2
|
Jemal A, Siegel R, Ward E, Hao Y, Xu J and
Thun MJ: Cancer statistics, 2009. CA Cancer J Clin. 59:225–249.
2009. View Article : Google Scholar : PubMed/NCBI
|
|
3
|
Balaguer F, Moreira L, Lozano JJ, Link A,
Ramirez G, Shen Y, Cuatrecasas M, Arnold M, Meltzer SJ, Syngal S,
et al: Colorectal cancers with microsatellite instability display
unique miRNA profiles. Clin Cancer Res. 17:6239–6249. 2011.
View Article : Google Scholar : PubMed/NCBI
|
|
4
|
Lynch HT, Lynch PM, Lanspa SJ, Snyder CL,
Lynch JF and Boland CR: Review of the Lynch syndrome: History,
molecular genetics, screening, differential diagnosis and
medicolegal ramifications. Clin Genet. 76:1–18. 2009. View Article : Google Scholar : PubMed/NCBI
|
|
5
|
Lynch HT, Boland CR, Gong G, Shaw TG,
Lynch PM, Fodde R, Lynch JF and de la Chapelle A: Phenotypic and
genotypic heterogeneity in the Lynch syndrome: Diagnostic,
surveillance and management implications. Eur J Hum Genet.
14:390–402. 2006. View Article : Google Scholar : PubMed/NCBI
|
|
6
|
Luschka H: Ueber polypöse Vegetationen der
gesammten Dickdarmschleimhaut. Virchow's Arch f path Anat.
20:133–142. 1861. View Article : Google Scholar
|
|
7
|
Jass JR: Heredity and DNA methylation in
colorectal cancer. Gut. 56:154–155. 2007.PubMed/NCBI
|
|
8
|
Qian CN, Furge KA, Knol J, Huang D, Chen
J, Dykema KJ, Kort EJ, Massie A, Khoo SK, Vanden Beldt K, et al:
Activation of the PI3K/AKT pathway induces urothelial carcinoma of
the renal pelvis: Identification in human tumors and confirmation
in animal models. Cancer Res. 69:8256–8264. 2009. View Article : Google Scholar : PubMed/NCBI
|
|
9
|
van Engeland M, Derks S, Smits KM, Meijer
GA and Herman JG: Colorectal cancer epigenetics: Complex
simplicity. J Clin Oncol. 29:1382–1391. 2011. View Article : Google Scholar : PubMed/NCBI
|
|
10
|
Murphy ME: Polymorphic variants in the p53
pathway. Cell Death Differ. 13:916–920. 2006. View Article : Google Scholar : PubMed/NCBI
|
|
11
|
Wettenhall JM and Smyth GK: limmaGUI: A
graphical user interface for linear modeling of microarray data.
Bioinformatics. 20:3705–3706. 2004. View Article : Google Scholar : PubMed/NCBI
|
|
12
|
Benjamini Y and Hochberg Y: Controlling
the false discovery rate: A practical and powerful approach to
multiple testing. J Roy Stat Soc B. 57:289–300. 1995.
|
|
13
|
Leidinger P, Keller A, Borries A,
Reichrath J, Rass K, Jager SU, Lenhof HP and Meese E:
High-throughput miRNA profiling of human melanoma blood samples.
BMC Cancer. 10:2622010. View Article : Google Scholar : PubMed/NCBI
|
|
14
|
Dweep H, Sticht C, Pandey P and Gretz N:
miRWalk-database: Prediction of possible miRNA binding sites by
‘walking’ the genes of three genomes. J Biomed Inform. 44:839–847.
2011. View Article : Google Scholar : PubMed/NCBI
|
|
15
|
Wang X and El Naqa IM: Prediction of both
conserved and nonconserved microRNA targets in animals.
Bioinformatics. 24:325–332. 2008. View Article : Google Scholar : PubMed/NCBI
|
|
16
|
Krek A, Grün D, Poy MN, Wolf R, Rosenberg
L, Epstein EJ, MacMenamin P, da Piedade I, Gunsalus KC, Stoffel M
and Rajewsky N: Combinatorial microRNA target predictions. Nat
Genet. 37:495–500. 2005. View
Article : Google Scholar : PubMed/NCBI
|
|
17
|
Betel D, Koppal A, Agius P, Sander C and
Leslie C: Comprehensive modeling of microRNA targets predicts
functional non-conserved and non-canonical sites. Genome Biol.
11:R902010. View Article : Google Scholar : PubMed/NCBI
|
|
18
|
Lewis BP, Shih IH, Jones-Rhoades MW,
Bartel DP and Burge CB: Prediction of mammalian microRNA targets.
Cell. 115:787–798. 2003. View Article : Google Scholar : PubMed/NCBI
|
|
19
|
Hulsegge I, Kommadath A and Smits MA:
Globaltest and GOEAST: Two different approaches for Gene ontology
analysis. BMC Proc. 3(Suppl 4): S102009. View Article : Google Scholar : PubMed/NCBI
|
|
20
|
Kanehisa M and Goto S: KEGG: Kyoto
encyclopedia of genes and genomes. Nucleic Acids Res. 28:27–30.
2000. View Article : Google Scholar : PubMed/NCBI
|
|
21
|
da Huang W, Sherman BT and Lempicki RA:
Systematic and integrative analysis of large gene lists using DAVID
bioinformatics resources. Nat Protoc. 4:44–57. 2009. View Article : Google Scholar : PubMed/NCBI
|
|
22
|
Wingender E, Dietze P, Karas H and Knüppel
R: TRANSFAC: A database on transcription factors and their DNA
binding sites. Nucleic Acids Res. 24:238–241. 1996. View Article : Google Scholar : PubMed/NCBI
|
|
23
|
Chen JS, Hung WS, Chan HH, Tsai SJ and Sun
HS: In silico identification of oncogenic potential of fyn-related
kinase in hepatocellular carcinoma. Bioinformatics. 29:420–427.
2013. View Article : Google Scholar : PubMed/NCBI
|
|
24
|
Zhao M, Sun J and Zhao Z: TSGene: A web
resource for tumor suppressor genes. Nucleic Acids Res. 41(Database
issue): D970–D976. 2013. View Article : Google Scholar : PubMed/NCBI
|
|
25
|
Shannon P, Markiel A, Ozier O, Baliga NS,
Wang JT, Ramage D, Amin N, Schwikowski B and Ideker T: Cytoscape: A
software environment for integrated models of biomolecular
interaction networks. Genome Res. 13:2498–2504. 2003. View Article : Google Scholar : PubMed/NCBI
|
|
26
|
Boudreault F, Pinilla M, Kho A, Baron R
and Tschumperlin D: Metallothionein is a stretch-induced gene that
confers protection during mechanical ventilation. Technology.
1:32011.
|
|
27
|
Günther V, Lindert U and Schaffner W: The
taste of heavy metals: Gene regulation by MTF-1. Biochim Biophys
Acta. 1823:1416–1425. 2012. View Article : Google Scholar : PubMed/NCBI
|
|
28
|
Saini N, Georgiev O and Schaffner W: The
parkin mutant phenotype in the fly is largely rescued by
metal-responsive transcription factor (MTF-1). Mol Cell Biol.
31:2151–2161. 2011. View Article : Google Scholar : PubMed/NCBI
|
|
29
|
Günther V, Davis AM, Georgiev O and
Schaffner W: A conserved cysteine cluster, essential for
transcriptional activity, mediates homodimerization of human
metal-responsive transcription factor-1 (MTF-1). Biochim Biophys
Acta. 1823:476–483. 2012. View Article : Google Scholar : PubMed/NCBI
|
|
30
|
Arriaga JM, Levy EM, Bravo AI, Bayo SM,
Amat M, Aris M, Hannois A, Bruno L, Roberti MP, Loria FS, et al:
Metallothionein expression in colorectal cancer: Relevance of
different isoforms for tumor progression and patient survival. Hum
Pathol. 43:197–208. 2012. View Article : Google Scholar : PubMed/NCBI
|
|
31
|
Morandi L, de Biase D, Visani M, Monzoni
A, Tosi A, Brulatti M, Turchetti D, Baccarini P, Tallini G and
Pession A: T ([20]) repeat in the 3′-untranslated region of the
MT1X gene: A marker with high sensitivity and specificity to detect
microsatellite instability in colorectal cancer. Int J Colorectal
Dis. 27:647–656. 2012. View Article : Google Scholar : PubMed/NCBI
|
|
32
|
Constant S, Huang S, Wiszniewski L and Mas
C: Colon cancer: Current treatments and preclinical models for the
discovery and development of new therapies. Drug Discovery.
El-Shemy HA: InTech. (Rijeka). 433–458. 2013.PubMed/NCBI
|
|
33
|
Ghaleb AM and Yang VW: The pathobiology of
Krüppel-like factors in colorectal cancer. Current Colorectal
Cancer Rep. 4:59–64. 2008. View Article : Google Scholar
|
|
34
|
Rowland BD, Bernards R and Peeper DS: The
KLF4 tumour suppressor is a transcriptional repressor of p53 that
acts as a context-dependent oncogene. Nat Cell Biol. 7:1074–1082.
2005. View Article : Google Scholar : PubMed/NCBI
|
|
35
|
Shao J, Yang VW and Sheng H: Prostaglandin
E2 and Krüppel-like transcription factors synergistically induce
the expression of decay-accelerating factor in intestinal
epithelial cells. Immunology. 125:397–407. 2008. View Article : Google Scholar : PubMed/NCBI
|
|
36
|
Dang DT, Chen X, Feng J, Torbenson M, Dang
LH and Yang VW: Overexpression of Krüppel-like factor 4 in the
human colon cancer cell line RKO leads to reduced tumorigenecity.
Oncogene. 22:3424–3430. 2003. View Article : Google Scholar : PubMed/NCBI
|
|
37
|
Saunders IW, Ross J, Macrae F, Young GP,
Blanco I, Brohede J, Brown G, Brookes D, Lockett T, Molloy PL, et
al: Evidence of linkage to chromosomes 10p15.3-p15.1, 14q24.3-q31.1
and 9q33.3-q34.3 in non-syndromic colorectal cancer families. Eur J
Hum Genet. 20:91–96. 2012. View Article : Google Scholar : PubMed/NCBI
|
|
38
|
Miyaki M, Yamaguchi T, Iijima T, Funata N
and Mori T: Difference in the role of loss of heterozygosity at
10p15 (KLF6 locus) in colorectal carcinogenesis between sporadic
and familial adenomatous polyposis and hereditary nonpolyposis
colorectal cancer patients. Oncology. 71:131–135. 2006. View Article : Google Scholar : PubMed/NCBI
|
|
39
|
Namikawa K, Honma M, Abe K, Takeda M,
Mansur K, Obata T, Miwa A, Okado H and Kiyama H: Akt/protein kinase
B prevents injury-induced motoneuron death and accelerates axonal
regeneration. J Neurosci. 20:2875–2886. 2000.PubMed/NCBI
|
|
40
|
Leu CM: Nck, a missing adaptor between the
B-cell receptor complex and the BCAP/PI3K/Akt pathway. Cell Mol
Immunol. 11:120–122. 2014. View Article : Google Scholar : PubMed/NCBI
|
|
41
|
Liang L, Li X, Zhang X, Lv Z, He G, Zhao
W, Ren X, Li Y, Bian X, Liao W, et al: MicroRNA-137, an HMGA1
target, suppresses colorectal cancer cell invasion and metastasis
in mice by directly targeting FMNL2. Gastroenterology.
144:624.e4–635.e4. 2013. View Article : Google Scholar
|
|
42
|
Yang H, Zheng W, Zhao W, Guan C and An J:
Roles of miR-590-5p and miR-590-3p in the development of
hepatocellular carcinoma. Nan Fang Yi Ke Da Xue Xue Bao.
33:804–811. 2013.(In Chinese). PubMed/NCBI
|
|
43
|
Ekstrand AI, Jönsson M, Lindblom A, Borg A
and Nilbert M: Frequent alterations of the PI3K/AKT/mTOR pathways
in hereditary nonpolyposis colorectal cancer. Fam Cancer.
9:125–129. 2010. View Article : Google Scholar : PubMed/NCBI
|
|
44
|
Laplante M and Sabatini DM: mTOR signaling
in growth control and disease. Cell. 149:274–293. 2012. View Article : Google Scholar : PubMed/NCBI
|
|
45
|
Wullschleger S, Loewith R and Hall MN: TOR
signaling in growth and metabolism. Cell. 124:471–484. 2006.
View Article : Google Scholar : PubMed/NCBI
|
|
46
|
Gulhati P, Cai Q, Li J, Liu J, Rychahou
PG, Qiu S, Lee EY, Silva SR, Bowen KA, Gao T and Evers BM: Targeted
inhibition of mammalian target of rapamycin signaling inhibits
tumorigenesis of colorectal cancer. Clin Cancer Res. 15:7207–7216.
2009. View Article : Google Scholar : PubMed/NCBI
|
|
47
|
Johnson SM, Gulhati P, Rampy BA, Han Y,
Rychahou PG, Doan HQ, Weiss HL and Evers BM: Novel expression
patterns of PI3K/Akt/mTOR signaling pathway components in
colorectal cancer. J Am Coll Surg. 210:767–776. 2010. View Article : Google Scholar : PubMed/NCBI
|
|
48
|
Schneider G and Schmid RM: Genetic
alterations in pancreatic carcinoma. Mol Cancer. 2:152003.
View Article : Google Scholar : PubMed/NCBI
|
|
49
|
Roy HK, Olusola BF, Clemens DL, Karolski
WJ, Ratashak A, Lynch HT and Smyrk TC: AKT proto-oncogene
overexpression is an early event during sporadic colon
carcinogenesis. Carcinogenesis. 23:201–205. 2002. View Article : Google Scholar : PubMed/NCBI
|
|
50
|
Cairns RA, Harris IS and Mak TW:
Regulation of cancer cell metabolism. Nat Rev Cancer. 11:85–95.
2011. View Article : Google Scholar : PubMed/NCBI
|
|
51
|
Mellinghoff IK and Sawyers CL: TORward
AKTually useful mouse models. Nat Med. 10:579–580. 2004. View Article : Google Scholar : PubMed/NCBI
|
|
52
|
Bi X, Lin Q, Foo TW, Joshi S, You T, Shen
HM, Ong CN, Cheah PY, Eu KW and Hew CL: Proteomic analysis of
colorectal cancer reveals alterations in metabolic pathways:
Mechanism of tumorigenesis. Mol Cell Proteomics. 5:1119–1130. 2006.
View Article : Google Scholar : PubMed/NCBI
|
|
53
|
Baba Y, Nosho K, Shima K, Irahara N, Chan
AT, Meyerhardt JA, Chung DC, Giovannucci EL, Fuchs CS and Ogino S:
HIF1A overexpression is associated with poor prognosis in a cohort
of 731 colorectal cancers. Am J Pathol. 176:2292–2301. 2010.
View Article : Google Scholar : PubMed/NCBI
|