Introduction
Lung cancer is the most common cause of
cancer-associated mortality, and its incidence has been steadily
rising worldwide over the past 20 years (1–3). Lung
cancer is divided into small cell lung cancer (SCLC) and non-SCLC
(NSCLC) (3). The most common forms of
NSCLC include adenocarcinoma, squamous cell carcinoma and large
cell carcinoma, which comprises ~80% of all lung cancer cases
(1,2).
Patients with lung cancer frequently present with metastases,
regardless of the primary tumor size at the initial diagnosis, and
always have a high rate of relapse following treatment (3). Therapeutic approaches for lung cancer
are multifactorial and include surgery, immunotherapy, radiotherapy
and targeted therapy (4). Despite the
widespread use of multimodal treatment, the overall five-year
survival rate for such tumors is <15% (2).
Previous studies revealed that numerous malignant
tumors such as lung cancer, are composed of diverse cell types with
distinct proliferative and differential capacities (5–7). Thus, the
emerging reasonable explanation is the existence of a rare
subpopulation of cells that appear to be cancer stem cells (CSCs),
and which may contribute in certain cases to resistance to cancer
therapy and relapse (6–8). In fact, several studies have suggested
that a stem-like subpopulation derived from lung cancer cell lines
and tumor specimens was isolated by flow cytometry, according to
the detection of side population (SP) phenotypes (5).
Ho et al (5)
reported that NSCLC cell lines, including H460, H23, HTB-58, A549,
H441 and H2170, contained SP cells ranging from 1.5 to 6.1% of the
total viable cell population. In another study by Salcido et
al (9), SCLC cell lines (H146 and
H526) were observed to comprise 0.7–1.3% of SP cells, while the
NSCLC cell lines A549 and H460 contained 2.59 and 4.00% of SP
cells, respectively. Sung et al (10) reported that 24.44% of A549 cells were
classified as SP cells. Notably, the NSCLC cell line A549 used in
the aforementioned studies exhibited a significantly different SP
fraction, ranging from 2.59 to 24.44% (5,9,10). Those results indicate that the
frequency of the SP fraction appears to be highly variable between
different lung cancer cell lines and among the same type of cells,
which may be associated with the use of lung cancer sublines
passaged for different generations in individual laboratories.
Emerging evidence revealed that repeated passaging of cell lines
for multiple generations frequently leads to change of
characteristics, including alterations in cell morphology, growth
rates, protein expression and cell signaling, and acquisition of
genetic aberrations (11–13). Generally, established cancer cell
lines have usually been passaged many times in vitro within
one laboratory (14). Based on these
findings, it is worth investigating the effects of repeated
passaging on the biological and functional properties of the
enriched SP fraction from early- and late-passage cells.
In order to test this hypothesis, A549 and NSCLC SP
cells from low- and long-term passage cells were isolated by flow
cytometry based on ATP-binding cassette (ABC) sub-family G member 2
efflux pump-mediated Hoechst 33342 dye exclusion. The isolated SP
cells were used to investigate whether increasing cell passage
could alter their CSC-associated biological and functional
properties. This may aid to explain previous unclear results and to
better understand the biology of NSCLC CSCs.
Materials and methods
Cell line and clinical sample
The human NSCLC cell line A549 was obtained from the
American Type Culture Collection (Manassas, VA, USA) and maintained
in complete medium consisting of RPMI-1640 supplemented with 10%
(v/v) fetal bovine serum (FBS; HyClone; GE Healthcare Life
Sciences, Chalfont, UK) and 1% penicillin-streptomycin (Invitrogen;
Thermo Fisher Scientific, Inc., Waltham, MA, USA) in a humidified
37°C incubator with 5% CO2.
Tumor specimens were obtained from the consenting
patient according to the Internal Review and Ethics Board of The
First Affiliated Hospital of Zhengzhou University (Zhengzhou,
China). Tumor was obtained at radical surgery for a 52-year-old
male NSCLC patient. The fresh tumor was minced, suspended in
Dulbeccos modified Eagle medium (DMEM)/F12 medium (Invitrogen;
Thermo Fisher Scientific, Inc.) and mixed with 300 U/ml collagenase
I (Invitrogen; Thermo Fisher Scientific, Inc.) and 300 U/ml
hyaluronidase (Calbiochem; EMD Millipore, Billerica, MA, USA),
followed by overnight incubation at 37°C with 5% CO2.
Enzymatically disaggregated suspensions were filtered with a 40-µm
cell strainer and washed twice with phosphate-buffered saline
(PBS), and red blood cells were then removed using Ammonium
Chloride Lysing Solution (Sigma-Aldrich, St. Louis, MO, USA). The
resulting single tumor cells were cultured in DMEM/F12 supplemented
with 10% FBS at 37°C in a humidified atmosphere containing 5%
CO2.
The A549 cell line and the fresh isolated NSCLC
cells were passaged for 50 generations (1 passage every 4 days).
The cells at the 2nd (low passage) and 50th (long-term passage)
passages were analyzed.
Analysis and isolation of SP cell
fraction
SP analysis was performed as described by Goodell
et al (15) with slight
modifications. Briefly, A549 and NSCLC cells at the 2nd and 50th
passages were digested with 0.25% trypsin (Sigma-Aldrich), washed
twice with PBS and resuspended in pre-warmed RPMI-1640 culture
medium (Macgene Biotechnology Ltd., Beijing, China) supplemented
with 2% FBS and 2 mM 4-(2-hydroxyethyl)-1-piperazineethanesulfonic
acid at a density of 1×10⁶ cells/ml. Then, the cells were incubated
for an additional 90 min at 37°C in a shaking bath with 5 µg/ml
Hoechst 33342 dye (Invitrogen; Thermo Fisher Scientific, Inc.).
Control cells were incubated with 50 mM verapamil (Sigma-Aldrich)
for 15 min at 37°C prior to the addition of Hoechst dye. Upon
staining, the cells were washed twice with ice-cold PBS and
resuspended in cold PBS. Flow cytometry analysis and cell sorting
were conducted on a FACSAria II flow cytometer (BD Biosciences,
Franklin Lakes, NJ, USA). Hoechst 33342 was excited with
ultraviolet (UV) light at 355 nm, and fluorescence emission was
detected with 450/BP50 (Hoechst blue) and a 660/BP50 (Hoechst red)
optical filters (BD Biosciences). The collected SP cells were used
to perform all subsequent experiments.
Clone formation assay
A total of 250 sorted SP cells were plated on a
6-well plate (Corning Incorporated, Corning, NY, USA) in triplicate
and cultured with DMEM/F12 supplemented with 10% FBS for 10 days.
The cells were then fixed and stained with 0.5% crystal violet.
Colonies containing >50 cells were counted by eye.
Sphere formation assay
Sorted SP cells were plated at 5×10³ cells/well in
serum-free DMEM/F12 supplemented with 20 ng/ml epidermal growth
factor (Invitrogen; Thermo Fisher Scientific, Inc.,), 10 ng/ml
human recombinant basic fibroblast growth factor (Invitrogen;
Thermo Fisher Scientific, Inc.) and B-27® Supplement
(Invitrogen; Thermo Fisher Scientific, Inc.). The medium was
changed every other day. After 2 weeks in culture, colonies
containing >20 cells were counted using a microscope (Eclipse
TE2000-S; Nikon Corporation, Tokyo, Japan).
Reverse transcription-quantitative
polymerase chain reaction (RT-qPCR) analysis
Total RNA was obtained from freshly sorted SP cells
using RNAiso Plus (Takara Biotechnology Co., Ltd., Dalian, China)
and RT reactions were performed using PrimeScript™ RT Master Mix
(Perfect Real Time) kit according to the manufacturer's protocol
(Takara Biotechnology Co., Ltd.). RT was performed under the
following conditions: 30°C for 10 min, 95°C for 1 h and 4°C for 5
min. qPCR was performed using SYBR® Green I Master Mix
kit (Takara Biotechnology Co., Ltd.) on an iQ5 real-time PCR
detection system (Bio-Rad Laboratories, Inc., Hercules, CA, USA)
under the following conditions: 95°C for 2 min followed by 45
cycles of denaturation at 95°C for 15 sec, annealing at 58°C for 20
sec and extension at 72°C for 30 sec. The relative amounts of
messenger RNA (mRNA) were calculated from the values of the
comparative threshold cycle (16)
using glyceraldehyde 3-phosphate dehydrogenase as a control. The
sequences of the primers used are indicated in Table I.
 | Table I.Sequences of the primers used in
reverse transcription-quantitative polymerase chain reaction. |
Table I.
Sequences of the primers used in
reverse transcription-quantitative polymerase chain reaction.
| Gene (transcript
number) | Sequence
(5′-3′) | Product size
(bp) |
|---|
| ABCG2 | F:
CACGTGATTCTTCCACAAGCC | 74 |
| (NM_004827) | R:
CATGTACTGGCGAAGAATATTTGGT |
|
| Bmi1 | F:
AAATGCTGGAGAACTGGAAAG | 124 |
| (NM_005180) | R:
CTGTGGATGAGGAGACTGC |
|
| E-cadherin | F:
ATTCTGATTCTGCTGCTCTTG | 400 |
| (NM_004360) | R:
AGTAGTCATAGTCCTGGTCTT |
|
| GAPDH | F:
AATTGAGCCCGCAGCCTCCC | 153 |
| (NM_002046) | R:
CCAGGCGCCCAATACGACCA |
|
| Nanog | F:
ATTCAGGACAGCCCTGATTCTTC | 76 |
| (NM_024865) | R:
TTTTTGCGACACTCTTCTCTGC |
|
| N-cadherin | F:
CTCCTATGAGTGGAACAGGAACG | 121 |
| (NM_001792) | R:
TTGGATCAATGTCATAATCAAGTGCTGTA |
|
| Oct4 | F:
GTGGAGAGCAACTCCGATG | 86 |
| (NM_002701) | R:
TGCTCCAGCTTCTCCTTCTC |
|
| Snail | F:
GAGGCGGTGGCAGACTAG | 159 |
| (NM_005985) | R:
GACACATCGGTCAGACCAG |
|
| Sox2 | F:
CGAGTGGAAACTTTTGTCGGA | 74 |
| (NM_003106) | R:
TGTGCAGCGCTCGCAG |
|
| Twist | F:
CGGGAGTCCGCAGTCTTA | 130 |
| (NM_000474) | R:
TGAATCTTGCTCAGCTTGTC |
|
Tumorigenicity assay and in vivo
micro-positron emission tomography (PET) imaging
Animal experiments were performed in accordance to
the Guide for the Care and Use of Laboratory Animals of The First
Affiliated Hospital of Zhengzhou University. Briefly, sorted SP
cells suspended in 100 µl Matrigel (BD Biosciences) were injected
subcutaneously into 5-week-old female non-obese diabetic/severe
combined immunodeficiency mice (n=48; Institute of Laboratory
Animal Science, Zhengzhou University). The number of injected cells
is indicated in Table II. Tumor
growth was monitored 4 weeks after transplantation using a MOSAIC
small animal PET scanner (Philips Medical Systems, Inc., Bothell,
WA, USA). For microPET imaging, the mice had been fasting for 10 h
prior to 18F-fluorodeoxyglucose (FDG) injections but
allowed free access to water. Upon being intraperitoneally
anesthetized with 100 mg/kg pentobarbital (Sigma-Aldrich), each
mouse was injected intravenously with ~3.7 MBq 18F-FDG
(which was provided by the Department of Nuclear Medicine of The
First Affiliated Hospital of Zhengzhou University). Then, the mice
were euthanized to confirm tumor formation.
| Table II.Tumorigenicity of 2nd and 50th
passage cells in A549 and NSCLC cells. |
Table II.
Tumorigenicity of 2nd and 50th
passage cells in A549 and NSCLC cells.
|
| Injected cell
number |
|---|
|
|
|
|---|
| Cell |
1×10² |
1×10³ |
1×10⁴ |
1×10⁵ |
|---|
| A549 |
|
|
|
|
|
2nd | 0/3 | 0/3 | 2/3 | 3/3 |
|
50th | 0/3 | 0/3 | 0/3 | 2/3 |
| NSCLC |
|
|
|
|
|
2nd | 1/3 | 1/3 | 3/3 | 3/3 |
|
50th | 0/3 | 0/3 | 1/3 | 3/3 |
Radiation sensitivity assay
Briefly, 500–10,000 SP cells were plated on 25
cm2 flasks in triplicate for each experiment. Then, the
cells were exposed to a 60Co laboratory irradiator (GammaCell 220;
MDS Nordion, Inc., Ontario, Canada) for the time required to
generate a dose curve of 0, 2, 4, 6 and 8 Gy. The control was sham
irradiated SP cells. Following irradiation, the cells were
incubated for an additional 10 days, prior to be fixed with 100%
carbinol and stained with 0.5% crystal violet. The surviving
fraction (SF) was calculated as follows: Plating efficiency
(PE)=(colony number/inoculated cell number) × 100%.
SF=PEtested group/PE0 Gy group × 100%. The
cell survival curves were fitted using the following single-hit
multi-target formula:
SF=1-(1-e-D/D0)N (17). The radiobiological parameters of
cellular radiosensitivity (mean lethal dose, D0), the
capacity for sublethal damage repair (quasi-threshold dose,
Dq) and the extrapolation number (N) were calculated and
then used to calculate the SF after irradiation at a dose of 2 Gy
(SF2) and the sensitization enhancement ratio (SER)
according to the following formula: SER=Dq
2nd/Dq 50th (Table
III).
| Table III.Radiobiological parameters of 2nd and
50th passage cells in A549 and NSCLC cells. |
Table III.
Radiobiological parameters of 2nd and
50th passage cells in A549 and NSCLC cells.
| Cell | Na | D0
(Gy)a | Dq
(Gy)a | SER
Dq |
|---|
| A549 |
|
|
| 1.120 |
|
2nd | 1.291±0.027 | 2.639±0.127 | 0.674±0.062 |
|
|
50th | 1.303±0.035 | 2.273±0.141 | 0.602±0.089 |
|
| NSCLC |
|
|
| 1.335 |
|
2nd | 1.723±0.023 | 2.933±0.059 | 1.596±0.026 |
|
|
50th | 1.754±0.061 | 2.128±0.072 | 1.196±0.064 |
|
Drug sensitivity assay
Sulforhodamine B (SRB) assay was used to determine
the sensitivity of SP cells to doxorubicin. Cells were plated at a
density of 1×10⁴ cells/well in a 96-well plate. After incubation
for 24 h, the cells were treated with 250, 500 and 1,000 nM
doxorubicin (Sigma-Aldrich). Then, the cells were fixed with 10%
(w/v) trichloroacetic acid at 4°C for 1 h and stained for 30 min
with 0.4% (w/v) SRB (Sigma-Aldrich) dissolved in 1% acetic acid.
The protein-bound dye was subsequently dissolved in 10 mmol/l Tris.
The optical density of the cells was determined at a wavelength of
540 nm in an iMark™ microplate absorbance reader (Bio-Rad
Laboratories, Inc.).
Apoptosis assay
For quantitative analysis of apoptosis, the sorted
SP cells were pretreated with 500 nM doxorubicin for 12 h or
exposed to 2 Gy irradiation. Then, 1×10⁶ cells were immediately
suspended in 200 µl annexin V-fluorescein isothiocyanate (FITC)
binding buffer (Annexin V FITC Apoptosis Detection kit; BD
Biosciences) containing 10 µl annexin V-FITC. After 15 min of
incubation in the dark at room temperature, the cells were diluted
with 300 µl annexin V-FITC binding buffer containing 5 µl propidium
iodide (PI) and immediately analyzed using a FACSCalibur™ flow
cytometer (BD Biosciences). The annexin V-FITC and PI emissions
were detected using 515 and 560 nm filters, respectively, following
excitation with a 488-nm UV light. The number of apoptotic cells
were counted using CellQuest 3.1 software (BD Biosciences).
Statistical analysis
Data were expressed as means ± standard error of the
mean (n=3–6). The difference between SP cells were analyzed using
the Student's t test. Statistical analyses were performed
using SPSS software version 17 (SPSS, Inc., Chicago, IL, USA).
P<0.05 was considered to indicate a statistically significant
difference.
Results
Isolation of SP fraction from
different passage A549 and NSCLC cells
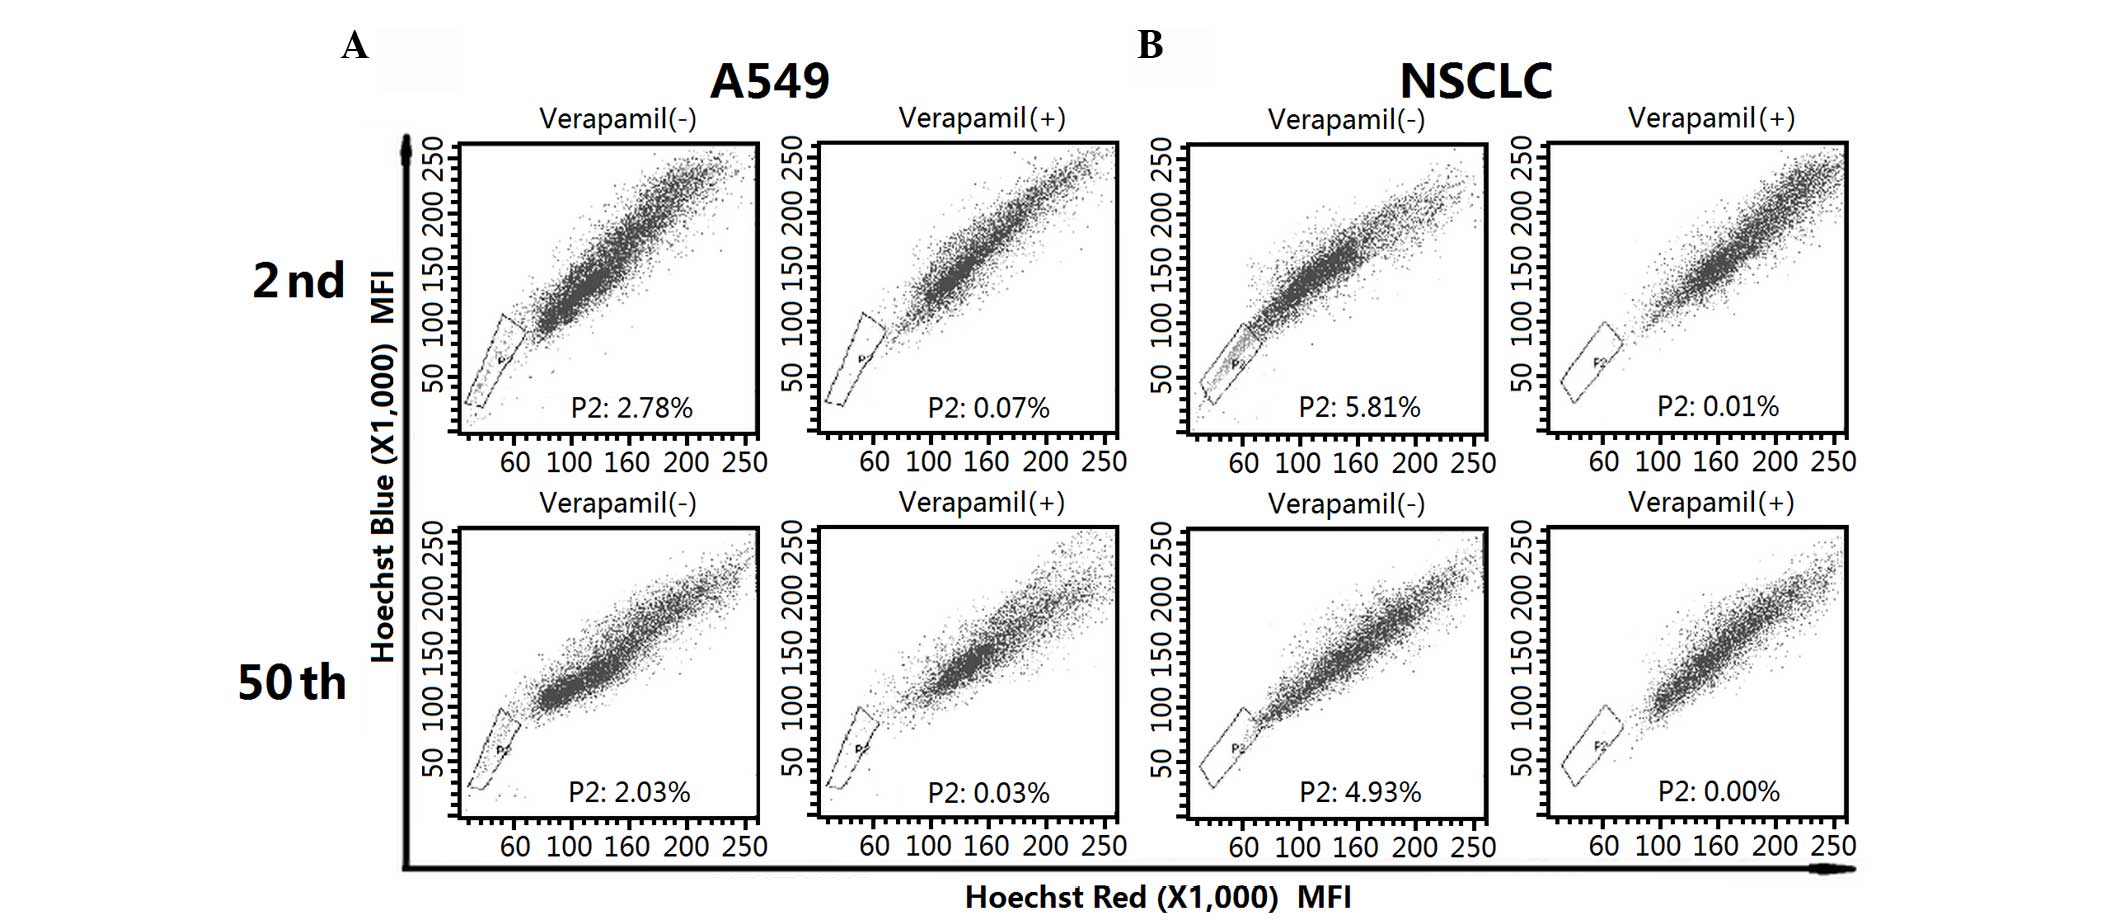
In order to investigate the functional properties of
the SP fraction from low and long-term passage cells, the SP
subpopulation was first isolated by flow cytometry. As indicated in
Fig. 1A, A549 cell lines contained a
similar fraction of SP cells in the 2nd (2.78%) and 50th (2.03%)
passage cells. For early- and late-passage NSCLC cells, SP cells
accounted for 5.81 and 4.93% of the whole population, respectively
(Fig. 1B). The SP fraction decreased
significantly in the presence of verapamil.
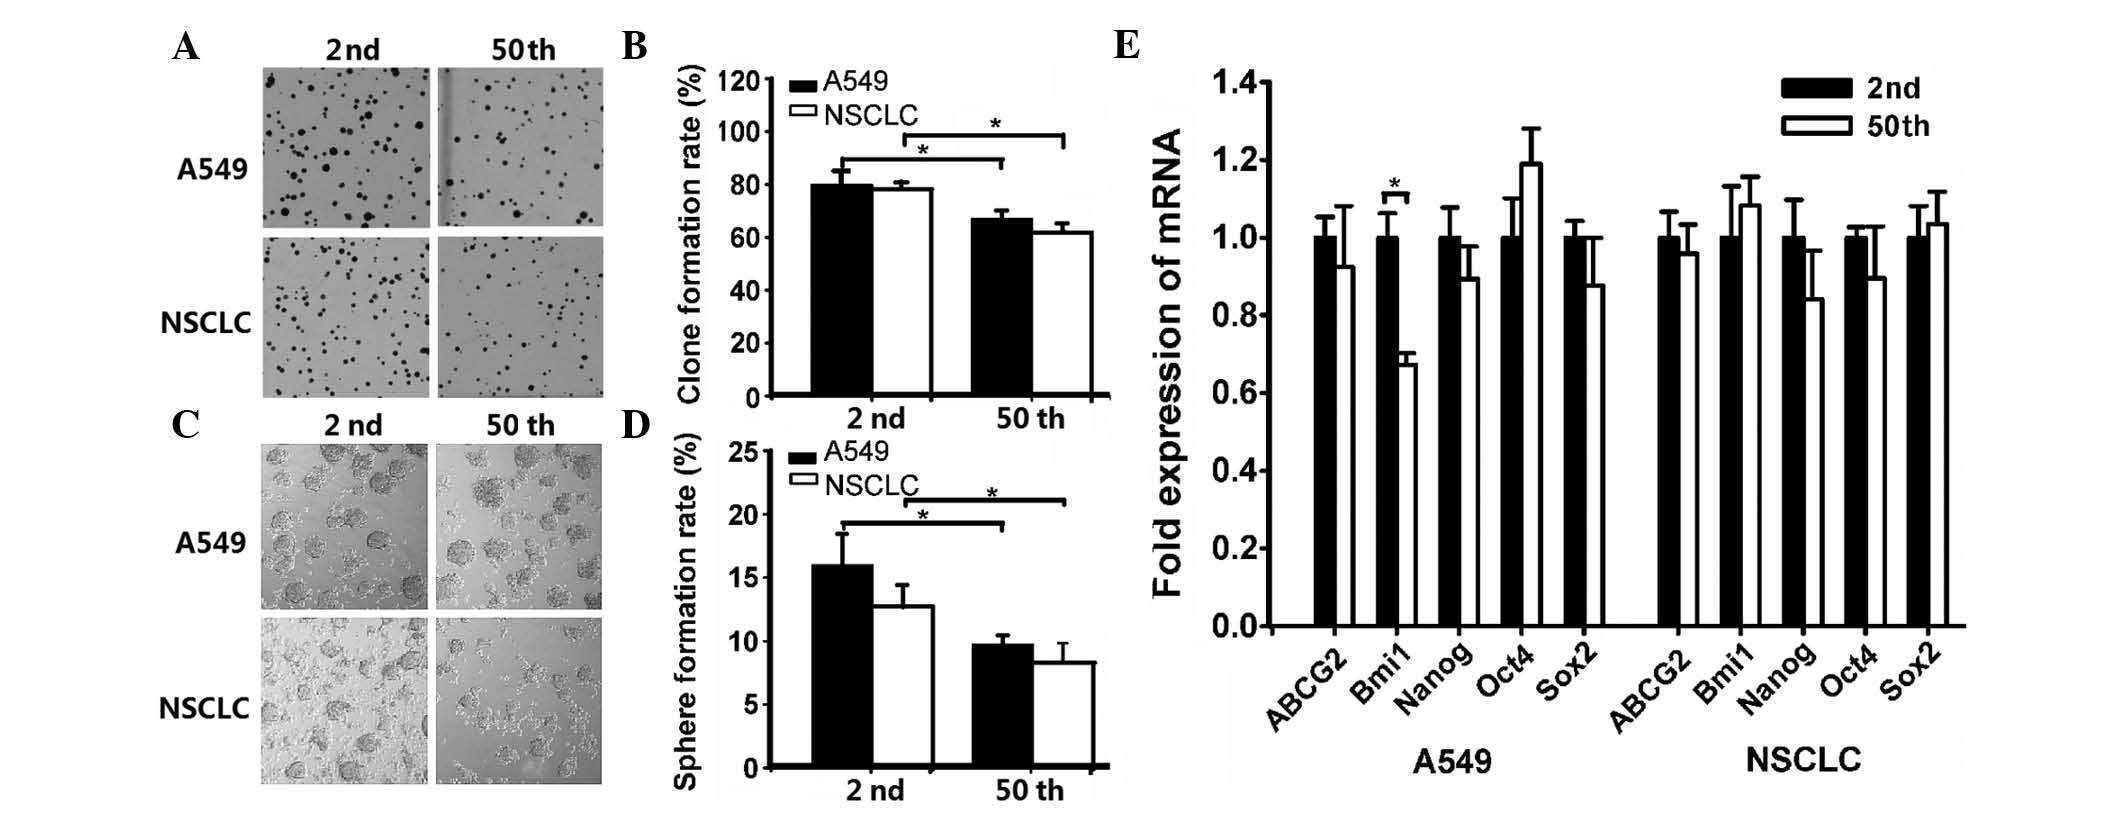
The stem cell-like properties of the SP fraction
from A549 and NSCLC cells were diminished upon long-term passage.
To determine the differences in the clonogenic capacity of the SP
fraction from 2nd and 50th passage cells, a clone formation assay
was performed. The results indicated that the mean clone formation
efficiency was 79.81±5.71 and 66.84±3.47% in early and late passage
A549 cells, respectively (Fig. 2A and
B). For NSCLC cells, the percentage of formed clones in 2nd and
50th passage cells was 78.27±2.26 and 61.45±3.72%, respectively
(Fig. 2A and B).
Sphere formation has been recognized as a defined
characteristic of CSCs that reflects the potential of self-renewal
ability (18). Thus, the sphere
formation capacity was evaluated. As shown in Fig. 2C and D, the sphere formation
efficiency of 2nd and 50th passage sublines was 15.70±2.42 and
9.45±0.68% in A549 cells, and 12.46±1.63 and 8.08±1.50% in NSCLC
cells, respectively.
Based on the notion that CSCs frequently have
conserved stem and progenitor cell phenotypes (19), the expression of embryonic stem (ES)
cell-associated genes was evaluated. As shown in Fig. 2E, RT-qPCR analysis revealed that the
mRNA expression of 2nd passage SP cells (with the exception of B
cell-specific Moloney murine leukemia virus integration site 1
expression in A549 cells) had no significant differences compared
with 50th passage SP cells.
The present study revealed that SP fraction exhibits
decreased tumorigenicity and invasion capacity following long-term
passage. Serial transplantation is the most widely accepted assay
and recommended by the American Association for Cancer Research to
determine stem cell properties (20,21). Thus,
the tumorigenic potential of the SP subpopulation within A549 and
NSCLC cells was investigated. As depicted in Table II, the results indicated that the
tumor-initiating frequency was decreased after long-term passage.
This result was also confirmed by microPET imaging (Fig. 3A). The SP cells were injected
subcutaneously on the left side flank region, and a formed tumor
could be clearly identified (as indicated by the arrow in the
image). In order to confirmed tumor formation on microPET scanning,
the mice were euthanized after microPET imaging. The
tumor-associated lesion (indicated by the arrow) was observed in
the left region of certain mice following 1×10⁵ 2nd
NSCLC SP cells injection (Fig.
3B).
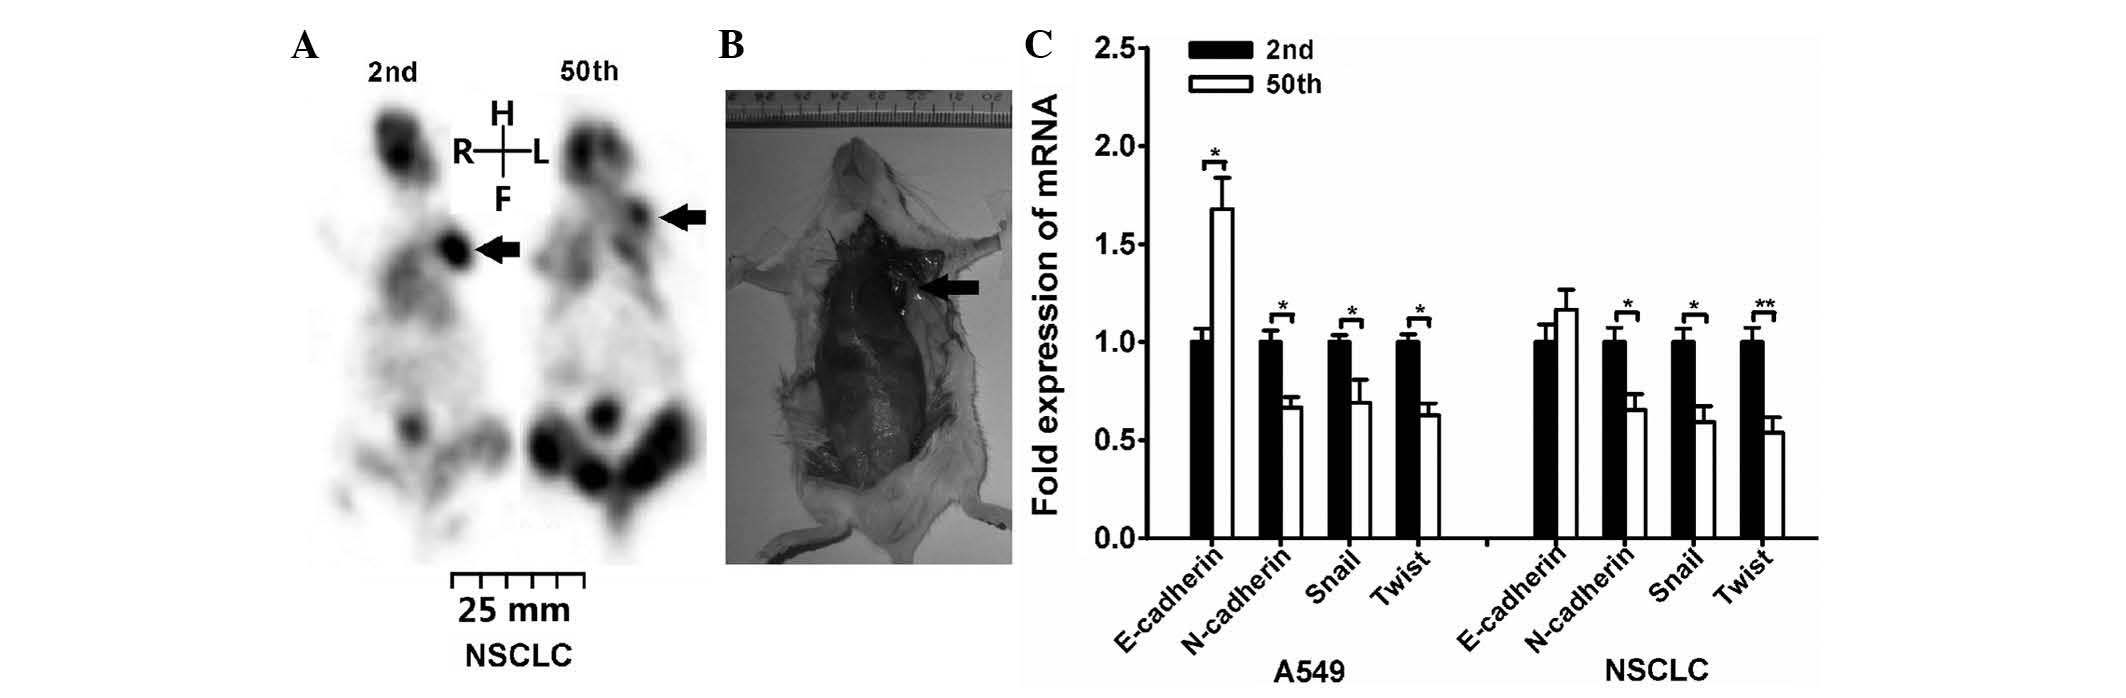 | Figure 3.SP fraction exhibited decreased
tumorigenicity and invasion capacity after long-term passage. NSCLC
SP cells were injected subcutaneously on the left side flank region
of NOD/SCID mice. (A) 1×10⁴ NSCLC SP cells were injected
into NOD/SCID mice, and the tumor growth was monitored on day 28 by
micro-positron emission tomography imaging (as indicated by arrow).
Then, the mice were euthanized to confirm tumor formation. (B) The
arrow indicates the tumor-associated lesion induced by
1×10⁵ 2nd passage NSCLC SP cells injection. (C) Reverse
transcription-quantitative polymerase chain reaction analysis of
the expression of epithelial-mesenchymal transition-associated
genes (*P<0.05, **P<0.01). NOD, non-obese diabetic; SCID,
severe combined immunodeficiency; NSCLC, non-small cell lung
cancer; mRNA, messenger RNA; SP, side population; R, right; L,
left; H, head; F, foot. |
Additionally, the expression of genes associated
with tumor cell migration was evaluated. The migration and invasion
abilities of CSCs have been frequently associated with the
epithelial-mesenchymal transition (EMT) (22,23). Thus,
the expression of EMT-associated genes, including E-cadherin,
N-cadherin, Snail and Twist, was investigated. RT-qPCR analysis
indicated that N-cadherin, Snail and Twist genes were expressed
higher in 2nd passage cells than in 50th passage cells (Fig. 3C). For E-cadherin, its mRNA expression
was increased in 50th passage A549 cells, while displayed no
significant differences in NSCLC cells.
The SP fraction derived from different passage cells
exhibits distinct chemo- and radio-sensitivity (5,9,10). Increasing evidence supports the notion
that CSCs play a crucial role in therapeutic resistance, which
results in tumor relapse (24,25). To
determine whether long-term passage affects the sensitivity of the
SP subpopulation to chemo- and radiotherapy, the cytotoxicity of
doxorubicin and ionizing radiation on different passage A549 and
NSCLC SP cells were evaluated. The SRB assay indicated that the 2nd
passage subline was more resistent to high doses of doxorubicin
(1,000 nM) than the 50th passage subline in A549 cells (Fig. 4A). For NSCLC cells, the 50th passage
subline exhibited more sensitivity to high doses of doxorubicin
(1,000 nM) than the 2nd passage subline, while it had no
significant difference when low doses of doxorubicin were used.
Additionally, the A549 cells exhibited no significant difference in
their sensitivity to low doses of doxorubicin.
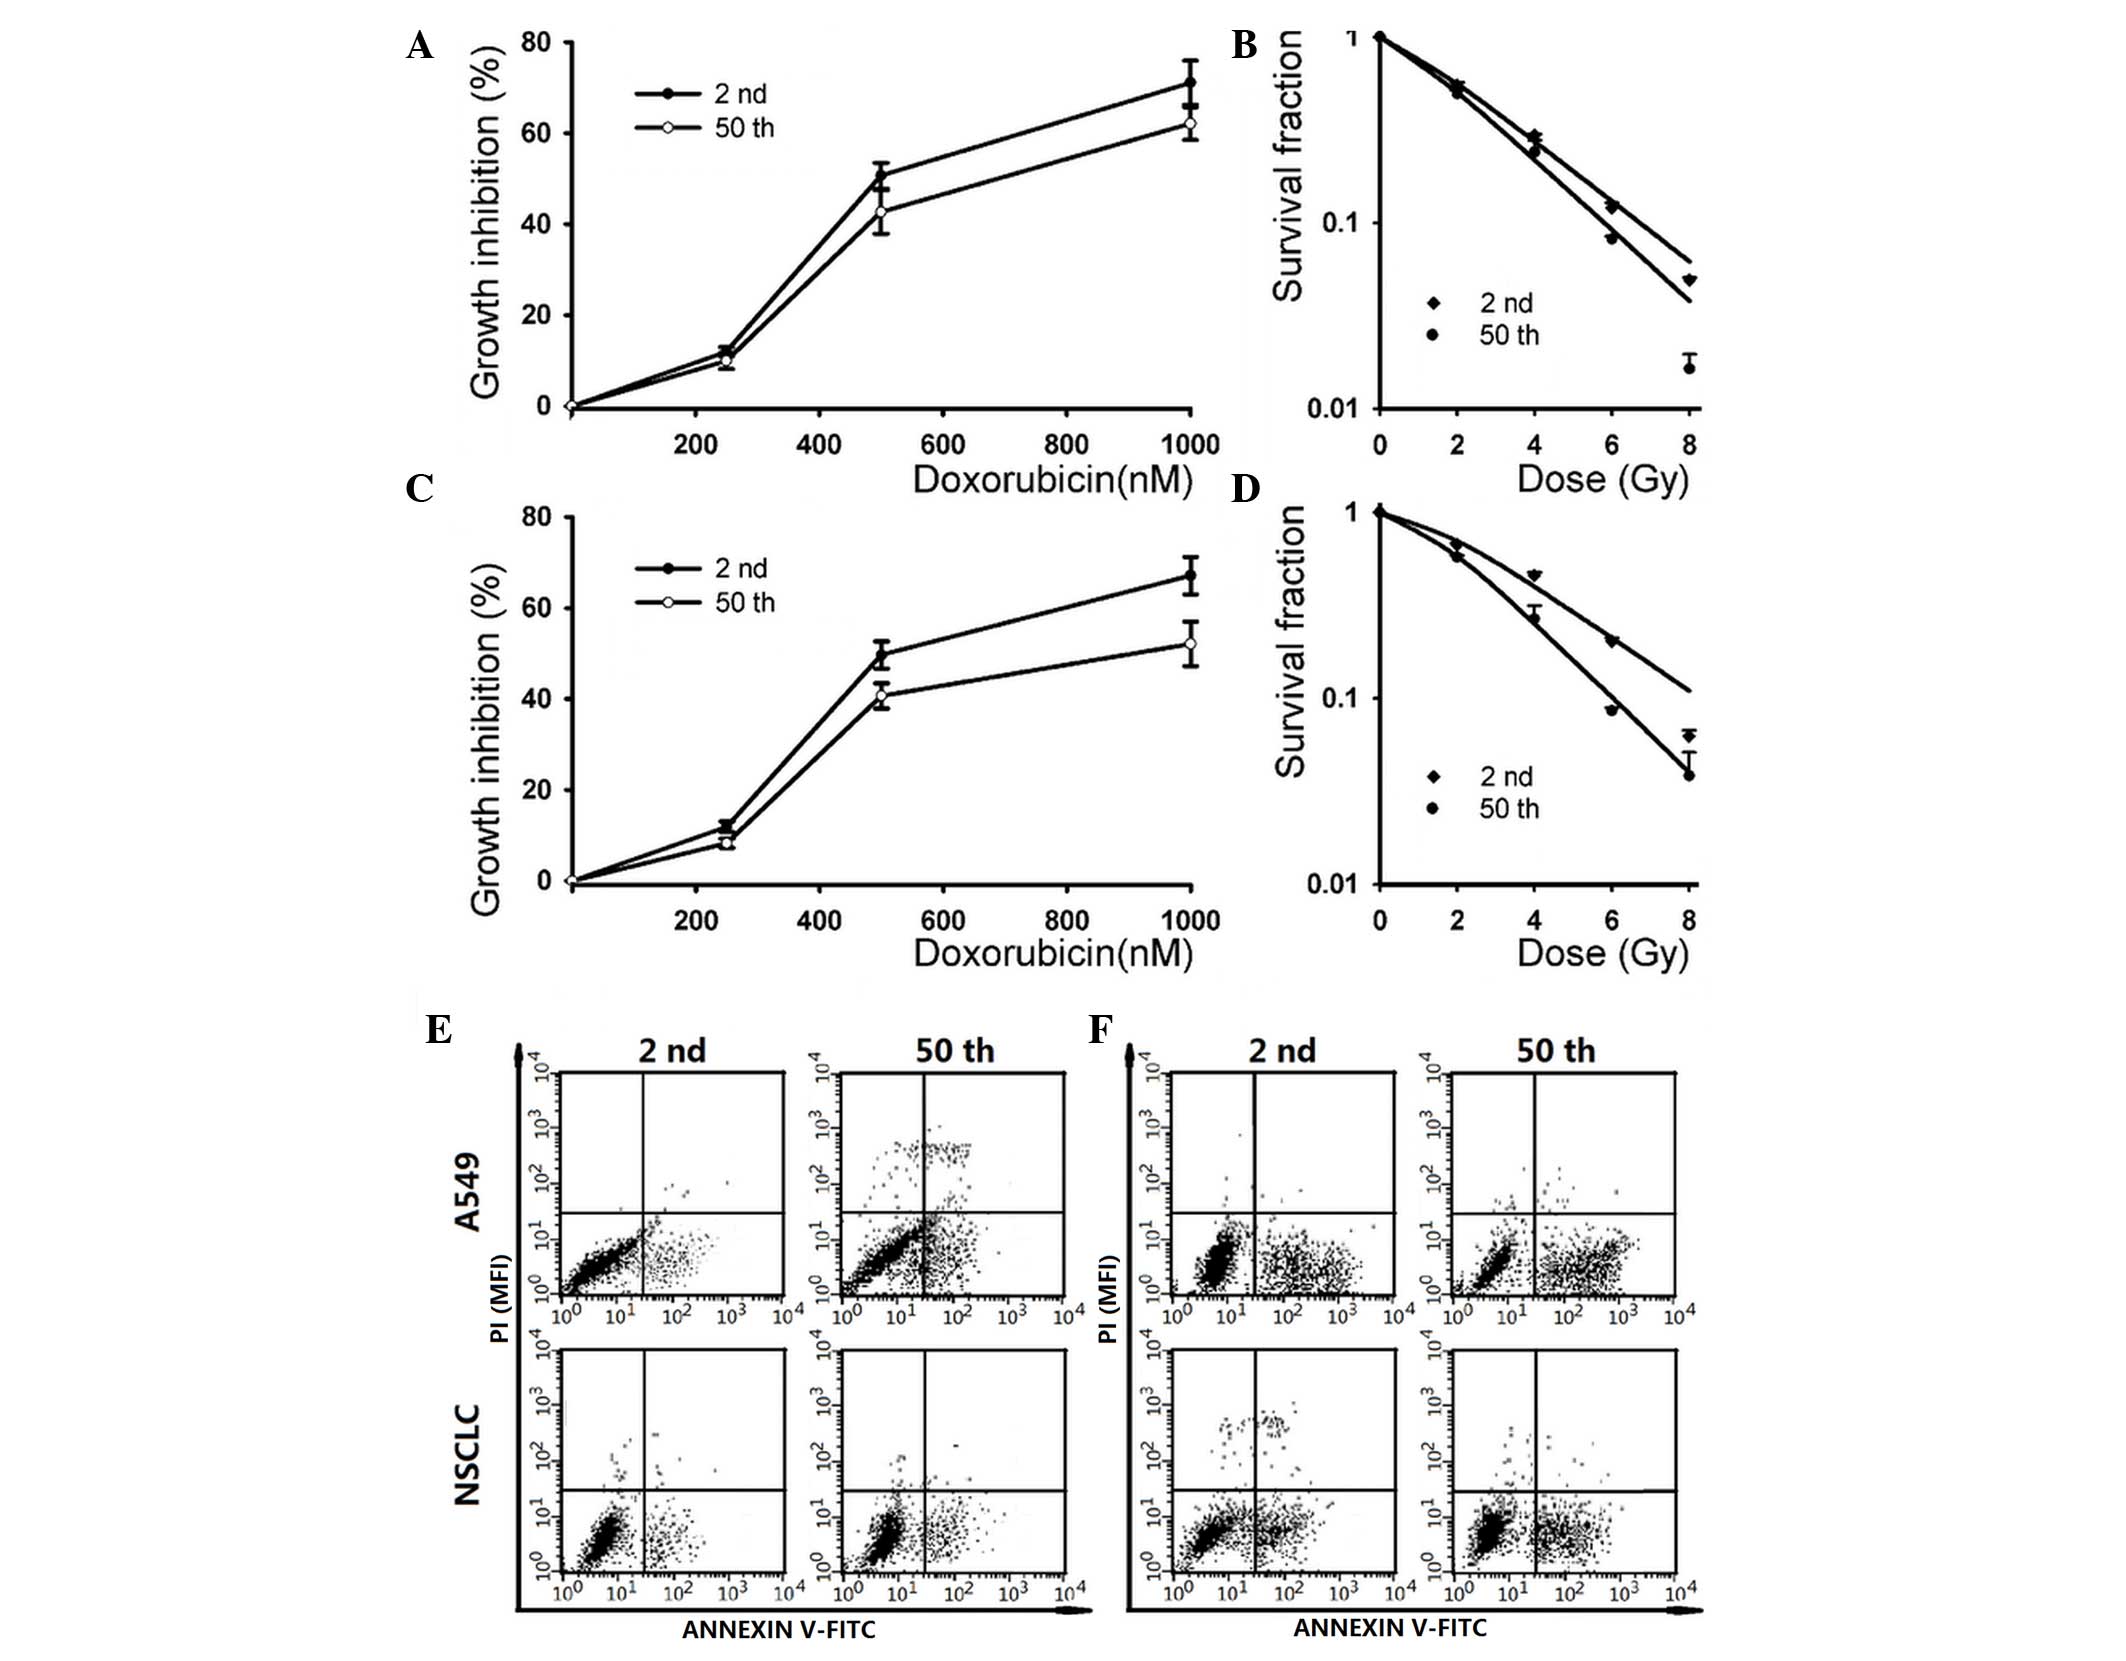 | Figure 4.The SP fraction derived from
different passage cells displayed distinct chemo- and
radio-sensitivity. (A) SP cells from A549 cells were treated with
different concentrations of doxorubicin (0, 250, 500 and 1,000 nM),
and cytotoxicity was determined by SRB assay (*P<0.05). (B) SP
cells within A549 cells were irradiated with a dose of 0, 2, 4, 6
and 8 Gy. The survival curves represent the data as fitted by the
single-hit multi-targets model (*P<0.05). (C) SP cells from
NSCLC cells were treated with different concentrations of
doxorubicin (0, 250, 500 and 1,000 nM), and cytotoxicity was
determined by SRB assay (*P<0.05). (D) SP cells within NSCLC
cells were irradiated with a dose of 0, 2, 4, 6 and 8 Gy. The
survival curves represent the data as fitted by the single-hit
multi-targets model (*P<0.05, **P<0.01). SP cells were (E)
exposed to 2 Gy irradiation or (F) pretreated with 500 nM
doxorubicin for 12 h, and the apoptosis rate was determined by
annexin V-FITC/propidium iodide staining. NSCLC, non-small cell
lung cancer; PI, propidium iodide; SP, side population; SRB,
sulforhodamine B; FITC, fluorescein isothiocyanate; MFI, mean
fluorescence intensity. |
The radiation-induced dose-dependent survival curve
of 2nd and 50th passage SP cells are also presented in Fig. 4. The results indicated that the 2nd
passage cells exhibited more resistance than the 50th passage cells
in A549 (exposure to 8 Gy irradiation) and NSCLC (exposure to 6 and
8 Gy irradiation) SP cells. The SF after 2 Gy irradiation was
55.84±1.91% for 2nd passage cells vs. 50.26±2.24% for 50th passage
cells in the A549 cell line, and 70.32±1.52% for 2nd passage cells
vs. 58.13±1.21% for 50th passage cells in NSCLC cells. By
application of the single-hit multi-target model, the values of N,
D0 and Dq of 2nd and 50th passage SP cells
were analyzed (Table III). Those
radiobiological parameters and the SER Dq indicated that
2nd passage SP cells were more resistant to irradiation compared
with 50th passage SP cells. As shown in Table III, 2nd passage cells displayed
significantly larger values of Dq than 50th passage
cells, indicating that the repair of sublethal damage capacity was
diminished with increasing cell passage.
In addition, the doxorubicin and ionizing
radiation-induced apoptosis in early and late passage cells were
also analyzed. As shown in Fig. 4E,
the apoptotic cell death rate was 7.94±0.82 and 10.32±1.13% in
early- and late-passage cells after 2 Gy irradiation, respectively.
Following pre-incubation with 500 nM doxorubicin, the apoptosis
rate in 2nd and 50th passage cells was 22.76±2.81 and 27.95±3.17%,
respectively (Fig. 4F). Similar
results were observed in low and long-term passage NSCLC cells,
where the apoptotic cell death rate was increased in the 50th
passage cells (Fig. 4E and F).
Discussion
The CSC theory provides an attractive cellular
mechanism counting for malignant progression and therapeutic
resistance in lung cancer (5–10). The current anticancer therapies often
destroy the bulk of a tumor mass but fail to eradicate CSCs
(3). Thus, tumor recurrence or
metastasis occurs by resident CSCs subsequent to a primary
therapeutic response or initial induction of tumor remission
(6–8).
Therefore, a better understanding of CSCs biology will be useful to
explore more effective methods to destroy CSCs.
In order to investigate the mechanism of CSCs
resistance to anticancer therapy, the critical step is to isolate
CSCs. The SP assay is based on the differential potential of cells
to efflux Hoechst dye via an ABC transporter (15). The ability to exclude Hoechst dye as
defined by SP fraction was initially described in mouse bone marrow
cells, and later observed in haematopoietic malignancies and solid
tumors such as lung cancer (5,9,10,15).
Increasing evidence suggests that a stem cell-like SP subpopulation
exists in lung cancer cell lines, including A549, H23, H146, H460
and HTB-23, and in tumor biopsies (5,9,10). Notably, the NSCLC cell line A549 used
in the aforementioned studies exhibited a significantly different
SP fraction, ranging from 2.59 to 24.44% (5,9,10). In addition, Salcido et al
(9) observed that SCLC cell lines
comprised 0.7–1.3% of SP cells, while the NSCLC cell lines A549 and
H460 contained 2.59 and 4.00% of SP cells, respectively. The
frequency of SP cells appears to be highly variable among different
lung cancer cell lines of the same type. Accumulating evidence
reveals the fact that repeated passaging of cell lines for multiple
generations frequently leads to change of characteristics,
including alterations in cell morphology, growth rates, protein
expression and cell signaling, and acquisition of genetic
aberrations (11–13). Thus, the distinct percentage of SP
fraction may be associated with the different passaged cell line
used in individual laboratories. In the present study, the results
demonstrated that the SP fraction was slightly decreased after
long-term passage within A549 and NSCLC cells.
Current approaches used to identify putative CSCs
are based on the notion that CSCs should have conserved stem cell
functions (6,19,26), that
is, CSCs are a functional definition. The methods used for the
identification of isolated SP cells have been previously described
(6,8).
Self-renewal was considered one of the basic features of stem cells
(18). The present results suggest
that 2nd passage A549 and NSCLC cells have increased capacity to
form spheres compared with 50th passage cells, and this
self-renewing ability was diminished after long-term passage.
Consistent with the sphere formation results, the clonogenic assay
revealed that the mean clone formation efficiency was decreased in
long-term passage SP cells. The CSC theory postulates that CSCs
exhibit characteristics similar to those of normal stem cells
(26,27), while RT-qPCR analysis revealed that
long-term passage has no effects on the expression of ES genes.
Collectively, those results suggested that long-term passage
decreases the functional properties but not the ES expression of
the stem cell-like SP fraction derived from A549 and NSCLC
cells.
Tumor initiation and serial transplantation in
immunocompromised mice was previously recommended as the golden
standard for the identification of CSCs (20,21). The
present results suggested that the tumor-initiating frequency in
2nd passage SP cells was higher than in 50th passage SP cells. The
invasion capacity of CSCs has been frequently associated with the
EMT (28,29). E-cadherin and N-cadherin have been
regarded as inducers of EMT (22).
Loss of E-cadherin expression is emerging as one of the most common
indicators of EMT onset, and its reduced expression in various
cancers was previously associated with tumor progression and
metastasis (22). N-cadherin was
reported to be associated with an increased invasive potential in
cancer (22). Snail has been
described as a direct repressor of E-cadherin whose overexpression
leads to a reduced expression of E-cadherin (29). A further molecule known to trigger EMT
is Twist, and upregulation of Twist resulted in an increase of
N-cadherin (23). RT-qPCR analysis
indicated that N-cadherin, Snail and Twist genes were
overexpressed, while E-cadherin expression was decreased, in 2nd
passage cells compared with 50th passage cells. Those results
indicated that aggressive malignancy features (such as
tumor-initiating and migration abilities) of SP cells were
inhibited by long-term passage.
According to the CSCs theory, current therapy
options have limited capacities to destroy CSCs and tumor relapsed
by resident CSCs (24,25). The present study demonstrated that low
passage cells were particularly resistant to ionizing radiation.
Regarding doxorubicin sensitivity, low-passage cells only expressed
significant resistance following a high dose of exposure. Apoptosis
is the process of cell death in tumors following cancer treatment
(such as chemotherapy and radiotherapy) (17,30,31). A
previous study has revealed that the majority of therapy resistance
results from failure of the cancer treatment to induce apoptosis
pathways (30,31). The present study revealed that 50th
passage cells exhibit reduced doxorubicin and radiation-induced
apoptotic cell death.
In summary, the present in vitro and in
vivo studies demonstrated that CSC-like functional properties
(such as sphere and clone formation efficiency, aggressive
malignancy features and resistance to anticancer treatment) of
long-term passage SP cells were diminished. However, the expression
of ES genes was not affected by long-term passaging. This finding
may partly explain the current confusing results, and suggests that
low-passage cell lines and primary cancer cells should be used in
the CSCs field.
References
|
1
|
Jemal A, Bray F, Center MM, Ferlay J, Ward
E and Forman D: Global cancer statistics. CA Cancer J Clin.
61:69–90. 2011. View Article : Google Scholar : PubMed/NCBI
|
|
2
|
Siegel R, Ma J, Zou Z and Jemal A: Cancer
statistics, 2014. CA Cancer J Clin. 64:9–29. 2014. View Article : Google Scholar : PubMed/NCBI
|
|
3
|
Stewart BW and Kleihues P: World Cancer
Report 2003. IARC Press. Lyon: 182–185. 2003.
|
|
4
|
García-Campelo R, Bernabé R, Cobo M,
Corral J, Coves J, Dómine M, Nadal E, Rodriguez-Abreu D, Viñolas N
and Massuti B: SEOM clinical guidelines for the treatment of
non-small cell lung cancer (NSCLC) 2015. Clin Transl Oncol.
17:1020–1029. 2015. View Article : Google Scholar : PubMed/NCBI
|
|
5
|
Ho MM, Ng AV, Lam S and Hung JY: Side
population in human lung cancer cell lines and tumors is enriched
with stem-like cancer cells. Cancer Res. 67:4827–4833. 2007.
View Article : Google Scholar : PubMed/NCBI
|
|
6
|
Gao YJ, Li B, Wu XY, Cui J and Han JK:
Thyroid tumor-initiating cells: Increasing evidence and
opportunities for anticancer therapy (review). Oncol Rep.
31:1035–1042. 2014.PubMed/NCBI
|
|
7
|
Freitas DP, Teixeira CA, Santos-Silva F,
Vasconcelos MH and Almeida GM: Therapy-induced enrichment of
putative lung cancer stem-like cells. Int J Cancer. 134:1270–1278.
2014. View Article : Google Scholar : PubMed/NCBI
|
|
8
|
Eramo A, Lotti F, Sette G, Pilozzi E,
Biffoni M, Di Virgilio A, Conticello C, Ruco L, Peschle C and De
Maria R: Identification and expansion of the tumorigenic lung
cancer stem cell population. Cell Death Differ. 15:504–514. 2008.
View Article : Google Scholar : PubMed/NCBI
|
|
9
|
Salcido CD, Larochelle A, Taylor BJ,
Dunbar CE and Varticovski L: Molecular characterisation of side
population cells with cancer stem cell-like characteristics in
small-cell lung cancer. Br J Cancer. 102:1636–1644. 2010.
View Article : Google Scholar : PubMed/NCBI
|
|
10
|
Sung JM, Cho HJ, Yi H, Lee CH, Kim HS, Kim
DK, Abd El-Aty AM, Kim JS, Landowski CP, Hediger MA and Shin HC:
Characterization of a stem cell population in lung cancer A549
cells. Biochem Biophys Res Commun. 371:163–167. 2008. View Article : Google Scholar : PubMed/NCBI
|
|
11
|
Sundareshan P and Hendrix MJ: Growth,
morphologic, and invasive characteristics of early and late
passages of a human endometrial carcinoma cell line (RL95-2). In
Vitro Cell Dev Biol. 28A:544–552. 1992. View Article : Google Scholar : PubMed/NCBI
|
|
12
|
Wenger SL, Senft JR, Sargent LM, Bamezai
R, Bairwa N and Grant SG: Comparison of established cell lines at
different passages by karyotype and comparative genomic
hybridization. Biosci Rep. 24:631–639. 2004. View Article : Google Scholar : PubMed/NCBI
|
|
13
|
Briske-Anderson MJ, Finley JW and Newman
SM: The influence of culture time and passage number on the
morphological and physiological development of Caco-2 cells. Proc
Soc Exp Biol Med. 214:248–257. 1997. View Article : Google Scholar : PubMed/NCBI
|
|
14
|
Xie G, Zhan J, Tian Y, Liu Y, Chen Z, Ren
C, Sun Q, Lian J, Chen L, Ruan J, et al: Mammosphere cells from
high-passage MCF7 cell line show variable loss of tumorigenicity
and radioresistance. Cancer Lett. 316:53–61. 2012. View Article : Google Scholar : PubMed/NCBI
|
|
15
|
Goodell MA, Brose K, Paradis G, Conner AS
and Mulligan RC: Isolation and functional properties of murine
hematopoietic stem cells that are replicating in vivo. J Exp Med.
183:1797–1806. 1996. View Article : Google Scholar : PubMed/NCBI
|
|
16
|
Schmittgen TD and Livak KJ: Analyzing
real-time PCR data by the comparative C(T) method. Nat Protoc.
3:1101–1108. 2008. View Article : Google Scholar : PubMed/NCBI
|
|
17
|
Wu XY, Fan RT, Yan XH, Cui J, Xu JL, Gu H
and Gao YJ: Endoplasmic reticulum stress protects human thyroid
carcinoma cell lines against ionizing radiation-induced apoptosis.
Mol Med Rep. 11:2341–2347. 2015.PubMed/NCBI
|
|
18
|
Pastrana E, Silva-Vargas V and Doetsch F:
Eyes wide open: A critical review of sphere-formation as an assay
for stem cells. Cell Stem Cell. 8:486–498. 2011. View Article : Google Scholar : PubMed/NCBI
|
|
19
|
Zhang P, Zhang Y, Mao L, Zhang Z and Chen
W: Side population in oral squamous cell carcinoma possesses tumor
stem cell phenotypes. Cancer Lett. 277:227–234. 2009. View Article : Google Scholar : PubMed/NCBI
|
|
20
|
Ailles LE and Weissman IL: Cancer stem
cells in solid tumors. Curr Opin Biotechnol. 18:460–466. 2007.
View Article : Google Scholar : PubMed/NCBI
|
|
21
|
Clarke MF, Dick JE, Dirks PB, Eaves CJ,
Jamieson CH, Jones DL, Visvader J, Weissman IL and Wahl GM: Cancer
stem cells-perspectives on current status and future directions:
AACR Workshop on cancer stem cells. Cancer Res. 66:9339–9344. 2006.
View Article : Google Scholar : PubMed/NCBI
|
|
22
|
Huber MA, Kraut N and Beug H: Molecular
requirements for epithelial-mesenchymal transition during tumor
progression. Curr Opin Cell Biol. 17:548–558. 2005. View Article : Google Scholar : PubMed/NCBI
|
|
23
|
Kang Y and Massagué J:
Epithelial-mesenchymal transitions: Twist in development and
metastasis. Cell. 118:277–279. 2004. View Article : Google Scholar : PubMed/NCBI
|
|
24
|
Milas L and Hittelman WN: Cancer stem
cells and tumor response to therapy: Current problems and future
prospects. Semin Radiat Oncol. 19:96–105. 2009. View Article : Google Scholar : PubMed/NCBI
|
|
25
|
Pajonk F, Vlashi E and McBride WH:
Radiation resistance of cancer stem cells: The 4 R's of
radiobiology revisited. Stem Cells. 28:639–648. 2010. View Article : Google Scholar : PubMed/NCBI
|
|
26
|
Ratajczak MZ: Cancer stem cells-normal
stem cells ‘Jedi’ that went over to the ‘dark side’. Folia
Histochem Cytobiol. 43:175–181. 2005.PubMed/NCBI
|
|
27
|
Dalerba P, Cho RW and Clarke MF: Cancer
stem cells: Models and concepts. Annu Rev Med. 58:267–284. 2007.
View Article : Google Scholar : PubMed/NCBI
|
|
28
|
Nurwidya F, Takahashi F, Murakami A and
Takahashi K: Epithelial mesenchymal transition in drug resistance
and metastasis of lung cancer. Cancer Res Treat. 44:151–156. 2012.
View Article : Google Scholar : PubMed/NCBI
|
|
29
|
Cano A, Pérez-Moreno MA, Rodrigo I,
Locascio A, Blanco MJ, del Barrio MG, Portillo F and Nieto MA: The
transcription factor snail controls epithelial-mesenchymal
transitions by repressing E-cadherin expression. Nat Cell Biol.
2:76–83. 2000. View Article : Google Scholar : PubMed/NCBI
|
|
30
|
Verheij M and Bartelink H:
Radiation-induced apoptosis. Cell Tissue Res. 301:133–142. 2000.
View Article : Google Scholar : PubMed/NCBI
|
|
31
|
Kaufmann SH and Earnshaw WC: Induction of
apoptosis by cancer chemotherapy. Exp Cell Res. 256:42–49. 2000.
View Article : Google Scholar : PubMed/NCBI
|