Introduction
Osteosarcoma (OS) is an aggressive malignant
neoplasm. It arises from primitive transformed cells of mesenchymal
origin (and thus a sarcoma), exhibits osteoblastic differentiation
and produces malignant osteoid (1).
The main symptoms of OS are local pain and swelling (2,3). More than
half of all OS cases arise in the long bones of the limbs,
particularly the knee (4). Although
OS is a rare tumor, with annual age-adjusted rates of 1.0 per
100,000 males and 0.6 per 100,000 females, it is the most common
histological form of primary bone cancer (5). Furthermore, OS is the eighth most
commonly occurring childhood cancer (5). In addition, the prognosis is poorer
(with a cure rate of ~30%) for tumors located in the axial skeleton
and in patients with metastasis at onset (6). OS has become a significant health
concern.
Great achievements have been obtained in exploring
the pathological mechanism of OS development. Certain genes have
been identified to exert key roles in OS progression.
Single-nucleotide polymolphisms of insulin-like growth factor 2
receptor are associated with an increased risk of OS (7). The phosphoprotein p53 gene as an
anti-oncogene is associated with controlling the cell cycle in OS
(8) and mutations in the p53 gene
correlate significantly with the presence of high levels of genomic
instability, which lead to cancerization in OS (9). Furthermore, microRNAs (miRs) play a
significant role in cancer cell growth and migration; for example,
miR-199a-3p decreases cell growth and migration in OS cell lines
significantly (10). In addition,
significant pathways have also been determined to exhibit critical
roles in OS. The phosphoinositide 3-kinase (PI3K/Akt) pathway is
well known to be a major cell survival pathway in OS (11–13). Akt
regulates several downstream targets resulting in cell growth,
survival and cisplatin resistance. The activity of the receptor
activator of nuclear factor κB ligand (RANKL) pathway is essential
for tumorigenic osteolysis and creates a suitable context for tumor
expansion as they increase tumor cell proliferation (14). Achievements in understanding the
mechanism of OS contribute to the therapy of this cancer. However,
the present knowledge of the molecular mechanism of OS development
remains insufficient.
In this study, a biological informatics approach was
applied to analyze the gene expression profiles in OS and a
functional analysis of differentially expressed genes (DEGs)
between OS cells and matched normal tissues was performed.
Furthermore, relevant transcription factor (TF) genes, tumor
suppressor genes (TSGs) and tumor-associated genes (TAGs) were
analyzed. In addition, the protein-protein interaction (PPI)
network and modules were constructed. The aim of the present study
was to provide a systematic perspective to understanding the
mechanism and identifying new therapeutic targets for OS.
Materials and methods
Affymetrix microarray data
The gene expression profile of GSE11414 was obtained
from the National Center of Biotechnology Information (NCBI) Gene
Expression Omnibus database (http://www.ncbi.nlm.nih.gov/geo/). Expression profiles
were derived from six samples including two samples of human OS
cell lines U2OS (ATCC no. HTB-96), two MG63 cell lines (ATCC no.
CRL-1427) and two normal human osteoblast cell lines. In this
study, the raw data and annotation files were downloaded based on
the platform of GPL6244 (Affymetrix Human Gene 1.0 ST array,
Affymetrix, Inc., Santa Clara, CA, USA).
Data pre-processing and analysis of
DEGs
The pre-processing of raw expression data, including
background correction, quantile normalization and probe
summarization, was performed using the robust multiarray average
(15) algorithm with application of
the Affymetrix package in the R statistical software program (Bell
Laboratories Inc., Madison, WI, USA) (16) and Affymetrix annotation files supplied
by the Brain Array Lab (Microarray Lab, University of Michigan, Ann
Arbor, MI, USA). If multiple probes corresponded to the same gene,
the mean value was calculated as the expression value of this gene.
For the GSE11414 dataset, the paired t-test of the limma package
(Fred Hutchinson Cancer Research Center, Seattle, WA, USA)
(17) was used to identify DEGs. The
multiple testing correction was performed to control the false
discovery rate (FDR) with the application of the significance
analysis of the microarray procedure. Genes with FDR <0.05 and
|log fold change (FC)| >2.0 were considered as significantly
differentially expressed.
Pathway and gene ontology (GO)
functional enrichment analysis of DEGs
The Kyoto Encyclopedia of Genes and Genomes (KEGG)
is a knowledge base for systematic analysis of gene functions and
enzymatic pathways and linking genomic information with higher
order functional information (18).
Reactome is an open-source, manually curated database of reactions,
pathways and biological processes (19). GO analysis is a commonly used approach
for functional studies of genomic or transcriptomic data (20). The Database for Annotation,
Visualization and Integrated Discovery (DAVID) (21) provides exploratory visualization tools
that promote identification via functional classification and
biochemical pathway maps, and conserve protein domain architectures
(22). In order to analyze the DEGs
at the functional level, GO annotation and KEGG pathway enrichment
analysis was performed for DEGs by DAVID, and reactome pathways
were also identified. P<0.01 was selected as the cut-off
criterion.
Functional annotation of DEGs
The TSG database (TSGene) provides detailed
annotations for each TSG, including cancer mutations, gene
expressions, methylation sites, TF regulations and PPIs (23). The TAG database was designed to
utilize information from well-characterized oncogenes and TSGs to
facilitate cancer research (24).
According to the data on TFs, the enriched DEGs for transcription
regulation were selected based on the GO, KEGG and reactome
annotation terms. Additionally, the selected DEGs were mapped onto
the TSGene and TAG databases to extract the oncogenes and cancer
suppressor genes.
PPI network construction and network
module analysis
The search tool for the retrieval of interacting
genes (STRING) is an online database which provides uniquely
comprehensive coverage and ease of access to PPI information
(25). In this study, the PPIs of
upregulated and downregulated DEGs were analyzed by STRING with the
cut-off criterion of a combined score >0.4. Then the network was
visualized using cytoscape software (Institute for Systems Biology,
Seattle, WA, USA) (26). Furthermore,
the connectivity degree of the network was analyzed by the network
statistics method and used to obtain the hub protein in the PPI
network. The node degree threshold was set to 15 (degree ≥15).
Finally, the modules of the PPI network were constructed using
cluster analysis with the overlapping neighborhood expansion
(Cluster ONE) cytoscape plug-in. P<0.01 was selected as the
cut-off criterion.
Results
Identification of DEGs
Using the cut-off criteria of FDR <0.05 and |log
FC| >2.0, we finally obtained 973 DEGs, comprising 359 up- and
614 downregulated genes.
Pathway enrichment analysis
The KEGG pathway analysis revealed that the
upregulated DEGs were only enriched in the axon guidance pathway
(Table I). The downregulated DEGs
were significantly enriched in eight KEGG pathways, and are listed
in Table I. Cyclin D1 (CCND1)
was involved in the focal adhesion pathway, and integrins α5
(ITGA5) and α7 (ITGA7) were involved in the focal
adhesion and extracellular matrix (ECM)-receptor interaction
pathways.
 | Table I.KEGG pathway enrichment analysis for
DEGs. |
Table I.
KEGG pathway enrichment analysis for
DEGs.
| Pathway | Gene count | P-value |
|---|
| Upregulated
DEGs |
|
|
| Axon
guidance | 12 | 2.45E-03 |
| Downregulated
DEGs |
|
|
| Focal
adhesion | 19 | 6.08E-05 |
|
Lysosome | 14 | 7.18E-05 |
|
ECM-receptor interaction | 11 | 1.59E-04 |
| Mucin
type O-Glycan biosynthesis | 6 | 4.96E-04 |
|
Arachidonic acid
metabolism | 7 | 4.18E-03 |
|
Rheumatoid arthritis | 9 | 4.25E-03 |
|
Hypertrophic
cardiomyopathy | 8 | 8.05E-03 |
|
Malaria | 6 | 8.19E-03 |
Reactome pathway analysis revealed 14 pathways in
the upregulated DEGs, and the top five pathways were chromosome
maintenance, establishment of sister chromatid cohesion, neural
cell adhesion molecule signaling for neurite outgrowth, cell cycle
and meiotic synapsis. The downregulated DEGs were enriched in 22
pathways in the reactome pathway analysis and the top five were ECM
organization, smooth muscle contraction, elastic fibre formation,
integrin cell surface interactions, and synthesis of prostaglandins
and thromboxanes.
GO enrichment analysis
The top five functional nodes in each GO category of
up- and downregulated DEGs are listed in Table II. GO annotation indicated that the
upregulated DEGs were primarily enriched during the cell cycle and
the proliferation process. The downregulated DEGs predominantely
participated in the process of cell adhesion, regulation of cell
proliferation and extracellular region.
| Table II.GO enrichment analysis for DEGs. |
Table II.
GO enrichment analysis for DEGs.
| Category | Term | Gene count | P-value |
|---|
| Upregulated
DEGs |
|
|
|
|
GOTERM_BP_FAT | GO:0007049~cell
cycle | 52 | 1.56E-06 |
|
GOTERM_BP_FAT | GO:0090304~nucleic
acid metabolic process | 116 | 6.80E-06 |
|
GOTERM_BP_FAT |
GO:0006139~nucleobase-containing compound
metabolic process | 131 | 7.64E-06 |
|
GOTERM_BP_FAT | GO:0034641~cellular
nitrogen compound metabolic process | 138 | 8.94E-06 |
|
GOTERM_BP_FAT | GO:0022402~cell
cycle process | 41 | 1.11E-05 |
|
GOTERM_MF_FAT |
GO:1901363~heterocyclic compound
binding | 129 | 7.52E-06 |
|
GOTERM_MF_FAT | GO:0005003~ephrin
receptor activity |
5 | 9.42E-06 |
|
GOTERM_MF_FAT | GO:0097159~organic
cyclic compound binding | 129 | 1.62E-05 |
|
GOTERM_MF_FAT | GO:0003676~nucleic
acid binding | 89 | 2.20E-05 |
|
GOTERM_MF_FAT | GO:0019900~kinase
binding | 19 | 1.97E-04 |
|
GOTERM_CC_FAT |
GO:0005634~nucleus | 161 | 1.56E-11 |
|
GOTERM_CC_FAT |
GO:0043227~membrane-bounded organelle | 214 | 3.58E-07 |
|
GOTERM_CC_FAT |
GO:0005622~intracellular | 255 | 3.91E-07 |
|
GOTERM_CC_FAT | GO:0044464~cell
part | 283 | 4.79E-07 |
|
GOTERM_CC_FAT |
GO:0005623~cell | 283 | 4.86E-07 |
| Downregulated
DEGs |
|
|
|
|
GOTERM_BP_FAT | GO:0007155~cell
adhesion | 74 | 1.93E-11 |
|
GOTERM_BP_FAT |
GO:0022610~biological adhesion | 74 | 2.13E-11 |
|
GOTERM_BP_FAT |
GO:0030198~extracellular matrix
organization | 36 | 1.16E-10 |
|
GOTERM_BP_FAT |
GO:0043062~extracellular structure
organization | 36 | 1.27E-10 |
|
GOTERM_BP_FAT |
GO:0042127~regulation of cell
proliferation | 83 | 3.29E-10 |
|
GOTERM_MF_FAT | GO:1901681~sulfur
compound binding | 20 | 3.46E-07 |
|
GOTERM_MF_FAT |
GO:0005539~glycosaminoglycan binding | 20 | 4.60E-07 |
|
GOTERM_MF_FAT |
GO:0005520~insulin-like growth factor
binding |
8 | 5.68E-07 |
|
GOTERM_MF_FAT |
GO:0097367~carbohydrate derivative
binding | 21 | 6.04E-07 |
|
GOTERM_MF_FAT | GO:0008201~heparin
binding | 17 | 6.55E-07 |
|
GOTERM_CC_FAT |
GO:0005576~extracellular region | 146 | 0 |
|
GOTERM_CC_FAT |
GO:0044421~extracellular region part | 91 | 4.44E-16 |
|
GOTERM_CC_FAT |
GO:0005615~extracellular space | 72 | 3.29E-14 |
|
GOTERM_CC_FAT |
GO:0031012~extracellular matrix | 43 | 2.01E-11 |
|
GOTERM_CC_FAT |
GO:0043202~lysosomal lumen | 13 | 4.80E-07 |
Function analysis of DEGs
There were 17 upregulated and 15 downregulated DEGs
mapped onto the TF database (Table
III). The DEGs mapped onto the TAG database analysis indicated
that 61 downregulated DEGs were detected, comprising 12 oncogenes,
42 TSGs and 7 genes with an unclear impact on tumors, while 27
upregulated DEGs were identified, comprising 6 oncogenes, 18 TSGs
and 3 genes with an unclear impact on tumors (Table III).
| Table III.Functional analysis of DEGs. |
Table III.
Functional analysis of DEGs.
|
| TF genes | TAG-tumor
suppressor | TAG-oncogene | TAG-other |
|---|
| Upregulated
DEGs | ZNF33A, ZNF146,
ZNF124, | ANP32A, ARID2,
BAI2, | CSE1L | BCL9 |
|
| TP73, TGIF2,
SREBF1, | BRCA1, CDKN1B,
CHEK2, | MERTK | CHD1 |
|
| REL, POU2F1,
PITX2, | EHF, EPHB2, EPHB4,
JUP, | MLF1 | SKP2 |
|
| MXI1, KLF11,
HOXB9, | LIN9, MSH2,
MXI1, | REL |
|
|
| HOXB7, HOXB6,
HOXB3, | NDRG2, RASSF2,
RB1CC1, | TPD52 |
|
|
| EHF, BRCA1 | SHPRH, TP73 | ZNF146 |
|
| Downregulated
DEGs | ZNF43, TWIST1,
TBX2, | ADPRH,
ARHGAP20, | CCND1 | CAV1 |
|
| STAT6, STAT4,
SMAD6, | CAV2, CDH11,
CDKN1A, | FOSL1 | CBLB |
|
| NFATC4, MEOX2,
LMO3, | CDKN2A, DLC1,
DOK1, | HOXA10 | CCL2 |
|
| IRF6, ID2, HOXA10,
HEY2, | DPP4, GLIPR1,
HTRA1, | METCDR1 |
|
|
| FOXP2, EGR3 | IGFBP3, IGFBP4,
IGFBP7, | MME | MAP1A |
|
|
| ITGA5, ITGA7, LXN,
MEG3, | MRAS | SFRP4 |
|
|
| WNT5A, UHRF2,
MIR125B1, | RAB23 | WISP3 |
|
|
|
| MIR145, MIR29A,
MTSS1, | RUNX1T1 |
|
|
|
| PCDH10, PYCARD,
RARB, | SERTAD2 |
|
|
|
| TPM1, RARRES1,
RNASET2, | SPHK1 |
|
|
|
| RND3, SLIT2, SPRY2,
TCEAL7, | TWIST1 |
|
|
|
| TCTA, TFPI2,
TGFBR3, THBD, | WISP2 |
|
|
|
| THSD1, THY1,
TNFAIP3, |
|
|
|
|
| TNFRSF10A |
|
|
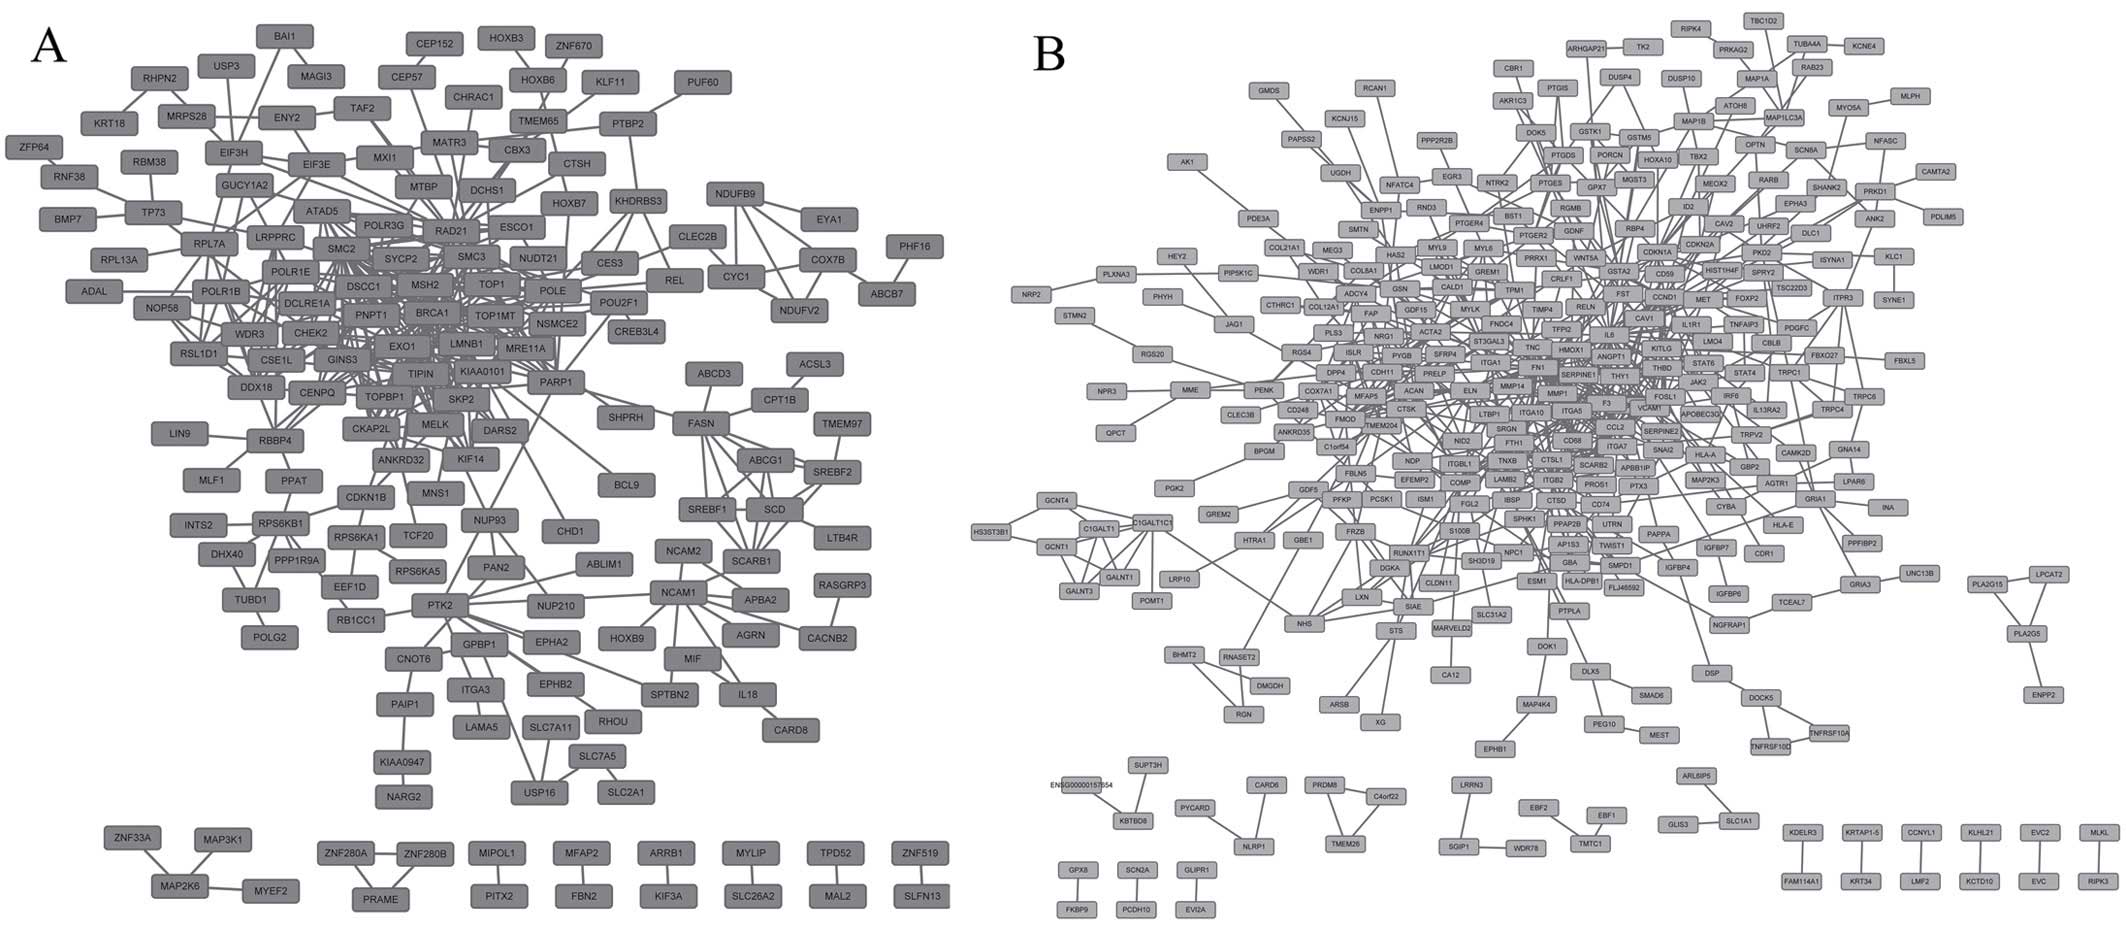
PPI network analysis
By submitting the upregulated and downregulated
genes into STRING, respectively, we obtained PPIs associated with
the DEGs. Fig. 1A demonstrates that
the upregulated PPI network was constructed with 170 nodes and 362
edges. The nodes of breast-ovarian cancer gene 1 (BRCA1,
degree=27) and melanocyte-stimulating hormone 2 (MSH2,
degree=26) were hub proteins. Fig. 1B
reveals that the downregulated PPI network was constructed with 332
nodes and 679 edges. Fibronectin 1 (FN1, degree=55),
CCND1 (degree=18) and ITGA5 (degree=16) were hub
proteins in the network.
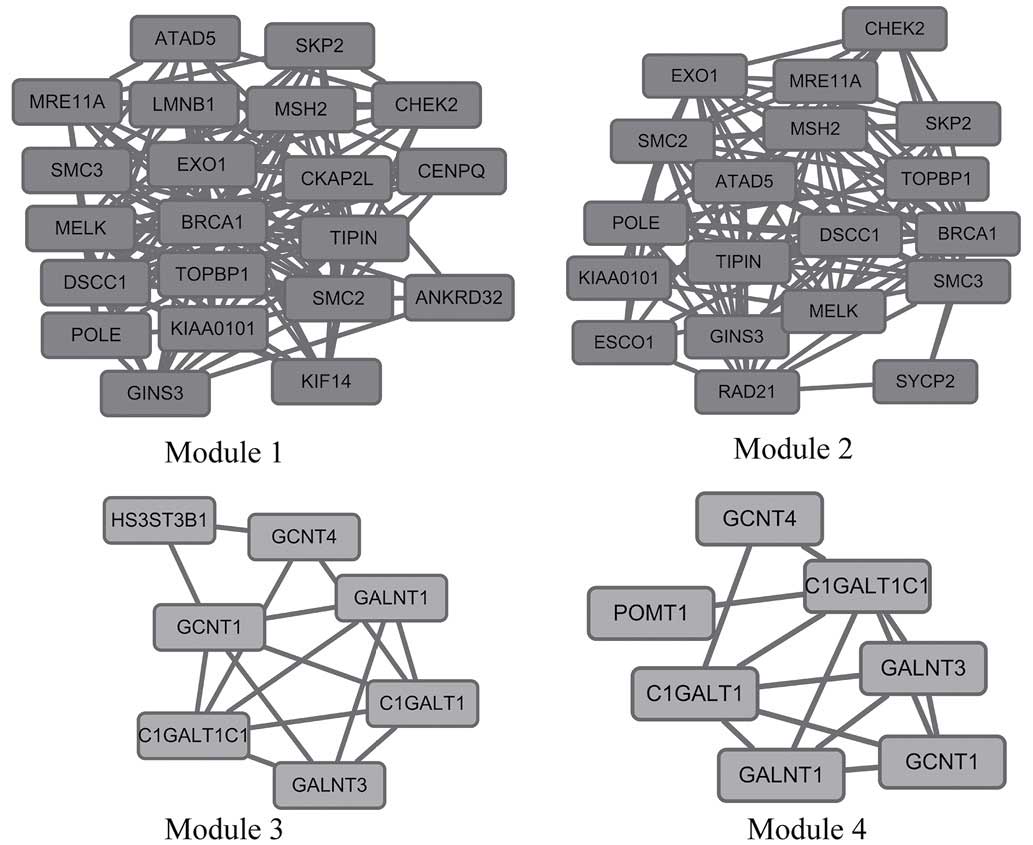
Module analysis
A total of 18 modules were identified in upregulated
PPI network, among which the best one was module 1 (Fig. 2). Module 1 was composed of 21 nodes
and 120 edges; P=2.771E-7. The hub proteins of BRCA1
(degree=20) and MSH2 (degree=14) were involved in module
1.
The downregulated PPI network contained 46 modules,
of which the best one was module 4 (Fig.
2). It was constructed with 7 nodes and 13 edges; P=0.02. The
hub proteins of core 1 β3-Gal-T-specific molecular chaperone
(C1GALT1C1, degree=5) and core 1 β3 Galactosyltransferase
(C1GALT1, degree=5) were involved in it.
Discussion
Although OS is a relatively uncommon cancer, it is
the most common primary bone malignancy in children and young
adults (27). In previous studies,
gene expression profiling has been used to identify TFs and
pathways associated with OS (27) as
well as genome-wide changes in OS cell lines (28). In this study, GO and PPI analyses
indicated that DEGs including ITGA5 were significantly
dysregulated and were also involved in ECM-receptor interaction and
the focal adhesion pathway. Module analysis revealed that
BRCA1 and MSH2 were hub proteins in module 1 of the
upregulated PPI network. In addition, CCND1 was a hub
protein in the downregulated PPI network.
ITGA5 is an essential member of the integrin
family, which belongs to cell adhesion receptors targeting cell
adhesion to the ECM (29).
ITGA5 combines with integrin β1 to form heterodimers to
mediate cell adhesion on fibronectin (29). In human OS cells, ITGA5 is
regulated by transforming growth factor β, and is involved in the
adhesion of tumor cells to laminin (30). It has been reported that a decrease in
adhesion of intact cells to fibronectin is correlated with a
decrease in the ability of α5β1 integrin in human OS (31). Furthermore, the upregulation of α5β1
integrin contributes to tumor invasion and metastatic potential
(32). In the present study, ITGA5
was also found to be associated with pathways involved in focal
adhesion and ECM-receptor interaction. Focal adhesion connects the
cell cytoskeleton and the ECM through integrins (33). Accordingly, ITGA5 exhibited a
crucial role in the OS development via cell adhesion.
BRCA1 is a TSG (34) identified in all humans. It is
responsible for repairing DNA damage (35) and is involved in cell cycle control
(36). This corresponded with the
function analysis and pathway analysis in the present study. The
overexpression of BRCA1 repairs the damage in OS cell lines
by enhancing the global genomic repair pathway, whereas knockdown
of BRCA1 inhibits nuclear localization of the vitamin D
receptor which is present in osteoblasts and affects osteoblast
functions, including proliferation, apoptosis and mineralization
(37). Furthermore, induction of
BRCA1 triggers apoptosis in OS via the activation of the
c-Jun N-terminal kinase/stress-activated protein kinase signaling
pathway (38). Additionally, the TF
analysis revealed that BRCA1 belongs to the TFs, and this
has been verified in OS (39). The
carboxyl terminus of BRCA1, when fused to the heterologous
Gal4 DNA binding domain, activates transcription, which is
inhibited when cancer predisposing mutations are introduced in the
BRCA1 component (40,41). The present study revealed that the
BRCA1 gene was upregulated in the progression of OS and it
was a hub protein with degree score of 20 in module 1. The
BRCA1 gene was a key regulator in the progression of OS.
MSH2, as a DNA mismatch repair (MMR) protein,
is a tumor suppressor. This corresponded with the present analysis
of TSGs. It forms a heterodimer with MSH6 or MSH3 to
form the DNA repair complex. A previous study demonstrated that
MSH2 promotes methylation, microsatellite instability and
various mutational events associated with development of OS
(42). It also distinguishes OS
cancer stem cells from normal cells by mediating DNA repair
(43). Furthermore, the increased
expression of MSH2 enhances the drug resistance of OS by
mediating MMR when chemotherapeutic agents cause DNA damage
critically or interfere with cellular metabolism (44). In addition, MSH2 associates
with BRCA1 to form a large complex which is involved in the
recognition and repair of aberrant DNA structures (45). Conversely, CCND1, which belongs
to the TAGs, is characterized by a significant periodicity in
protein abundance throughout the cell cycle. It has been reported
that D-type cyclin exhibits a role in the progression of OS through
the cell cycle (46). A previous
study confirmed that the suppression of CCND1 caused by
miR-15a and miR-16-1 reduces OS cell proliferation via cell cycle
arrest, and that the activated CCND1 may have the ability to
induce apoptosis (47). Therefore,
MSH2 and CCND1 are considered to exhibit key roles in
OS development.
In conclusion, the present study observed that a
number of genes with altered expression were associated with the
development and progression of OS. The genes of ITGA5,
BRCA1, MSH2 and CCND1, which are involved in cell
adhesion, DNA repair or cell cycle progression, exhibit significant
roles in the development of OS. The current study indicates that
these genes may present potential targets in the treatment of OS.
However, further evaluation of the potential applications is
required.
References
|
1
|
Luetke A, Meyers PA, Lewis I and Juergens
H: Osteosarcoma treatment - where do we stand? A state of the art
review. Cancer Treat Rev. 40:523–532. 2014. View Article : Google Scholar : PubMed/NCBI
|
|
2
|
Pan KL, Chan WH and Chia YY: Initial
symptoms and delayed diagnosis of osteosarcoma around the knee
joint. J Orthop Surg (Hong Kong). 18:2010. View Article : Google Scholar : PubMed/NCBI
|
|
3
|
Rytting M, Pearson P, Raymond AK, Ayala A,
Murray J, Yasko AW, Johnson M and Jaffe N: Osteosarcoma in
preadolescent patients. Clin Orthop Relat Res. 39–50. 2000.
View Article : Google Scholar : PubMed/NCBI
|
|
4
|
Unni KK and Inwards CY: Dahlin's Bone
Tumors: General Aspects and Data on 10,165 Cases. Lippincott
Williams & Wilkins; Philadelphia: 2010
|
|
5
|
Ottaviani G and Jaffe N: The epidemiology
of osteosarcomaPediatric and Adolescent Osteosarcoma. Jaffe N,
Bruland OS and Bielack S: Springer; New York: pp. 3–13. 2010
|
|
6
|
Picci P: Osteosarcoma (Osteogenic
sarcoma). Orphanet J Rare Dis. 2:62007. View Article : Google Scholar : PubMed/NCBI
|
|
7
|
Savage SA, Woodson K, Walk E, Modi W, Liao
J, Douglass C, Hoover RN and Chanock SJ: National Osteosarcoma
Etiology Study Group: Analysis of genes critical for growth
regulation identifies insulin-like growth factor 2 receptor
variations with possible functional significance as risk factors
for osteosarcoma. Cancer Epidemiol Biomarkers Prev. 16:1667–1674.
2007. View Article : Google Scholar : PubMed/NCBI
|
|
8
|
Liu Z, Liu Q, Xu B, Wu J, Guo C, Zhu F,
Yang Q, Gao G, Gong Y and Shao C: Berberine induces p53-dependent
cell cycle arrest and apoptosis of human osteosarcoma cells by
inflicting DNA damage. Mutat Res. 662:75–83. 2009. View Article : Google Scholar : PubMed/NCBI
|
|
9
|
Overholtzer M, Rao PH, Favis R, Lu XY,
Elowitz MB, Barany F, Ladanyi M, Gorlick R and Levine AJ: The
presence of p53 mutations in human osteosarcomas correlates with
high levels of genomic instability. Proc Natl Acad Sci USA.
100:11547–11552. 2003. View Article : Google Scholar : PubMed/NCBI
|
|
10
|
Duan Z, Choy E, Harmon D, Liu X, Susa M,
Mankin H and Hornicek F: MicroRNA-199a-3p is downregulated in human
osteosarcoma and regulates cell proliferation and migration. Mol
Cancer Ther. 10:1337–1345. 2011. View Article : Google Scholar : PubMed/NCBI
|
|
11
|
Díaz-Montero CM, Wygant JN and McIntyre
BW: PI3-K/Akt-mediated anoikis resistance of human osteosarcoma
cells requires Src activation. Eur J Cancer. 42:1491–1500. 2006.
View Article : Google Scholar : PubMed/NCBI
|
|
12
|
Cenni V, Maraldi NM, Ruggeri A, Secchiero
P, Del Coco R, De Pol A, Cocco L and Marmiroli S: Sensitization of
multidrug resistant human ostesarcoma cells to Apo2
Ligand/TRAIL-induced apoptosis by inhibition of the Akt/PKB kinase.
Int J Oncol. 25:1599–1608. 2004.PubMed/NCBI
|
|
13
|
Inoue R, Matsuki NA, Jing G, Kanematsu T,
Abe K and Hirata M: The inhibitory effect of alendronate, a
nitrogen-containing bisphosphonate on the PI3K-Akt-NFκB pathway in
osteosarcoma cells. Br J Pharmacol. 146:633–641. 2005. View Article : Google Scholar : PubMed/NCBI
|
|
14
|
Chirgwin JM and Guise TA: Molecular
mechanisms of tumor-bone interactions in osteolytic metastases. Br
J Pharmacol. 146:633–641. 2000.
|
|
15
|
Irizarry RA, Hobbs B, Collin F,
Beazer-Barclay YD, Antonellis KJ, Scherf U and Speed TP:
Exploration, normalization and summaries of high density
oligonucleotide array probe level data. Biostatistics. 4:249–264.
2003. View Article : Google Scholar : PubMed/NCBI
|
|
16
|
Bolstad BM, Irizarry RA, Åstrand M and
Speed TP: A comparison of normalization methods for high density
oligonucleotide array data based on variance and bias.
Bioinformatics. 19:185–193. 2003. View Article : Google Scholar : PubMed/NCBI
|
|
17
|
Smyth GK: Linear models and empirical
bayes methods for assessing differential expression in microarray
experiments. Stat Appl Genet Mol Biol. 3:2004.PubMed/NCBI
|
|
18
|
Kanehisa M and Goto S: KEGG: Kyoto
encyclopedia of genes and genomes. Nucleic Acids Res. 28:27–30.
2000. View Article : Google Scholar : PubMed/NCBI
|
|
19
|
Haw R, Hermjakob H, D'Eustachio P and
Stein L: Reactome pathway analysis to enrich biological discovery
in proteomics data sets. Proteomics. 11:3598–3613. 2011. View Article : Google Scholar : PubMed/NCBI
|
|
20
|
Harris MA, Clark J, Ireland A, Lomax J,
Ashburner M, Foulger R, Eilbeck K, Lewis S, Marshall B, Mungall C,
et al: The gene ontology (GO) database and informatics resource.
Nucleic Acids Res. 32:D258–D261. 2004. View Article : Google Scholar : PubMed/NCBI
|
|
21
|
da W Huang, Sherman BT and Lempicki RA:
Systematic and integrative analysis of large gene lists using DAVID
bioinformatics resources. Nat Protoc. 4:44–57. 2008. View Article : Google Scholar
|
|
22
|
Dennis G Jr, Sherman BT, Hosack DA, Yang
J, Gao W, Lane HC and Lempicki RA: DAVID: Database for Annotation,
Visualization and Integrated Discovery. Genome Biol. 4:P32003.
View Article : Google Scholar : PubMed/NCBI
|
|
23
|
Zhao M, Sun J and Zhao Z: TSGene: A web
resource for tumor suppressor genes. Nucleic Acids Res.
41:D970–D976. 2013. View Article : Google Scholar : PubMed/NCBI
|
|
24
|
Chen JS, Hung WS, Chan HH, Tsai SJ and Sun
HS: In silico identification of oncogenic potential of fyn-related
kinase in hepatocellular carcinoma. Bioinformatics. 29:420–427.
2013. View Article : Google Scholar : PubMed/NCBI
|
|
25
|
Szklarczyk D, Franceschini A, Kuhn M,
Simonovic M, Roth A, Minguez P, Doerks T, Stark M, Muller J, Bork
P, et al: The STRING database in 2011: functional interaction
networks of proteins, globally integrated and scored. Nucleic Acids
Res. 39:D561–D568. 2011. View Article : Google Scholar : PubMed/NCBI
|
|
26
|
Smoot ME, Ono K, Ruscheinski J, Wang PL
and Ideker T: Cytoscape 2.8: New features for data integration and
network visualization. Bioinformatics. 27:431–432. 2011. View Article : Google Scholar : PubMed/NCBI
|
|
27
|
Luo Y, Deng Z and Chen J: Pivotal
regulatory network and genes in osteosarcoma. Arch Med Sci.
9:569–575. 2013. View Article : Google Scholar : PubMed/NCBI
|
|
28
|
Sadikovic B, Yoshimoto M, Al-Romaih K,
Maire G, Zielenska M and Squire JA: In vitro analysis of integrated
global high-resolution DNA methylation profiling with genomic
imbalance and gene expression in osteosarcoma. PLoS One.
3:e28342008. View Article : Google Scholar : PubMed/NCBI
|
|
29
|
Desgrosellier JS and Cheresh DA: Integrins
in cancer: Biological implications and therapeutic opportunities.
Nat Rev Cancer. 10:9–22. 2010. View
Article : Google Scholar : PubMed/NCBI
|
|
30
|
Heino J and Massagué J: Transforming
growth factor-beta switches the pattern of integrins expressed in
MG-63 human osteosarcoma cells and causes a selective loss of cell
adhesion to laminin. J Biol Chem. 264:21806–21811. 1989.PubMed/NCBI
|
|
31
|
Adams JC and Watt FM: Changes in
keratinocyte adhesion during terminal differentiation: Reduction in
fibronectin binding precedes 51 integrin loss from the cell
surface. Cell. 63:425–435. 1990. View Article : Google Scholar : PubMed/NCBI
|
|
32
|
Kawashima A, Kawahara E, Tokuda R and
Nakanishi I: Tumour necrosis factor-alpha provokes upregulation of
alpha2beta1 and alpha5beta1 integrins, and cell migration in OST
osteosarcoma cells. Cell Biol Int. 25:319–329. 2001. View Article : Google Scholar : PubMed/NCBI
|
|
33
|
Qin L, Chen X, Wu Y, Feng Z, He T, Wang L,
Liao L and Xu J: Steroid receptor coactivator-1 upregulates
integrin α5 expression to promote breast cancer cell adhesion and
migration. Cancer Res. 71:1742–1751. 2011. View Article : Google Scholar : PubMed/NCBI
|
|
34
|
Duncan J, Reeves J and Cooke T: BRCA1 and
BRCA2 proteins: roles in health and disease. Mol Pathol.
51:237–247. 1998. View Article : Google Scholar : PubMed/NCBI
|
|
35
|
Yoshida K and Miki Y: Role of BRCA1 and
BRCA2 as regulators of DNA repair, transcription and cell cycle in
response to DNA damage. Cancer Sci. 95:866–871. 2004. View Article : Google Scholar : PubMed/NCBI
|
|
36
|
Yarden RI and Papa MZ: BRCA1 at the
crossroad of multiple cellular pathways: Approaches for therapeutic
interventions. Mol Cancer Ther. 5:1396–1404. 2006. View Article : Google Scholar : PubMed/NCBI
|
|
37
|
Deng C, Ueda E, Chen KE, Bula C, Norman
AW, Luben RA and Walker AM: Prolactin blocks nuclear translocation
of VDR by regulating its interaction with BRCA1 in osteosarcoma
cells. Mol Endocrinol. 23:226–236. 2009. View Article : Google Scholar : PubMed/NCBI
|
|
38
|
Harkin DP, Bean JM, Miklos D, Song YH,
Truong VB, Englert C, Christians FC, Ellisen LW, Maheswaran S,
Oliner JD and Haber DA: Induction of GADD45 and JNK/SAPK-dependent
apoptosis following inducible expression of BRCA1. Cell.
97:575–586. 1999. View Article : Google Scholar : PubMed/NCBI
|
|
39
|
Pao GM, Janknecht R, Ruffner H, Hunter T
and Verma IM: CBP/p300 interact with and function as
transcriptional coactivators of BRCA1. Proc Natl Acad Sci USA.
97:1020–1025. 2000. View Article : Google Scholar : PubMed/NCBI
|
|
40
|
Chapman MS and Verma IM: Transcriptional
activation by BRCA1. Nature. 382:678–679. 1996. View Article : Google Scholar : PubMed/NCBI
|
|
41
|
Monteiro AN, August A and Hanafusa H:
Evidence for a transcriptional activation function of BRCA1
C-terminal region. Proc Natl Acad Sci USA. 93:13595–13599. 1996.
View Article : Google Scholar : PubMed/NCBI
|
|
42
|
Ahmed H, Salama A, Salem SE and Bahnassy
AA: A case of synchronous double primary breast carcinoma and
osteosarcoma: Mismatch repair genes mutations as a possible cause
for multiple early onset malignant tumors. Am J Case Rep.
13:218–223. 2012. View Article : Google Scholar : PubMed/NCBI
|
|
43
|
Fujii H, Honoki K, Tsujiuchi T, Kido A,
Yoshitani K and Takakura Y: Sphere-forming stem-like cell
populations with drug resistance in human sarcoma cell lines. Int J
Oncol. 34:1381–1386. 2009.PubMed/NCBI
|
|
44
|
Liu B, Ma W, Jha RK and Gurung K: Cancer
stem cells in osteosarcoma: recent progress and perspective. Acta
Oncol. 50:1142–1150. 2011. View Article : Google Scholar : PubMed/NCBI
|
|
45
|
Wang Y, Cortez D, Yazdi P, Neff N, Elledge
SJ and Qin J: BASC, a super complex of BRCA1-associated proteins
involved in the recognition and repair of aberrant DNA structures.
Genes Dev. 14:927–939. 2000.PubMed/NCBI
|
|
46
|
Furlanetto RW, Harwell SE and Frick KK:
Insulin-like growth factor-I induces cyclin-D1 expression in MG63
human osteosarcoma cells in vitro. Mol Endocrinol. 8:510–517. 1994.
View Article : Google Scholar : PubMed/NCBI
|
|
47
|
Cai CK, Zhao GY, Tian LY, Liu L, Yan K, Ma
YL, Ji ZW, Li XX, Han K, Gao J, et al: miR-15a and miR-16-1
downregulate CCND1 and induce apoptosis and cell cycle arrest in
osteosarcoma. Oncol Rep. 28:1764–1770. 2012.PubMed/NCBI
|