Introduction
Lung cancer is a devastating disease and prognosis
is still poor especially in locally advanced stages where the
standard treatment is definite concurrent chemoradiotherapy (CCRT)
(1,2).
Tumor hypoxia is a critical factor of the tumor microenvironment
which negatively impacts response to CCRT in many human cancers,
including lung cancer (3–7).
Predictive and prognostic factors which specifically
identify patients with hypoxic and radioresistant tumors before
radiotherapy (RT) who are likely to benefit from anti-hypoxic
treatment would be valuable tools in the curative-intent RT of
advanced non-small cell lung cancer (NSCLC) (8–10).
We previously demonstrated that elevated baseline
plasma levels of the hypoxia-related proteins osteopontin (OPN),
vascular-endothelial-growth-factor (VEGF) and carbonic anhydrase IX
(CAIX) additively correlate with prognosis (11) and that particularly post-treatment OPN
plasma level changes predict survival after radical CCRT of NSCLC
(12).
Interestingly, we also found a significant
association of OPN plasma levels with gross tumor volume (i.e.
higher basal OPN plasma levels in patients with larger GTV) in a
series of 69 NSCLC M0-stage patients treated with definite CCRT. In
the literature, there is evidence that GTV has a clinically
relevant impact on overall survival (OS) after CCRT of NSCLC
(13–16).
This prospective clinical study investigated the
potential prognostic interrelation of tumor volume and its changes
with OPN plasma levels during CCRT of NSCLC and aimed to determine
whether OPN plasma levels merely are a surrogate of
radiation-induced tumor volume changes accounting for the
prognostic effect of OPN.
Patients and methods
Patients
In this prospective study, a subset of 27 patients
of the previously published patient collective (11,12) was
evaluated. Only patients with complete OPN and tumor volume data on
different time points were analyzed. Inclusion criteria were age
≥18 years, histologically confirmed, inoperable and untreated NSCLC
without distant metastases (M0-stage only), indication for
definitive RT as determined by multidisciplinary tumor board. The
study protocol was approved by the ethics committee of the Medical
Faculty of the Martin Luther University Halle-Wittenberg. Staging
was performed according to the TNM classification of malignant
tumors (7th edition). Written informed consent was obtained from
all patients prior to enrollment into the trial. The local Ethics
Committee of the University approved the study and all procedures
were in accordance with the Helsinki Declaration of 1975 (as
revised 2008).
Radiochemotherapy and volumetric
parameters
Three-dimensional conformal RT (3D-RT) was
administered normofractionated (5 fractions/week) with curative
intent (66 Gy total dose, 2 Gy single dose; Siemens Primus,
Germany). Chemotherapy consisted of cisplatin (20 mg/m2
body surface on day 1–5) and vinorelbine (25 mg/m2 body
surface on day 1) in treatment week one and five (2 courses) if
general performance status and comorbidities allowed it (i.e. no
renal and hepatic function impairment, normal blood cell count). RT
was computed tomography (CT) based (Siemens Lightspeed RT, Germany)
and all patients received a positron emission tomography (PET)-scan
(Philips Accel, USA) before RT. CT and PET images were merged and
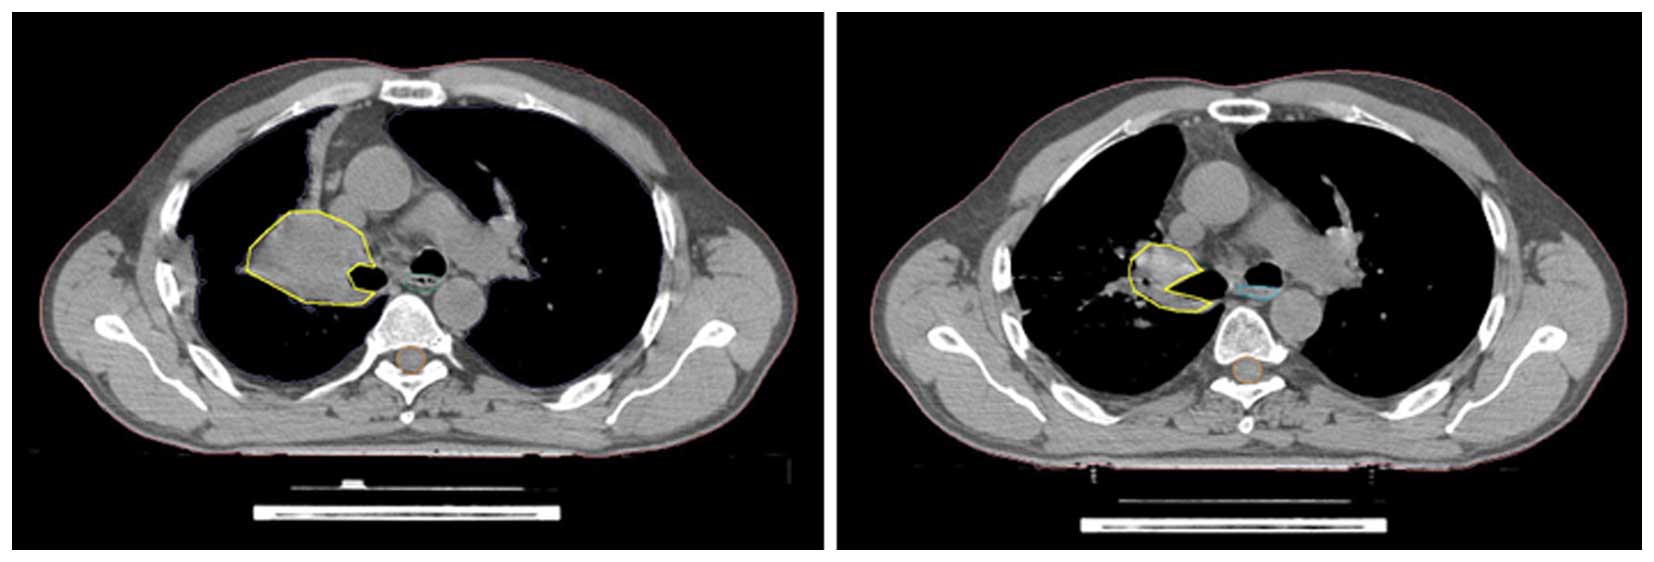
GTV was defined as the primary tumor and involved nodes (pathologic
confirmed, highly suspicious by CT and PET). GTV was delineated by
an experienced radiation oncologist at planning CT before RT (GTV1)
and all image data was registered in the Oncentra Masterplan
external beam planning software (Nucletron, USA) used for RT plan
calculation. After 40 Gy, a new planning CT was performed and GTV
was re-contoured (GTV2 i.e. before the initiation of boost RT) and
adjusted for atelectasis, pneumonia and pleural effusion (Fig. 1).
OPN plasma samples and follow-up
Plasma samples were collected from patients at the
time of routine blood sampling prior to (t0), at the end (t1), and
at four weeks after radiotherapy (t2). They were centrifuged and
stored at −80°C until assayed. OPN plasma concentration was
determined by enzyme-linked-immunosorbent-assay (ELISA, Human
Osteopontin Assay, IBL Ltd., Japan). Clinico-pathological and
demographic information was taken from the patients' charts and
follow-up of patients was carried out regularly at the Department
of Radiation Oncology, University Hospital Halle, Germany. Survival
status was continuously monitored in cooperation with local citizen
registration offices.
Statistical analysis
All statistical analyses were performed using the
PASW statistical software (ver. 18, SPSS, Inc., Chicago, IL, USA)
and statistical significance was accepted with two-sided P<0.05,
and a statistical trend was defined as P<0.1. Only patients with
a minimal follow-up time of two years were evaluated.
Nonparametric tests (Mann-Whitney U, Kruskal-Wallis
H) evaluated the relationship of pre-RT GTV and OPN (t0) plasma
levels with clinicopathological characteristics and Wilcoxon's test
compared pre-treatment with post-treatment OPN plasma levels and
GTV. OPN plasma levels are reported with median ng/ml (range) and
median GTV as ml (range). GTV changes were defined as absolute ml
and % (GTV2-GTV1/GTV1). Absolute OPN and GTV values detected at
different time points were analyzed as categorical variables with
the median used as the cut-off value (i.e. ≥median vs. <median).
Relative OPN and GTV changes were incorporated into analyses as
categorical variables with the median change (%) used as a cut-off
value (i.e. ≥median vs. <median) and with increasing vs.
decreasing OPN and GTV, respectively. Pearson's test was applied to
determine correlation between OPN plasma levels and GTV detected at
different time points. Survival curves were generated using
Kaplan-Meier analysis set to the primary endpoint overall survival
(OS, from start of RT until death or last seen in follow-up) with
the log-rank test to test for differences. Uni- and multivariate
analyses were performed to identify prognostic factors for OS using
the Cox proportional hazard model to calculate relative risk,
hazard ratio and its 95% confidence interval (CI) (17). Multivariate analyses incorporated
variables shown to be significant or a statistical trend in
univariate analysis in addition to known prognostic factors.
Results
Patient characteristics and their
association with baseline OPN and GTV
Of the 27 patients, 20 patients (74%) received CCRT
while 7 patients (26%) were treated with RT only. Median single
dose was 2 Gy and total dose was 66 Gy (50–72 Gy). 41% of patients
were diagnosed in UICC stage II and 59% were in stage III. Table I provides patients' demographics,
tumor and clinical characteristics. No associations between pre-RT
GTV and clinical parameters were identified, however, pre-RT OPN
(t0) was higher in patients with poorer lung function (i.e. lower
FeV1) and in patients who reported significant weight loss. Pre-RT
OPN was 914.6 (702.9–2441) ng/ml in patients with low FeV1 compared
to 626.5 (361–100.5) ng/ml in patients high FeV1 (P=0.002).
Patients with weight loss had a median pre-RT OPN (t0) of 999.4
(702.9 to 1712.9) ng/ml while it was 754.2 (357.4–2441) ng/ml in
those without significant weight loss (P=0.01).
 | Table I.Demographic and clinical
characteristics of NSCLC patients (n=27). |
Table I.
Demographic and clinical
characteristics of NSCLC patients (n=27).
| Clinical
characteristics | No. patients (%) |
|---|
| Treatment |
|
|
Radiotherapy | 7 (26) |
|
Radiochemotherapy | 20 (74) |
| Gender |
|
| Male | 23 (85) |
|
Female | 4 (15) |
| Age |
|
| Median
(range) | 64 (47–86) |
| Histology |
|
|
Adeno | 11 (40) |
|
SCC1 | 15 (56) |
|
Large-cell | 1 (4) |
| Weight
lossa |
|
|
Yes | 7 (26) |
| No | 20 (74) |
| Anemia |
|
|
Yes | 13 (81) |
| No | 3 (19) |
| Hemoglobin,
g/dl |
|
| Median
(range) | 12.7
(8.4–14.7) |
| FEV1b |
|
| Median
(range) | 67.6
(36.4–106.1) |
| Tumor grade |
|
| Well
(G1) | 2 (7) |
|
Moderate (G2) | 5 (19) |
| Poor
(G3) | 14 (52) |
|
Undifferentiated (G4) | 1 (3) |
|
Unknown | 5 (19) |
| T-stage |
|
| T1 | 1 (4) |
| T2 | 9 (33) |
| T3 | 5 (19) |
| T4 | 12 (44) |
| N-stage |
|
| N0 | 2 (7) |
| N1 | 0 (0) |
| N2 | 15 (56) |
| N3 | 10 (37) |
| UICC-stage |
|
|
IIA | 1 (4) |
|
IIB | 10 (37) |
|
IIIA | 16 (59) |
Course of OPN and GTV and their
correlation
Median pre-RT GTV1 was 90.4 ml (3.3–270.9 ml) and
after 40 Gy, median GTV2 was 63 ml which was significantly lower
than GTV1 before RT (P<0.0001). A positive correlation was noted
between GTV1 (before RT) and GTV2 (at 40 Gy), r=.7 (P<0.0001).
The absolute GTV reduction was 38.9 (−265-61.9) ml during RT (GTV1
to GTV2) and highly significant (P<0.0001). The relative
reduction of GTV during RT was −42% (−103- 99%) (P<0.0001).
Median OPN before (t0), at the end of (t1) and four
weeks after RT (t2) was 846 (361–2441), 777.4 (323–1397.7) and
623.5 (71.6–2248) ng/ml. Significant correlations could be
determined between OPN t1 and t2 (r=0.6; P=0.005) and between
relative OPN plasma level changes during RT (t0 to t1) and after RT
(t1 to t2, r=0.8; P<0.0001). Median OPN plasma levels before
(t0) and at the end of RT (t1) were not significantly different
(P=0.46) but OPN plasma levels 4 weeks after RT (t2) were
significantly lower than plasma levels at the end of RT (t1,
P=0.005). During RT (t0 to t1), absolute median OPN decline was
56.1 (−1732.7–616.8) ng/ml and after RT it was 54.1 (−761–1155.3)
ng/ml. The relative OPN plasma level reduction during RT (t0 to t1)
was −7.9% (−71–147.6%) and after RT (t1 to t2) it was −20.5%
(−92.9- 225.2%). However, these relative changes remained
insignificant (P=0.37 and 0.74).
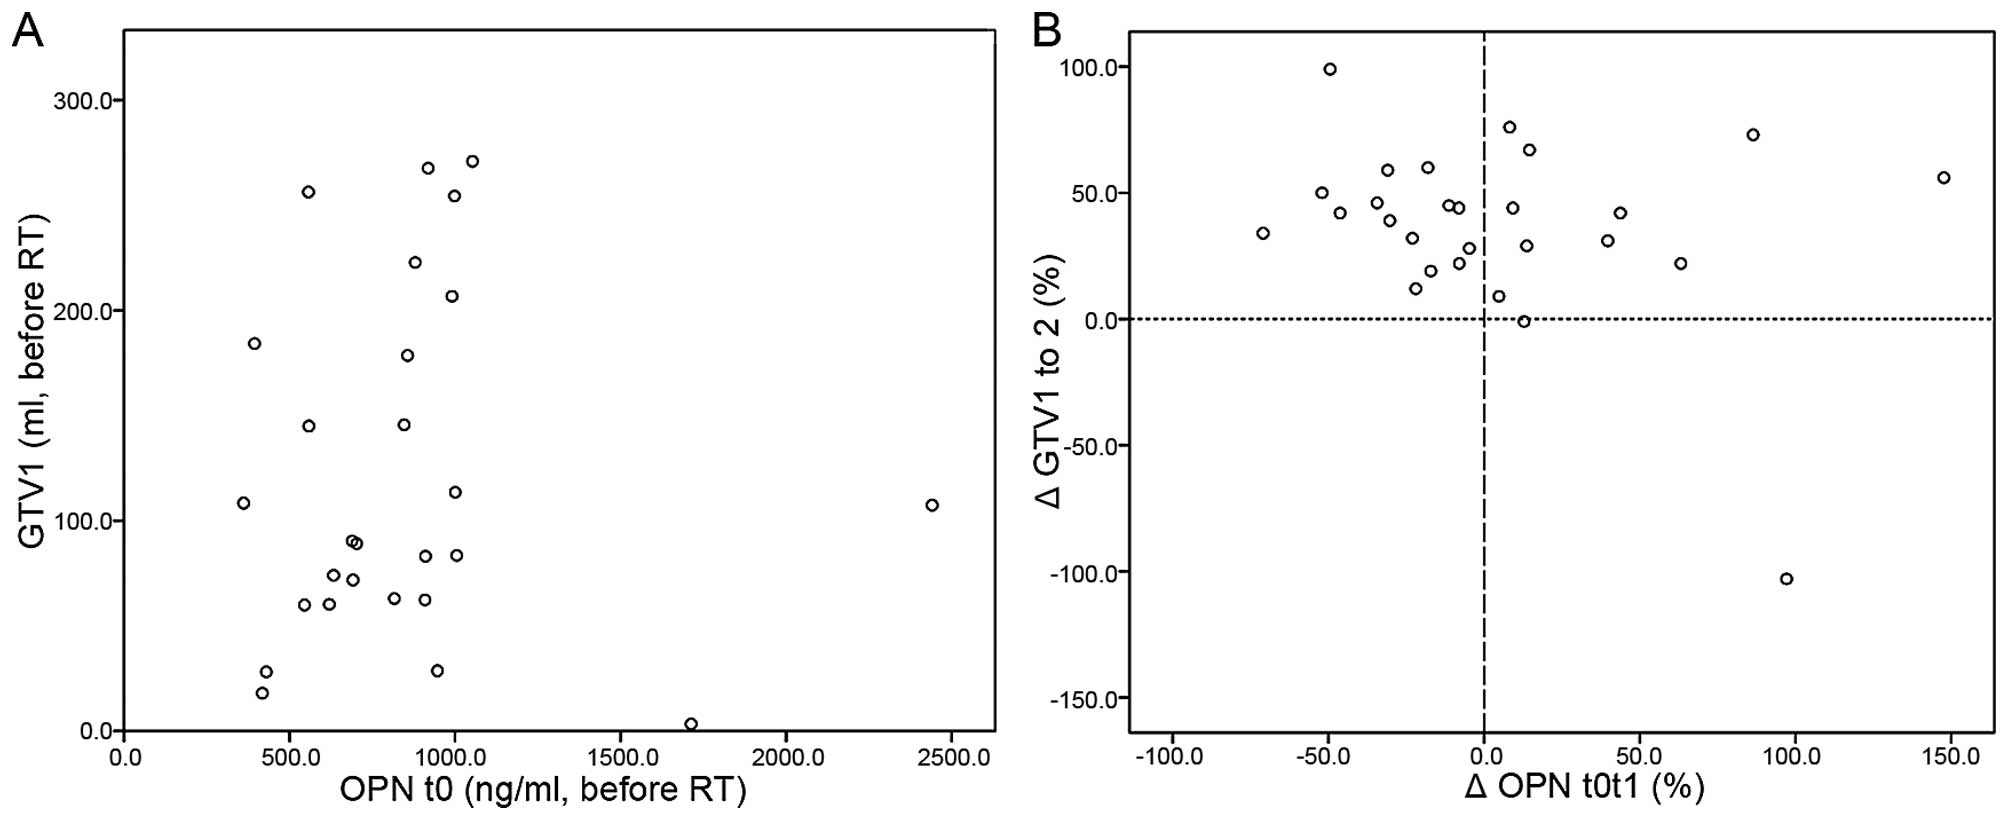
No correlation was observed neither between absolute
pre-RT OPN and GTV1 values (Fig. 2A;
P=.97) nor between absolute OPN plasma levels at the end of RT (OPN
t1) and GTV2 (P=0.9). Relative OPN plasma level changes during RT
(t0 to t1) also did not correlate with GTV changes during RT (GTV1
to GTV2), P=0.14. In addition, cross table analysis revealed no
significant interrelation between OPN and GTV changes during
radiotherapy (P=0.1) (Fig. 2B;
Table II).
| Table II.Cross table of the course (increase
vs. decrease) of OPN and gross tumor volume (GTV) during
radiotherapy. |
Table II.
Cross table of the course (increase
vs. decrease) of OPN and gross tumor volume (GTV) during
radiotherapy.
|
| OPN t0 to t1 |
|
|---|
|
|
|
|
|---|
|
| Decrease | Increase | Total |
|---|
| GTV1 to GTV2 |
|
|
|
|
Decrease | 15 | 10 | 25 |
|
Increase | 0 | 2 | 2 |
| Total | 15 | 12 | 27 |
Prognostic interrelation of OPN and
GTV
Median follow-up in surviving patients was 65
(28–66) months. By the time of last survival data update, 24
patients (89%) already had died. Median OS was 19.8 (2–66) months
and 3-year survival rate was 17%.
On univariate analysis, higher grade (P=0.009),
T-stage (P=0.005), N-stage (P=0.03) and UICC-stage (P=0.02) were
associated with inferior OS. GTV2 significantly predicted OS
(P=0.03) which was 12.2 (9.8–14.6) months in patients with high
GTV2 compared to 29.6 (18.3–40.9) months in patients with low GTV2.
Pre-RT GTV1 trended to be related to OS (P=.08) with an elevated
risk to die for patients with high baseline GTV1 (rr=2.1 [0.9–5.1],
P=0.08).
Absolute OPN plasma levels at either time point (t0,
t1, t2; P=0.25, 0.63, 0.77), relative OPN plasma level changes
during (t0 to t1, P=0.78) and after RT (t1 to t2, P=0.68) and GTV
changes during RT (P=0.49) were not related to OS in univariate
analysis.
For multivariate analysis, OPN and GTV were
evaluated together with known prognostic factors and parameters
which were significantly associated with OS in univariate
analysis.
Initially, we evaluated baseline GTV1 and OPN (t0).
After a stepwise backward multivariate analysis, OPN t0 (P=0.001)
and GTV1 (P=0.02) were independent predictors of OS besides age
(rr=1.3 [1.1–8.1], P=0.008), gender (rr=4.4 [1.9–35.2], P=0.001),
weight loss (rr=1.8 [1.3–17.5], P=0.001), grade (rr=1.3 [1.8–8.2],
P=0.001), T-stage (rr=2.2 [1.9–10.1], P<0.001) and N-stage (rr=3
[1.7–14.6], P=0.02). We then analyzed OPN at the end of RT (t1) and
GTV2 (after 50 Gy) in the same initial prognostic model and found
both OPN t1 (P<0.001) and GTV2 (P=0.001) to be significant
predictors of OS.
When relative OPN and GTV changes were evaluated in
multivariate analysis, OPN plasma level changes after (t1 to t2)
and GTV changes during RT (GTV 1 to GTV 2) remained independent
predictors for OS with a significantly elevated risk of death for
people OPN plasma level increases after (OPN t1t2: rr=4.2
[0.24–71.5], P=0.02) or GTV increases during RT (GTV 1 to 2: rr=6.7
[1.7–22.9], P=0.02) besides grade (rr=1.4 [0.5–8.3], P=0.01),
histology (rr=1.2 [1.1–6.7], P=0.01) and N-stage (rr=3 [0.6–14.6],
P=0.06). Median OS was 8.7 (0–42.8) months in patients with
increasing OPN plasma levels after RT compared to 31.4 (1.3–45.6)
months in patients with decreasing post-treatment OPN (t1 to t2).
In patients whose GTV declined during RT (from the start of RT
until completion of 50 Gy), median OS was 21.8 (4.2–35.5) while it
was 2.3 (0–31.3) months in patients with increasing GTV.
When absolute GTV values before RT (GTV1 >/<
median) were evaluated together with GTV changes during RT
(>/< median % change from GTV1 to GTV2), the best OS (33.9
[20.1–47.7] months, P=0.02) could be observed in the subgroup with
small pre-RT GTV1 (<median) and large GTV decrease (from GTV1 to
GTV2) while the poorest survival was noted in patients with high
initial GTV1 before RT and a GTV reduction during RT (GTV1 to GTV2)
below the median (6.9 [2.1–11.7] months) (Fig. 3A). The combination of absolute pre-RT
GTV1 and GTV change during RT remained a significant predictor of
OS in multivariate analysis (P=0.03) besides N-stage (P=0.02) and
grade (P=0.04).
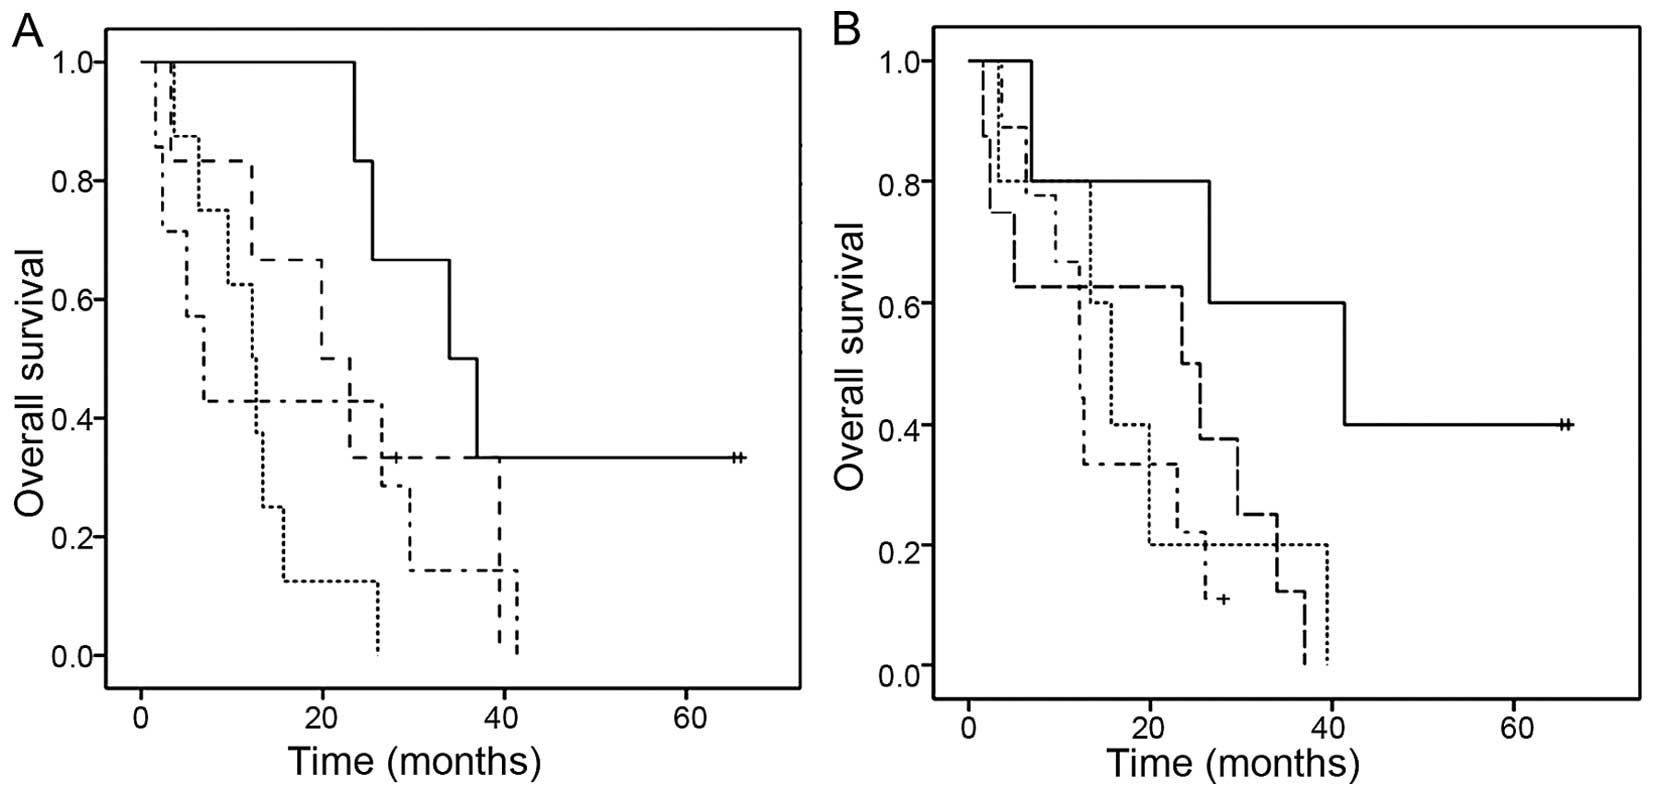 | Figure 3.Prognostic significance of the
combination of absolute GTV values before radiotherapy (GTV1) and
relative GTV changes during radiotherapy (GTV1 to GTV2) and of the
combination of baseline OPN (t0) and GTV1 before radiotherapy. (A)
Kaplan-Meier plot of overall survival according to the combination
of absolute GTV before radiotherapy (GTV1 >/<median) and GTV
change during radiotherapy (GTV1 to GTV2 >/<median).
Continuous line (GTV1 <median, GTV reduction during radiotherapy
>median; n=6), long dashed line (GTV1 <median, GTV decrease
during radiotherapy <median; n=6), dotted line (GTV1 >median,
GTV reduction during radiotherapy >median; n=8), dotted-dashed
line (GTV 1>median, GTV reduction during radiotherapy
<median; n=7). (B) Kaplan-Meier plot of overall survival
according to the combination of absolute GTV before radiotherapy
(GTV1 >/< median) and OPN before radiotherapy (OPN t0
>/< median). Continuous line (GTV1 and OPN t0 <median;
n=5), long dashed line (GTV1 > median, OPN t0 < median; n=8),
dotted line (GTV1 <median, OPN t0 >median; n=5),
dotted-dashed line (GTV1 and OPN t0 >median; n=9). |
By combining baseline OPN (t0) plasma levels and GTV
(1) before RT, a trend for superior
OS (41.3 [9.3–73.3] months, P=0.08) was noted in the group with
both low GTV1 and low OPN t0 (<median) before RT while patients
with both high OPN t0 and GTV1 (>median) had the most inferior
OS (12.2 [12.1–12.3]) (Fig. 3B). In
multivariate analysis, together with other prognostic factors, the
combination of OPN t0 plasma levels and GTV1 did not reach
statistical significance.
The combination of relative changes in OPN plasma
levels (t0 to t1) and GTV during RT (GTV1 to GTV2) was also related
to prognosis. Patients with a decline in both OPN plasma levels (t0
to t1) levels and GTV during RT (GTV1 to GTV2) higher than the
median had the best OS (29.6 [23.2–35.9] months) compared to
patients with increases of both OPN (t0 to t1) and GTV (GTV1 to
GTV2) higher than the median during RT who had the worst OS (6.9
[0–15.5], P=0.07). In the multivariate analysis with other known
prognostic factors, combined OPN plasma level and GTV changes
during RT remained insignificant.
Discussion
The prognostic relevance of elevated OPN plasma
levels has been demonstrated in the chemotherapy (18,19) and
surgery of NSCLC (20), and also for
tumor volume. Furthermore, there is strong evidence in the
literature that GTV is a potential prognostic factor in conformal
RT of NSCLC (13–16,21).
We previously demonstrated that both pre-treatment
OPN and particularly OPN plasma level changes after RT are
associated with prognosis in inoperable NSCLC treated by radical
CCRT (11,12). Interestingly, we also found a strong
association of GTV with survival in the same patient collective.
Assuming a possible prognostic quality of both OPN and GTV in the
CCRT of NSCLC, it needs to be determined whether OPN plasma levels
merely reflect tumor volume changes during RT, accounting for their
prognostic effect. Thus, the present study aimed to investigate the
interrelation of these two potential prognostic factors in definite
CCRT of NSCLC.
In the current study, we identified a significant
association of GTV2 (after 40 Gy) with survival outcome. GTV1
before RT trended to be associated with OS in univariate analysis
which amends current literature showing strong evidence for a
prognostic significance of tumor volume detected before RT
(13–16,22) or
chemotherapy of NSCLC (23). Koo
et al (14) for instance
reported a trend for inferior survival outcome in patients with
poor tumor volume reduction during CCRT of NSCLC, which is
supported by our finding that GTV changes during RT were
significantly associated with OS. In contrast to these and our own
results, is the work of Ball et al (24) who did not find significant prognostic
information provided by tumor volume in the RT of NSCLC.
In our exploratory multivariate analysis, relative
OPN plasma level changes after and GTV changes during RT remained
independent predictors of OS. When absolute OPN and GTV values were
evaluated in multivariate an analysis, we found baseline OPN (t0)
and GTV1 before RT as well as OPN at the end of RT (t1) and GTV2
(after 40 Gy) to be independent predictors of OS in different
prognostic models. These results amend current literature such as
the work of Yamane et al (25)
who reported residual tumor volume after neoadjuvant chemotherapy
of NSCLC to be prognostic, contrasting the results of Koo et
al (14) who did not find a
prognostic significance of post-RT GTV in the CCRT of NSCLC.
Interestingly, when we evaluated the combination of
absolute GTV before RT and changes in GTV during RT, we found that
patients with low initial GTV (before RT) and a significant
decrease in GTV during RT had the best OS. Furthermore, the
combination of baseline OPN t0 and GTV1 (before RT) was
prognostically relevant, that is, patients with both high pre-RT
OPN plasma levels and high GTV (>median), had the worst OS. In
addition, patients with a pronounced decrease in both OPN plasma
levels (t0 to t1) and GTV during RT (GTV1 to GTV2) had superior OS.
Unlike the combination of absolute GTV before RT and GTV changes
during RT however, which remained independent predictors of OS in
multivariate analysis, the above mentioned combinations of pre-RT
OPN t0 plasma levels and GTV1 or OPN plasma level and GTV changes
during RT did not reach statistical significance. This suggests the
hypothesis, that OPN plasma levels and GTV (both their changes and
absolute values) are not interrelated in terms of prognosis, but do
possess each parameter separately, a prognostic quality.
However, the changes of OPN plasma levels during RT,
that is from before RT (t0) to the end of RT (t1), do not depict
the same time frame as GTV changes during radiotherapy, i.e. from
before RT (GTV1) to 40 Gy (when GTV2 was re-contoured) which limits
conclusions from a combined analysis of OPN plasma level and GTV
changes during radiotherapy.
With definite CCRT being the standard approach in
locally advanced, non-metastasized inoperable NSCLC, a GTV decline
during RT could indicate a prognostically relevant early response
to treatment (14,26), while OPN plasma level increases after
RT might be related to early tumor or metastasis regrowth (12).
The results of the present study were more robust
when known clinical prognostic factors (27) were included in multivariate analysis
together with OPN and GTV which is suggestive of heterogeneities of
clinical prognostic factors and variable GTVs which may have masked
to some extent survival differences in univariate analysis which
also was restricted by the small overall patient number.
Bradley et al (13) noted a survival decrease with
increasing GTV based on a size-dependent GTV classification. Due to
the small patient number in our study, further classification of
GTV into subgroups according to size would not have been
reasonable. Thus, GTV changes in our study were split by the median
as a cut-off value in our study which of course is a hypothetical
cut-off value. Future studies could incorporate receiver operating
characteristic (ROC) curves and statistical methods such as Contal
and O'Quigleys (28) to test
hypothetical cut-off value candidates and identify the most
reliable cut-off value (14).
The present study did not specifically distinguish
between tumor and nodal volume, since nodal volume in our patients
was difficult to separate from tumor volume due to conglomerate
with the primary. However, the prognostic role of a segregation of
lymph nodes from primary tumors remains controversial (14,15,21).
To the best of our knowledge, this is the first
study to evaluate the correlation of OPN with GTV in CCRT of NSCLC.
We found pre-RT OPN plasma levels not to be associated with pre-RT
GTV. Despite the positive correlation of OPN plasma levels detected
at different time points (t0, t1, t2), no correlation between
absolute OPN plasma levels and GTV values detected at different
time points was found. A correlation between relative OPN plasma
level changes and GTV changes could also not be determined which
suggests that tumor volume (and its changes) does not affect OPN
plasma levels.
We noted a significant reduction of GTV during RT
and also OPN plasma levels declined both during and after RT.
Together with the lack of a significant correlation between OPN and
GTV, these results could indicate that these two parameters are
independently affected by RT.
Initial GTV contouring in this study was PET-CT
based and tumor volume therefore reflecting a viable tumor
component. Considering the potential relation of OPN with tumor
hypoxia in lung cancer (11,12,29,30), the
decrease in both OPN plasma levels and GTV which was noted during
RT in this study could indicate a differential influence of
radiation on OPN and GTV. A radiation-induced decrease in
specifically hypoxic tumor volume might translate into a decline in
OPN secretion and ultimately result in reduced overall OPN plasma
levels. Assuming that only vital tumor cells are capable of
producing and secreting OPN and given that necrotic or largely
hypoxic tumor areas have a considerably decreased glucose uptake,
decreasing GTV might merely reflect shrinkage of active metabolic
tumor volume (MTV). As such, GTV and its changes might be related
to tumor kinetics rather than to tumor oxygenation (31,32). Also,
post-RT PET contains not only viable tumor volume but also
radiation induced tissue injury which has not been shown to
influence OPN plasma levels.
A major restriction of our study however is, that
unlike for initial GTV contouring which was CT-based but included
diagnostic FDG-PET information, for GTV re-contouring after 40 Gy,
we used CT alone. Despite adjusting for confounding hyperdensities
such as atelectasis, pneumonia and pleural effusion by an
experienced radiation oncologist, differentiation between
treatment-induced changes and persistent or recurrent tumor
remained difficult (33). In
addition, FDG-PET was not part of routine surveillance and tumor
response evaluation after RT in our patient collective.
Consequently, assessment of tumor volume by PET-CT imaging at the
time points of OPN readings and during follow-up could enhance the
value of univariate and multivariate analyses by increasing
congruency of OPN and tumor volume detection. Additionally,
functional PET imaging such as hypoxia-specific FMISO-PET is a
reasonable complement for future studies (34) in order to delineate the differential
effects of radiation on hypoxic and metabolic tumor volume.
It appears that OPN velocity also provides
additional clinical information (35)
so that in future studies, OPN plasma levels could be further
classified by their velocity (31,35).
A clear limitation of this study which was a
hypothesis-generating one is its small size, reflecting stringent
patient selection criteria which included a minimum follow-up of
two years. Of note however is, the prospective nature of the study
and the homogeneity of the patient cohort where only NSCLC patients
in M0-stage with absence of distant metastasis (and available OPN
plasma samples at all three time points and PET-CT based contoured
GTV) were included. This is representative of a patient population
considered most appropriate for curative-intent treatment where
prognostic and predictive factors are valuable tools. Nevertheless,
the small patient number in subgroups of univariate and
multivariate analyses underlines their exploratory character and
needs to be taken into consideration in the interpretation of the
preliminary results presented here.
In conclusion, the lack of a significant association
and correlation between OPN and GTV together with our finding that
OPN and GTV remained independent predictors of survival outcome in
multivariate analysis supports the hypothesis that OPN plasma
levels may not be surrogate and thus (prognostically) independent
of tumor volume and its changes during RT. This hypothesis is
further strengthened by our finding that the combination of
absolute GTV before RT and GTV changes during RT were related to
prognosis both in univariate and multivariate analysis but
combinations of OPN plasma levels and GTV (both absolute values and
their changes) did not reach statistical significance.
Consequently, tumor volume (GTV) and OPN plasma
levels (both their changes and absolute values) are not
interrelated in terms of prognosis but do possess-each parameter
separately-a prognostic quality in the radical CCRT of NSCLC which
justifies further prospective studies incorporating a larger
patient number in order to determine the prognostic information OPN
plasma levels provide beyond tumor volume and know prognostic
factors such as T- and N-stage.
Acknowledgements
DV and CO conceived the study. CO and FS carried out
patient selection, recruitment and clinical data acquisition. CO
and TR performed blood sample collection. CO and MB processed blood
samples and carried out OPN measurements. FS and DV were
responsible for GTV delineation. CO performed the statistical data
analyses and drafted the manuscript. DV and MB provided scientific
advice. All authors proofread the manuscript.
References
|
1
|
Ferlay J, Soerjomataram I, Dikshit R, Eser
S, Mathers C, Rebelo M, Parkin DM, Forman D and Bray F: Cancer
incidence and mortality worldwide: Sources, methods and major
patterns in GLOBOCAN 2012. Int J Cancer. 136:E359–E386. 2015.
View Article : Google Scholar : PubMed/NCBI
|
|
2
|
Aupérin A, Le Péchoux C, Rolland E, Curran
WJ, Furuse K, Fournel P, Belderbos J, Clamon G, Ulutin HC, Paulus
R, et al: Meta-analysis of concomitant versus sequential
radiochemotherapy in locally advanced non-small-cell lung cancer. J
Clin Oncol. 28:2181–2190. 2010. View Article : Google Scholar : PubMed/NCBI
|
|
3
|
Vaupel P and Mayer A: Hypoxia in cancer:
Significance and impact on clinical outcome. Cancer Metastasis Rev.
26:225–239. 2007. View Article : Google Scholar : PubMed/NCBI
|
|
4
|
Nordsmark M, Bentzen SM, Rudat V, Brizel
D, Lartigau E, Stadler P, Becker A, Adam M, Molls M, Dunst J, et
al: Prognostic value of tumor oxygenation in 397 head and neck
tumors after primary radiation therapy. An international
multi-center study. Radiother Oncol. 77:18–24. 2005. View Article : Google Scholar : PubMed/NCBI
|
|
5
|
Le QT: Identifying and targeting hypoxia
in head and neck cancer: A brief overview of current approaches.
Int J Radiat Oncol Biol Phys. 69(Suppl 2): S56–S58. 2007.
View Article : Google Scholar : PubMed/NCBI
|
|
6
|
Höckel M and Vaupel P: Biological
consequences of tumor hypoxia. Semin Oncol. 28(2): Suppl 8.
S36–S41. 2001. View Article : Google Scholar
|
|
7
|
Zips D, Böke S, Kroeber T, Meinzer A,
Brüchner K, Thames HD, Baumann M and Yaromina A: Prognostic value
of radiobiological hypoxia during fractionated irradiation for
local tumor control. Strahlenther Onkol. 187:306–310. 2011.
View Article : Google Scholar : PubMed/NCBI
|
|
8
|
Bache M, Kappler M, Said HM, Staab A and
Vordermark D: Detection and specific targeting of hypoxic regions
within solid tumors: Current preclinical and clinical strategies.
Curr Med Chem. 15:322–338. 2008. View Article : Google Scholar : PubMed/NCBI
|
|
9
|
Le QT and Courter D: Clinical biomarkers
for hypoxia targeting. Cancer Metastasis Rev. 27:351–362. 2008.
View Article : Google Scholar : PubMed/NCBI
|
|
10
|
Vordermark D and Brown JM: Endogenous
markers of tumor hypoxia predictors of clinical radiation
resistance? Strahlenther Onkol. 179:801–811. 2003. View Article : Google Scholar : PubMed/NCBI
|
|
11
|
Ostheimer C, Bache M, Güttler A, Kotzsch M
and Vordermark D: A pilot study on potential plasma hypoxia markers
in the radiotherapy of non-small cell lung cancer. Osteopontin,
carbonic anhydrase IX and vascular endothelial growth factor.
Strahlenther Onkol. 190:276–282. 2014. View Article : Google Scholar : PubMed/NCBI
|
|
12
|
Ostheimer C, Bache M, Güttler A, Reese T
and Vordermark D: Prognostic information of serial plasma
osteopontin measurement in radiotherapy of non-small-cell lung
cancer. BMC Cancer. 14:8582014. View Article : Google Scholar : PubMed/NCBI
|
|
13
|
Bradley JD, Leumwananonthachai N, Purdy
JA, Wasserman TH, Lockett MA, Graham MV and Perez CA: Gross tumor
volume, critical prognostic factor in patients treated with
three-dimensional conformal radiation therapy for non-small-cell
lung carcinoma. Int J Radiat Oncol Biol Phys. 52:49–57. 2002.
View Article : Google Scholar : PubMed/NCBI
|
|
14
|
Koo TR, Moon SH, Lim YJ, Kim JY, Kim Y,
Kim TH, Cho KH, Han JY, Lee YJ, Yun T, et al: The effect of tumor
volume and its change on survival in stage III non-small cell lung
cancer treated with definitive concurrent chemoradiotherapy. Radiat
Oncol. 9:2832014. View Article : Google Scholar : PubMed/NCBI
|
|
15
|
Werner-Wasik M, Swann RS, Bradley J,
Graham M, Emami B, Purdy J and Sause W: Increasing tumor volume is
predictive of poor overall and progression-free survival: Secondary
analysis of the Radiation Therapy Oncology Group 93-11 phase I–II
radiation dose-escalation study in patients with inoperable
non-small-cell lung cancer. Int J Radiat Oncol Biol Phys.
70:385–390. 2008. View Article : Google Scholar : PubMed/NCBI
|
|
16
|
Basaki K, Abe Y, Aoki M, Kondo H, Hatayama
Y and Nakaji S: Prognostic factors for survival in stage III
non-small-cell lung cancer treated with definitive radiation
therapy: Impact of tumor volume. Int J Radiat Oncol Biol Phys.
64:449–454. 2006. View Article : Google Scholar : PubMed/NCBI
|
|
17
|
Cox DR: Regression models and life tables.
J Royal Stat Soc Series B (Methodological). 34:187–220. 1972.
|
|
18
|
Isa S, Kawaguchi T, Teramukai S, Minato K,
Ohsaki Y, Shibata K, Yonei T, Hayashibara K, Fukushima M, Kawahara
M, et al: Serum osteopontin levels are highly prognostic for
survival in advanced non-small cell lung cancer: Results from JMTO
LC 0004. J Thorac Oncol. 4:1104–1110. 2009. View Article : Google Scholar : PubMed/NCBI
|
|
19
|
Mack PC, Redman MW, Chansky K, Williamson
SK, Farneth NC, Lara PN Jr, Franklin WA, Le QT, Crowley JJ, et al:
Lower osteopontin plasma levels are associated with superior
outcomes in advanced non-small-cell lung cancer patients receiving
platinum-based chemotherapy: SWOG Study S0003. J Clin Oncol.
26:4771–4776. 2008. View Article : Google Scholar : PubMed/NCBI
|
|
20
|
Blasberg JD, Pass HI, Goparaju CM, Flores
R, Lee S and Donington JS: Reduction of elevated plasma osteopontin
levels with resection of non-small-cell lung cancer. J Clin Oncol.
28:936–941. 2010. View Article : Google Scholar : PubMed/NCBI
|
|
21
|
Alexander BM, Othus M, Caglar HB and Allen
AM: Tumor volume is a prognostic factor in non-small-cell lung
cancer treated with chemoradiotherapy. Int J Radiat Oncol Biol
Phys. 79:1381–1387. 2011. View Article : Google Scholar : PubMed/NCBI
|
|
22
|
Kozak MM, Murphy JD, Schipper ML,
Donington JS, Zhou L, Whyte RI, Shrager JB, Hoang CD, Bazan J,
Maxim PG, et al: Tumor volume as a potential imaging-based
risk-stratification factor in trimodality therapy for locally
advanced non-small cell lung cancer. J Thorac Oncol. 6:920–926.
2011. View Article : Google Scholar : PubMed/NCBI
|
|
23
|
Stinchcombe TE, Morris DE, Moore DT,
Bechtel JH, Halle JS, Mears A, Deschesne K, Rosenman JG and
Socinski MA: Post-chemotherapy gross tumor volume is predictive of
survival in patients with stage III non-small cell lung cancer
treated with combined modality therapy. Lung Cancer. 52:67–74.
2006. View Article : Google Scholar : PubMed/NCBI
|
|
24
|
Ball DL, Fisher RJ, Burmeister BH, Poulsen
MG, Graham PH, Penniment MG, Vinod SK, Krawitz HE, Joseph DJ,
Wheeler GC and McClure BE: The complex relationship between lung
tumor volume and survival in patients with non-small cell lung
cancer treated by definitive radiotherapy: A prospective,
observational prognostic factor study of the Trans-Tasman radiation
oncology group (TROG 99.05). Radiother Oncol. 106:305–311. 2013.
View Article : Google Scholar : PubMed/NCBI
|
|
25
|
Yamane Y, Ishii G, Goto K, Kojima M, Nakao
M, Shimada Y, Nishiwaki Y, Nagai K, Kohrogi H and Ochiai A: A novel
histopathological evaluation method predicting the outcome of
non-small cell lung cancer treated by neoadjuvant therapy: The
prognostic importance of the area of residual tumor. J Thorac
Oncol. 5:49–55. 2010. View Article : Google Scholar : PubMed/NCBI
|
|
26
|
Soliman M, Yaromina A, Appold S, Zips D,
Reiffenstuhl C, Schreiber A, Thames HD, Krause M and Baumann M: GTV
differentially impacts locoregional control of non-small cell lung
cancer (NSCLC) after different fractionation schedules: Subgroup
analysis of the prospective randomized CHARTWEL trial. Radiother
Oncol. 106:299–304. 2013. View Article : Google Scholar : PubMed/NCBI
|
|
27
|
Wigren T: Confirmation of a prognostic
index for patients with inoperable non-small cell lung cancer.
Radiother Oncol. 44:9–15. 1997. View Article : Google Scholar : PubMed/NCBI
|
|
28
|
Contal C and O'Quigley J: An application
of changepoint methods in studying the effect of age on survival in
breast cancer. Comput Stat Data Anal. 30:253–270. 1999. View Article : Google Scholar
|
|
29
|
Le QT, Kong C, Lavori PW, O'byrne K, Erler
JT, Huang X, Chen Y, Cao H, Tibshirani R, Denko N, et al:
Expression and prognostic significance of a panel of tissue hypoxia
markers in head-and-neck squamous cell carcinomas. Int J Radiat
Oncol Biol Phys. 69:167–175. 2007. View Article : Google Scholar : PubMed/NCBI
|
|
30
|
Le QT, Chen E, Salim A, Cao H, Kong CS,
Whyte R, Donington J, Cannon W, Wakelee H, Tibshirani R, et al: An
evaluation of tumor oxygenation and gene expression in patients
with early stage non-small cell lung cancers. Clin Cancer Res.
12:1507–1514. 2006. View Article : Google Scholar : PubMed/NCBI
|
|
31
|
Chu KP, Murphy JD, La TH, Krakow TE,
Iagaru A, Graves EE, Hsu A, Maxim PG, Loo B, Chang DT and Le QT:
Prognostic value of metabolic tumor volume and velocity in
predicting head-and-neck cancer outcomes. Int J Radiat Oncol Biol
Phys. 83:1521–1527. 2012. View Article : Google Scholar : PubMed/NCBI
|
|
32
|
Lee P, Bazan JG, Lavori PW, Weerasuriya
DK, Quon A, Le QT, Wakelee HA, Graves EE and Loo BW: Metabolic
tumor volume is an independent prognostic factor in patients
treated definitively for non-small-cell lung cancer. Clin Lung
Cancer. 13:52–58. 2012. View Article : Google Scholar : PubMed/NCBI
|
|
33
|
Choi YW, Munden RF, Erasmus JJ, Park KJ,
Chung WK, Jeon SC and Park CK: Effects of radiation therapy on the
lung: Radiologic appearances and differential diagnosis.
Radiographics. 24:985–998. 2004. View Article : Google Scholar : PubMed/NCBI
|
|
34
|
Zips D, Zöphel K, Abolmaali N, Perrin R,
Abramyuk A, Haase R, Appold S, Steinbach J, Kotzerke J and Baumann
M: Exploratory prospective trial of hypoxia-specific PET-imaging
during radiochemotherapy in patients with locally advanced
head-and-neck cancer. Radiother Oncol. 105:21–28. 2012. View Article : Google Scholar : PubMed/NCBI
|
|
35
|
Joseph S, Harrington R, Walter D, Goldberg
JD, Li X, Beck A, Litton T, Hirsch N, Blasberg J, Slomiany M, et
al: Plasma osteopontin velocity differentiates lung cancers from
controls in a CT screening population. Cancer Biomark. 12:177–184.
2012.PubMed/NCBI
|