Introduction
Gastric cancer is the third leading cause of
cancer-associated mortality (1). The
most common cause of gastric cancer is infection by the bacteria
Helicobacter pylori, which accounts for ~60% of cases
(1,2).
Smoking also increases the risk significantly. The prognosis of
stomach cancer is generally poor due to the fact that the tumor has
often metastasized by the time of diagnosis (3), which makes it necessary to identify
biomarkers for an early diagnosis.
Stomach cancers are overwhelmingly adenocarcinomas.
Gastric adenocarcinomas are a heterogeneous group of tumors. The
cardia lies between the end of the esophagus and the body of the
stomach, and is a small macroscopically indistinct zone that lies
immediately distal to the gastroesophageal junction. Gastric cardia
adenocarcinoma (GCA) and esophageal squamous cell carcinoma (ESCC)
share certain etiological risk factors. Abnet et al reported
a shared susceptibility locus in PLCE1 at 10q23 for GCA and ESCC
(4). GCA may have a distinct
etiology. Substantially higher TP53 mutation rates have been
detected in cases with GCA than gastric non-cardia adenocarcinoma
(GNCA) (5). Kamangar et al
indicated that H. pylori is a strong risk factor for
non-cardia gastric cancer, but that it is inversely associated with
the risk of gastric cardia cancer (6). Kim et al found differences in the
clinicopathology and protein expression in cardia carcinoma and
non-cardia carcinoma (7).
Although a number of genetic alterations have been
identified in gastric cancer, including those in cadherin 1 (CDH1)
(8,9),
β-catenin (10), CDH17 (11) and Met (12), no study has distinguished these
alterations by anatomical subsite. A number of previous gene
expression profiling studies have also ignored the differences in
diverse anatomical subsite (11,13,14), such
as in GCA and GNCA. Therefore, a comparative analysis of the gene
expression profiles of GCA and GNCA would provide more accurate and
valuable information on GCA.
Based upon the gene expression data from Wang et
al (15), the present study
adopted functional enrichment analysis and protein-protein
interaction (PPI) network analysis to obtain a greater
understanding of the common pathogenesis of GCA and GNCA, as well
as the unique molecular mechanisms underlying GCA and GNCA, which
could facilitate the development of targeted strategies for early
detection, prognosis, and therapy.
Materials and methods
Gene expression data
A gene expression dataset (access number GSE29272)
(15) was downloaded from Gene
Expression Omnibus (http://www.ncbi.nlm.nih.gov/geo/), and consisted of 62
GCA samples and 62 normal controls, as well as 72 GNCA samples and
72 normal controls. Gene expression levels were measured using the
Affymetrix Human Genome U133A Array (Affymetrix Inc., Santa Clara,
CA, USA).
Pre-treatment and differential
analysis
Raw data were treated with the Robust Multi-array
Analysis method from the Affy package (16). Values of probes mapping to a same
Entrez gene ID were averaged as a final expression level for the
specific gene. A total of 22,283 probes and 12,495 genes were
obtained.
Differential analysis was performed with the Linear
Models for Microarray Data (17) in R
to identify DEGs in GCA and GNCA. The cut-offs were set as |log
(fold change)|>1 and a P-value of <0.01. Overlapping DEGs of
GCA and GNCA, as well as unique DEGs, were further selected
out.
Functional enrichment analysis
Gene Ontology (GO; http://www.geneontology.org/) enrichment analysis and
Kyoto Encyclopedia of Genes and Genomes (http://www.genome.jp/kegg) pathway enrichment analysis
were applied on the overlapping DEGs and unique DEGs using the
Database for Annotation, Visualization and Integration Discovery
(http://david.abcc.ncifcrf.gov/) online
tool (18). P<0.05 was set as the
threshold.
Construction of the PPI network
A PPI network was constructed for the overlapping
DEGs using information from the Search Tool for the Retrieval of
Interacting Genes (19). Interactions
with a score of >0.4 were retained and then visualized by
Cytoscape (20). The proteins in the
network serve as the ‘nodes’, and each pairwise protein interaction
is represented by an undirected link and the degree of a node
corresponds to the number of interactions of a protein. Degree was
calculated for each node. Hub genes were then selected out
according to the degree.
Subnetworks were also identified by Cytoscape
(20) and its plugin MCODE (21), on which functional enrichment analysis
was then applied.
Results
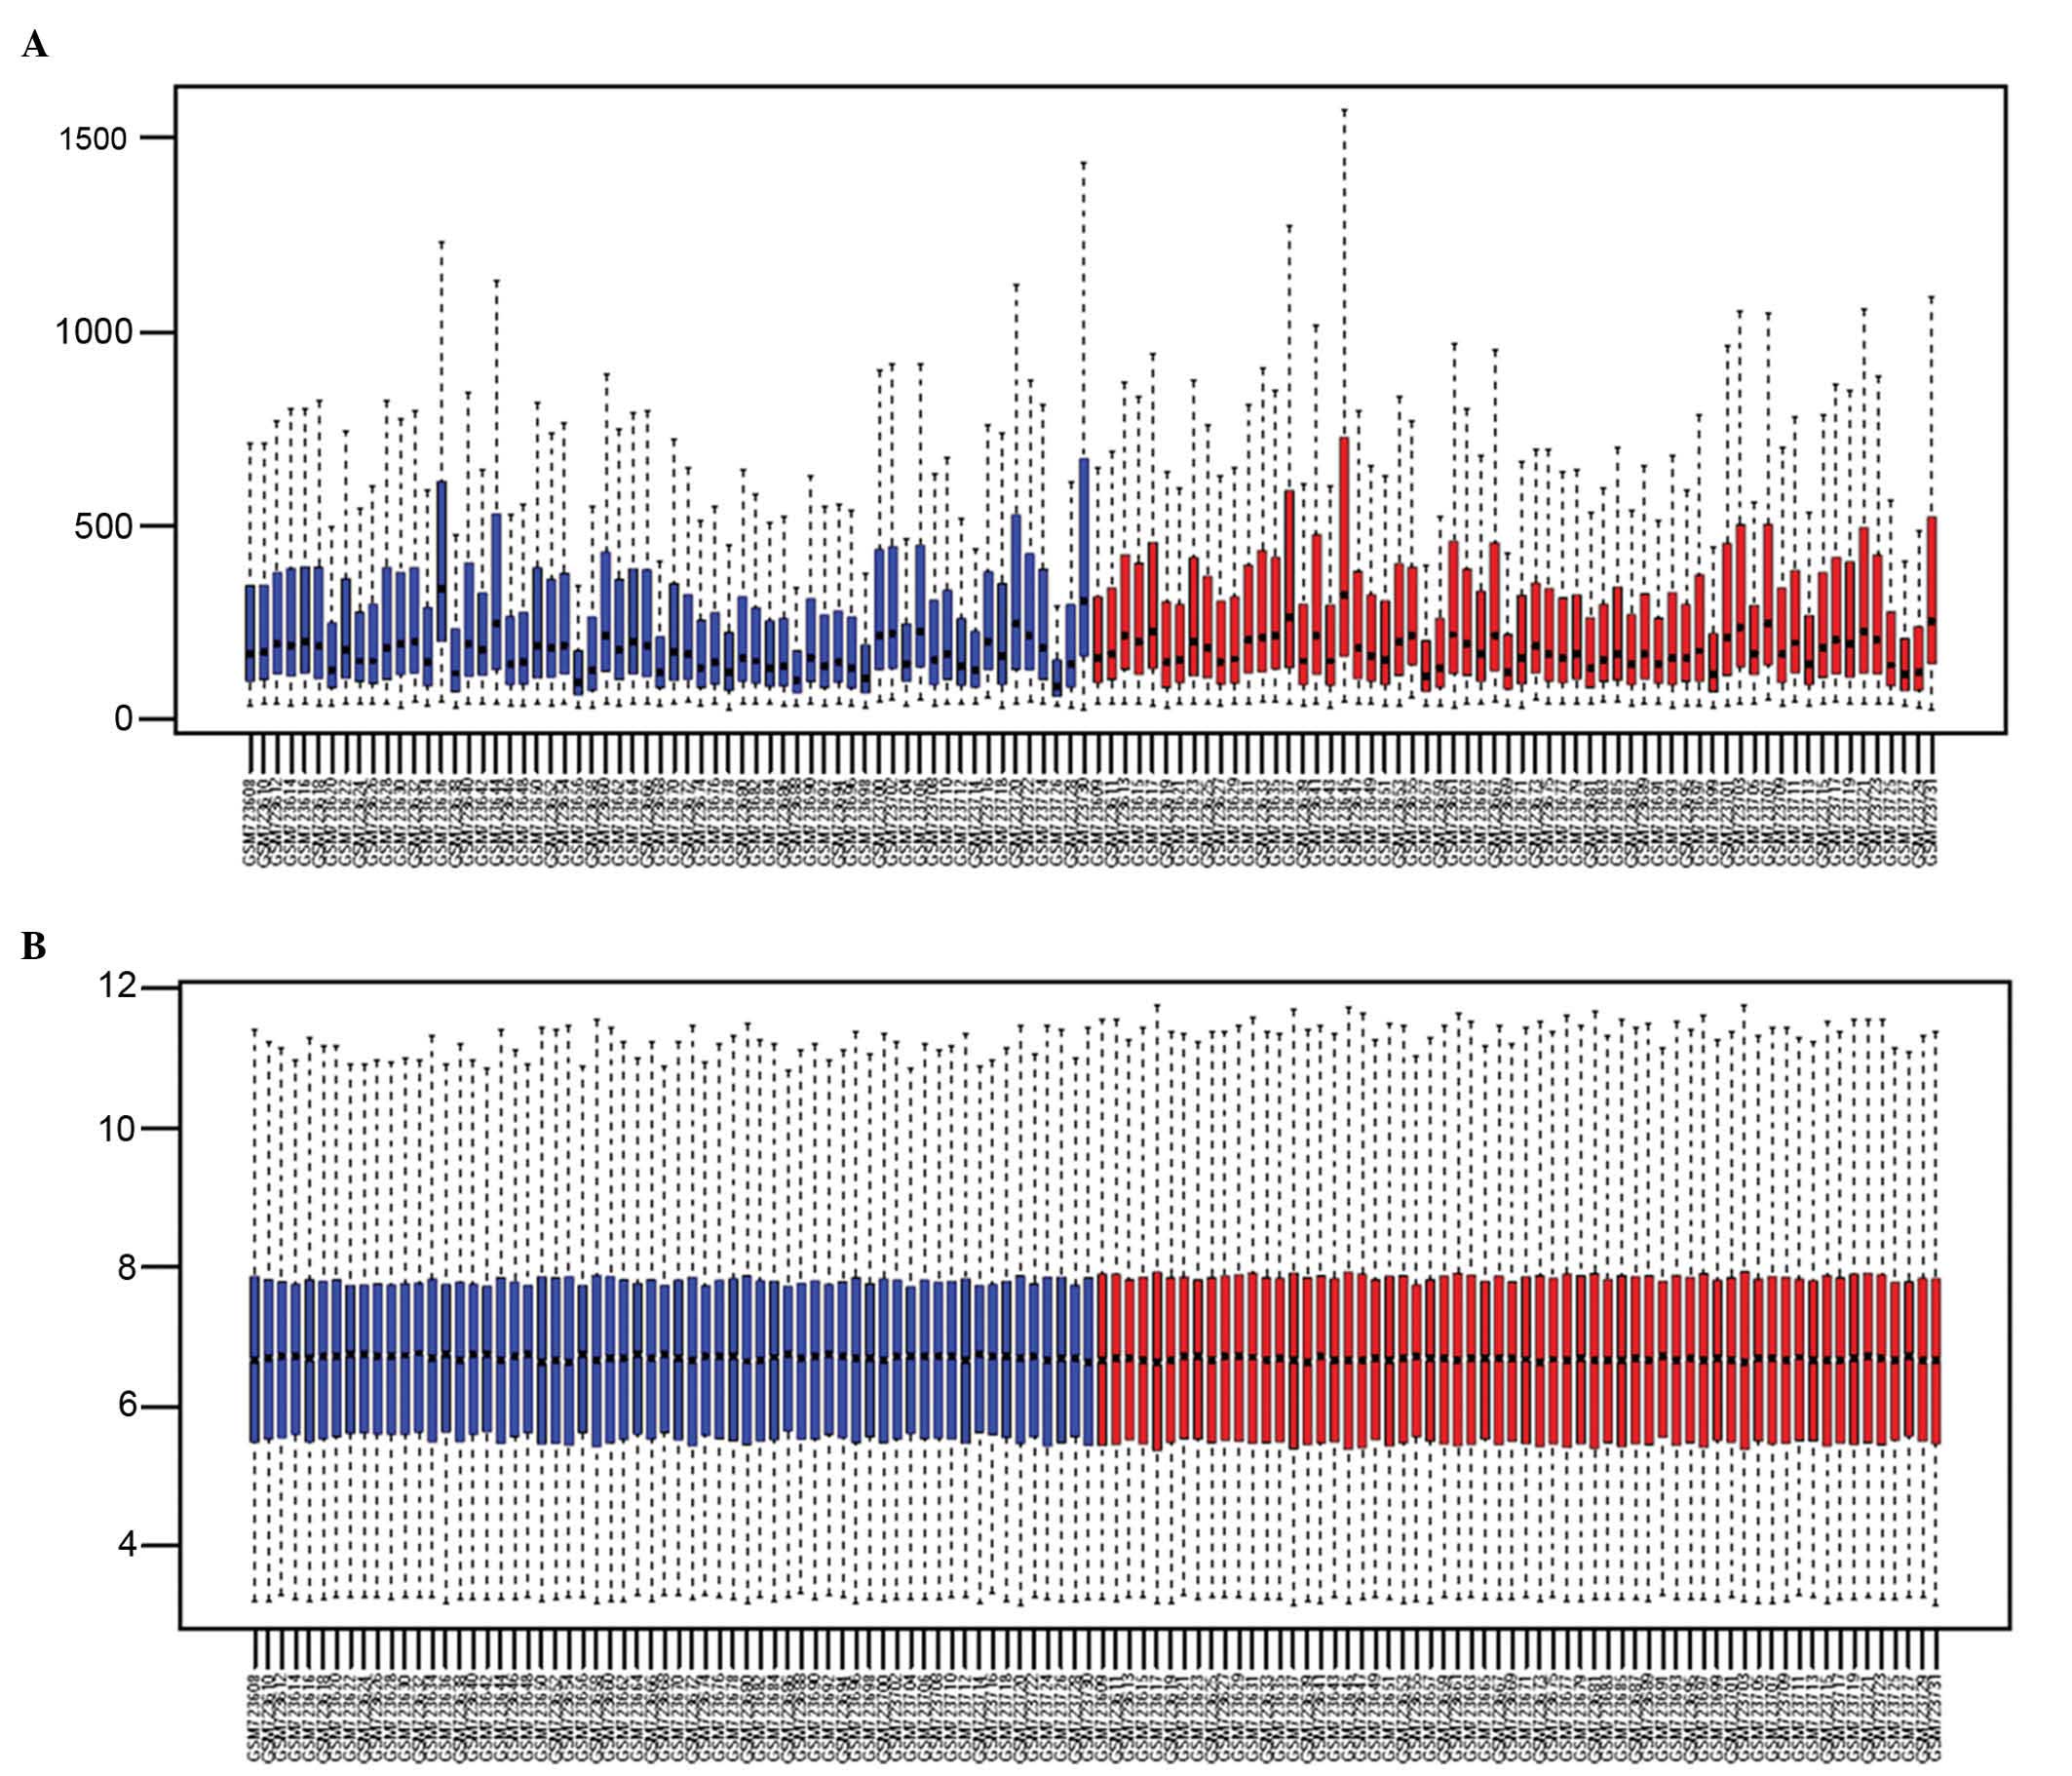
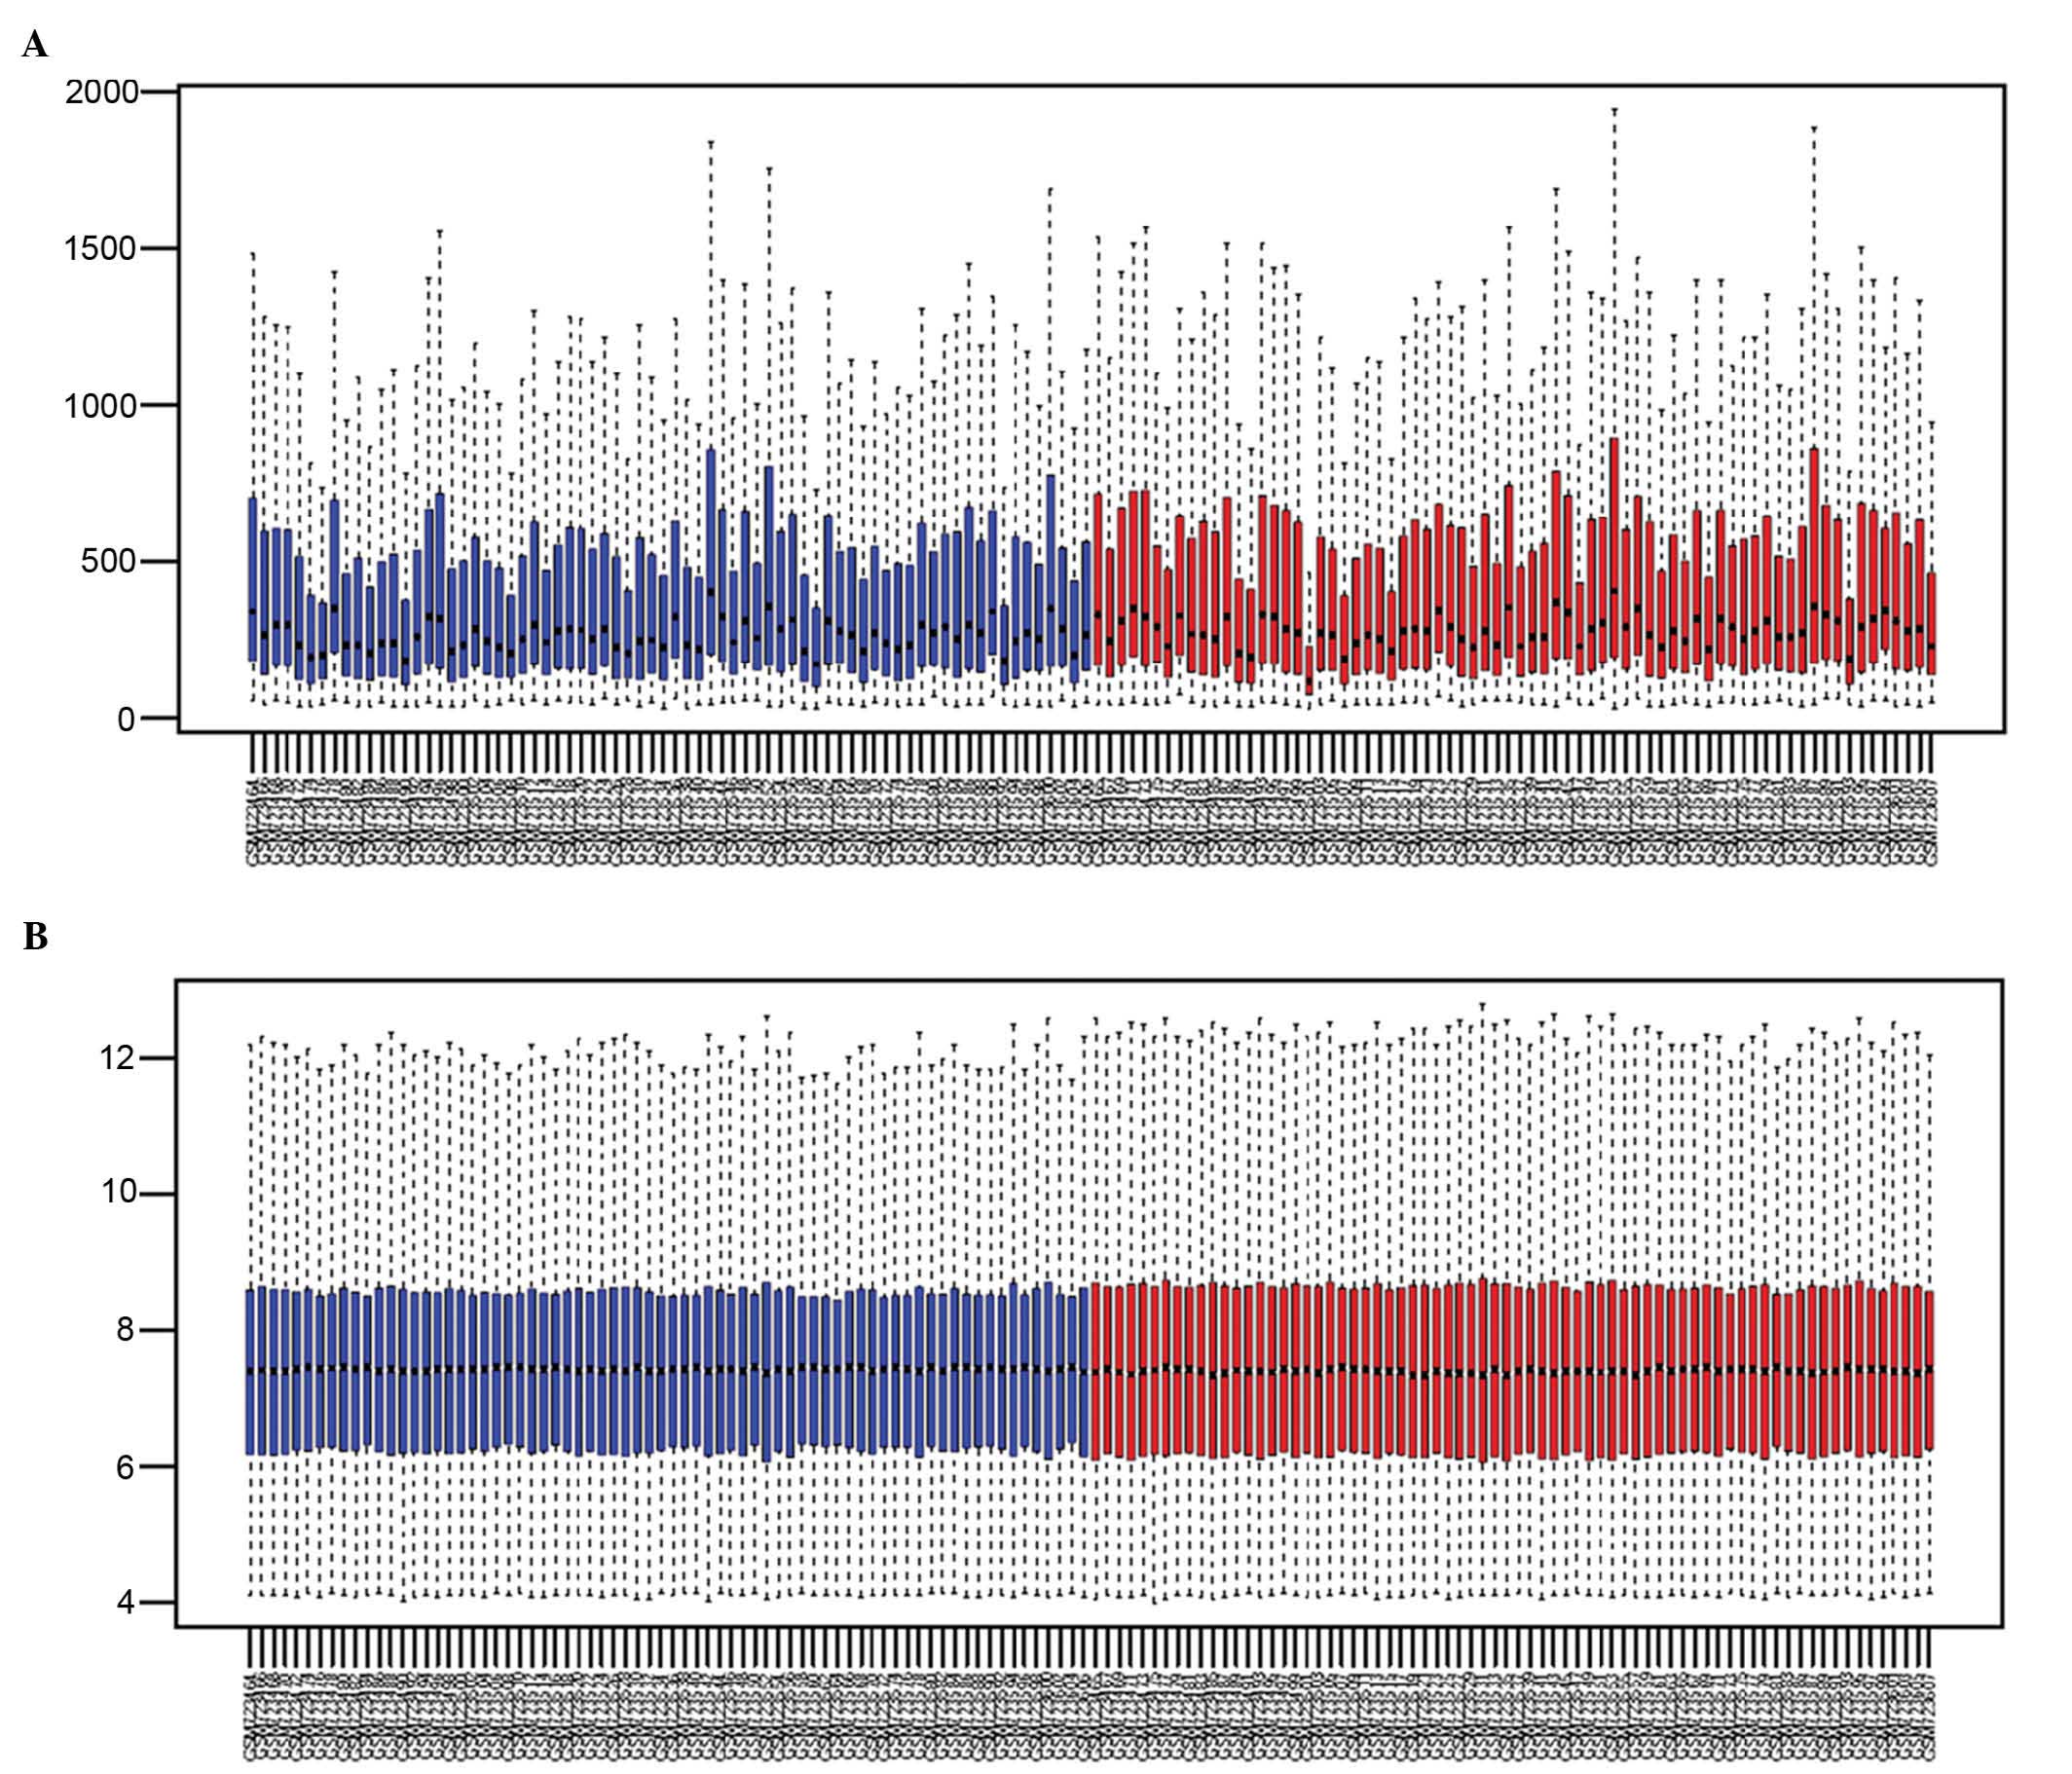
Differentially-expressed genes
(DEGs)
Gene expression data of GCA and GNCA prior to and
after normalization are shown in Figs.
1 and 2. A good performance of
normalization was achieved.
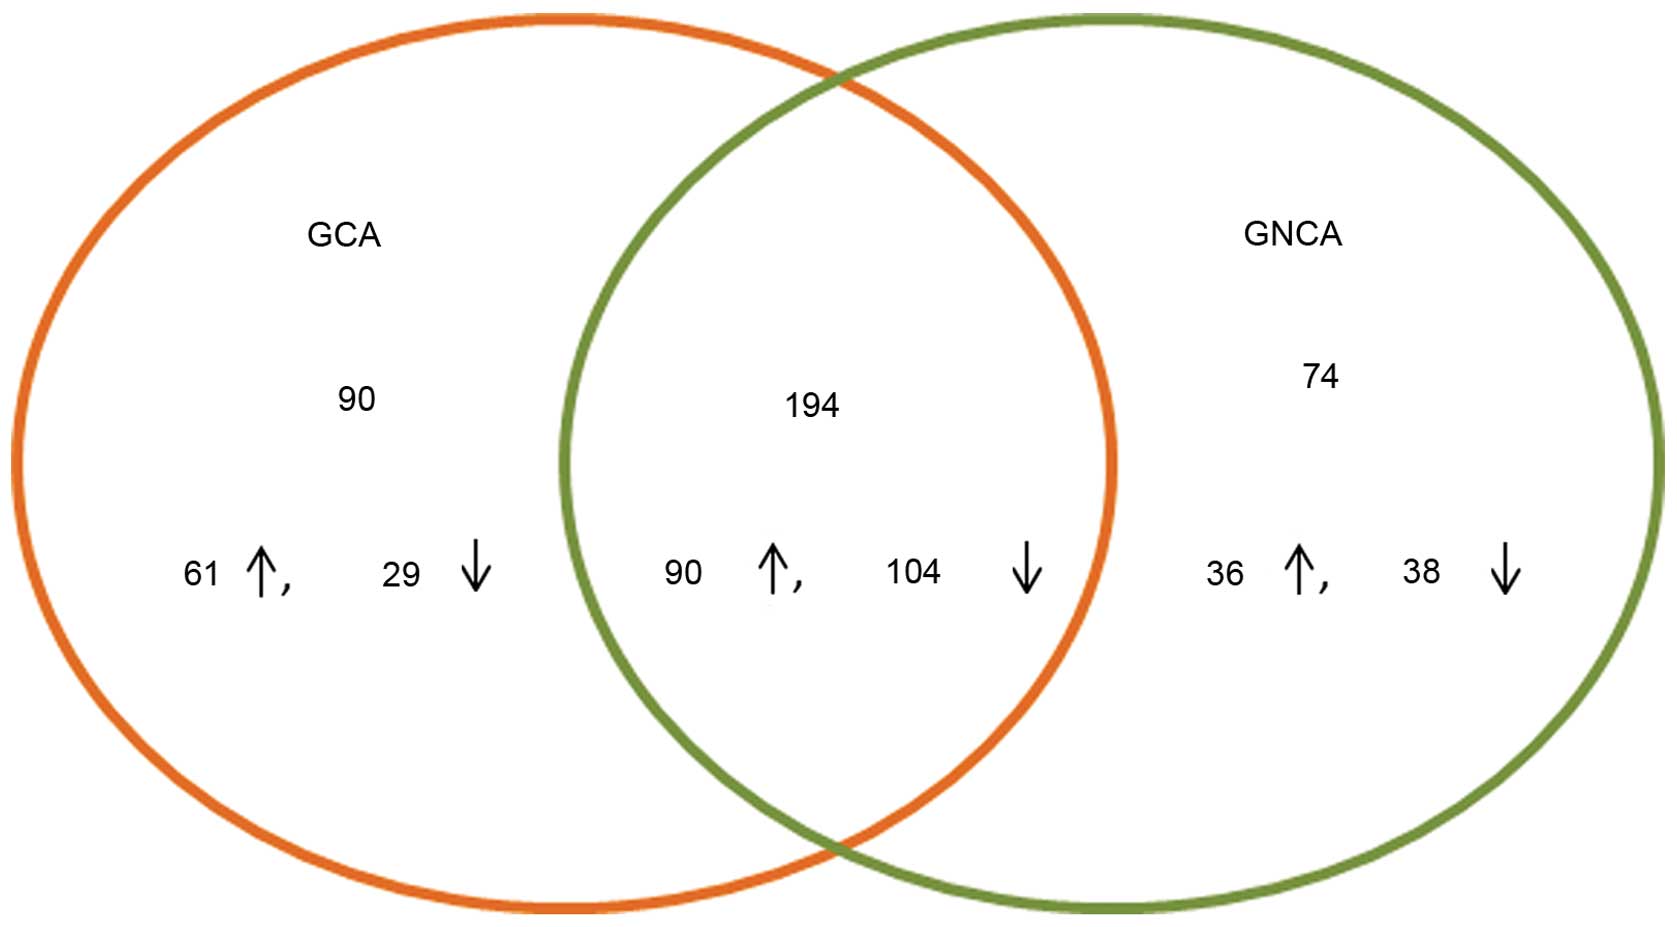
A total of 284 DEGs, 151 upregulated and 133
downregulated, were identified in GCA, while 268 DEGs, 126
upregulated and 142 downregulated, were revealed in GNCA. A total
of 194 DEGs, 90 upregulated and 104 downregulated, were common
between GCA and GNCA (Fig. 3).
Functional enrichment analysis
result
Functional enrichment analysis was performed for the
overlapping DEGs and unique DEGs. As shown in Table I, upregulated overlapping DEGs were
involved in cell adhesion, the response to wounding and the
regulation of cell proliferation. Extracellular matrix
(ECM)-receptor interaction and focal adhesion were significantly
over-represented. As for downregulated overlapping DEGs, digestion,
oxidation reduction and the homeostatic process were enriched. The
DEGs were associated with the metabolism of xenobiotics by
cytochrome P450 and nitrogen metabolism.
 | Table I.Functional enrichment analysis for
common differentially-expressed genes. |
Table I.
Functional enrichment analysis for
common differentially-expressed genes.
| Group | Category | Term | Count | P-value |
|---|
| Upregulated
genes | GOTERM_BP_FAT | GO:0007155, cell
adhesion | 25 |
3.75×10⁻¹³ |
|
| GOTERM_BP_FAT | GO:0022610,
biological adhesion | 25 |
3.86×10⁻¹³ |
|
| GOTERM_BP_FAT | GO:0001501, skeletal
system development | 12 |
1.76×10⁻⁶ |
|
| GOTERM_BP_FAT | GO:0009611,
response to wounding | 14 |
8.15×10⁻⁶ |
|
| GOTERM_BP_FAT | GO:0042127,
regulation of cell proliferation | 13 |
1.54×10⁻³ |
|
| GOTERM_CC_FAT | GO:0044421,
extracellular region part | 40 |
1.83×10⁻²³ |
|
| GOTERM_CC_FAT | GO:0005576,
extracellular region | 48 |
6.77×10⁻¹⁹ |
|
| GOTERM_CC_FAT | GO:0005578,
proteinaceous ECM | 23 |
1.45×10⁻¹⁷ |
|
| GOTERM_CC_FAT | GO:0031012,
ECM | 23 |
7.16×10⁻¹⁷ |
|
| GOTERM_CC_FAT | GO:0005615,
extracellular space | 24 |
1.16×10⁻¹¹ |
|
| GOTERM_MF_FAT | GO:0005201, ECM
structural constituent | 12 |
1.03×10⁻¹² |
|
| GOTERM_MF_FAT | GO:0005539,
glycosaminoglycan binding | 12 |
2.27×10⁻¹⁰ |
|
| GOTERM_MF_FAT | GO:0001871, pattern
binding | 12 |
6.34×10⁻¹⁰ |
|
| GOTERM_MF_FAT | GO:0005198,
structural molecule activity | 18 |
3.61×10⁻⁸ |
|
| GOTERM_MF_FAT | GO:0005509, calcium
ion binding | 14 |
1.28×10⁻³ |
|
| KEGG_PATHWAY | hsa04512:
ECM-receptor interaction | 13 |
5.02×10⁻¹³ |
|
| KEGG_PATHWAY | hsa04510: Focal
adhesion | 13 |
1.60×10⁻⁸ |
|
| KEGG_PATHWAY | hsa04670: Leukocyte
transendothelial migration | 5 |
1.21×10⁻² |
|
| KEGG_PATHWAY | hsa04514: Cell
adhesion molecules | 5 |
1.77×10⁻² |
| Downregulated
genes | GOTERM_BP_FAT | GO:0007586,
digestion | 14 |
1.39×10⁻¹⁴ |
|
| GOTERM_BP_FAT | GO:0055114,
oxidation reduction | 15 |
4.63×10⁻⁵ |
|
| GOTERM_BP_FAT | GO:0010035,
response to inorganic substance | 8 |
3.23×10⁻⁴ |
|
| GOTERM_BP_FAT | GO:0010033,
response to organic substance | 11 |
1.59×10⁻² |
|
| GOTERM_BP_FAT | GO:0042592,
homeostatic process | 11 |
2.05×10⁻² |
|
| GOTERM_CC_FAT | GO:0005576,
extracellular region | 36 |
1.54×10⁻⁸ |
|
| GOTERM_CC_FAT | GO:0005615,
extracellular space | 16 |
4.01×10⁻⁵ |
|
| GOTERM_CC_FAT | GO:0044421,
extracellular region part | 19 |
4.81×10⁻⁵ |
|
| GOTERM_CC_FAT | GO:0045177, apical
part of cell | 6 |
6.78×10⁻³ |
|
| GOTERM_CC_FAT | GO:0016324, apical
plasma membrane | 5 |
1.19×10⁻² |
|
| GOTERM_MF_FAT | GO:0008289, lipid
binding | 12 |
2.71×10⁻⁴ |
|
| GOTERM_MF_FAT | GO:0048037,
cofactor binding | 8 |
1.70×10⁻³ |
|
| GOTERM_MF_FAT | GO:0004175,
endopeptidase activity | 8 |
1.52×10⁻² |
|
| GOTERM_MF_FAT | GO:0070011,
peptidase activity, acting on L-amino acid peptides | 9 |
3.64×10⁻⁴ |
|
| GOTERM_MF_FAT | GO:0008233,
peptidase activity | 9 |
4.53×10⁻² |
|
| KEGG_PATHWAY | hsa00980:
Metabolism of xenobiotics by cytochrome P450 | 5 |
6.98×10⁻⁴ |
|
| KEGG_PATHWAY | hsa00982: Drug
metabolism | 4 |
8.56×10⁻³ |
|
| KEGG_PATHWAY | hsa00910: Nitrogen
metabolism | 3 |
1.06×10⁻² |
GCA-unique DEGs were closely associated with the
cell cycle and the regulation of cell proliferation (Table II). Pathways such as the cell cycle,
the p53 signaling pathway and the Toll-like receptor signaling
pathway were enriched (Table
II).
| Table II.Functional enrichment analysis for
unique differentially-expressed genes in gastric cardia
adenocarcinoma. |
Table II.
Functional enrichment analysis for
unique differentially-expressed genes in gastric cardia
adenocarcinoma.
| Category | Term | Count | P-value |
|---|
| GOTERM_BP_FAT | GO:0022403, cell
cycle phase | 14 |
1.66×10⁻⁷ |
| GOTERM_BP_FAT | GO:0000279, M
phase | 12 |
8.96×10⁻⁷ |
| GOTERM_BP_FAT | GO:0022402, cell
cycle process | 14 |
5.45×10⁻⁶ |
| GOTERM_BP_FAT | GO:0007049, cell
cycle | 16 |
7.81×10⁻⁶ |
| GOTERM_BP_FAT | GO:0042127,
regulation of cell proliferation | 14 |
1.72×10⁻⁴ |
| GOTERM_CC_FAT | GO:0044421,
extracellular region part | 18 |
2.12×10⁻⁵ |
| GOTERM_CC_FAT | GO:0005829,
cytosol | 18 |
1.10×10⁻³ |
| GOTERM_CC_FAT | GO:0005576,
extracellular region | 23 |
1.42×10⁻³ |
| GOTERM_CC_FAT | GO:0043228,
non-membrane-bounded organelle | 24 |
1.58×10⁻² |
| GOTERM_CC_FAT | GO:0043232,
intracellular non-membrane-bounded organelle | 24 |
1.58×10⁻² |
| GOTERM_MF_FAT | GO:0008009,
chemokine activity | 4 |
1.43×10⁻³ |
| GOTERM_MF_FAT | GO:0046983, protein
dimerization activity | 9 |
4.49×10⁻³ |
| GOTERM_MF_FAT | GO:0042802,
identical protein binding | 9 |
1.18×10⁻² |
| GOTERM_MF_FAT | GO:0042803, protein
homodimerization activity | 6 |
2.28×10⁻² |
| GOTERM_MF_FAT | GO:0008134,
transcription factor binding | 7 |
3.76×10⁻² |
| KEGG_PATHWAY | hsa04110: Cell
cycle | 11 |
8.65×10⁻⁸ |
| KEGG_PATHWAY | hsa04115: p53
signaling pathway | 6 |
2.98×10⁻⁴ |
| KEGG_PATHWAY | hsa04114: Oocyte
meiosis | 7 |
3.66×10⁻⁴ |
| KEGG_PATHWAY | hsa04914:
Progesterone-mediated oocyte maturation | 6 |
8.83×10⁻⁴ |
| KEGG_PATHWAY | hsa04620: Toll-like
receptor signaling pathway | 5 |
1.17×10⁻² |
GNCA-unique DEGs were implicated in the regulation
of angiogenesis, cell death and small GTPase-mediated signal
transduction (Table III). Pathways
such as focal adhesion and vascular smooth muscle contraction were
enriched (Table III).
| Table III.Functional enrichment analysis for
unique differentially-expressed genes in gastric non-cardia
adenocarcinoma. |
Table III.
Functional enrichment analysis for
unique differentially-expressed genes in gastric non-cardia
adenocarcinoma.
| Category | Term | Count | P-value |
|---|
| GOTERM_BP_FAT | GO:0045765,
regulation of angiogenesis | 3 |
2.99×10⁻² |
| GOTERM_BP_FAT | GO:0008219, cell
death | 8 |
3.32×10⁻² |
| GOTERM_BP_FAT | GO:0016265,
death | 8 |
3.43×10⁻² |
| GOTERM_BP_FAT | GO:0006937,
regulation of muscle contraction | 3 |
3.81×10⁻² |
| GOTERM_BP_FAT | GO:0007264, small
GTPase mediated signal transduction | 5 |
4.16×10⁻² |
| GOTERM_CC_FAT | GO:0015629, actin
cytoskeleton | 8 |
2.52×10⁻⁴ |
| GOTERM_CC_FAT | GO:0005576,
extracellular region | 21 |
5.64×10⁻⁴ |
| GOTERM_CC_FAT | GO:0005856,
cytoskeleton | 16 |
1.43×10⁻³ |
| GOTERM_CC_FAT | GO:0044421,
extracellular region part | 11 |
1.32×10⁻² |
| GOTERM_CC_FAT | GO:0044449,
contractile fiber part | 4 |
1.60×10⁻² |
| GOTERM_MF_FAT | GO:0008092,
cytoskeletal protein binding | 9 |
9.27×10⁻⁴ |
| GOTERM_MF_FAT | GO:0003779, actin
binding | 7 |
2.04×10⁻³ |
| GOTERM_MF_FAT | GO:0005198,
structural molecule activity | 9 |
3.92×10⁻³ |
| GOTERM_MF_FAT | GO:0005509, calcium
ion binding | 10 |
1.13×10⁻² |
| GOTERM_MF_FAT | GO:0005525, GTP
binding | 6 |
1.75×10⁻² |
| KEGG_PATHWAY | hsa04510: Focal
adhesion | 6 |
3.64×10⁻³ |
| KEGG_PATHWAY | hsa04270: Vascular
smooth muscle contraction | 4 |
2.07×10⁻² |
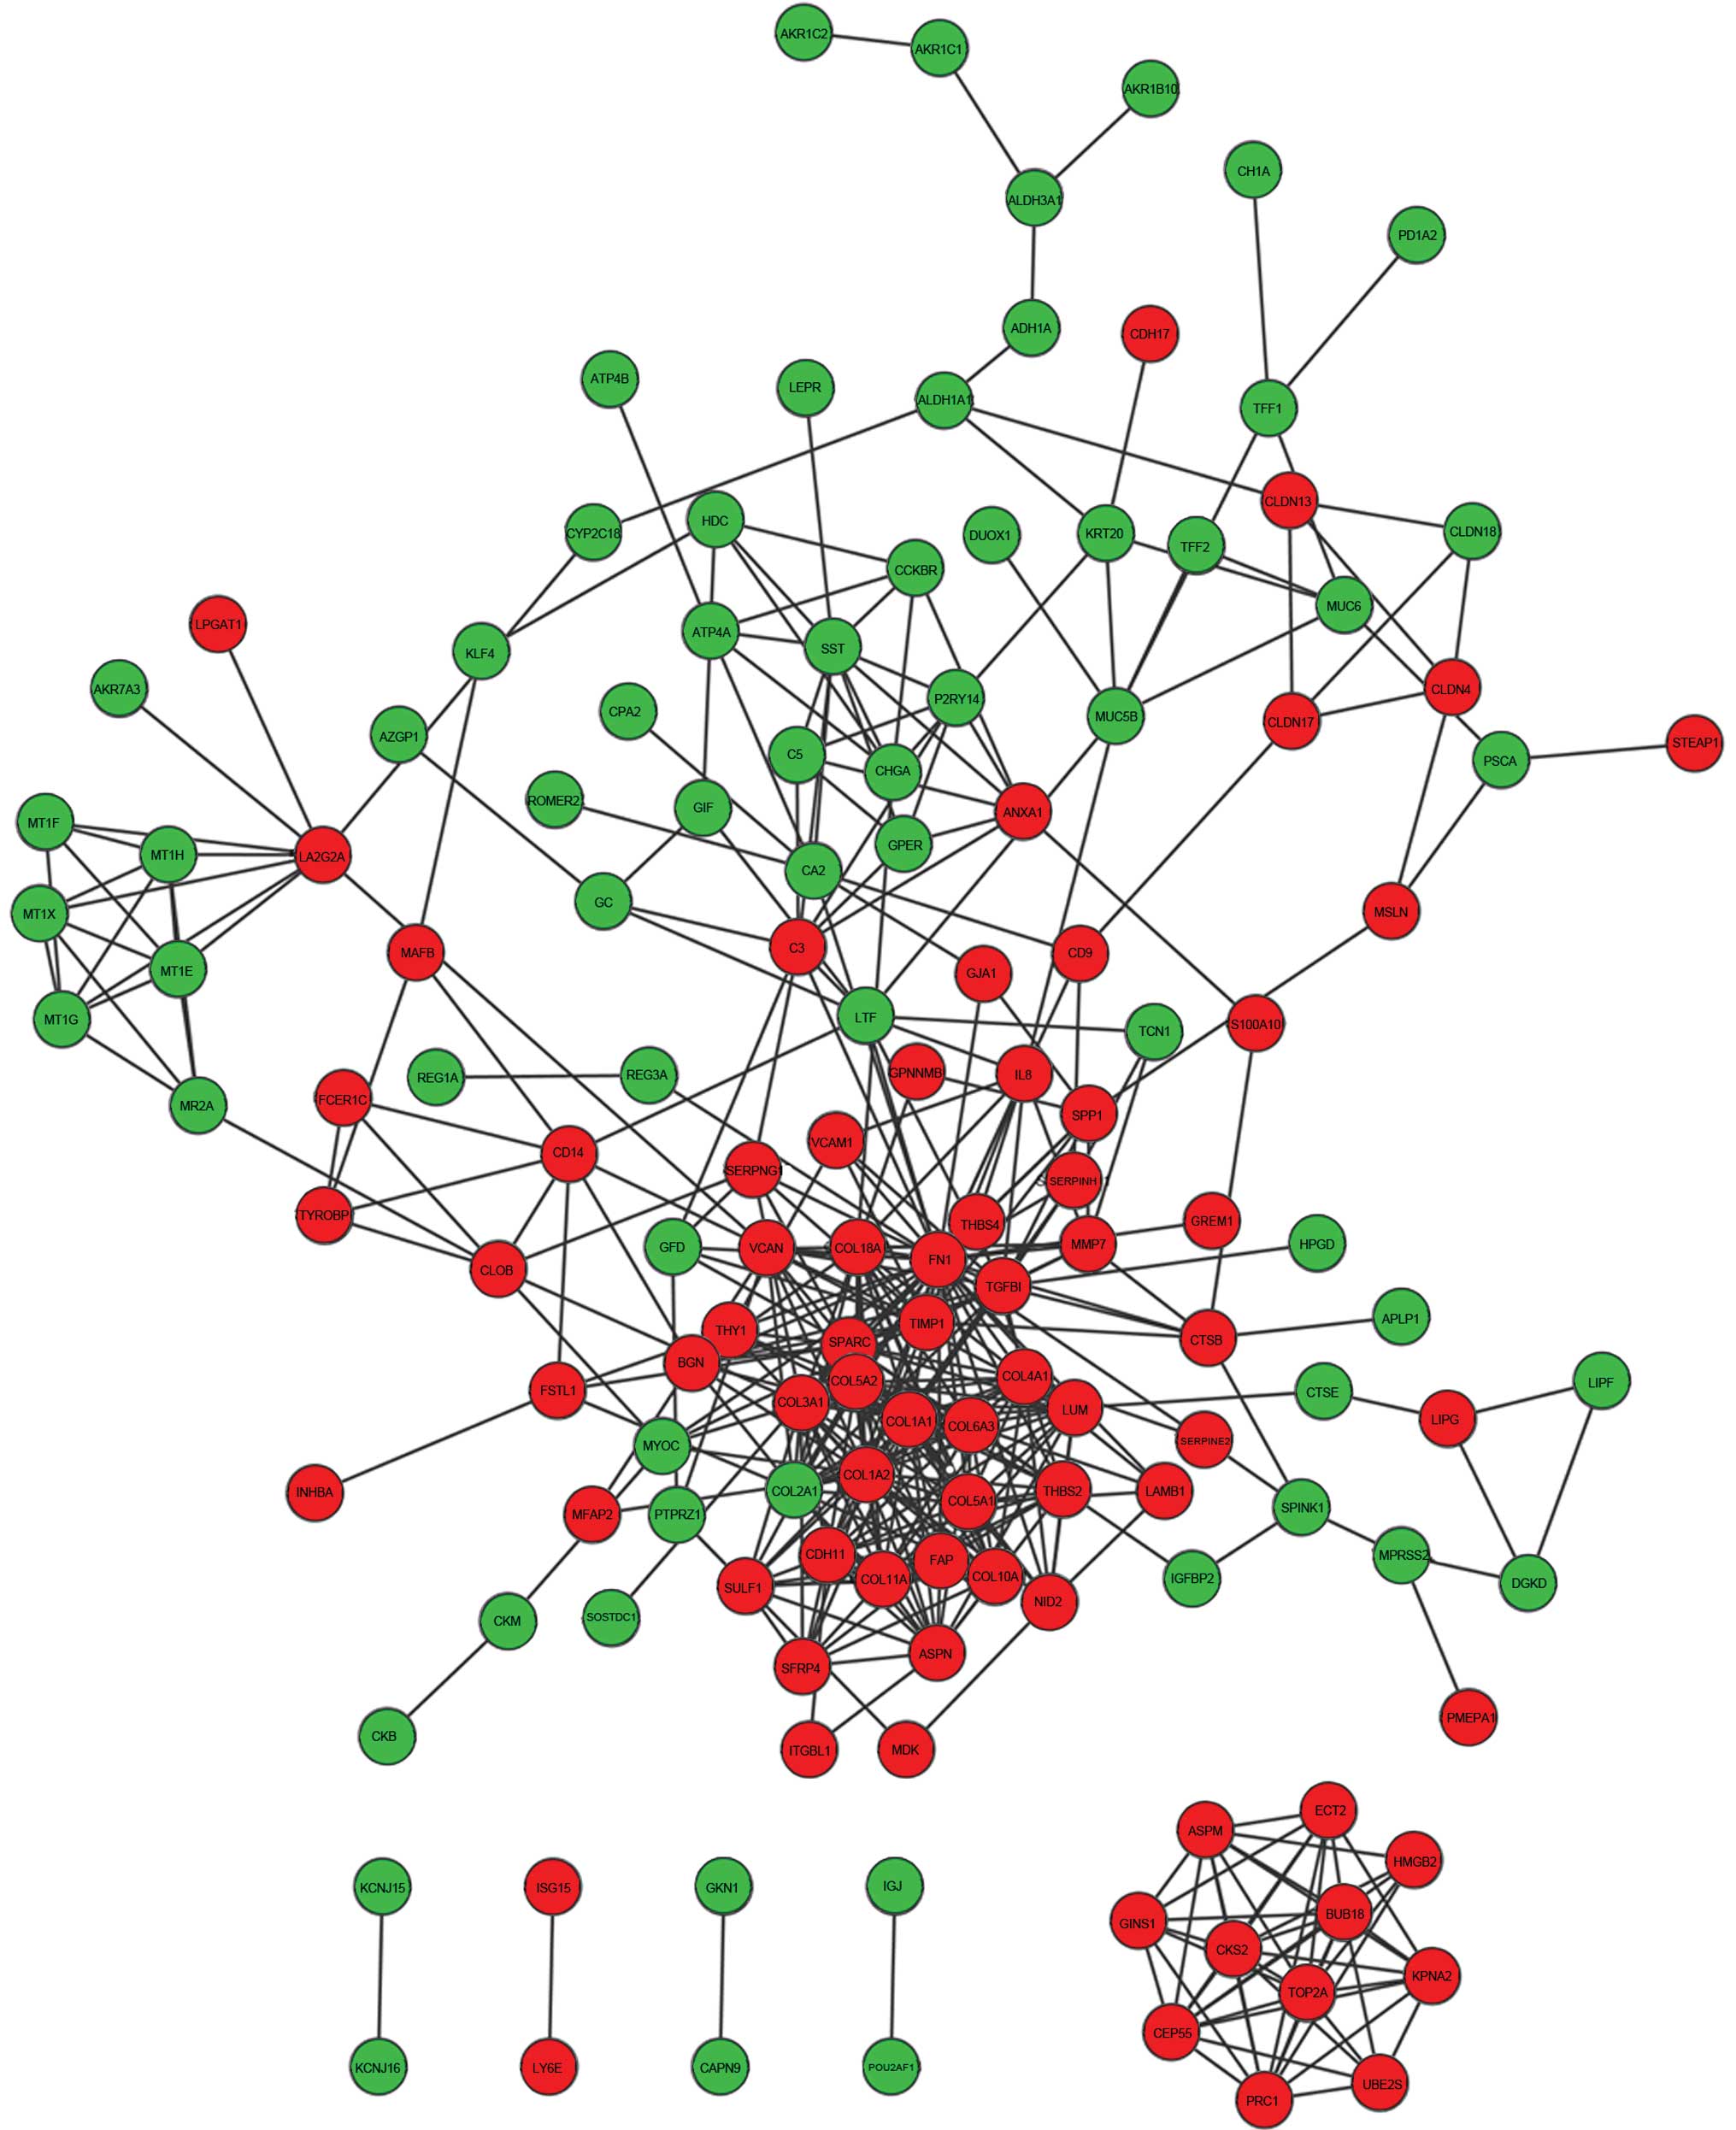
PPI network
A PPI network was constructed for the overlapping
DEGs (Fig. 4), including 141 nodes
and 446 edges.
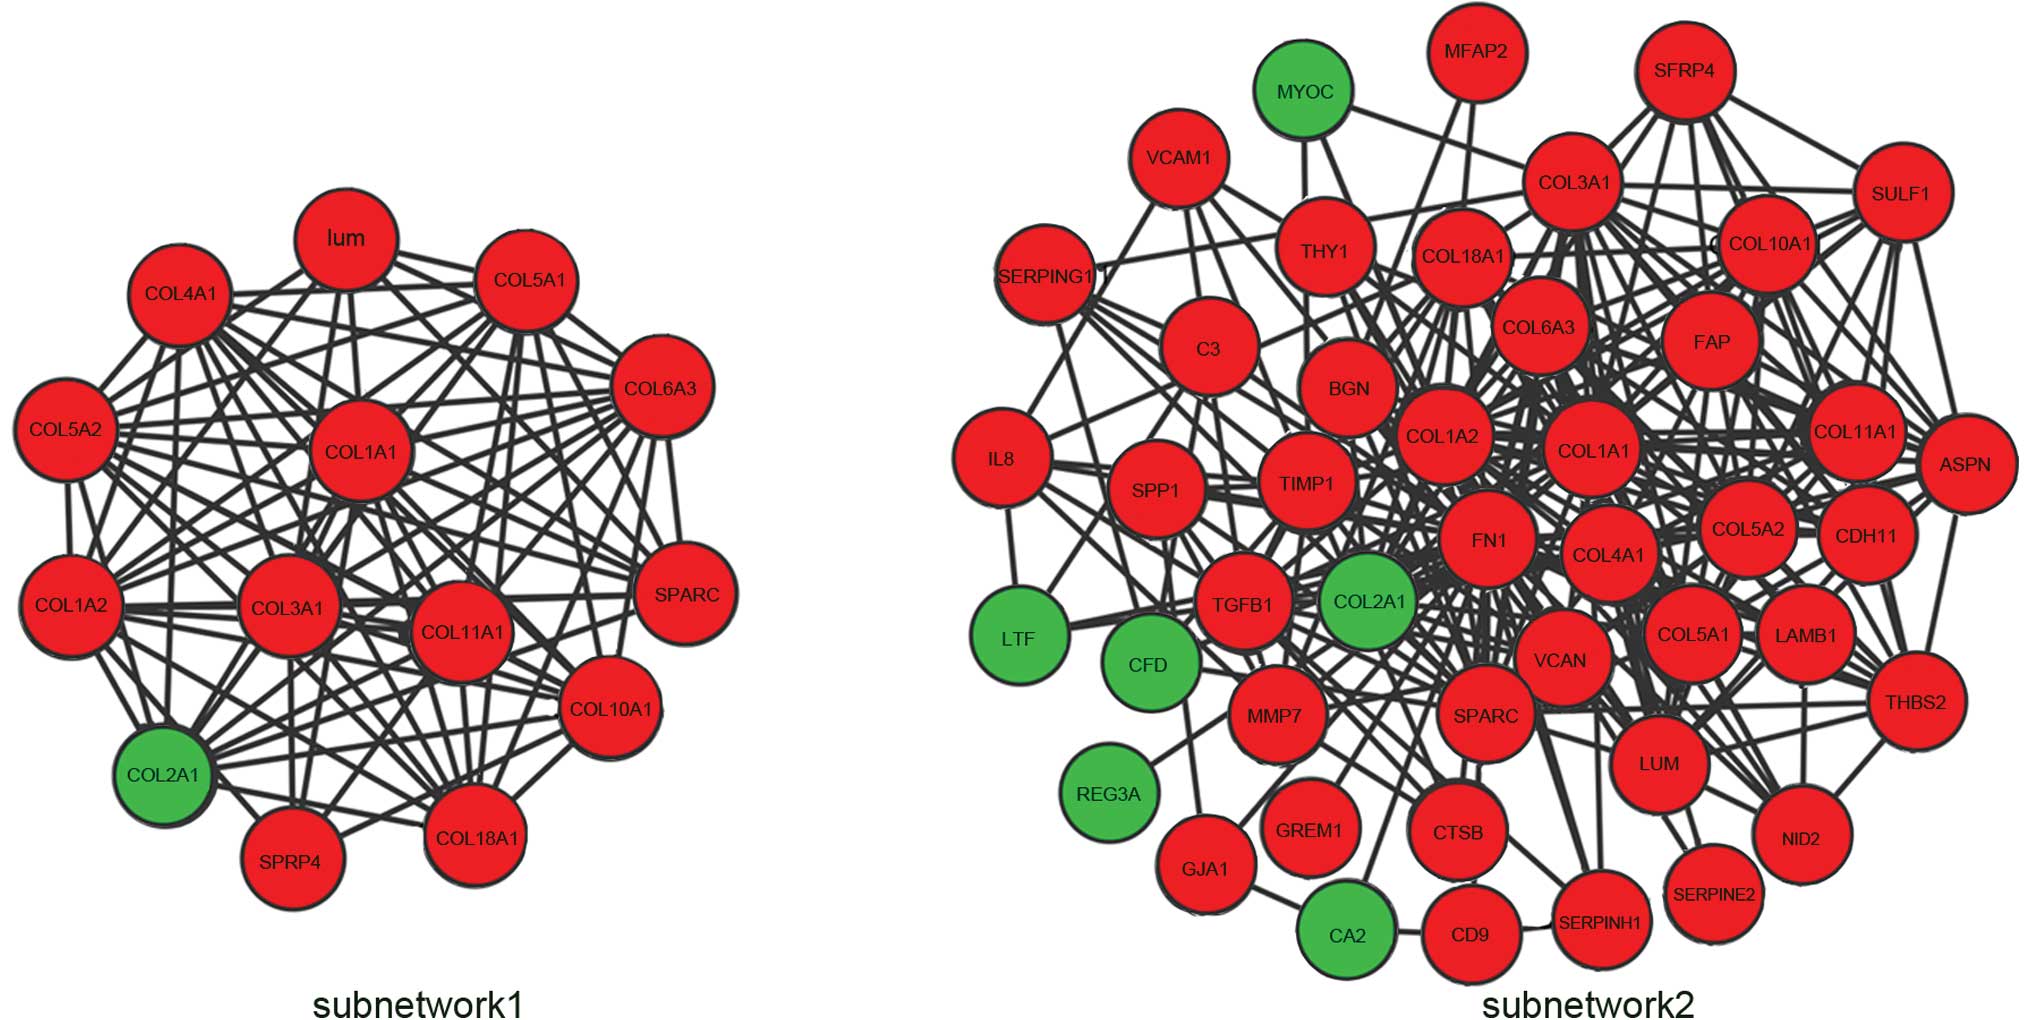
Subnetwork 1 consisting of nodes with a degree
>10 were extracted from the whole network (Fig. 5). The subnetwork contained 14 nodes
and 75 edges. Three hub genes with a degree >25 were identified:
Fibronectin 1 (FN1), collagen type I α2 (COL1A2) and COL1A1. The
degrees of connectivity were 38, 28 and 26, respectively. The 3 hub
genes interacted with each other and their neighboring nodes were
selected as subnetwork 2, which included 45 nodes and 245 edges
(Fig. 5).
Functional enrichment analysis was performed for the
genes in the two subnetworks (Tables
IV and V). GO enrichment analysis
showed that the genes in subnetwork 1 were associated with collagen
fibril organization, ECM organization and cell adhesion (Table IV). ECM-receptor interaction and
focal adhesion were significantly enriched (Table IV). As for genes from subnetwork 2,
they were involved in ECM organization, cell adhesion and
extracellular structure organization (Table V). ECM-receptor interaction, focal
adhesion, and complement and coagulation cascades were enriched
(Table V).
| Table IV.Functional enrichment analysis result
for genes from subnetwork 1. |
Table IV.
Functional enrichment analysis result
for genes from subnetwork 1.
| Category | Term | Count | P-value |
|---|
| GOTERM_BP_FAT | GO:0030199,
collagen fibril organization | 8 |
7.46×10⁻¹⁷ |
| GOTERM_BP_FAT | GO:0030198, ECM
organization | 9 |
4.46×10⁻¹⁵ |
| GOTERM_BP_FAT | GO:0043062,
extracellular structure organization | 9 |
1.78×10⁻¹³ |
| GOTERM_BP_FAT | GO:0001501,
skeletal system development | 8 |
2.72×10⁻⁹ |
| GOTERM_BP_FAT | GO:0007155, cell
adhesion | 6 |
2.14×10⁻⁴ |
| GOTERM_CC_FAT | GO:0044420, ECM
part | 13 |
2.50×10⁻²⁴ |
| GOTERM_CC_FAT | GO:0005578,
proteinaceous ECM | 13 |
6.27×10⁻¹⁹ |
| GOTERM_CC_FAT | GO:0031012,
ECM | 13 |
1.57×10⁻¹⁸ |
| GOTERM_CC_FAT | GO:0044421,
extracellular region part | 14 |
2.24×10⁻¹⁵ |
| GOTERM_CC_FAT | GO:0005576,
extracellular region | 14 |
3.48×10⁻¹¹ |
| GOTERM_MF_FAT | GO:0005201, ECM
structural constituent | 10 |
3.45×10⁻¹⁸ |
| GOTERM_MF_FAT | GO:0048407,
platelet-derived growth factor binding | 6 |
1.19×10⁻¹³ |
| GOTERM_MF_FAT | GO:0005198,
structural molecule activity | 10 |
2.88×10⁻¹⁰ |
| GOTERM_MF_FAT | GO:0019838, growth
factor binding | 6 |
2.38×10⁻⁸ |
| GOTERM_MF_FAT | GO:0046332, SMAD
binding | 3 |
7.92×10⁻⁴ |
| KEGG_PATHWAY | hsa04512:
ECM-receptor interaction | 9 |
3.52×10⁻¹⁴ |
| KEGG_PATHWAY | hsa04510: Focal
adhesion | 9 |
4.53×10⁻¹¹ |
| Table V.Functional enrichment analysis result
for genes from subnetwork 2. |
Table V.
Functional enrichment analysis result
for genes from subnetwork 2.
| Category | Term | Count | P-value |
|---|
| GOTERM_BP_FAT | GO:0030198, ECM
organization | 11 |
3.24×10⁻¹³ |
| GOTERM_BP_FAT | GO:0007155, cell
adhesion | 18 |
3.27×10⁻¹² |
| GOTERM_BP_FAT | GO:0022610,
biological adhesion | 18 |
3.35×10⁻¹² |
| GOTERM_BP_FAT | GO:0043062,
extracellular structure organization | 11 |
3.04×10⁻¹¹ |
| GOTERM_BP_FAT | GO:0009611,
response to wounding | 12 |
2.48×10⁻⁷ |
| GOTERM_CC_FAT | GO:0044421,
extracellular region part | 36 |
8.96×10⁻³² |
| GOTERM_CC_FAT | GO:0005576,
extracellular region | 39 |
5.65×10⁻²⁵ |
| GOTERM_CC_FAT | GO:0005578,
proteinaceous ECM | 23 |
3.57×10⁻²⁴ |
| GOTERM_CC_FAT | GO:0031012,
ECM | 23 |
1.89×10⁻²³ |
| GOTERM_CC_FAT | GO:0005615,
extracellular space | 21 |
1.53×10⁻¹⁴ |
| GOTERM_MF_FAT | GO:0005198,
structural molecule activity | 15 |
2.71×10⁻⁹ |
| GOTERM_MF_FAT | GO:0005201, ECM
structural constituent | 13 |
1.53×10⁻¹⁷ |
| GOTERM_MF_FAT | GO:0048407,
platelet-derived growth factor binding | 6 |
9.76×10⁻¹¹ |
| GOTERM_MF_FAT | GO:0030246,
carbohydrate binding | 7 |
6.90×10⁻⁴ |
| GOTERM_MF_FAT | GO:0005509, calcium
ion binding | 8 |
2.08×10⁻² |
| KEGG_PATHWAY | hsa04512:
ECM-receptor interaction | 13 |
7.92×10⁻¹⁶ |
| KEGG_PATHWAY | hsa04510: Focal
adhesion | 13 |
3.48×10⁻¹¹ |
| KEGG_PATHWAY | hsa04610:
Complement and coagulation cascades | 3 |
4.45×10⁻² |
Discussion
A comparative analysis of gene expression data of
GCA and GNCA was performed in the present study. A total of 284
DEGs were identified in GCA, while 268 DEGs were revealed in GNCA.
As many as 194 DEGs were shared by GCA and GNCA, while 90 DEGs were
unique in GCA.
Upregulated common DEGs were involved in cell
adhesion and the regulation of cell proliferation. Several members
of the claudin family were revealed, including claudin 7 (CLDN7),
CLDN4 and CLDN3. CLDN7 expression is an early event in gastric
tumorigenesis (22). Zavala-Zendejas
et al also reported that the overexpression of CLDN7 in the
human gastric adenocarcinoma AGS cell line increased its
invasiveness, migration and proliferation rate (23). CLDN4 and CLDN3 may also play roles in
the pathogenesis of gastric cancer. Cadherin 11 (CDH11) and CDH17
were also found to be upregulated in GCA and GNCA in the present
study. CDH17 is reported as a prognostic marker in early-stage
gastric cancer (11). Zhang et
al blocked the proliferation and migration of gastric cancer
via targeting CDH17 with an artificial microRNA (24), suggesting that CDH17 is a potential
target for the control of gastric cancer progression. In the
present study, downregulated common DEGs were associated with
digestion and metabolism, suggesting that the function of the
stomach was impaired by the cancer. Several enzymes were included
in the affected list, such as progastricsin, calpain 9 and
aldo-keto reductase family 1 member C2. Mucin 6 (MUC6) and MUC5AC,
playing essential roles in epithelial cytoprotection from acids and
proteases, were also downregulated.
In the present study, a PPI network, including 141
nodes and 446 edges, was constructed for the common DEGs, from
which two subnetworks were disclosed. Genes from the two
subnetworks were associated with cell adhesion and ECM
organization. The ECM provides a microenvironment for cell
proliferation, cell adhesion and cell motion, and thus plays a
critical role in cancer development (25) and metastasis (26). FN1, COL1A2 and COL1A1 were the top 3
hub genes in the whole network. FN1 is involved in cell adhesion
and migration processes such as metastasis. David et al
found that fibronectin expression is significantly associated with
the expanding growth pattern of the gastric cancer (27). Yang et al found that Twist
regulates cell motility and invasion in gastric cancer cell lines
through N-cadherin and fibronectin production (28).
GCA-unique DEGs were implicated in the cell cycle
and the regulation of cell proliferation in the present study. MAD1
mitotic arrest deficient-like 1 (MAD1L1) is a component of the
mitotic spindle-assembly checkpoint that prevents the onset of
anaphase until all chromosomes are properly aligned at the
metaphase plate, and it may play a role in cell cycle control and
tumor suppression. Coe et al report that MAD1L1 is the most
frequent copy number gain in small cell lung cancer cell lines
(29). Guo et al further
suggested that genetic variants in MAD1L1 and MAD2L1 confer a
susceptibility to lung cancer, which may result from reduced
spindle checkpoint function due to the attenuated function of
MAD1L1 and/or MAD2L1 (30). We
supposed that MAD1L1 had a similar role in the pathogenesis of GCA.
Three members of the cyclin family, CCNB1, CCNB2 and CCNE1, were
also found to be upregulated in GCA. The B-type cyclins, CCNB1 and
CCNB2, associate with p34cdc2 and are essential components of the
cell cycle regulatory machinery. Begnami et al found that
the expression of cyclin B1 is associated with regional lymph node
metastasis and a poor prognosis in gastric cancer (31).
GNCA-unique DEGs were found to be associated with
cell death in the present study. Abnormalities in cell death are
closely associated with tumorigenesis. The GATA family of
transcription factors participates in gastrointestinal development.
GATA binding protein 6 (GATA6) is shown to be expressed in gastric
cancer; it activates the expression of gastroprotective trefoil
genes, trefoil factor 1 (TFF1) and TFF2 (32). Haveri et al further reported
that GATA6 expression is altered in neoplastic human
gastrointestinal mucosa (33),
suggesting that it may play a role in tumor progression.
Hyaluronoglucosaminidase 1 (HYAL1) is a lysosomal hyaluronidase.
Hyaluronan is believed to be involved in cell proliferation,
migration and differentiation. HYAL1 is suggested to exhibit
prognostic potential in prostate cancer (34). The study by Lokeshwar et al
showed that, depending on the concentration, HYAL1 functions as a
tumor promoter or as a suppressor in prostate cancer (35). We speculated that it may exert a
similar function in the progression of GNCA.
Overall, in the present study, a number of common
DEGs were identified in GCA and GNCA, which could advance our
understanding of the etiology of gastric cancer. Furthermore, DEGs
unique to GCA and to GNCA were identified, which supplemented our
knowledge on the pathogenetic mechanisms involved and provided
potential biomarkers for the diagnosis, prognosis or treatment of
the disease.
References
|
1
|
Fock KM and Ang TL: Epidemiology of
Helicobacter pylori infection and gastric cancer in Asia. J
Gastroenterol Hepatol. 25:479–486. 2010. View Article : Google Scholar : PubMed/NCBI
|
|
2
|
Plummer M, Franceschi S, Vignat J, Forman
D and de Martel C: Global burden of gastric cancer attributable to
Helicobacter pylori. Int J Cancer. 136:487–490. 2015. View Article : Google Scholar : PubMed/NCBI
|
|
3
|
Wilkinson N: Management of gastric
cancerSurgical Oncology Clinics. Saunders; Philadelphia, PA: 2012,
View Article : Google Scholar : PubMed/NCBI
|
|
4
|
Abnet CC, Freedman ND, Hu N, Wang Z, Yu K,
Shu XO, Yuan JM, Zheng W, Dawsey SM, Dong LM, et al: A shared
susceptibility locus in PLCE1 at 10q23 for gastric adenocarcinoma
and esophageal squamous cell carcinoma. Nat Genet. 42:764–767.
2010. View
Article : Google Scholar : PubMed/NCBI
|
|
5
|
Gleeson CM, Sloan JM, McManus DT, Maxwell
P, Arthur K, McGuigan JA, Ritchie AJ and Russell SE: Comparison of
p53 and DNA content abnormalities in adenocarcinoma of the
oesophagus and gastric cardia. Br J Cancer. 77:277–286. 1998.
View Article : Google Scholar : PubMed/NCBI
|
|
6
|
Kamangar F, Dawsey SM, Blaser MJ,
Perez-Perez GI, Pietinen P, Newschaffer CJ, Abnet CC, Albanes D,
Virtamo J and Taylor PR: Opposing risks of gastric cardia and
noncardia gastric adenocarcinomas associated with Helicobacter
pylori seropositivity. J Natl Cancer Inst. 98:1445–1452. 2006.
View Article : Google Scholar : PubMed/NCBI
|
|
7
|
Kim MA, Lee HS, Yang HK and Kim WH:
Clinicopathologic and protein expression differences between cardia
carcinoma and noncardia carcinoma of the stomach. Cancer.
103:1439–1446. 2005. View Article : Google Scholar : PubMed/NCBI
|
|
8
|
Ziogas D, Baltogiannis G, Fatouros M and
Roukos DH: Identifying and preventing high-risk gastric cancer
individuals with CDH1 mutations. Ann Surg. 247:714–715; author
reply 715–716. 2008. View Article : Google Scholar : PubMed/NCBI
|
|
9
|
Norton JA, Ham CM, Van Dam J, Jeffrey RB,
Longacre TA, Huntsman DG, Chun N, Kurian AW and Ford JM: CDH1
truncating mutations in the E-cadherin gene: An indication for
total gastrectomy to treat hereditary diffuse gastric cancer. Ann
Surg. 245:873–879. 2007. View Article : Google Scholar : PubMed/NCBI
|
|
10
|
Yu J, Tao Q, Cheng YY, Lee KY, Ng SS,
Cheung KF, Tian L, Rha SY, Neumann U, Röcken C, et al: Promoter
methylation of the Wnt/beta-catenin signaling antagonist Dkk-3 is
associated with poor survival in gastric cancer. Cancer. 115:49–60.
2009. View Article : Google Scholar : PubMed/NCBI
|
|
11
|
Lee HJ, Nam KT, Park HS, Kim MA, Lafleur
BJ, Aburatani H, Yang HK, Kim WH and Goldenring JR: Gene expression
profiling of metaplastic lineages identifies CDH17 as a prognostic
marker in early stage gastric cancer. Gastroenterology.
139:213–225. 2010. View Article : Google Scholar : PubMed/NCBI
|
|
12
|
Engelman JA, Zejnullahu K, Mitsudomi T,
Song Y, Hyland C, Park JO, Lindeman N, Gale CM, Zhao X, Christensen
J, et al: MET amplification leads to gefitinib resistance in lung
cancer by activating ERBB3 signaling. Science. 316:1039–1043. 2007.
View Article : Google Scholar : PubMed/NCBI
|
|
13
|
Chen YR, Juan HF, Huang HC, Huang HH, Lee
YJ, Liao MY, Tseng CW, Lin LL, Chen JY, Wang MJ, et al:
Quantitative proteomic and genomic profiling reveals
metastasis-related protein expression patterns in gastric cancer
cells. J Proteome Res. 5:2727–2742. 2006. View Article : Google Scholar : PubMed/NCBI
|
|
14
|
Chen CN, Lin JJ, Chen JJ, Lee PH, Yang CY,
Kuo ML, Chang KJ and Hsieh FJ: Gene expression profile predicts
patient survival of gastric cancer after surgical resection. J Clin
Oncol. 23:7286–7295. 2005. View Article : Google Scholar : PubMed/NCBI
|
|
15
|
Wang G, Hu N, Yang HH, Wang L, Su H, Wang
C, Clifford R, Dawsey EM, Li JM, Ding T, et al: Comparison of
global gene expression of gastric cardia and noncardia cancers from
a high-risk population in China. PLoS One. 8:e638262013. View Article : Google Scholar : PubMed/NCBI
|
|
16
|
Irizarry RA, Hobbs B, Collin F,
Beazer-Barclay YD, Antonellis KJ, Scherf U and Speed TP:
Exploration, normalization and summaries of high density
oligonucleotide array probe level data. Biostatistics. 4:249–264.
2003. View Article : Google Scholar : PubMed/NCBI
|
|
17
|
Smyth GK: Linear models and empirical
bayes methods for assessing differential expression in microarray
experiments. Stat Appl Genet Mol Biol. 3:Article 3. 2004.PubMed/NCBI
|
|
18
|
Huang DW, Sherman BT, Tan Q, Collins JR,
Alvord WG, Roayaei J, Stephens R, Baseler MW, Lane HC and Lempicki
RA: The DAVID gene functional classification tool: A novel
biological module-centric algorithm to functionally analyze large
gene lists. Genome Biol. 8:R1832007. View Article : Google Scholar : PubMed/NCBI
|
|
19
|
Franceschini A, Szklarczyk D, Frankild S,
Kuhn M, Simonovic M, Roth A, Lin J, Minguez P, Bork P, von Mering C
and Jensen LJ: STRING v9.1: Protein-protein interaction networks,
with increased coverage and integration. Nucleic Acids Res.
41:D808–D815. 2013. View Article : Google Scholar : PubMed/NCBI
|
|
20
|
Kohl M, Wiese S and Warscheid B:
Cytoscape: Software for visualization and analysis of biological
networks. Methods Mol Biol. 696:291–303. 2011. View Article : Google Scholar : PubMed/NCBI
|
|
21
|
Bader GD and Hogue CW: An automated method
for finding molecular complexes in large protein interaction
networks. BMC Bioinformatics. 4:22003. View Article : Google Scholar : PubMed/NCBI
|
|
22
|
Johnson AH, Frierson HF, Zaika A, Powell
SM, Roche J, Crowe S, Moskaluk CA and El-Rifai W: Expression of
tight-junction protein claudin-7 is an early event in gastric
tumorigenesis. Am J Pathol. 167:577–584. 2005. View Article : Google Scholar : PubMed/NCBI
|
|
23
|
Zavala-Zendejas VE, Torres-Martinez AC,
Salas-Morales B, Fortoul TI, Montaño LF and Rendon-Huerta EP:
Claudin-6, 7, or 9 overexpression in the human gastric
adenocarcinoma cell line AGS increases its invasiveness, migration,
and proliferation rate. Cancer Invest. 29:1–11. 2011. View Article : Google Scholar : PubMed/NCBI
|
|
24
|
Zhang J, Liu QS and Dong WG: Blockade of
proliferation and migration of gastric cancer via targeting CDH17
with an artificial microRNA. Med Oncol. 28:494–501. 2011.
View Article : Google Scholar : PubMed/NCBI
|
|
25
|
Lu P, Weaver VM and Werb Z: The
extracellular matrix: A dynamic niche in cancer progression. J Cell
Biol. 196:395–406. 2012. View Article : Google Scholar : PubMed/NCBI
|
|
26
|
Stetler-Stevenson WG, Aznavoorian S and
Liotta LA: Tumor cell interactions with the extracellular matrix
during invasion and metastasis. Annu Rev Cell Biol. 9:541–573.
1993. View Article : Google Scholar : PubMed/NCBI
|
|
27
|
David L, Nesland JM, Holm R and
Sobrinho-Simões M: Expression of laminin, collagen IV, fibronectin,
and type IV collagenase in gastric carcinoma. An
immunohistochemical study of 87 patients. Cancer. 73:518–527. 1994.
View Article : Google Scholar : PubMed/NCBI
|
|
28
|
Yang Z, Zhang X, Gang H, Li X, Li Z, Wang
T, Han J, Luo T, Wen F and Wu X: Up-regulation of gastric cancer
cell invasion by Twist is accompanied by N-cadherin and fibronectin
expression. Biochem Biophys Res Commun. 358:925–930. 2007.
View Article : Google Scholar : PubMed/NCBI
|
|
29
|
Coe BP, Lee EH, Chi B, Girard L, Minna JD,
Gazdar AF, Lam S, MacAulay C and Lam WL: Gain of a region on
7p22.3, containing MAD1L1, is the most frequent event in small-cell
lung cancer cell lines. Genes Chromosomes Cancer. 45:11–19. 2006.
View Article : Google Scholar : PubMed/NCBI
|
|
30
|
Guo Y, Zhang X, Yang M, Miao X, Shi Y, Yao
J, Tan W, Sun T, Zhao D, Yu D, et al: Functional evaluation of
missense variations in the human MAD1L1 and MAD2L1 genes and their
impact on susceptibility to lung cancer. J Med Genet. 47:616–622.
2010. View Article : Google Scholar : PubMed/NCBI
|
|
31
|
Begnami MD, Fregnani JH, Nonogaki S and
Soares FA: Evaluation of cell cycle protein expression in gastric
cancer: Cyclin B1 expression and its prognostic implication. Hum
Pathol. 41:1120–1127. 2010. View Article : Google Scholar : PubMed/NCBI
|
|
32
|
Al-azzeh ED, Fegert P, Blin N and Gött P:
Transcription factor GATA-6 activates expression of
gastroprotective trefoil genes TFF1 and TFF2. Biochim Biophys Acta.
1490:324–332. 2000. View Article : Google Scholar : PubMed/NCBI
|
|
33
|
Haveri H, Westerholm-Ormio M, Lindfors K,
Mäki M, Savilahti E, Andersson LC and Heikinheimo M: Transcription
factors GATA-4 and GATA-6 in normal and neoplastic human
gastrointestinal mucosa. BMC Gastroenterol. 8:92008. View Article : Google Scholar : PubMed/NCBI
|
|
34
|
Posey JT, Soloway MS, Ekici S, Sofer M,
Civantos F, Duncan RC and Lokeshwar VB: Evaluation of the
prognostic potential of hyaluronic acid and hyaluronidase (HYAL1)
for prostate cancer. Cancer Res. 63:2638–2644. 2003.PubMed/NCBI
|
|
35
|
Lokeshwar VB, Cerwinka WH, Isoyama T and
Lokeshwar BL: HYAL1 hyaluronidase in prostate cancer: A tumor
promoter and suppressor. Cancer Res. 65:7782–7789. 2005.PubMed/NCBI
|