Introduction
Endometrial diseases are common gynecological
conditions that pose a threat to women's health. Improvements in
ultrasonography (US) have led to it becoming an important method
for differentiating and diagnosing endometrial diseases. In recent
years, research and advances in contrast-enhanced US (CEUS) imaging
technology have allowed it to be successfully applied in the
diagnosis and treatment of liver tumors, and in the diagnosis of
cardiovascular, urinary (1–3) and superficial tissue diseases (4). However, its application in the diagnosis
of gynecological diseases remains at the experimental stage
(5). Preliminary conclusions from
studies in China and around the world have shown the value of
ultrasound imaging in the diagnosis of gynecological diseases
(6). CEUS offers the opportunity to
identify endometrial diseases in the static B-scan mode, and to
simultaneously assess the capillary microperfusion in the dynamic
contrast harmonic imaging mode. Furthermore, a quantitative
assessment of microperfusion is possible using time-intensity curve
(TIC) analysis (7,8). This is of particular significance, as
angiogenesis is an essential factor for tumor growth and metastasis
in a range of human tumors, including endometrial cancer (9). Therefore, the study of tumor
angiogenesis and MVD may assist in improving the prognosis of
cancer patients.
In the present study, CEUS was used for the
examination of endometrial lesions. The enhancement characteristics
of the diseased areas and changes over a TIC were analyzed. The
feasibility of applying CEUS for distinguishing between benign and
malignant endometrial lesions investigated and markers that were
correlated with the pathological results were screened. This study
aimed to analyze CEUS parameters and their association with
microvessel density (MVD), as assessed by immunohistochemistry in
benign and malignant uterine tumors.
Materials and methods
Subjects
The study group consisted of 91 patients
(outpatients and inpatients) who were treated at the Harbin Medical
University Cancer Hospital (Harbin, China) between January 2010 and
March 2014, and were diagnosed with endometrial disease based on
pathological results (gold standard). All pathology samples were
obtained via biopsy or surgery. The patients were divided into two
groups: A benign endometrial lesion group, including 42 patients
with a mean age of 44.83±7.71 years (range, 33–58 years), and a
malignant lesion group, including 49 patients with a mean age of
47.36±9.14 years (range, 36–63 years). None of the patients had a
history of radiochemotherapy treatment, hypertension, heart disease
or drug allergies. After providing written informed consent, the
patients underwent an ultrasound examination during the week
immediately prior to surgery. This study was conducted in
accordance with the declaration of Helsinki and with approval from
the Ethics Committee of Harbin Medical University (Harbin, China).
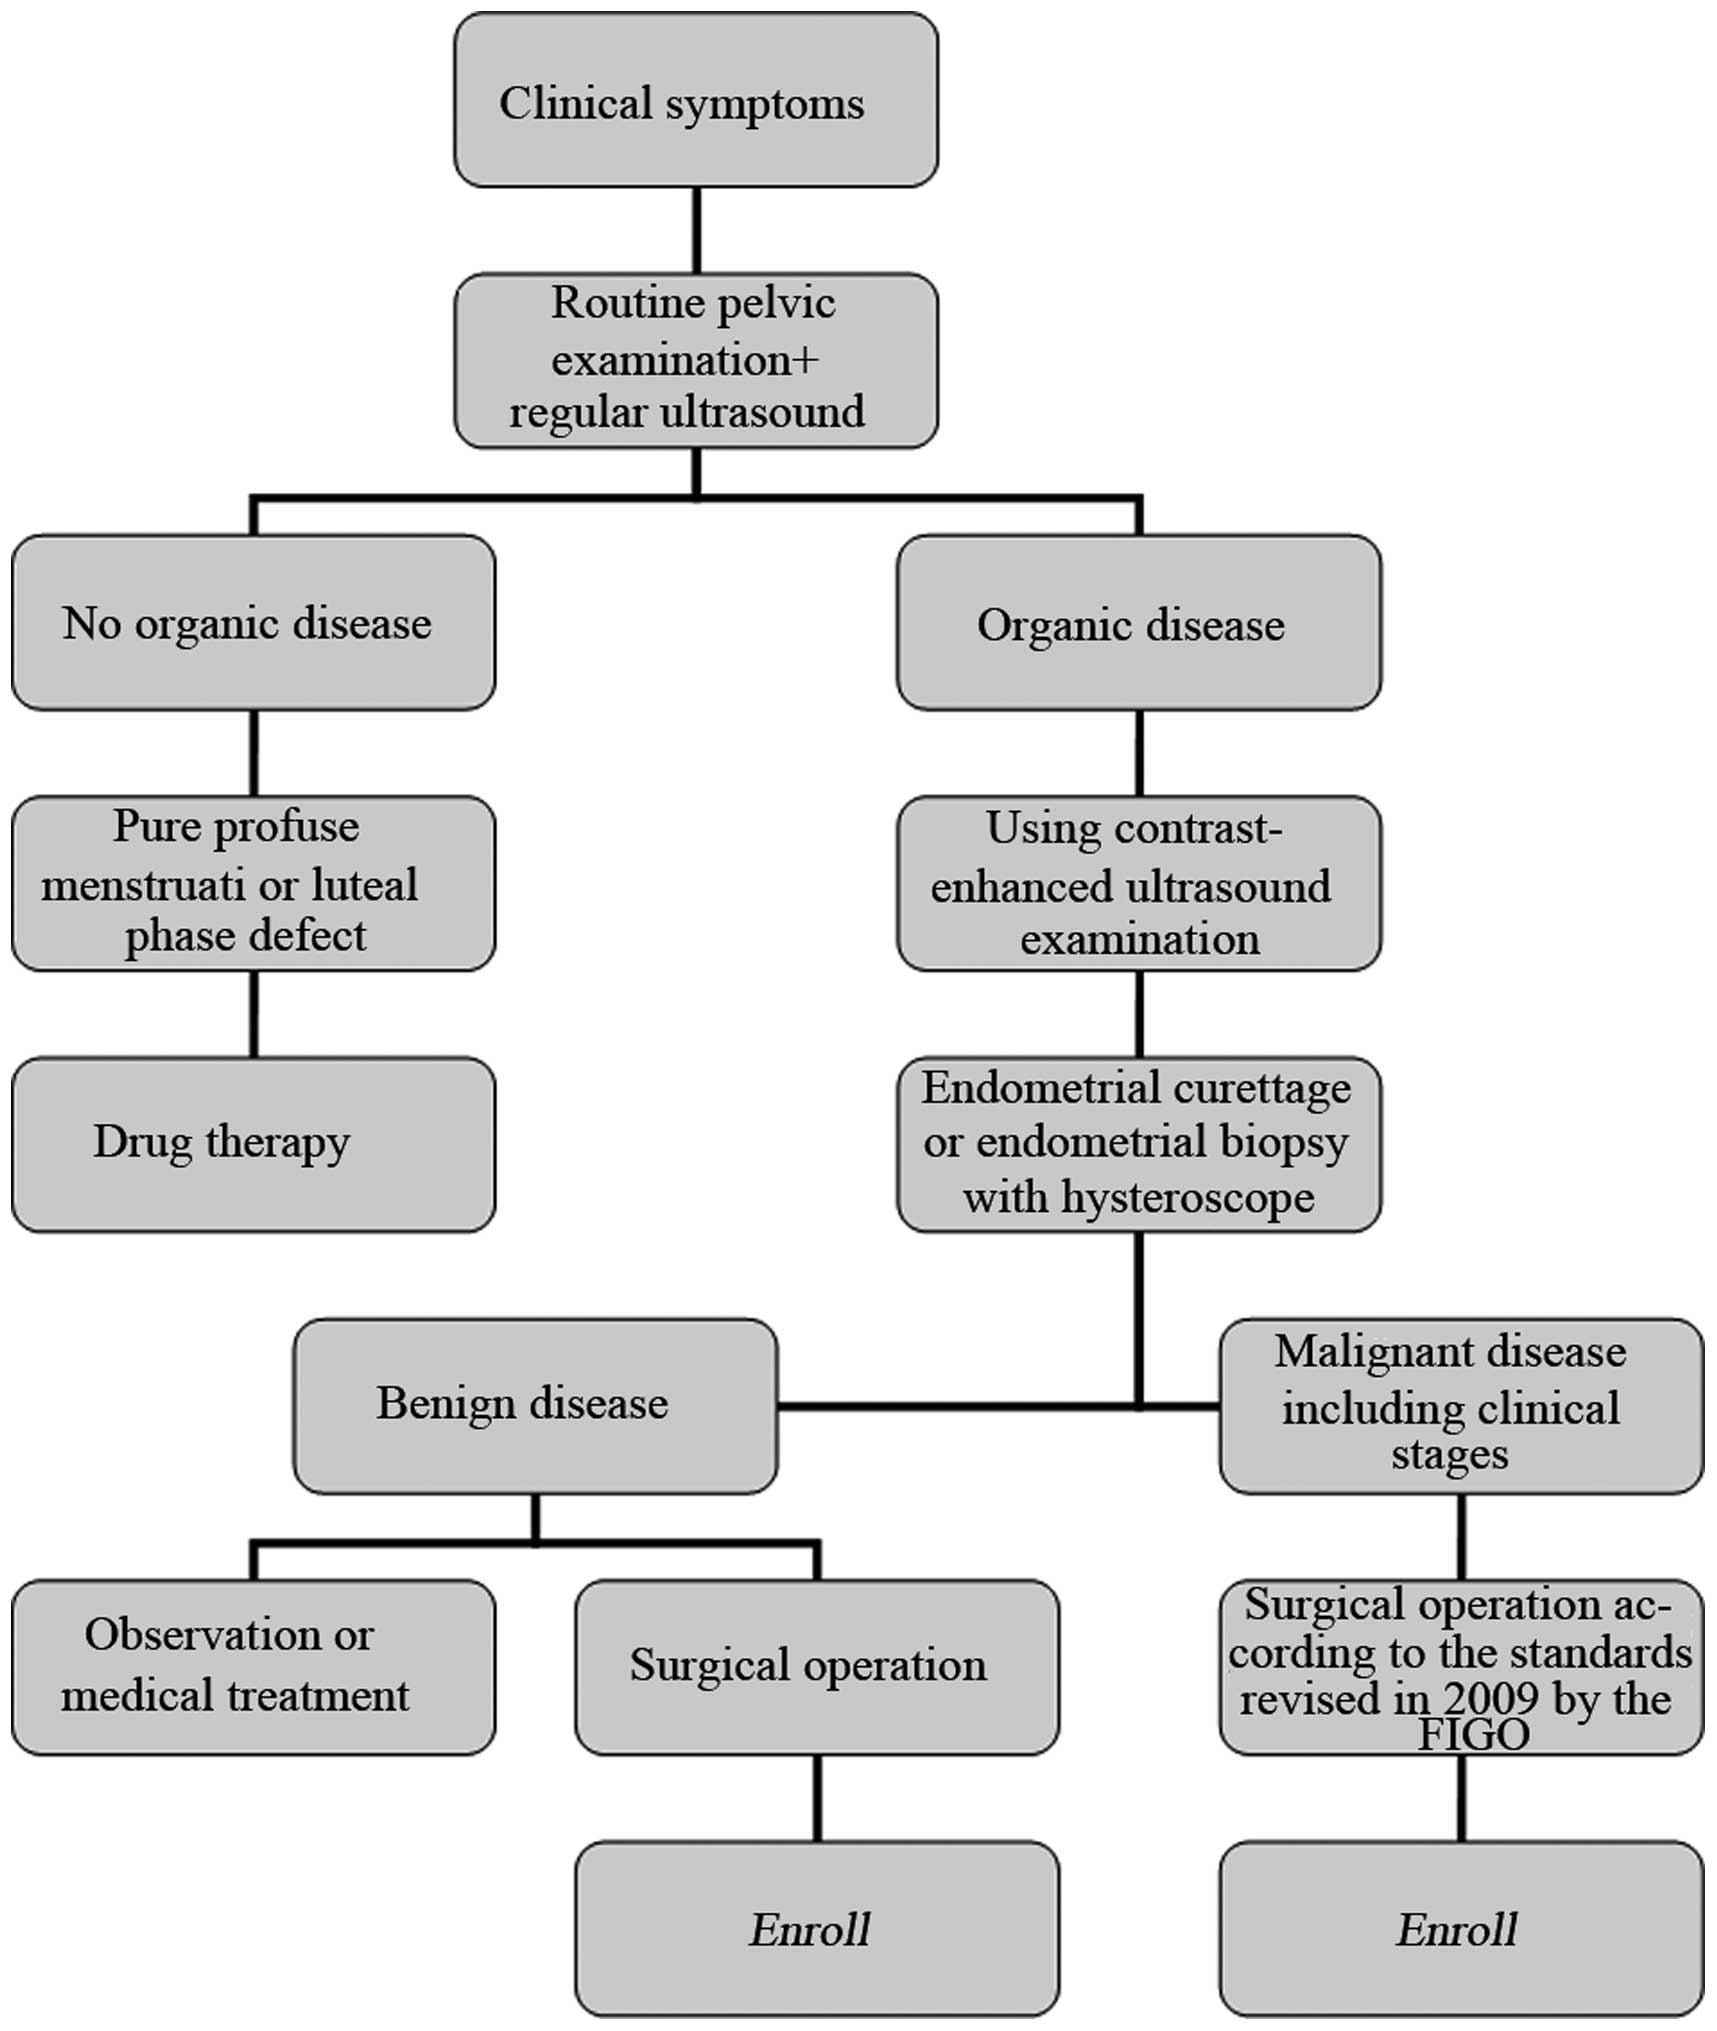
Written informed consent was obtained from all participants. A
flowchart of the diagnosis and treatment of endometrial diseases in
the enrolled patients is shown in Fig.
1.
Equipment
An ACUSON Sequoia™ 512 color ultrasound system
(Siemens AG, Munich, Germany) was used to perform Cadence™ contrast
pulse sequencing (CPS) and auto contrast quantification, using an
EC-10C5 transducer (6–10 MHz) as a transvaginal probe. The
equipment settings, which included gain and time-gain compensation,
were constant during the imaging process. The mechanical index was
kept at 0.10–0.19.
Contrast agent
SonoVue (Bracco, Milan, Italy), a contrast agent
mainly consisting of sulfur hexafluoride gas microbubbles with a
phospholipid monolayer coating, was diluted prior to use in 5 ml of
0.9% saline, while shaking to obtain a white, milky solution. The
concentration of the microbubbles was 1–5×10⁸ ml with a
mean bubble diameter of 2.5 µm. The mean in vivo half-life
of SonoVue was 12 min. SonoVue was administered as a bolus
injection (2.4-ml dose), which was immediately followed by
injection of 5 ml saline. If necessary, this procedure was repeated
once more with the same dose and method.
Regular ultrasound
All patients underwent a regular ultrasound and CEUS
examination during the week immediately prior to surgery.
Transvaginal ultrasound was performed with the
patient having an empty bladder. Lesions were first revealed on
two-dimensional gray scale images, and the equipment settings
(including dynamic range, gain, depth and focus area) were adjusted
during the procedure to obtain the best images.
Contrast ultrasound
Following the regular ultrasound, CEUS was performed
while the patient's body position remained unchanged. A scanning
plane showing the lesion's largest diameter or most abundant blood
flow, the lesion and surrounding tissues simultaneously, and the
standard long and short axis planes whenever possible, was chosen
as the most appropriate plane to display the lesion. The imaging
conditions for the contrast pulse sequences were then selected.
The SonoVue solution (2.4 ml) was administered by
bolus injection via the ulnar vein, followed by a 5-ml saline
flush. Meanwhile, the built-in timer within the ultrasound
equipment was turned on, and the continuous real-time evaluation of
SonoVue uptake and washout, and echo intensity within the region of
interest was conducted. The imaging process took 3–6 min, and the
imaging data were stored in the ultrasound equipment built-in hard
drive for later analysis by the specialist. Results were compared
with those from the regular ultrasound and pathological
examinations.
Time-intensity curve (TIC)
analysis
The ultrasound equipment built-in auto contrast
quantification software automatically examined the images and
analyzed the TIC. It selected the appropriate region of interest
according to lesion size, and automatically scanned and recorded
the TIC. The following parameters were obtained from the TIC
analysis: Intensity parameters, including basis intensity (BI),
peak intensity (PI) and enhancement intensity (EI = PI - BI); and
time parameters, including arrival time (AT), time-to-peak (TTP),
rise time (RT; RT = TTP - AT, washout half-time (the time at which
the TIC PI decreased to half of its maximal EI) and clearance
half-time (RT + washout half-time).
Pathological analyses
The clinical stages of malignant lesions
(endometrial carcinoma) were determined according to the standards
of the International Federation of Gynecology and Obstetrics (FIGO)
revised in 2009 (10). Benign
endometrial lesions include endometrial hyperplasia and endometrial
polyps, while there is only one type of malignant endometrial
lesions (endometrial carcinoma).
For immunohistochemical examination, samples
obtained during surgery were paraffin-embedded and sectioned (3–4
µm) prior to immunohistochemical staining using mouse anti-human
cluster of differentiation (CD)34 monoclonal antibody (dilution
1:10,000; cat. no. QBEnd/10; Heilongjiang Saishang Technology and
Development Co., Harbin, China). Brown staining of the vascular
endothelial cell cytoplasm was considered indicative of
CD34-positivity. The standard Weidner's method (11) was used for microvessel counting and
the mean count was considered as the MVD value in each sample.
Statistical analyses
The SPSS version 17.0 software package (SPSS, Inc.,
Chicago, IL, USA) was used for data analysis. The data are
expressed as the mean ± standard deviation. Continuous quantitative
variables were compared using an analysis of variance or Student's
t-test. The cut-off values for the diagnosis were obtained from the
receiver operating characteristic (ROC) curve. Correlations were
calculated using Pearson's χ2 test. P<0.05 was
considered to indicate a statistically significant difference.
Results
TIC parameters
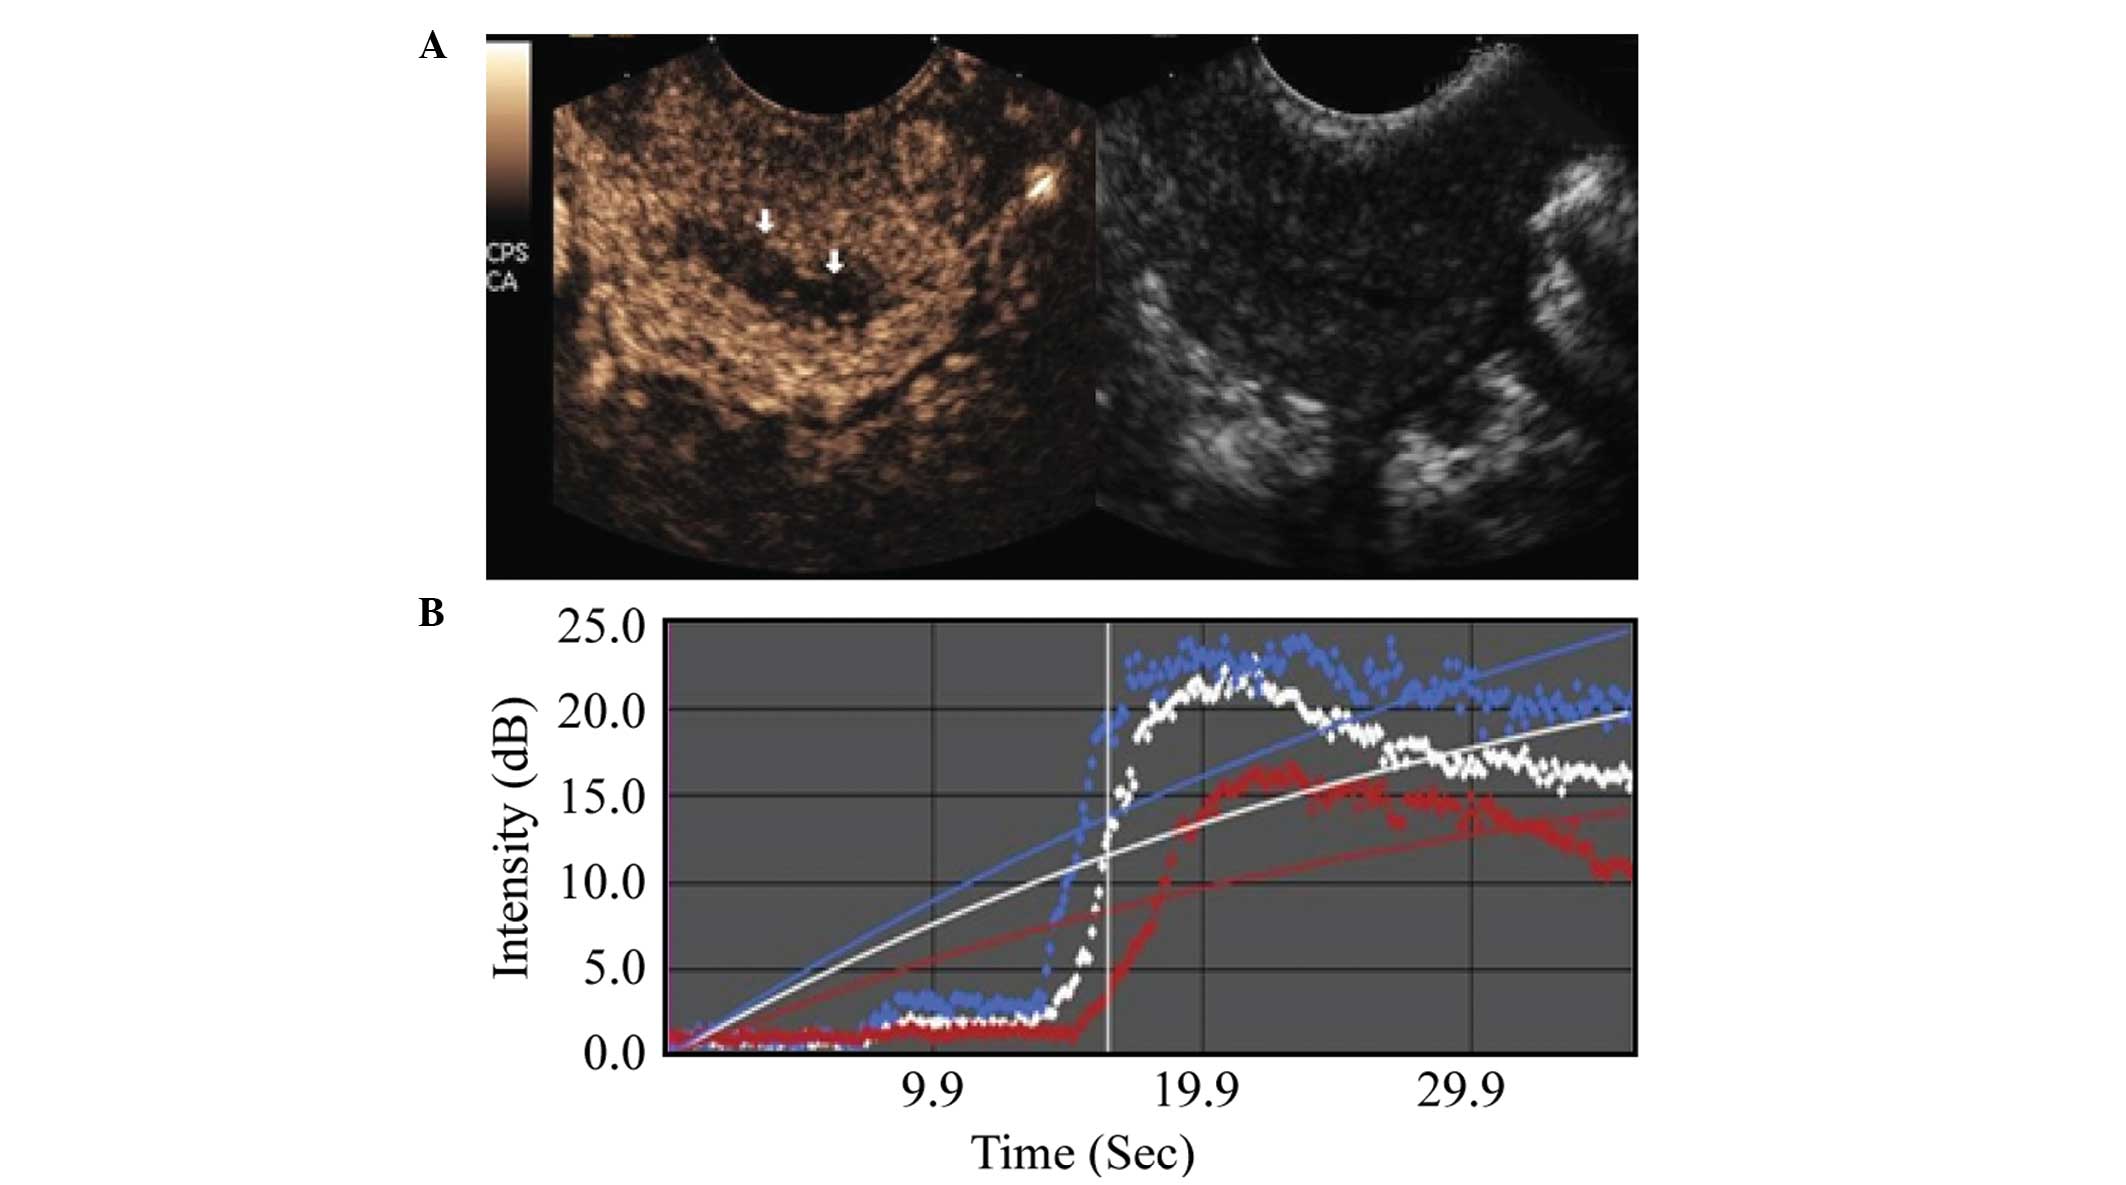
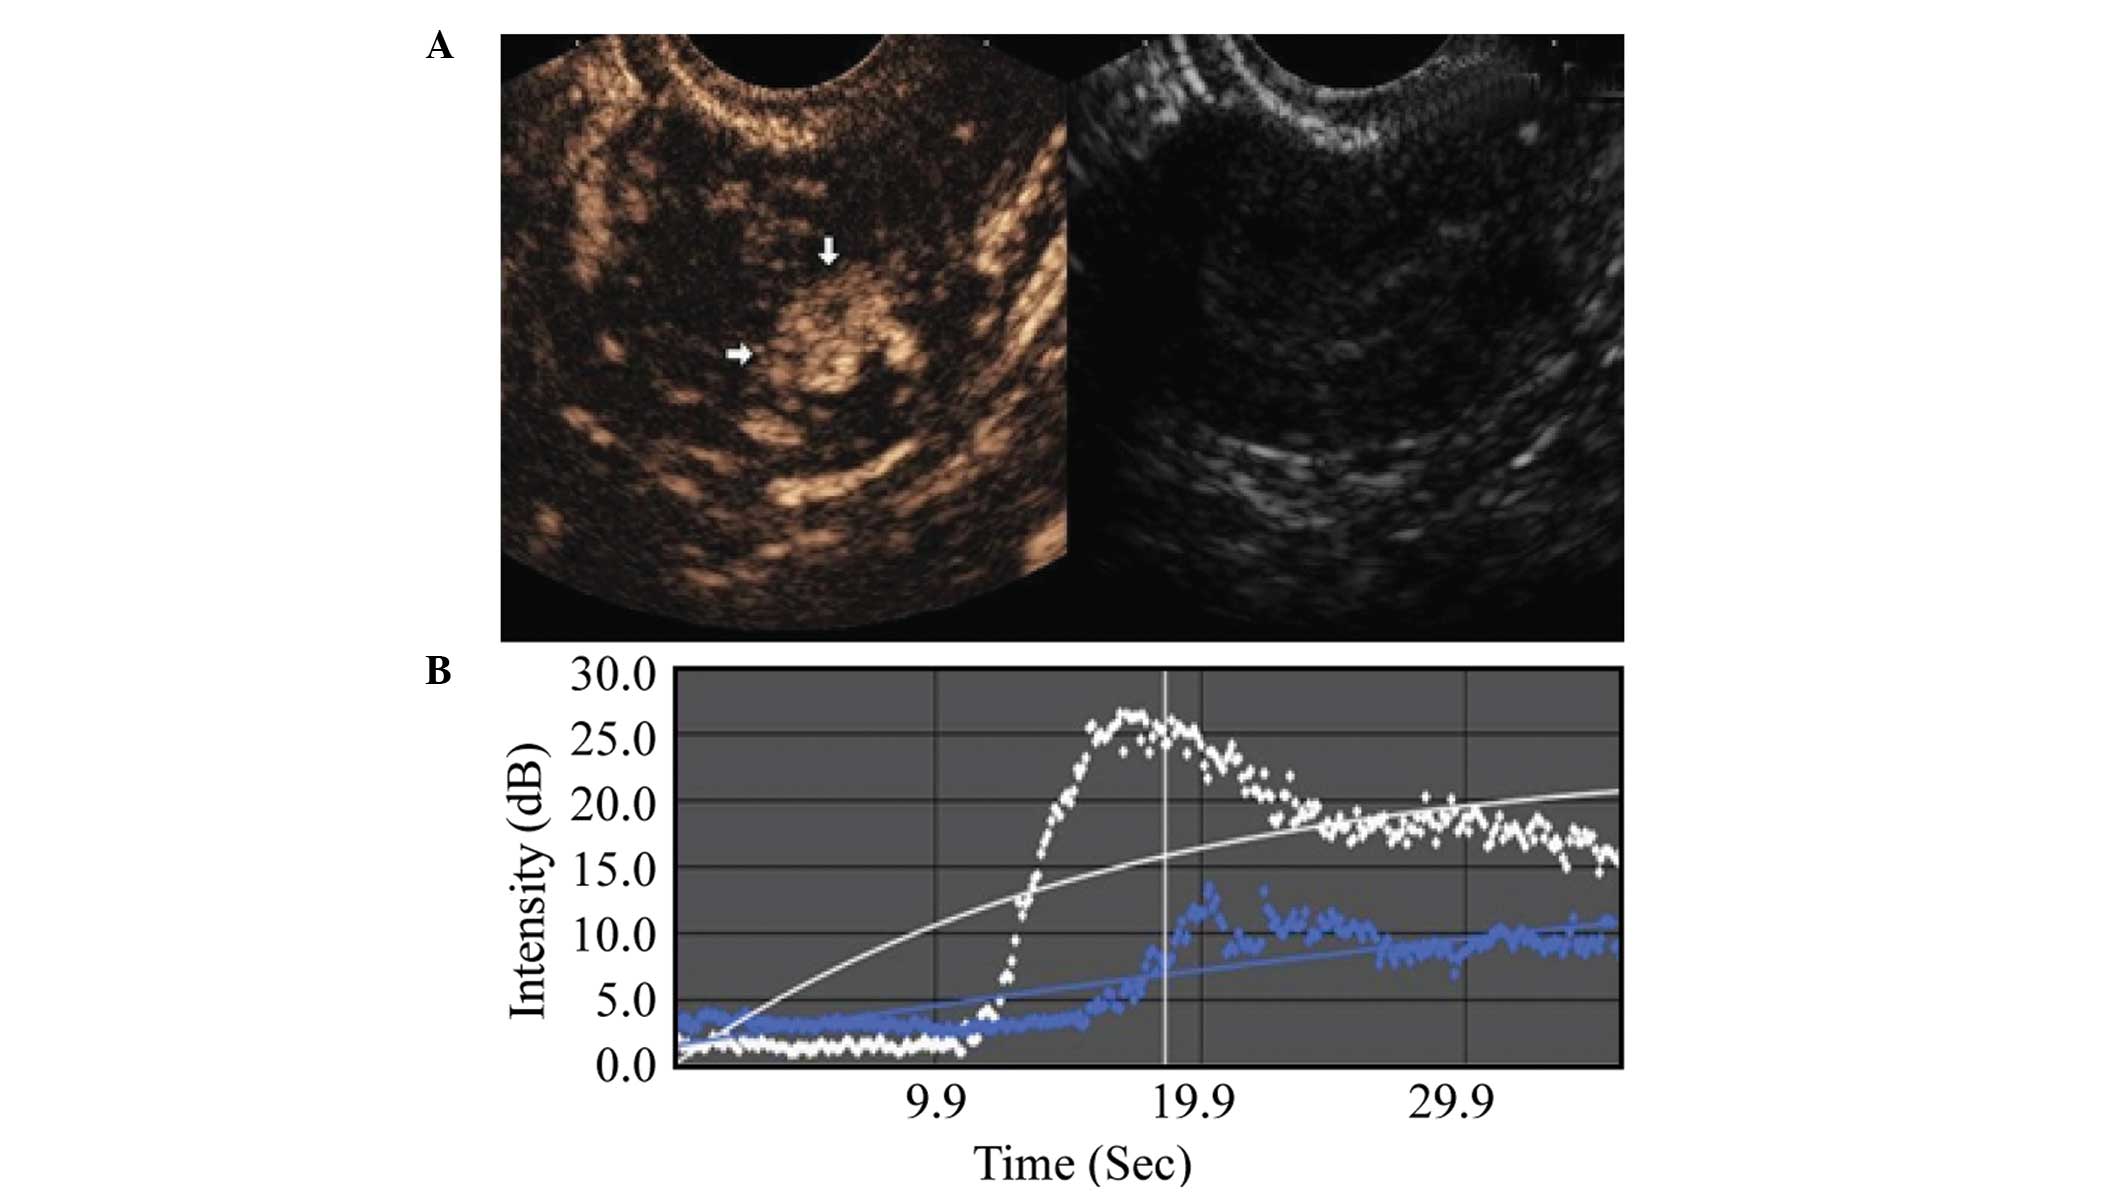
Comparison between the malignant and benign lesion
groups showed that the malignant lesion regions exhibited an
earlier AT, shorter RT, shorter TTP, higher PI, higher EI, as well
as a shorter washout and clearance half-time during the imaging
examination. These differences were statistically significant
(P<0.001), as shown in Table I,
and in Figs. 2 and 3.
 | Table I.Comparison of contrast-enhanced
ultrasonography time-intensity curve parameters between the
malignant and benign endometrial lesion groups. |
Table I.
Comparison of contrast-enhanced
ultrasonography time-intensity curve parameters between the
malignant and benign endometrial lesion groups.
| Curve parameters | Endometrial neoplasms
(n=49) | Endometrial
hyperplasia (n=49) | T-value | P-value |
|---|
| BI, dB | 8.77±0.93 | 8.54±0.71 | 1.2985 | >0.05 |
| PI, dB | 33.82±3.17 | 26.80±2.39 | 11.7351 | <0.001 |
| EI, dB | 25.05±3.19 | 18.25±2.57 | 11.0536 | <0.001 |
| AT, sec | 11.79±1.47 | 13.08±1.24 | 4.5025 | <0.001 |
| TTP, sec | 23.76±2.39 | 28.56±3.59 | 7.6105 | <0.001 |
| RT, sec | 11.96±2.76 | 15.48±3.39 | 5.4589 | <0.001 |
| Washout half-time,
sec | 71.26±4.41 | 79.38±6.27 | 7.2180 | <0.001 |
| Clearance half-time,
sec | 83.22±5.05 | 94.86±7.54 | 8.7532 | <0.001 |
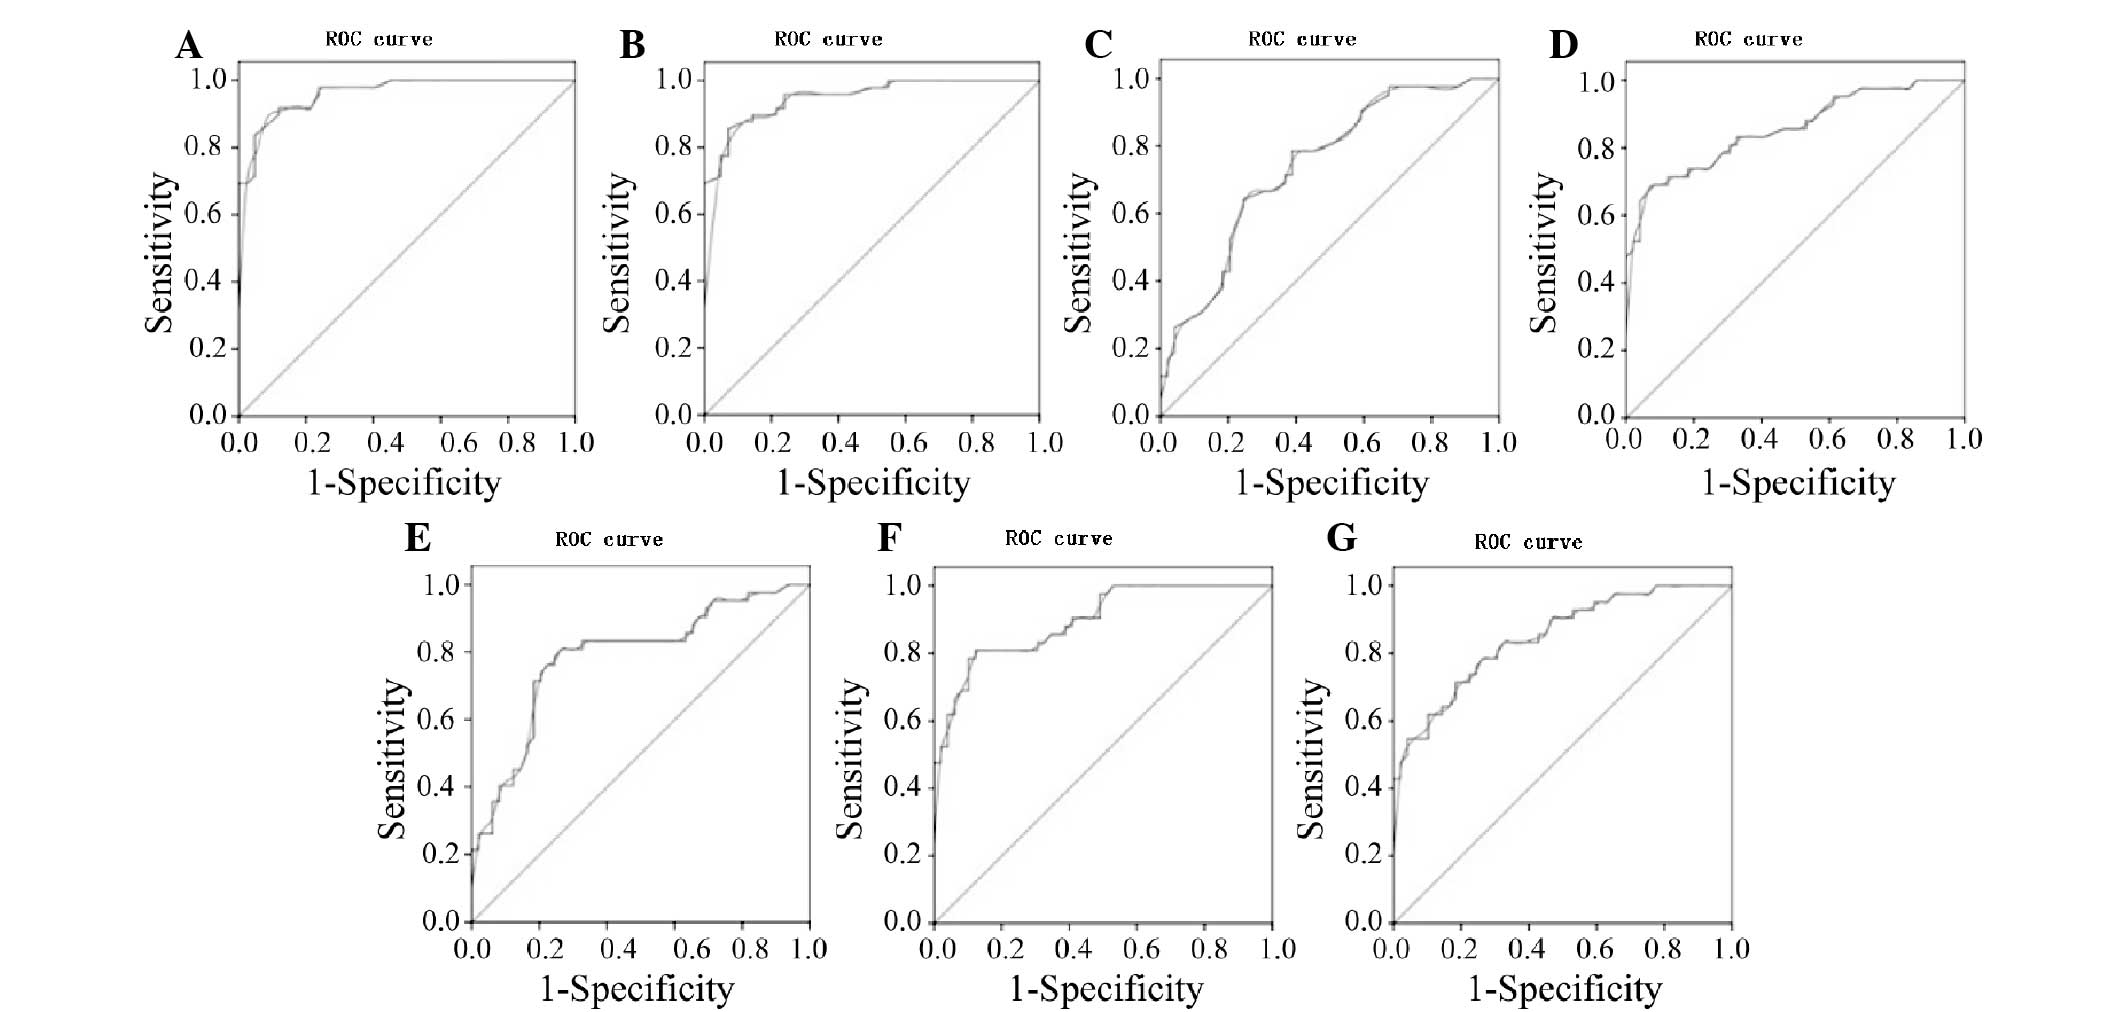
Analysis of ROC curve
A ROC curve analysis was used to determine the
diagnostic values of all the TIC parameters obtained during the
ultrasound for the benign and malignant endometrial lesion groups,
as shown in Fig. 4. A comparative
analysis of the AUC in the two groups showed an AUC for BI of 0.5,
which was not statistically significant. The AUCs for the PI and EI
parameters were relatively high (0.963 and 0.951, respectively),
while the other parameters showed some degree of accuracy.
The maximum sum of the sensitivity and specificity
was chosen as the critical value. According to the ROC curve, the
PI, EI, AT, PT, RT, washout half-time and clearance half-time
values of the endometrial malignant lesions were 29.2 dB, 21.35 dB,
12.75 sec, 26.75 sec, 13.2 sec, 89.3 sec and 75.45 sec,
respectively. The PI and EI of the lesions were equal to or greater
than the cut-off values, whereas the corresponding AT, PT, RT,
washout half-time and clearance half-time were equal to or less
than the cut-off values, suggesting malignancy. Diagnosis rates are
summarized in Table II.
| Table II.Sensitivities and specificities of the
receiver operating characteristic curve between benign and
malignant endometrial lesion groups. |
Table II.
Sensitivities and specificities of the
receiver operating characteristic curve between benign and
malignant endometrial lesion groups.
| Parameter | PI | EI | AT | TTP | RT | Clearance
half-time | Washout
half-time |
|---|
| AUC | 0.963 | 0.951 | 0.741 | 0.855 | 0.787 | 0.896 | 0.848 |
| Sensitivity | 0.918 | 0.857 | 0.643 | 0.714 | 0.810 | 0.786 | 0.714 |
| Specificity | 0.881 | 0.929 | 0.755 | 0.878 | 0.735 | 0.898 | 0.816 |
| Critical value | 29.2a | 21.35a | 12.75b | 26.75b | 13.2b | 89.3b | 75.45b |
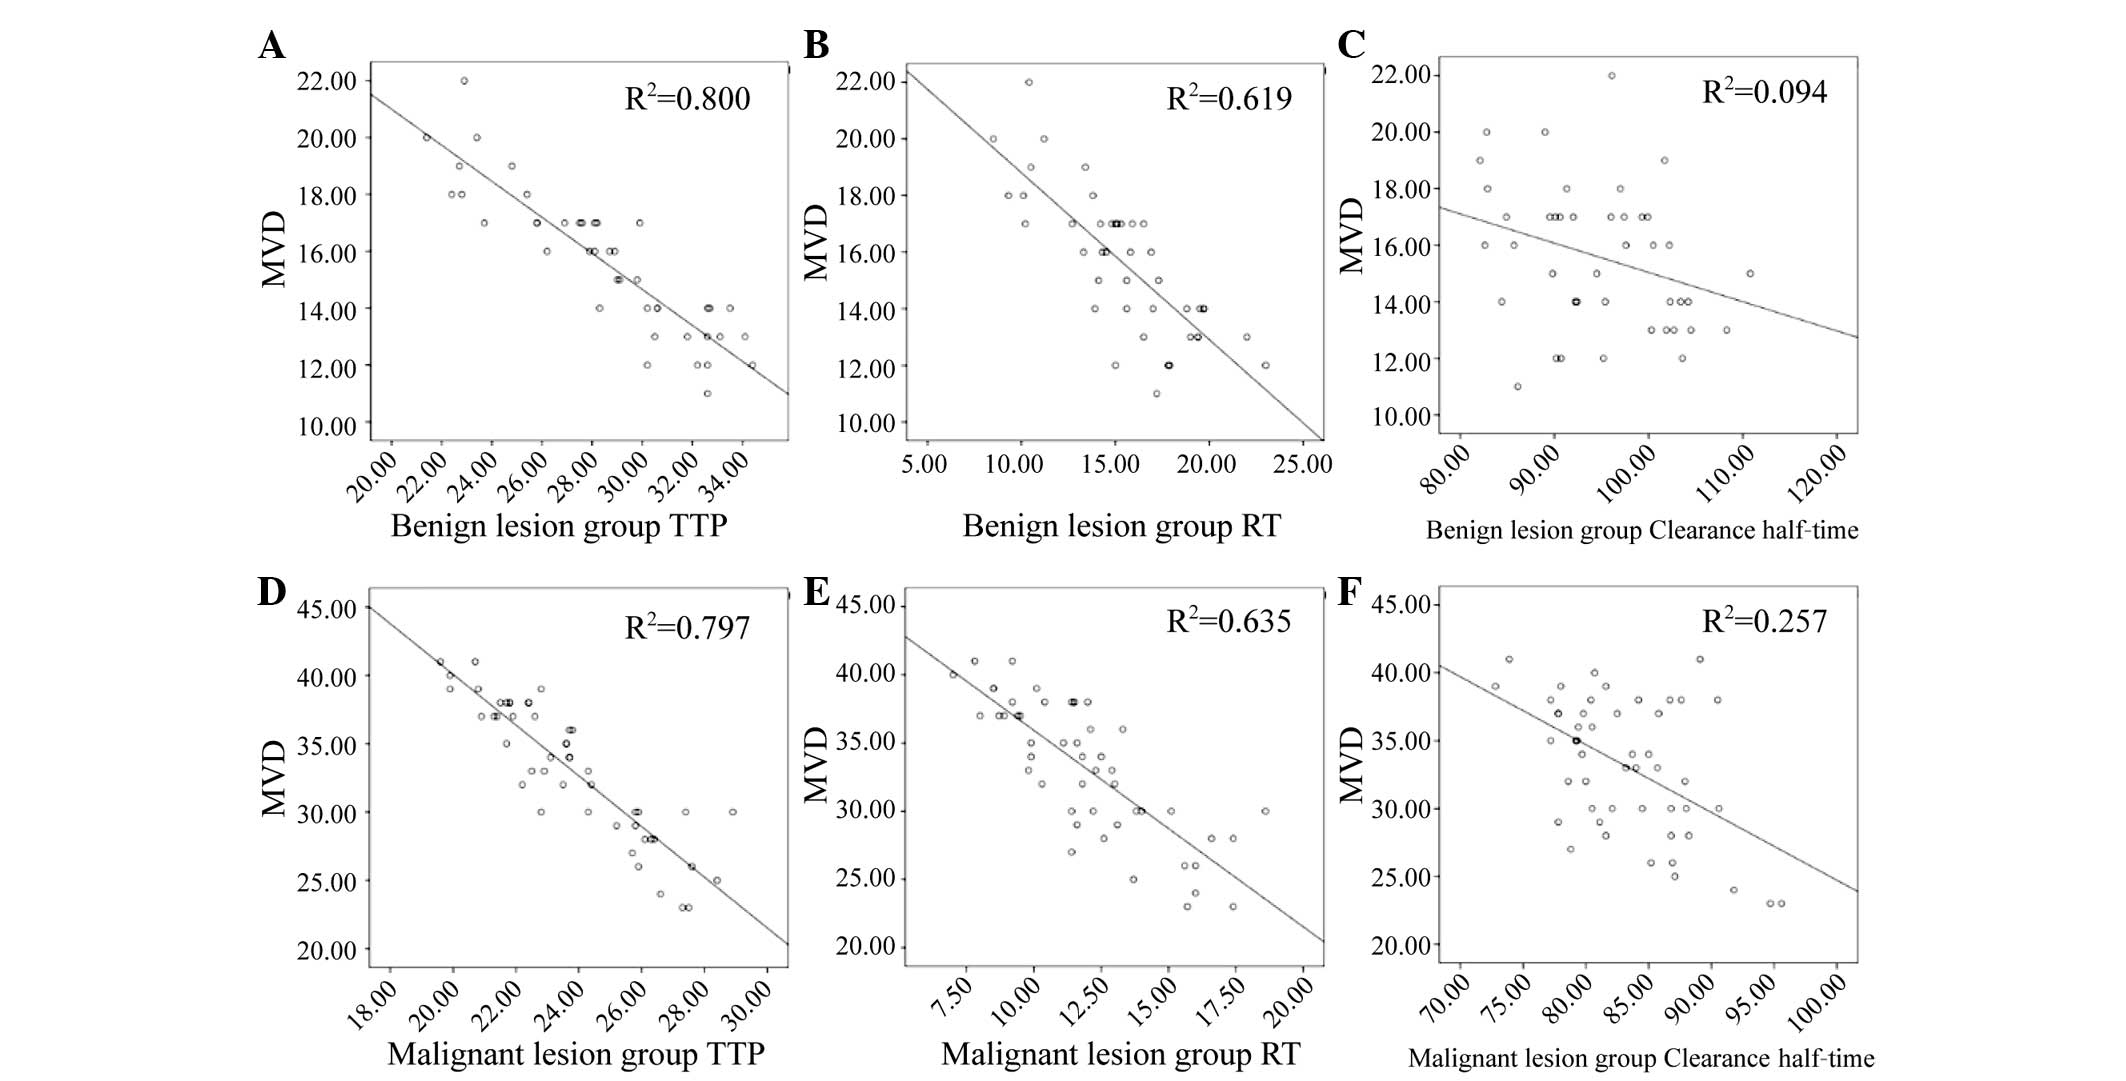
Correlation between ultrasound TIC and
MVD immunohistochemistry results
The MVD in benign and malignant lesions was examined
using immunohistochemical staining. The MVD in the malignant group
was significantly higher (33.10±4.98) than that in the benign group
(15.57±2.54) (P<0.01).
In the two groups, AT, RT and clearance half-time
were negatively correlated with MVD (Table III), i.e., the higher the MVD, the
lower the values of AT, RT and clearance half-time (Fig. 5A-F).
| Table III.Time-intensity curve parameters
correlated with MVD for the benign and malignant lesion groups. |
Table III.
Time-intensity curve parameters
correlated with MVD for the benign and malignant lesion groups.
|
|
| BI | PI | EI | AT | TTP | RT | Washout
half-time | Clearance
half-time |
|---|
|
|
|
|
|
|
|
|
|
|
|
|---|
| Group | MVD | r | P-value | r | P-value | r | P-value | r | P-value | r | P-value | r | P-value | r | P-value | r | P-value |
|---|
| Benign | 15.57±2.54 | −0.08 | >0.05 | 0.18 | >0.05 | 0.19 | >0.05 | −0.24 | >0.05 | −0.87 | <0.05 | −0.76 | <0.05 |
0.05 | >0.05 | −0.31 | <0.05 |
| Malignant | 33.10±4.98 | −0.09 | >0.05 | 0.06 | >0.05 | 0.08 | >0.05 |
0.05 | >0.05 | −0.89 | <0.05 | −0.79 | <0.05 | −0.08 | >0.05 | −0.51 | <0.05 |
Discussion
In recent years, the rapid development of CEUS
technology has enriched the evaluation parameters of ultrasound
images and greatly improved the quality of ultrasound diagnoses
(12). Additionally, a new generation
of contrast agents has allowed the highly accurate detection of
blood vessels and the quantitative analysis of blood perfusion
(13).
US has been widely used in the diagnosis of numerous
diseases (14). The most important
application of CEUS has been in the diagnosis of all types of
benign and malignant tumors. Currently, the most advanced and
widespread application of CEUS is in the diagnosis and
identification of benign and malignant liver lesions (15), but its application in the diagnosis of
lesions in other organs has not been widely studied (16). However, preliminary and satisfactory
advances have been made in the study of tumors of the pancreas,
kidneys, prostate, female reproductive organs, breasts, glands and
thyroid.
The application of CEUS in gynecology has become
widespread (17) and mainly includes
studies of ovarian tumor morphology and TIC parameters, and the
differential diagnosis of leiomyoma and adenomyosis (18). Testa et al evaluated the
results of CEUS and compared them with those of the pathological
examination in 24 patients with cervical cancer (19). The results showed that among 19 cases
with invasive cervical cancer, no abnormalities were detected by
regular ultrasound in 9 cases, whereas an enlarged cervix or a
cervical tumor with unclear boundaries was observed in 10 cases. By
contrast, CEUS has revealed a highly homogeneous or heterogeneous
enhancement during the early phase, low enhancement during the late
phase, and blurry boundaries between the lesion and surrounding
tissues (20). This means that CEUS
was able to show abnormal blood flow signals within the lesion
area, enhance the echo differences between the lesion area and the
surrounding tissues, and clearly identify the lesion range,
location and boundaries, facilitating the diagnosis of cervical
cancer (21). In addition, CEUS was
also able to evaluate the extent of infiltration, and as such, it
may provide valuable information for clinical staging and treatment
planning (22).
The present study applied CEUS-CPS technology not
only to visually inspect gray-scale dynamic images of benign and
malignant tumors to provide a preliminary qualitative diagnosis,
but also to quantitatively analyze their TICs. CEUS represents an
objective method to aid the differential diagnosis of benign and
malignant endometrial tumors (23).
The present results showed that the TIC of endometrial malignancy
revealed an early and quick enhancement during the initial phase,
as evidenced by its steepness, sharpness and high magnitude of
peaks, and decreased unidirectionally during the later phase
(24). The overall TIC displayed a
quick rise-quick decline profile, with a short AT and PT, high EI,
and short washout and clearance half-times. By contrast, the TIC of
benign endometrial lesions increased slowly showing blunt peaks
during the initial phase and declined slowly during the later phase
(25). The overall curve had a slow
rise-slow decline profile, with longer AT and PT, lower EI, and
longer washout and clearance half-times, compared with the
endometrial malignancy TIC. Comparison of the TIC parameters
between malignant and benign endometrial lesions showed that
differences observed in the time parameters (AT, PT, RT, and
washout and clearance half-times) and the intensity parameters (PI
and EI) between the two groups were statistically significant.
The present study also compared and analyzed the
diagnostic capacity of all the time and intensity parameters using
ROC curve analysis (26). ROC uses
the false-positive rate (1-specificity) as the x-axis, and
sensitivity as the y-axis, to generate the curve. With this
configuration, clinical diagnostic accuracy and treatment efficacy
can be evaluated. It is statistically simple, quick and
straightforward for evaluating diagnostic tests (27). Meanwhile, the best cut-off can also be
calculated according to the ROC. In this study, the TIC ROC of
benign and malignant lesions showed that all the parameters had
middle-level diagnostics capacity, and therefore showed certain
values when differentiating between the benign and malignant
endometrial lesions. Overall, PI and EI were more consistent with
the truth.
Several intermediate steps occur during the
transformation of a benign lesion into a well-differentiated
endometrial cancer (28), with
malignant lesions usually being highly vascularized. CEUS can
detect the formation of new blood vessels during tumor
angiogenesis, thus predicting blood vessel changes within tumor
tissues prior to morphological changes occurring (29). Moreover, the accurate detection of
microvessel changes using CEUS aids the early diagnosis of
endometrial carcinoma, with improved sensitivity and specificity.
Therefore, the CEUS-TIC can quantitatively and indirectly evaluate
tumor angiogenesis in vivo. In addition, a correlation
between the TIC and MVD of benign and malignant endometrial lesions
can be used to differentiate between tumor benignity and malignancy
prior to surgery, to evaluate the degree of tumor differentiation
and to predict prognosis in endometrial carcinoma patients. Having
this knowledge assists the medical team in developing a sounder
personal treatment plan that fits the individual patient. To date,
there have not been enough studies that have examined the
correlation between CEUS results and MVD in patients with
endometrial diseases (30). The
present study found distinct differences in MVD between benign and
malignant lesions, i.e., MVD was significantly higher in malignant
lesions than in benign lesions (31).
As MVD is closely correlated with blood supply in the lesion area,
an enhanced MVD indicates an increase in the blood supply to a
malignant lesion (32). In the benign
and malignant endometrial lesion groups, the AT, RT and clearance
half-time were all negatively correlated with MVD, i.e., the higher
the MVD, the shorter the AT, RT and clearance half-time.
In summary, the present CEUS results reflected the
characteristics of the blood circulation relevant to benign and
malignant endometrial lesions. Moreover, analysis of the
enhancement and clearance of the contrast agent aided in the
differentiation between benign and malignant lesions within the
endometrium. Therefore, CEUS-TIC can be used to quantitatively
analyze the intake and washout of the contrast agent in the lesion
area, and to differentially diagnose benign and malignant
endometrial lesions by determining the TIC parameters. Furthermore,
the PT, RT and clearance half-time on the CEUS-TIC demonstrated a
clear correlation with the MVD immunohistochemistry results. Hence,
as CEUS may indirectly reflect the angiogenesis process within the
lesion, it may provide a novel method for the pre-operative
differentiation of benign and malignant lesions.
References
|
1
|
Correas JM, Bridal L, Lesavre A, Méjean A,
Claudon M and Hélénon O: Ultrasound contrast agents: Properties,
principles of action, tolerance and artifacts. Eur Radiol.
11:1316–1328. 2001. View Article : Google Scholar : PubMed/NCBI
|
|
2
|
Dong XQ, Shen Y, Xu LW, Xu CM, Bi W and
Wang XM: Contrast-enhanced ultrasound for detection and diagnosis
of renal clear cell carcinoma. Chin Med J (Engl). 122:1179–1183.
2009.PubMed/NCBI
|
|
3
|
Lang SA, Moser C, Gehmert S, Pfister K,
Hackl C, Schnitzbauer AA, Stroszczynski C, Schlitt HJ, Geissler EK
and Jung EM: Contrast-enhanced ultrasound (CEUS) detects effects of
vascular disrupting therapy in an experimental model of gastric
cancer. Clin Hemorheol Microcirc. 56:287–299. 2014.PubMed/NCBI
|
|
4
|
Wei X, Li Y, Zhang S, Li X, Wang H, Yong
X, Wang X, Li X and Gao M: Evaluation of microvascularization in
focal salivary gland lesions by contrast-enhanced ultrasonography
(CEUS) and Color Doppler sonography. Clin Hemorheol Microcirc.
54:259–271. 2013.PubMed/NCBI
|
|
5
|
Kearor CS, Lindner JR, Belcik JT, Bishop
CV and Slayden OD: Contrast-enhanced ultrasound reveals real-time
spatial changes in vascular perfusion during early implantation in
the macaque uterus. Fertil Steril. 95:1316–1321.e1-3. 2011.
View Article : Google Scholar : PubMed/NCBI
|
|
6
|
Liu Y, Tian JW, Xu Y and Cheng W: Role of
transvaginal contrast-enhanced ultrasound in the early diagnosis of
endometrial carcinoma. Chin Med J (Engl). 125:416–421.
2012.PubMed/NCBI
|
|
7
|
Fellner C, Prantl L, Rennert J,
Stroszczynski C and Jung EM: Comparison of
time-intensity-curve-(TIC-) analysis of contrast-enhanced
ultrasound (CEUS) and dynamic contrast-enhanced (DCE) MRI for
postoperative control of microcirculation in free flaps-first
results and critical comments. Clin Hemorheol Microcirc.
48:187–198. 2011.PubMed/NCBI
|
|
8
|
Geis S, Gehmert S, Lamby P, Zellner J,
Pfeifer C, Prantl L and Jung EM: Contrast enhanced ultrasound
(CEUS) and time intensity curve (TIC) analysis in compartment
syndrome: First results. Clin Hemorheol Microcirc. 50:1–11.
2012.PubMed/NCBI
|
|
9
|
Wang Y, Li L, Wang YX, Cui NY, Zou SM,
Zhou CW and Jiang YX: Time-intensity curve parameters in rectal
cancer measured using endorectal ultrasonography with sterile
coupling gels filling the rectum: Correlations with tumor
angiogenesis and clinicopathological features. Biomed Res Int.
2014:5878062014. View Article : Google Scholar : PubMed/NCBI
|
|
10
|
Pecorelli S: Revised FIGO staging for
carcinoma of the vulva, cervix, and endometrium. International Int
J Gynaecol Obstet. 105:103–104. 2009. View Article : Google Scholar
|
|
11
|
Weidner N, Semple JP, Welch WR and Folkman
J: Tumor angiogenesis and metastasis-correlation in invasive breast
carcinoma. N Engl J Med. 324:1–8. 1991. View Article : Google Scholar : PubMed/NCBI
|
|
12
|
Fischerova D: Ultrasound scanning of the
pelvis and abdomen for staging of gynecological tumors: A review.
Ultrasound Obstet Gynecol. 38:246–266. 2011. View Article : Google Scholar : PubMed/NCBI
|
|
13
|
Steppan I, Reimer D, Müller-Holzner E,
Marth C, Aigner F, Frauscher F, Frede T and Zeimet AG: Breast
cancer in women: Evaluation of benign and malignant a axillary
lymph nodes with contrast-enhanced ultrasound. Ultraschall Med.
31:63–67. 2010.(In English, German). View Article : Google Scholar : PubMed/NCBI
|
|
14
|
Xu HX: Contrast-enhanced ultrasound: The
evolving applications. World J Radiol. 1:15–24. 2009. View Article : Google Scholar : PubMed/NCBI
|
|
15
|
Claudon M, Dietrich CF, Choi BI, Cosgrove
DO, Kudo M, Nolsøe CP, Piscaglia F, Wilson SR, Barr RG, Chammas MC,
et al: Guidelines and good clinical practice recommendations for
contrast enhanced ultrasound (CEUS) in the liver-update 2012: A
WFUMB-EFSUMB initiative in cooperation with representatives of
AFSUMB, AIUM, ASUM, FLAUS and ICUS. Ultrasound Med Biol.
39:187–210. 2013. View Article : Google Scholar : PubMed/NCBI
|
|
16
|
Cosgrove D and Lassau N: Imaging of
perfusion using ultrasound. Eur J Nucl Med Mol Imaging. 37(Suppl
1): S65–S85. 2010. View Article : Google Scholar : PubMed/NCBI
|
|
17
|
Poret-Bazin H, Simon EG, Bleuzen A,
Dujardin PA, Patat F and Perrotin F: Decrease of uteroplacental
blood flow after feticide during second-trimester pregnancy
termination with complete placenta previa: Quantitative analysis
using contrast-enhanced ultrasound imaging. Placenta. 34:1113–1115.
2013. View Article : Google Scholar : PubMed/NCBI
|
|
18
|
Dutta S, Wang FQ, Fleischer AC and Fishman
DA: New frontiers for ovarian cancer risk evaluation: Proteomics
and contrast-enhanced ultrasound. AJR Am J Roentgenol. 194:349–354.
2010. View Article : Google Scholar : PubMed/NCBI
|
|
19
|
Testa AC, Ferrandina G, Fruscella E, Van
Holsbeke C, Ferrazzi E, Leone FP, Arduini D, Exacoustos C, Bokor D,
Scambia G and Timmerman D: The use of contrasted transvaginal
sonography in the diagnosis of gynecologic diseases: A preliminary
study. J Ultrasound Med. 24:1267–1278. 2005.PubMed/NCBI
|
|
20
|
Balleyguier C, Opolon P, Mathieu MC,
Athanasiou A, Garbay JR, Delaloge S and Dromain C: New potential
and applications of contrast-enhanced ultrasound of the breast: Own
investigations and review of the literature. Eur J Radiol.
69:14–23. 2009. View Article : Google Scholar : PubMed/NCBI
|
|
21
|
Xiang H, Huang R, Cheng J, Gulinaer S, Hu
R, Feng Y and Liu H: Value of three-dimensional contrast-enhanced
ultrasound in the diagnosis of small adnexal masses. Ultrasound Med
Biol. 39:761–768. 2013. View Article : Google Scholar : PubMed/NCBI
|
|
22
|
Zhang XL, Zheng RQ, Yang YB, Huang DM,
Song Q, Mao YJ, Li YH and Zheng ZJ: The use of contrast-enhanced
ultrasound in uterine leiomyomas. Chin Med J (Engl). 123:3095–3099.
2010.PubMed/NCBI
|
|
23
|
Zhu Y, Chen Y, Jiang J, Wang R, Zhou Y and
Zhang H: Contrast-enhanced harmonic ultrasonography for the
assessment of prostate cancer aggressiveness: A preliminary study.
Korean J Radiol. 11:75–83. 2010. View Article : Google Scholar : PubMed/NCBI
|
|
24
|
Arthuis CJ, Novell A, Escoffre JM, Patat
F, Bouakaz A and Perrotin F: New insight into uteroplacental
perfusion: Quantitative analysis using Doppler and
contrast-enhanced ultrasound imaging. Placenta. 34:424–431. 2013.
View Article : Google Scholar : PubMed/NCBI
|
|
25
|
Aoki S, Hattori R, Yamamoto T, Funahashi
Y, Matsukawa Y, Gotoh M, Yamada Y and Honda N: Contrast-enhanced
ultrasound using a time-intensity curve for the diagnosis of renal
cell carcinoma. BJU Int. 108:349–354. 2011. View Article : Google Scholar : PubMed/NCBI
|
|
26
|
Xu M, Xie XY, Liu GJ, Xu HX, Xu ZF, Huang
GL, Chen PF, Luo J and Lü MD: The application value of
contrast-enhanced ultrasound in the differential diagnosis of
pancreatic solid-cystic lesions. Eur J Radiol. 81:1432–1437. 2012.
View Article : Google Scholar : PubMed/NCBI
|
|
27
|
Salvatore V, Borghi A, Sagrini E, Galassi
M, Gianstefani A, Bolondi L and Piscaglia F: Quantification of
enhancement of focal liver lesions during contrast-enhanced
ultrasound (CEUS). Analysis of ten selected frames is more simple
but as reliable as the analysis of the entire loop for most
parameters. Eur J Radiol. 81:709–713. 2012. View Article : Google Scholar : PubMed/NCBI
|
|
28
|
Czekierdowski A, Czekierdowska S, Czuba B,
Cnota W, Sodowski K, Kotarski J and Zwirska-Korczala K: Microvessel
density assessment in benign and malignant endomerrial changes. J
Physiol Pharmacol. 59(Suppl 4): S45–S51. 2008.
|
|
29
|
Badea AF, Tamas-Szora A, Clichici S,
Socaciu M, Tăbăran AF, Băciut G, Cătoi C, Mureşan A, Buruian M and
Badea R: Contrast enhanced ultrasonography (CEUS) in the
characterization of tumor microcirculation. Validation of the
procedure in the animal experimental model. Med Ultrason. 15:85–94.
2013. View Article : Google Scholar : PubMed/NCBI
|
|
30
|
Shiyan L, Pintong H, Zongmin W, Fuguang H,
Zhiqiang Z, Yan Y and Cosgrove D: The relationship between enhanced
intensity and microvessel density of gastric carcinoma using double
contrast-enhanced ultrasonography. Ultrasound Med Biol.
35:1086–1091. 2009. View Article : Google Scholar : PubMed/NCBI
|
|
31
|
Wang J, Lv F, Fei X, Cui Q, Wang L, Gao X,
Yuan Z, Lin Q, Lv Y and Liu A: Study on the characteristics of
contrast-enhanced ultrasound and its utility in assessing the
microvessel density in ovarian tumors or tumor-like lesions. Int J
Biol Sci. 7:600–666. 2011. View Article : Google Scholar : PubMed/NCBI
|
|
32
|
Fleischer AC, Lyshchik A, Jones HW III,
Crispens MA, Andreotti RF, Williams PK and Fishman DA: Diagnostic
parameters to differentiate benign from malignant ovarian masses
with contrast-enhanced transvaginal sonography. J Ultrasound Med.
28:1273–1280. 2009.PubMed/NCBI
|