Introduction
Breast cancer is the most common malignancy among
women worldwide (1), with an
intrinsically heterogeneous etiology, but similar clinical
manifestations in the majority of cases (2). A number of studies have reported that
genetic and environmental factors contribute to breast cancer
pathogenesis and progression (3–5). For
example, several proliferation and oncogenic genes, including
breast cancer (BRCA) 1, BRCA2, MYC, tumor
protein 53, retinoblastoma 1, JUN, cyclin-dependent kinase
inhibitor 2A, human epidermal growth factor receptor 2-neu, cyclin
D1 and cyclin E, have been identified in breast cancer (6–8).
Therefore, genetic and molecular screening of patients has been
proposed as useful to predict disease behavior, response to
anti-cancer therapeutics and patient survival (9,10).
A growing body of evidence has revealed that
abnormalities at certain chromosomal positions lead to various
tumor behaviors, including progression, resistance to chemotherapy
and spread to other organs (11–13).
Dellas et al (11) suggested
that aberrations in chromosomes 11p and 18q may be associated with
poor prognosis and progression of ductal breast cancer. In
addition, Horlings et al (13)
reported a strong correlation between genomic differences and
various gene expression signatures leading to poor prognosis in
breast cancer. Furthermore, it has been reported that aberrations
in chromosome 8q may be associated with resistance to chemotherapy
in breast cancer (14).
Association of the 8q22-24 position, containing WNT1
inducible signaling pathway protein 1 (WISP1), exostosin
glycosyltransferase 1 (EXT1), ATPase family, AAA domain
containing 2 (ATAD2), TSP-like 5 (TSPYL5), metadherin
(MTDH) and cyclin E2 (CCNE2) genes, with breast
cancer and other carcinomas has been proposed by numerous
investigators using varied molecular approaches, including genome
wide association study, array-comparative genomic hybridization and
gene expression profiling methods (13–17).
However, existing data are conflicting. By way of example,
WISP1, a member of the CCN family, has shown contradictory
functions in the context of cancer (17–20).
Davies et al (19) suggested
varying prognostic values for the CCN family members, including
WISP1, WISP2 and WISP3, in human breast
cancer; WISP1 was observed to be a tumor suppressor,
WISP2 was a stimulator of tumor aggressiveness and
WISP3 remained undefined regarding a beneficial or
detrimental role. However, in another investigation, contrasting
roles were observed for WISP1 and WISP2 in human
colorectal cancer (20); WISP1
appeared to be a stimulator of tumor aggressiveness and
WISP2 was characterized as a tumor suppressor.
There have been few studies on the role of 8q22-24
genes in the pathogenesis of breast cancer. Overexpression of
ATAD2 has been reported to drive survival of breast cancer
cells, resulting in a poor prognosis (21). Inhibition of MTDH has been
demonstrated to sensitize breast cancer cells to anti-cancer agents
(22,23). The TSPYL5 gene has been
suggested to have a causative role in breast tumorigenesis
(24). The CCNE2 gene has been
demonstrated to have a role in the invasiveness of breast cancer
cells (25). To the best of our
knowledge, there have been no investigations into the role of
EXT1 in the pathogenesis of breast carcinoma.
The present study performed an investigation into
the expression patterns of EXT1, WISP1, ATAD2,
TSPYL5, MTDH and CCNE2 genes, and compared
them between metastatic and non-metastatic breast cancer in order
to examine their potential as prognostic markers for the risk of
metastasis in humans.
Materials and methods
Patients and tumor samples
This retrospective study primarily included 1705
breast tumor samples obtained from the Bio Bank of the Cancer
Research Center of Shahid Beheshti University of Medical Sciences
(Tehran, Iran). The tissues were taken from breast cancer patients
who underwent either breast-conserving surgery or modified radical
mastectomy at Khatam-Ol-Anbia Specialty and Subspecialty Hospital
of Tehran (Tehran, Iran) between August 2002 and December 2012.
Only estrogen receptor (ER)-positive, lymph-node negative tumors
with tumors stages I and II and tumor size <5 cm were analyzed.
The patients were divided into metastatic and non-metastatic groups
based on a 5-year follow-up period following the curative surgery.
Demographic features and clinical data of the patients were
collected. In addition, 15 matched normal breast tissues, taken
from volunteer healthy women who underwent mammoplasty between June
2012 and April 2013, were used as control. Patients had previously
signed an informed consent on the prospective use of their specimen
for study purposes. The study procedure and use of clinical
information of the patients was approved by the ethical committee
of Shahid Beheshti University of Medical Sciences. In addition,
identity and personal information of all participants were not
disclosed at any stage of the study and/or following the study
conclusion.
RNA extraction
Total RNA was extracted from already
paraffin-embedded tumor samples and normal breast tissues using the
RNeasy FFPE kit (Qiagen GmbH, Hilden, Germany), according to the
manufacturer's protocol. Briefly, the paraffin was removed from
samples by xylene. Subsequently, sample lysis was performed by
proteinase K (Qiagen GmbH) digestion for 15 min, followed by
incubation at 80°C for 15 min. Following incubation, the genomic
DNA was effectively removed by DNase and DNase Booster Buffer
(Qiagen GmbH) treatment for 15 min. Finally, concentrated RNA was
purified using RNeasy MinElute spin columns (Qiagen GmbH) according
to the manufacturer's protocol, and eluted in a volume of 20 µl on
the QIAcube (Qiagen GmbH).
Complementary DNA (cDNA)
synthesis
The total RNA was directly converted to cDNA using
the RT2 PreAMP cDNA Synthesis kit (Qiagen GmbH), according to the
manufacturer's protocol. Briefly, 1 µl of total RNA was added to 9
µl of reverse-transcription mix and 10 µl of genomic DNA
elimination mix, and the final volume of 20 µl was subjected to
reverse transcription at 42°C for 30 min. The reaction was
terminated at 95°C for 5 min followed by a pause at 4°C (to remove
the microtubes), and then samples were preserved at −20°C until
use.
Quantitative polymerase chain reaction
(qPCR) assay
The mRNA copy numbers of EXT1, WISP1,
ATAD2, TSPYL5, MTDH, CCNE2 and
glyceraldehyde-3-phosphate dehydrogenase (GAPDH) genes were
measured by SYBR green-based qPCR using the respective specific
pairs of primers (Table I). All
reactions were performed in duplicate using the 7500 Fast Real-Time
PCR System (Applied Biosystems; Thermo Fisher Scientific, Inc.,
Waltham, MA, USA) and Takara Bio SYBR Premix Ex Taq (Tli RNase H
Plus) master mix (Takara Bio, Inc., Otsu, Japan), according to the
manufacturer's protocol, in a total reaction volume of 25 µl. The
thermal profile of the reaction was as follows: Initial
denaturation at 95°C for 30 sec, followed by 40 consecutive
two-step cycles of PCR (95°C for 5 sec and 60°C for 30 sec), and
termination in a dissociation stage (increasing the temperature
from 65 to 95°C, rising by 1°C each step, halting for 90 sec of
pre-melt conditioning on the first step and 5 sec for each
subsequent step). The cycling threshold values of the target genes
were normalized to that of GAPDH as an internal control and
relative gene expression was calculated by 2(−ΔΔCq)
method as follows (26): Relative
gene expression=2−ΔΔCq.
ΔΔCq=ΔCqcase-ΔCqcontrol.
ΔCq=Cqtarget-CqGAPDH.
 | Table I.Oligonucleotide sequences of the
primers used in the present study. |
Table I.
Oligonucleotide sequences of the
primers used in the present study.
| Primer | Sequence,
5′-3′ | Annealing
temperature, °C | Product length,
bp |
|---|
| EXT1 |
|
|
|
|
Forward |
5′-CTTCGTTCCTTGGGATCAAT-3′ | 55.42 | 95 |
|
Reverse |
5′-TGCCTTTGTAGATGCTGGAG-3′ | 57.59 |
|
| WISP1 |
|
|
|
|
Forward |
5′-CAAGGCTGGATAACAGCTCA-3′ | 57.59 | 87 |
|
Reverse |
5′-TTCCCAAATTGAGATGCAAA-3′ | 53.62 |
|
| ATAD2 |
|
|
|
|
Forward |
5′-CCAGACAGCAGGCTGATAAA-3′ | 57.59 | 137 |
|
Reverse |
5′-ACGCACTTCAACATCACCAT-3′ | 58.10 |
|
| TSPYL5 |
|
|
|
|
Forward |
5′-TGCACAAGTCTCCCTGCTAC-3′ | 59.68 | 87 |
|
Reverse |
5′-CAGAGGCCAACATGAAGAGA-3′ | 57.22 |
|
| MTDH |
|
|
|
|
Forward |
5′-TGCCGCCAATACTACAAGAG-3′ | 57.69 | 105 |
|
Reverse |
5′-GTTTGGGAGATTCCCAGCTA-3′ | 56.90 |
|
| CCNE2 |
|
|
|
|
Forward |
5′-CGGCCTATATATTGGGTTGG-3′ | 55.44 | 106 |
|
Reverse |
5′-ACGGCTACTTCGTCTTGACA-3′ | 59.04 |
|
| GAPDH |
|
|
|
|
Forward |
5′-ATGGAGAAGGCTGGGGCT-3′ | 60.29 | 125 |
|
Reverse |
5′-ATCTTGAGGCTGTTGTCATACTTCTC-3′ | 60.85 |
|
Statistical analysis
For statistical analysis, the χ2 or
Fisher's exact, Mann-Whitney U or independent t test, and analysis
of variance or Kruskal-Wallis (followed by post-hoc pairwise
comparisons) tests were performed using SPSS version 20 (IMB SPSS,
Armonk, NY, USA). In addition, associations between the variables
were examined by parametric Pearson and non-parametric Spearman's
correlation tests. GraphPad Prism 5 for Windows (GraphPad Software,
Inc., La Jolla, CA, USA) was used for development of the graphs.
P<0.05 was considered to represent a statistically significant
difference.
Results
Demographic characteristics
Out of 1,705 breast cancer patients registered in
the Bio Bank of the Cancer Research Center of Shahid Beheshti
University of Medical Sciences, a total of 312 patients were
identified with tumor stages I and II; only, 85 of them had at
least 5 years of follow-up records that were included for analysis.
A total of 15 of these patients presented with local recurrence or
metastasis during the 5 years following the curative surgery
(metastatic group) and 70 had not shown any sign of local
recurrence or metastasis (non-metastatic group). Therefore these 70
patients were selected and compared with the metastatic group. One
of the patients in the metastatic group was deceased at the time of
the study. As shown in Table II,
there were no significant differences observed between the
non-metastatic and metastatic groups for age (P=0.107), marital
status (P=0.201), history of pregnancy (P=0.561), childbirth
(P=0.561), abortion (P=0.378), type of abortion (P=0.545), smoking
(P=0.260), high-fat diet (P=0.464) and family history of breast
cancer (P=0.925). The mean age of the control group was 42.9±9.2
years. There were no significant differences between the mean age
of the control group and that of the non-metastatic (P=0.076) or
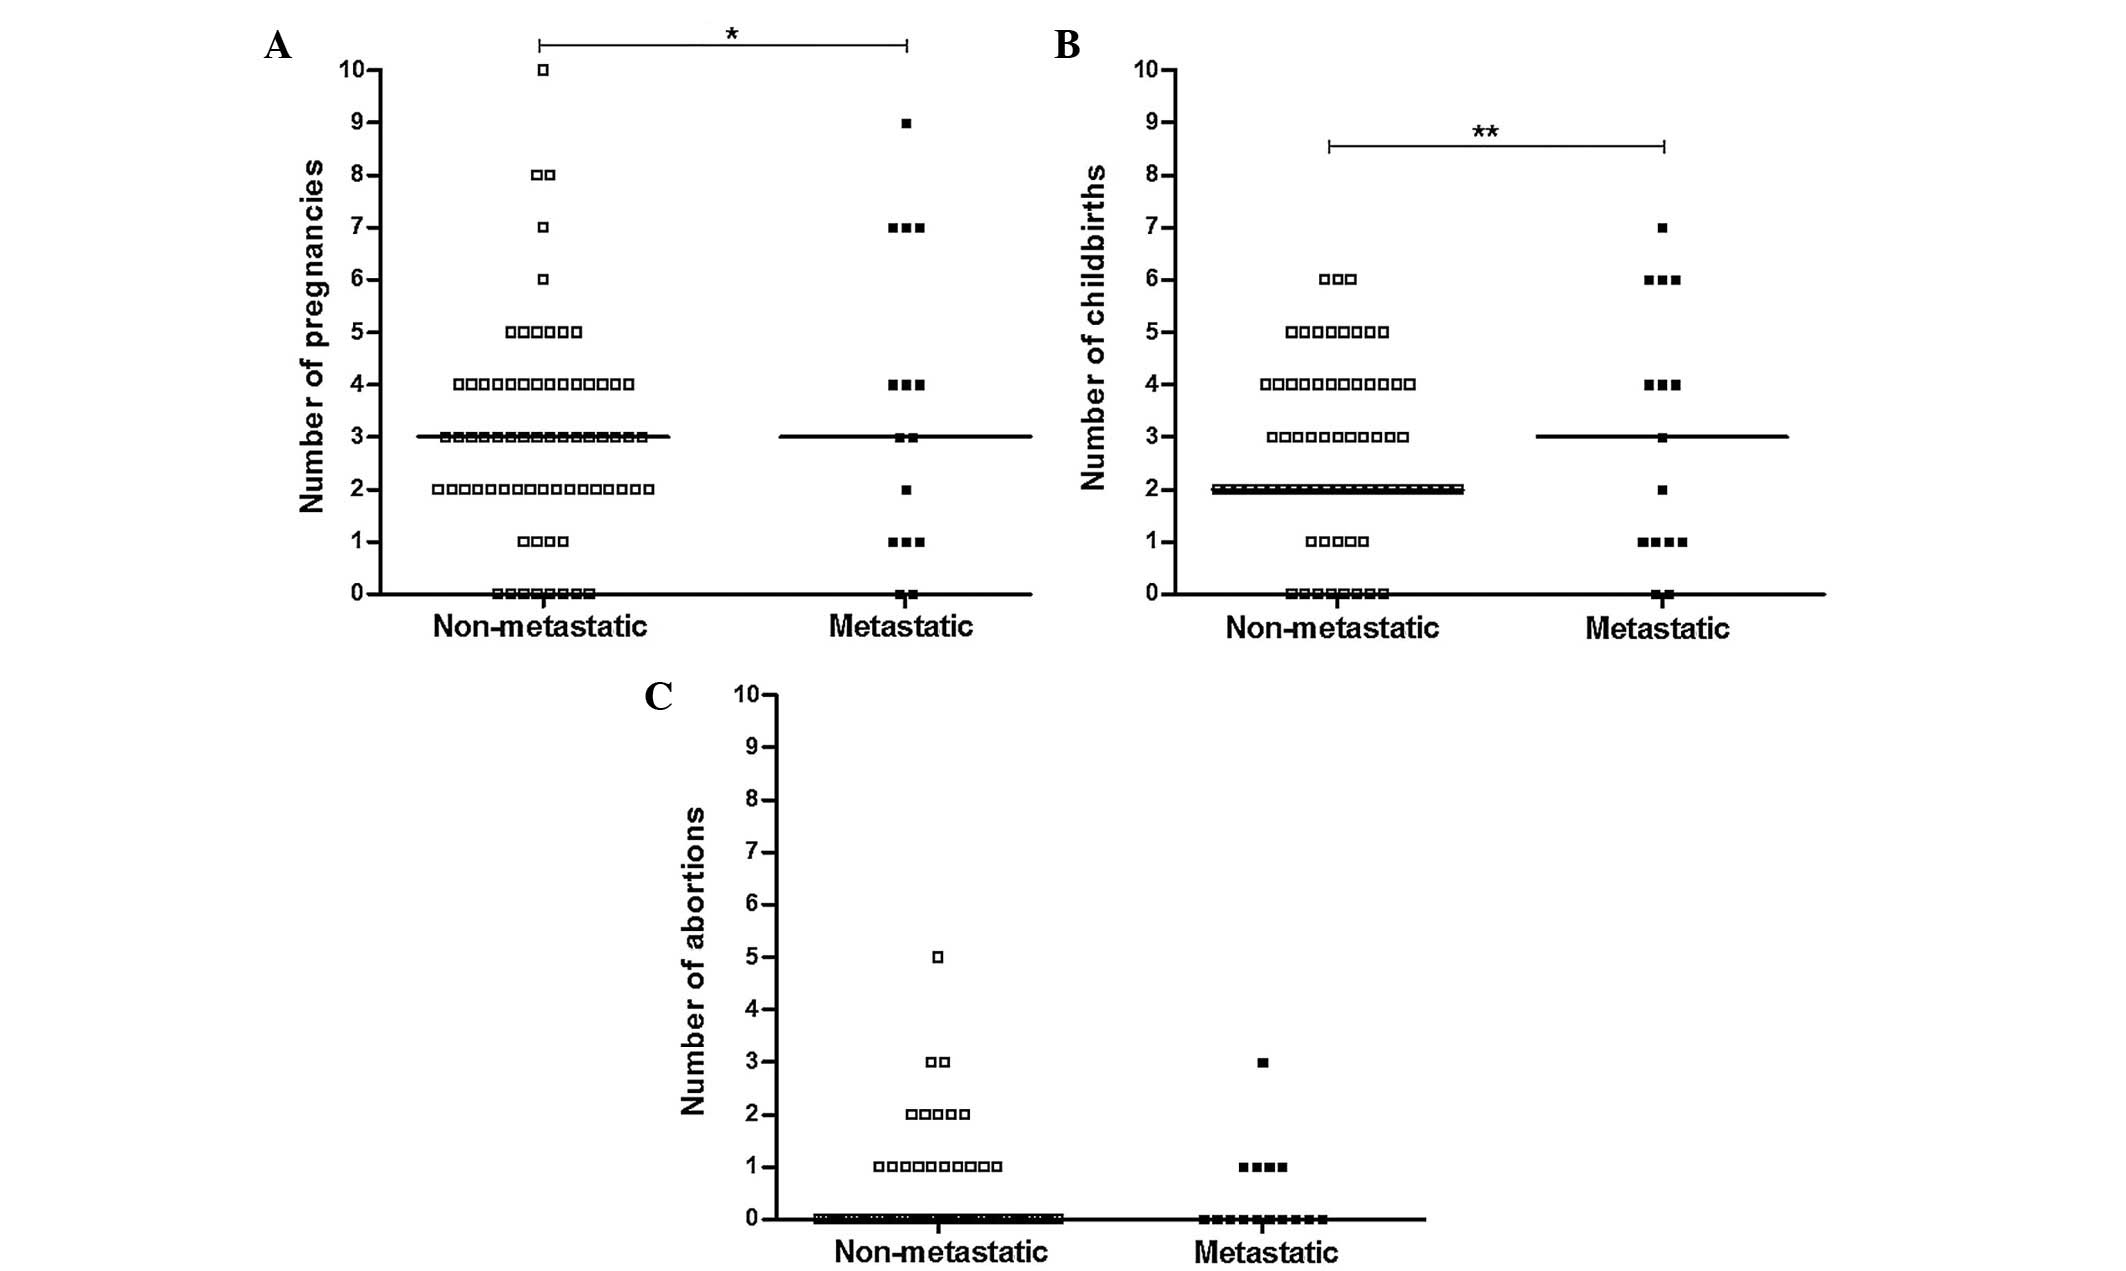
metastatic patient (P=0.654) groups. However, significant
differences were observed between the non-metastatic and metastatic
groups regarding the number of pregnancies and childbirths each
patient had experienced (Fig. 1A and
B; P=0.019 and P=0.008, respectively); a markedly higher number
of patients in the non-metastatic group had ≥3 pregnancies and/or
childbirth events compared with the metastatic group. There was no
significant difference between non-metastatic and metastatic groups
regarding the number of abortions each patient had experienced
(Fig. 1C; P=0.551). The mean duration
of breastfeeding in the non-metastatic group was reduced compared
with that in the metastatic group, but this difference was not
significant (P=0.057).
| Table II.Demographic and lifestyle features of
healthy control and BC patients in the present study. |
Table II.
Demographic and lifestyle features of
healthy control and BC patients in the present study.
|
|
|
| P-value |
|---|
|
|
|
|
|
|---|
| Variable | Healthy
control | Non-metastatic | Metastatic | Non metastatic vs.
metastatic | Non-metastatic vs.
control | Metastatic vs.
control |
|---|
| Age, years, mean ±
SD | 42.9±9.2 | 53.6±11.6 | 47.8±16.0 | 0.107a | 0.076a | 0.654a |
| Marital status,
single: married: widow, % | 13:87:0 | 3:94:3 | 13:87:0 | 0.201b | 0.201b | 0.701c |
| Pregnancy, yes: no,
% | 60:40 | 89:11 | 87:13 | 0.561c | 0.015c | 0.107c |
| Childbirth, yes:
no, % | 60:40 | 89:11 | 87:13 | 0.561c | 0.015c | 0.107c |
| Abortion, yes: no,
% | 20:80 | 26:74 | 33:67 | 0.378c | 0.461c | 0.341c |
| Abortion type,
medical: criminal, % | 100:0 | 50:50 | 60:40 | 0.545c | 0.001c | 0.053c |
| Duration of
breastfeeding, weeks, mean ± SD | 43.5±25.1 | 32.8±26.5 | 50.5±51.3 | 0.562d | 0.094d | 0.567d |
| Family history of
BC, 1st degree: 2nd degree: no, % | 20:33:47 | 10:15:75 | 7:14:79 | 0.925b | 0.102b | 0.208b |
| Smoking, yes: no,
% | 33:67 | 10:90 | 0:100 | 0.260c | 0.035c | 0.042c |
| High-fat diet, yes:
no, % | 60:40 | 80:20 | 86:14 | 0.464c | 0.176c | 0.215c |
Clinical features
With respect to the clinical findings, the
non-metastatic and metastatic groups were observed to be
significantly different with regard to pathology and lymphovascular
invasion (LVI; P=0.032 and P=0.036, respectively). Invasive lobular
carcinoma was more common among the metastatic patients compared
with the non-metastatic patients (31 vs. 4%), and invasive ductal
carcinoma was more common in the non-metastatic patients compared
with the metastatic patients (69 vs. 88%). Notably, an increased
percentage of the non-metastatic group was LVI-positive compared to
the metastatic group (52 vs. 18%). In addition, a higher percentage
of the metastatic patients exhibited stage II disease compared to
the non-metastatic patients (53 vs. 28%). No significant
differences were observed between the patient groups for any other
tumor features and clinical findings, including tumor size
(P=0.106), grade (P=0.898), ER status (P=0.100), progesterone
receptor status (P=0.557), human epidermal growth factor receptor 2
(HER2) status (P=0.589), P53 status (P=0.611), diabetes (P=0.300),
serum vitamin D level (P=0.057), surgery type (P=0.174), and
receiving chemotherapy (P=0.268), radiotherapy (P=0.437),
estrogen-progesterone (P=0.585) and other hormone therapy (P=0.622;
Table III).
| Table III.Clinical findings of the breast
cancer patients in the present study. |
Table III.
Clinical findings of the breast
cancer patients in the present study.
| Variable | Non-metastatic | Metastatic | P-value |
|---|
| Pathology, IDC:
DCIS: IDC/DCIS: ILC: IDC/ILC, % | 88:4:2:4:2 | 69:0:0:31:0 | 0.032a |
| Stage, I:II, % | 72:28 | 47:53 | 0.058b |
| Grade, 1:2:3,
% | 10:76:14 | 9:82:9 | 0.898a |
| Lymphovascular
invasion, +: -, % | 52:48 | 18:82 | 0.036b |
| Estrogen receptor,
+: -, % | 100:0 | 100:0 | 1.000a |
| Progesterone
receptor, +: -, % | 96:4 | 93:7 | 0.557b |
| Human epidermal
growth factor receptor 2, +: -, % | 37:63 | 36:64 | 0.589b |
| P53, +: -, % | 27:73 | 20:80 | 0.611b |
| Tumor size, cm,
mean ± SD | 2.1±0.9 | 2.6±1.5 | 0.424c |
| Surgery type, BCS:
MRM: BCS/MRM, % | 50:32:18 | 50:50:0 | 0.174a |
| Chemotherapy, yes:
no, % | 90:10 | 75:25 | 0.268b |
| Radiotherapy, yes:
no, % | 86:14 | 93:7 | 0.437b |
| Hormone therapy,
yes: no, % | 91:9 | 93:7 | 0.622b |
| Receiving estrogen
and progesterone, yes: no, % | 12:88 | 13:87 | 0.585b |
| Vitamin D, ng/ml,
mean ± SD | 27.2±25.2 | 36.9±20.0 | 0.225c |
| Diabetes, yes: no,
% | 9:91 | 0:100 | 0.300b |
Gene expression levels
For evaluation of mRNA expression of EXT1,
WISP1, ATAD2, TSPYL5, MTDH and
CCNE2 genes, qPCR was performed (Fig. 2). The results revealed that expression
of EXT1 and WISP1 was significantly decreased in the
metastatic group compared to the control (P=0.015 and P=0.012,
respectively) and non-metastatic (P<0.001 and P<0.001)
groups, while no significant difference was observed for the
expression of these genes between the control and non-metastatic
groups (P=0.803 and P=0.955, respectively). The expression of
TSPYL5, MTDH and ATAD2 genes in metastatic (P=0.002,
P=0.018 and P=0.016, respectively) and non-metastatic (P=0.038,
P=0.045 and P=0.000, respectively) groups was significantly
decreased compared to the control group. In addition, a significant
reduction was observed in the expression of TSPYL5 in the
metastatic group compared to the non-metastatic group (P=0.040),
and in that of ATAD2 in the non-metastatic group compared to
the metastatic group (P=0.014). No significant difference was
observed in the expression of MTDH between the metastatic
and non-metastatic groups (P=0.293). The mRNA expression of
CCNE2 in the metastatic and non-metastatic groups was
significantly increased compared with the control (P=0.002 and
P=0.001), while expression of this gene was not altered in the
metastatic group compared to the non-metastatic group
(P=0.746).
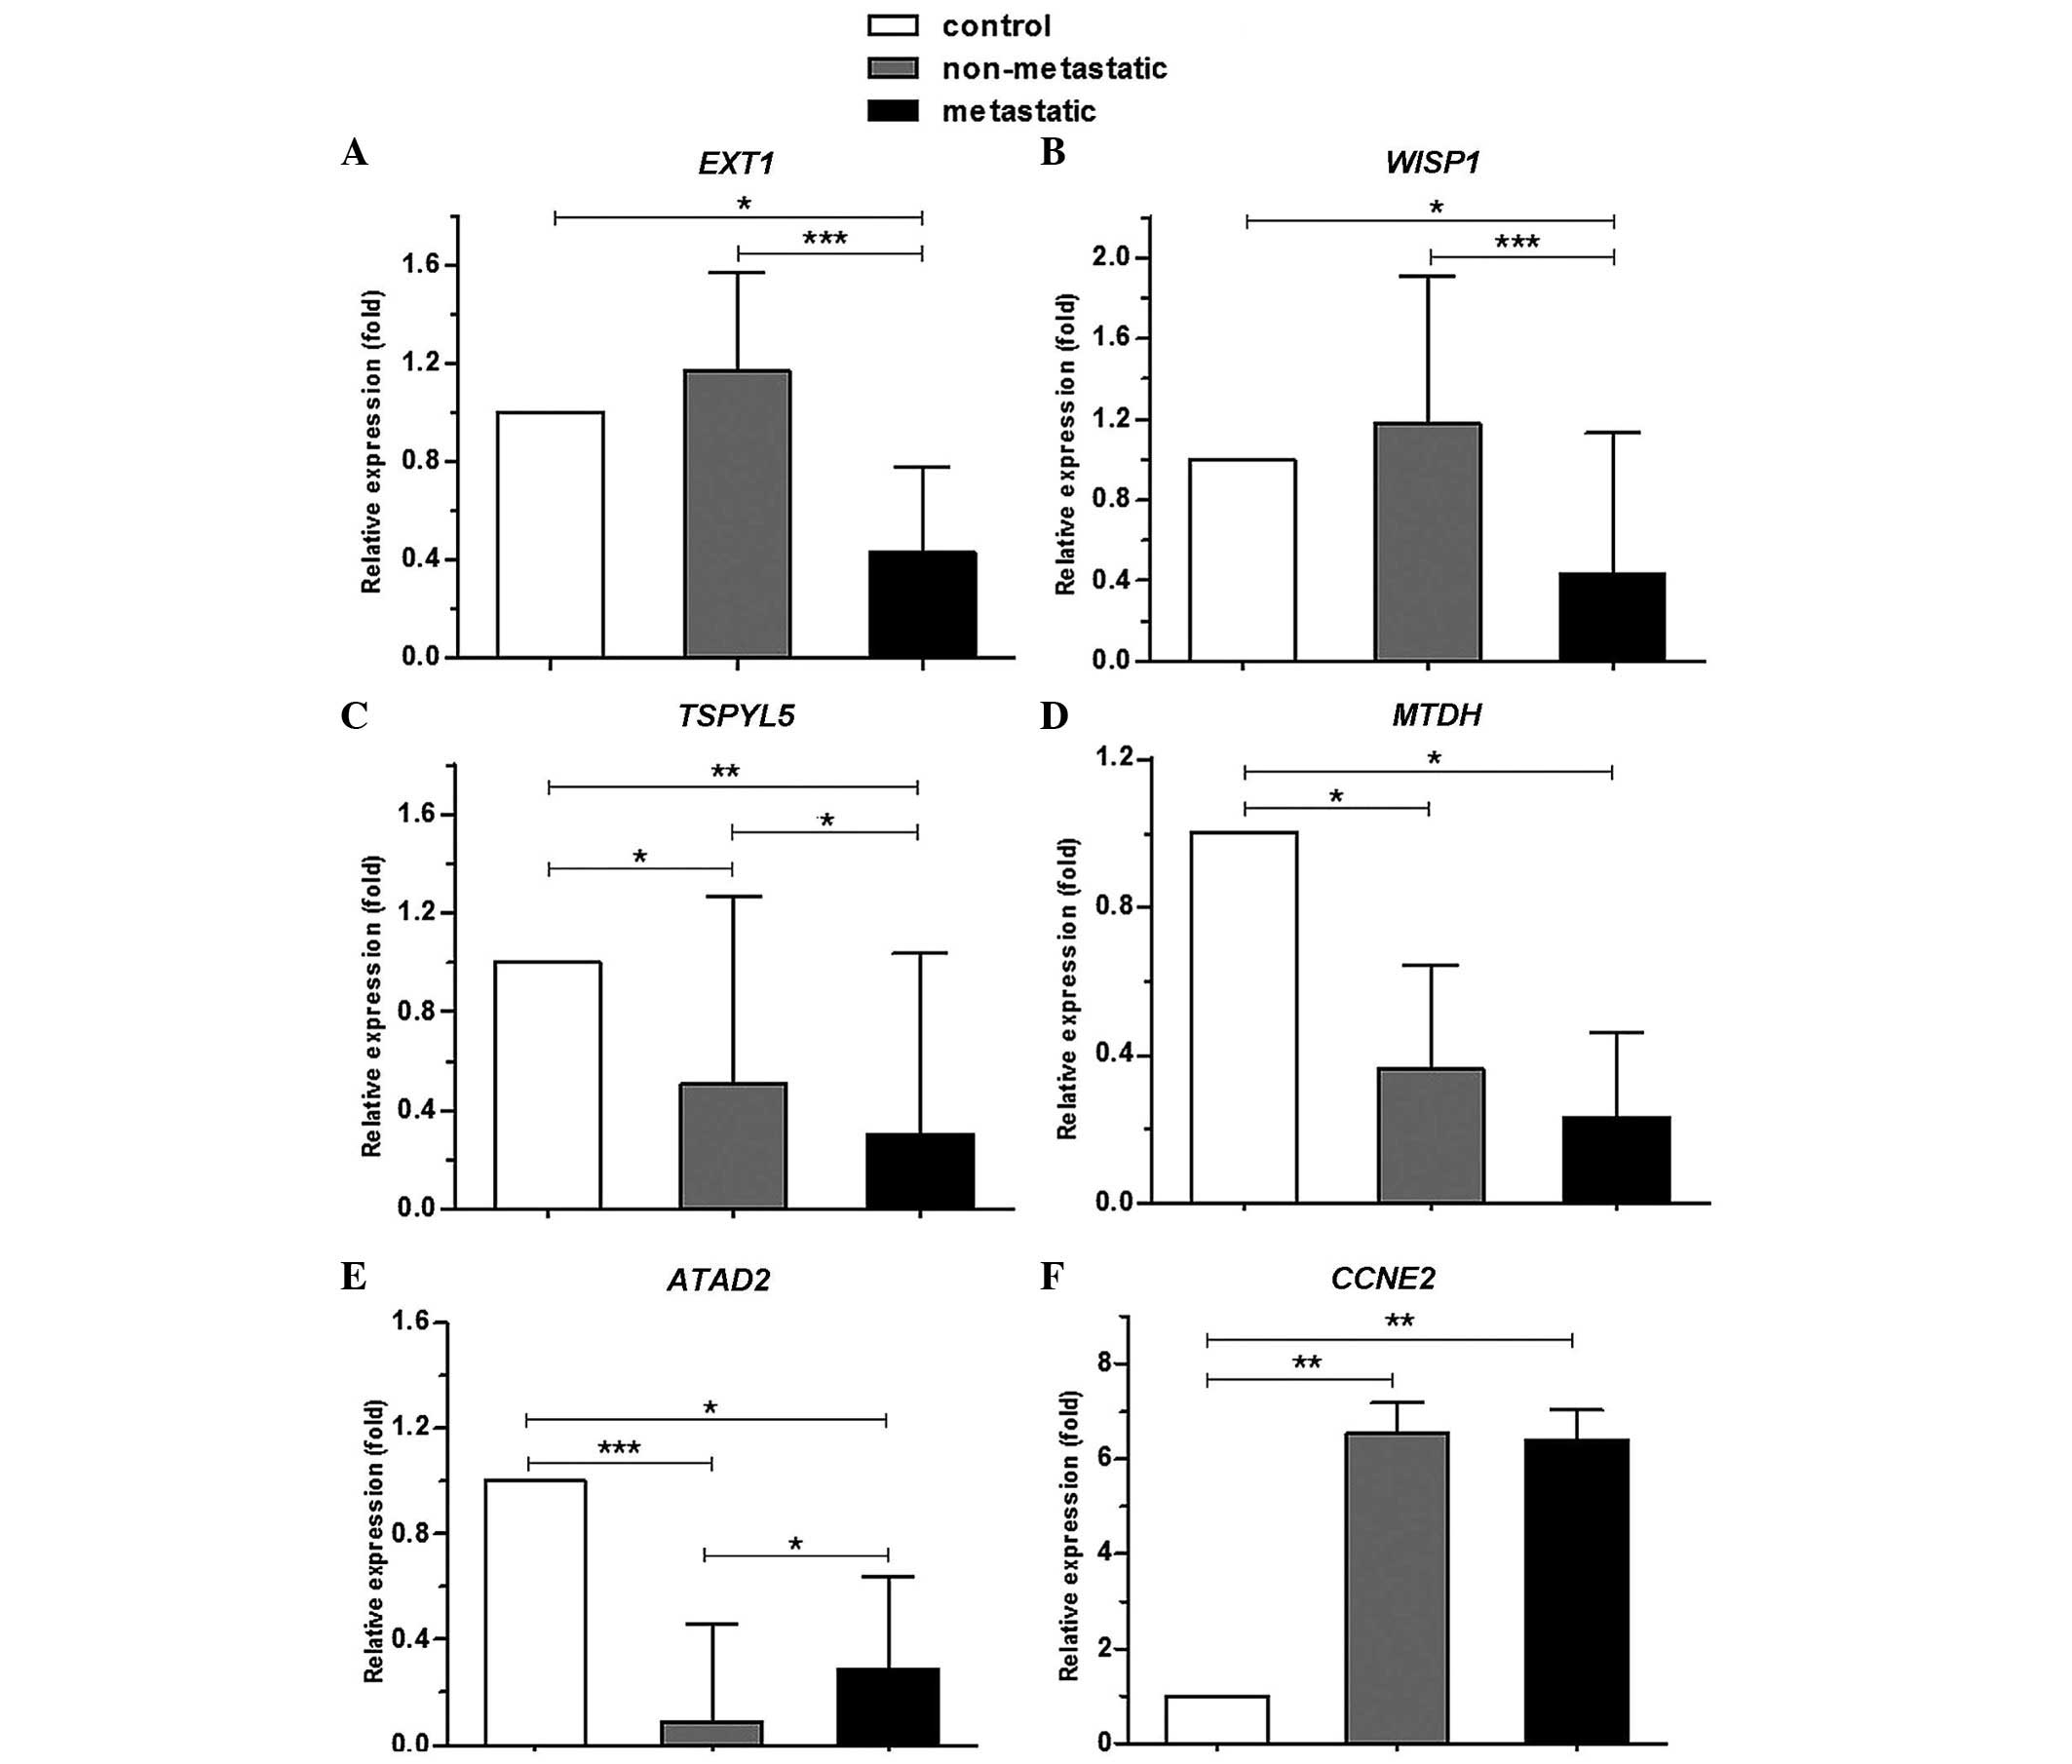 | Figure 2.Comparison of mRNA expression of
EXT1, WISP1, ATAD2, TSPYL5, MTDH
and CCNE2 genes between control, metastatic and
non-metastatic groups. (A and B) The expression of EXT1 and
WISP1 was significantly decreased in the metastatic group
compared to the control and non-metastatic groups. (C-E) The
expression of TSPYL5, MTDH and ATAD2 was
significantly decreased in metastatic and non-metastatic groups
compared to the control. (F) The expression of CCNE2 was
significantly increased in the metastatic and non-metastatic groups
compared to the control. *, ** and *** represent P<0.05,
<0.01 and <0.001, respectively. EXT1, exostosin
glycosyltransferase 1; WISP1, WNT1 inducible signaling
pathway protein 1; TSPYL5, TSP-like 5; MTDH,
metadherin; ATAD2, ATPase family, AAA domain containing 2;
CCNE2, cyclin E2. |
Correlation between expressions of
genes
As depicted in Fig. 3,
there was a significant strong positive correlation between
expression of WISP1 and TSPYL5 (r=0.743; P<0.001),
and significant weak positive correlations between EXT1 and
WISP1 (r=0.293; P=0.009), EXT1 and TSPYL5
(r=0.316; P=0.005), and TSPYL5 and MTDH (r=0.395;
P<0.001). In addition, non-significant weak positive
correlations were observed between expression of TSPYL5 and
ATAD2 (r=0.244; P=0.102) and MTDH and ATAD2
(r=0.245; P=0.105), and weak non-significant negative correlations
were observed between TSPYL5 and CCNE2 (r=−0.211;
P=0.129) and MTDH and CCNE2 (r=−0.200; P=0.154).
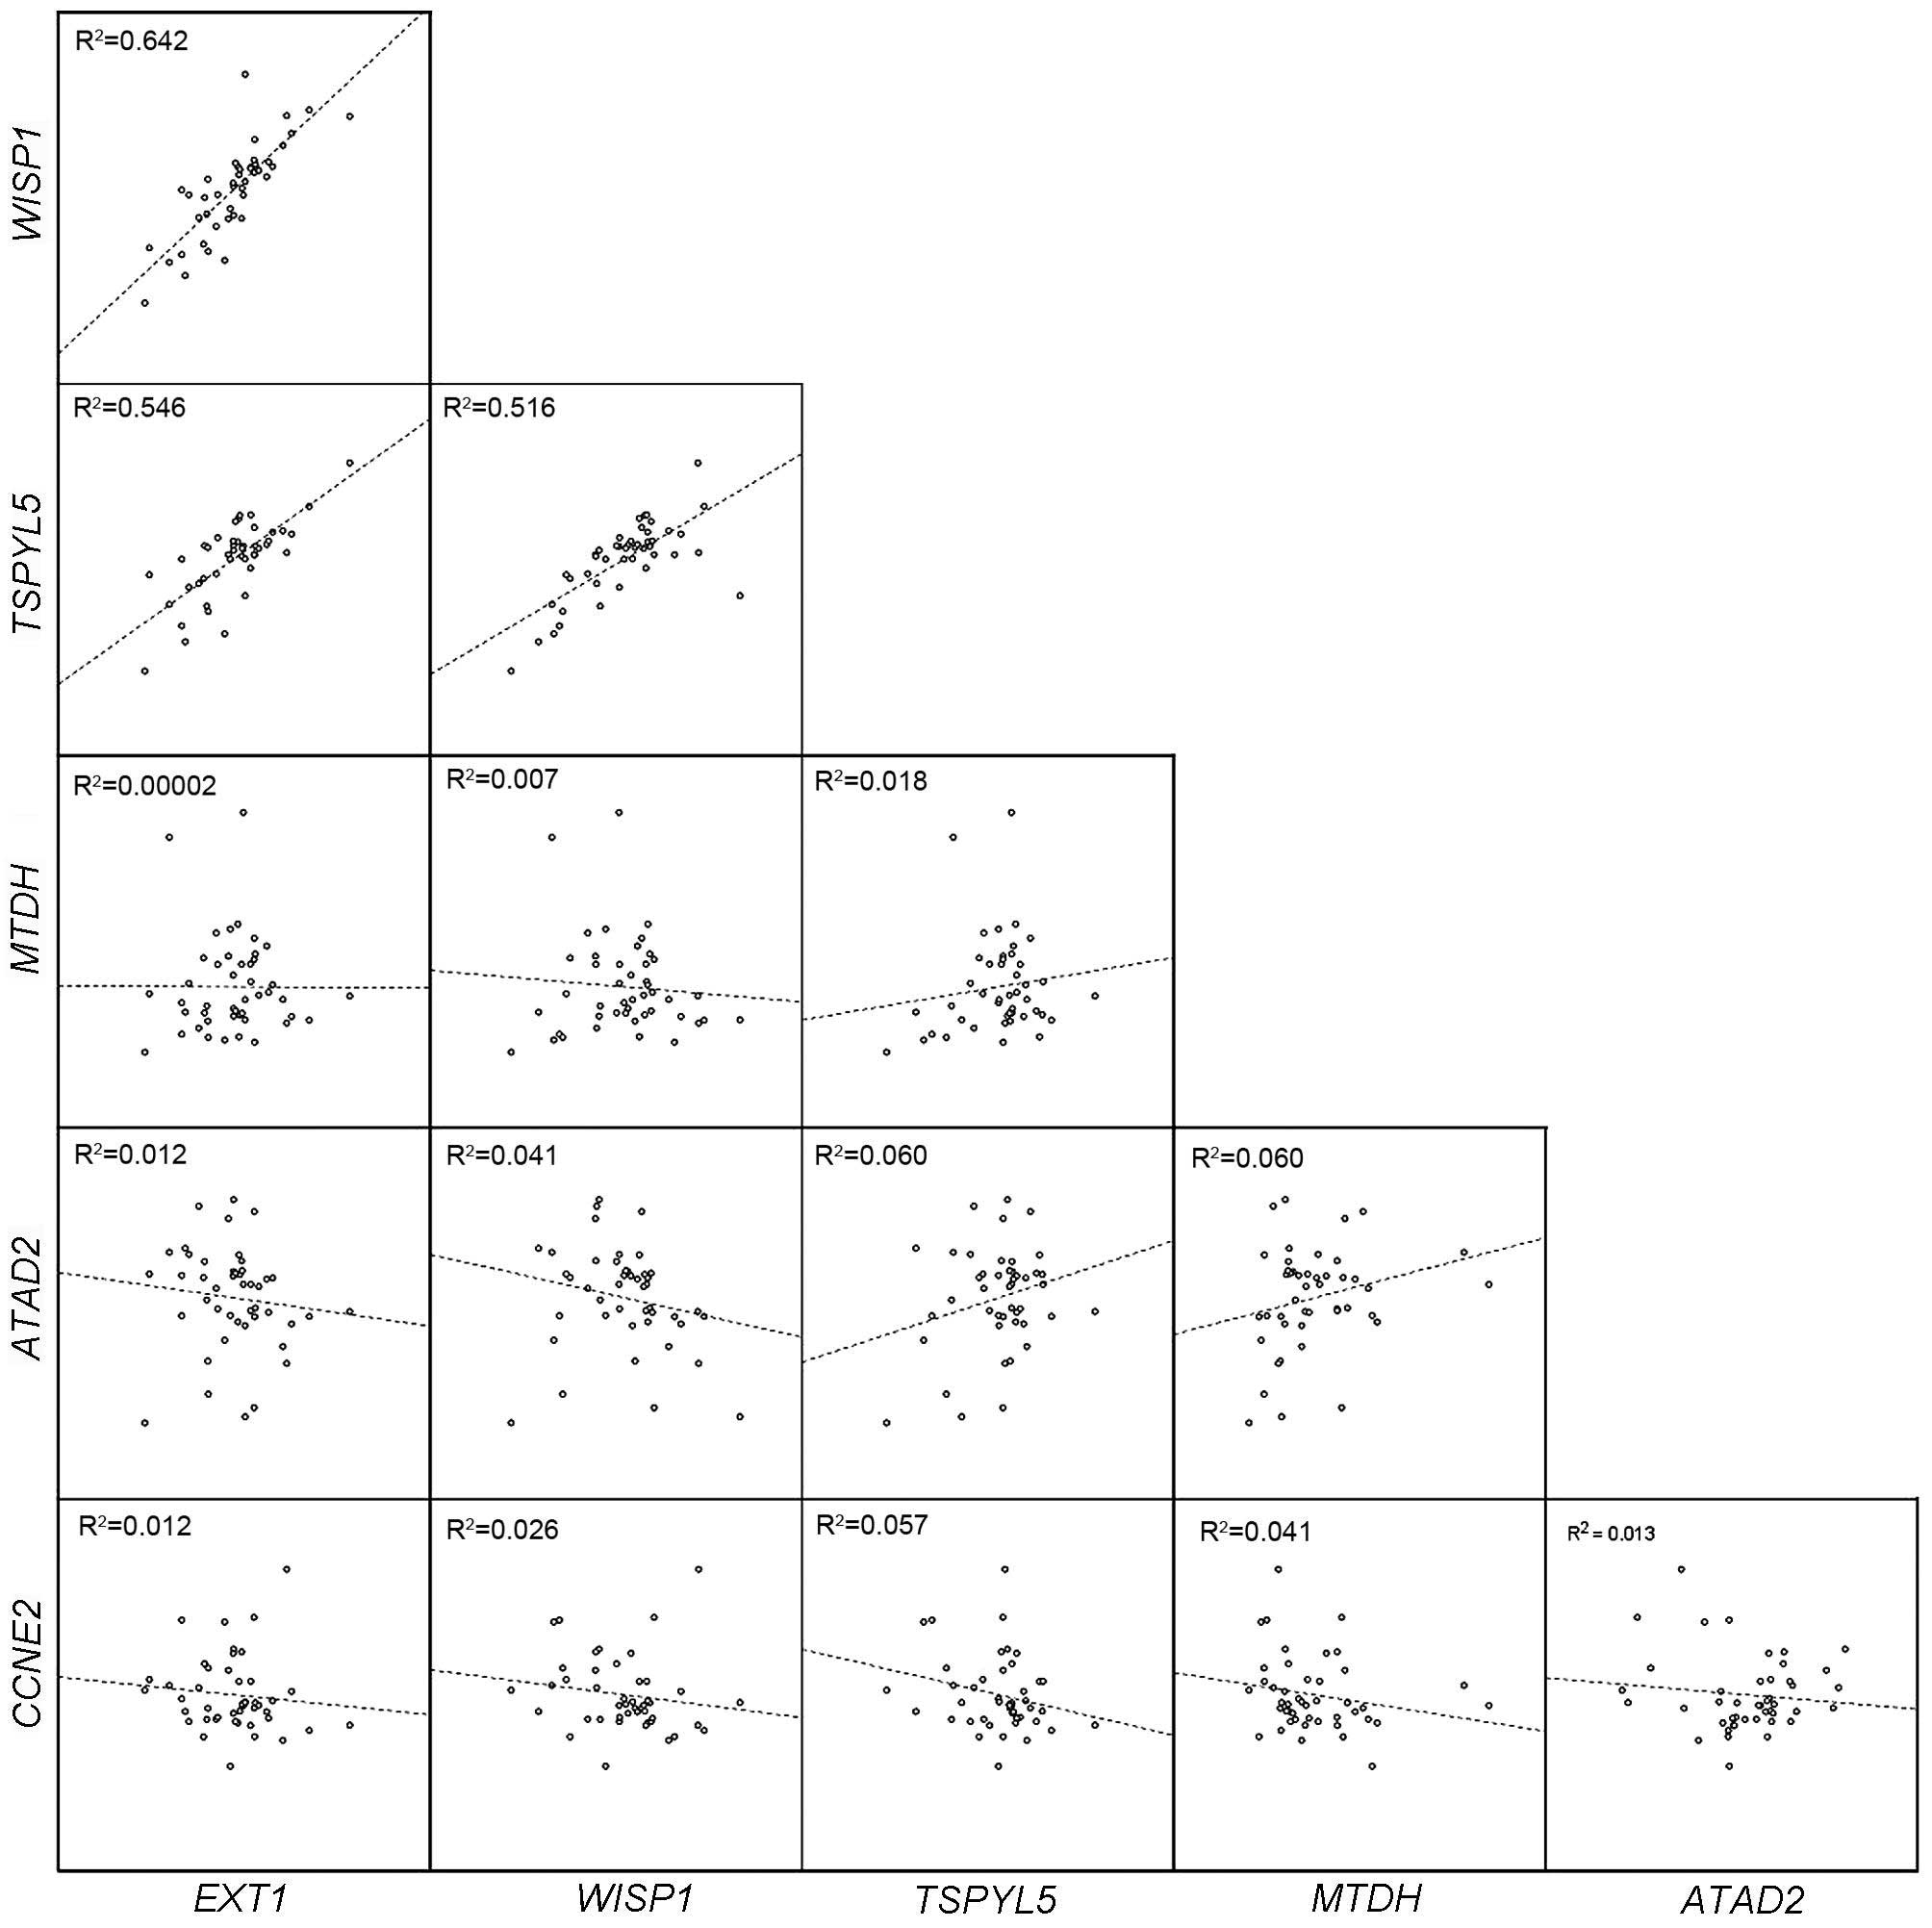 | Figure 3.Evaluation of correlations between
mRNA expression of EXT1, WISP1, ATAD2,
TSPYL5, MTDH and CCNE2 genes in the present
study. There were marked positive correlations between EXT1,
WISP1 and TSPYL5 expression. EXT1, exostosin
glycosyltransferase 1; WISP1, WNT1 inducible signaling
pathway protein 1; TSPYL5, TSP-like 5; MTDH,
metadherin; ATAD2, ATPase family, AAA domain containing 2;
CCNE2, cyclin E2. |
Correlation between gene expression
and demographic characteristics
As given in Table IV,
expression of WISP1 was correlated with age (r=0.264;
P=0.026) and family history of breast cancer (r=0.209; P=0.088),
while no association was observed between WISP1 expression
and other demographic characteristics of the patients (for all,
r<0.200; P>0.05). The expression of TSPYL5 was
correlated with abortion (r=0.200; P=0.094), smoking (r=0.243;
P=0.044) and family history of breast cancer (r=0.340; P=0.005);
TSPYL5 expression was significantly higher among patients
who had a family history of the disease (P=0.002) and those who
were smokers (P=0.048). However, no correlation was observed
between TSPYL5 and other demographic features (for all,
r<0.200; P>0.05). The MTDH expression was also
correlated with family history of breast cancer (r=0.203; P=0.100),
while it was not correlated with other demographic features (for
all, r<0.200; P>0.05). The expression of ATAD2 was
only correlated with abortion (r=0.207; P=0.205) and smoking
(r=0.277; P=0.092). The expressions of EXT1 and CCNE2 were
not correlated with none of the demographic features (for all,
r<0.200; P>0.05).
| Table IV.Correlation between gene expression
and demographic characteristics of breast cancer patients. |
Table IV.
Correlation between gene expression
and demographic characteristics of breast cancer patients.
|
| Gene name |
|---|
|
|
|
|---|
| Variable | EXT1 | WISP1 | TSPYL5 | MTDH | ATAD2 | CCNE2 |
|---|
| Agea |
|
|
|
|
|
|
| r
coefficient | 0.074 | 0.264 | 0.195 | −0.069 | −0.179 | −0.098 |
|
P-value | 0.542 | 0.026 | 0.103 | 0.570 | 0.277 | 0.516 |
| Marital
statusb |
|
|
|
|
|
|
| r
coefficient | 0.068 | 0.199 | 0.067 | 0.124 | 0.134 | 0.060 |
|
P-value | 0.584 | 0.103 | 0.590 | 0.317 | 0.415 | 0.698 |
| Pregnancy or
childbirthb |
|
|
|
|
|
|
| r
coefficient | 0.150 | 0.113 | 0.054 | 0.029 | 0.026 | 0.145 |
|
P-value | 0.212 | 0.348 | 0.653 | 0.812 | 0.877 | 0.337 |
|
Abortionb |
|
|
|
|
|
|
| r
coefficient | 0.089 | 0.101 | 0.200 | 0.124 | 0.207 | 0.048 |
|
P-value | 0.462 | 0.403 | 0.094 | 0.308 | 0.205 | 0.749 |
| Duration of
breastfeedinga |
|
|
|
|
|
|
| r
coefficient | −0.094 | −0.007 | 0.088 | 0.042 | 0.060 | 0.059 |
|
P-value | 0.440 | 0.955 | 0.470 | 0.733 | 0.718 | 0.698 |
|
Smokingb |
|
|
|
|
|
|
| r
coefficient | 0.142 | 0.142 | 0.243 | 0.185 | 0.277 | 0.006 |
|
P-value | 0.244 | 0.244 | 0.044 | 0.131 | 0.092 | 0.969 |
| High-fat
dieta |
|
|
|
|
|
|
| r
coefficient | 0.178 | 0.186 | 0.173 | 0.088 | 0.165 | 0.036 |
|
P-value | 0.160 | 0.141 | 0.170 | 0.491 | 0.343 | 0.824 |
| Family
historyb |
|
|
|
|
|
|
| r
coefficient | 0.164 | 0.209 | 0.340 | 0.203 | 0.059 | 0.183 |
|
P-value | 0.183 | 0.088 | 0.005 | 0.100 | 0.726 | 0.228 |
Correlation between gene expression
and clinical features
As presented in Table
V, expression of EXT1 demonstrated a significant
correlation with hormone therapy (r=0.368; P=0.002), but it did not
exhibit any correlation with other clinical features of the
patients (for all, r<0.200; P>0.05). WISP1 expression
was correlated with tumor size (r=−0.242; P=0.047) vitamin D level
(r=0.220; P=0.242), surgery type (r=0.240; P=0.047) and hormone
therapy (r=0.264; P=0.026), whereas no correlation was found
between WISP1 expression and other clinical features (for
all, r<0.200; P>0.05). TSPYL5 demonstrated
correlations with LVI (r=0.309; P=0.016), tumor size (r=−0.235;
P=0.054), surgery type (r=0.276; P=0.022), radiotherapy (r=0.213;
P=0.122) and hormone therapy (r=0.247; P=0.038). However, no
correlation was seen between TSPYL5 and other clinical
features (for all, r<0.200; P>0.05). ATAD2
demonstrated correlations only with LVI (r=0.200; P=0.272), HER2
(r=0.272; P=0.108), vitamin D level (r=0.451; P=0.106) and diabetes
(r=0.274; P=0.092). CCNE2 expression was correlated with
pathology (r=0.270; P=0.077), LVI (r=0.223; P=0.185), P53 (r=0.318;
P=0.113), surgery type (r=0.319; P=0.033), chemotherapy (r=0.270;
P=0.077) and estrogen-progesterone therapy (r=0.310; P=0.062).
However, no correlation was observed between CCNE2
expression and other clinical features of the patients (for all,
r<0.200; P>0.05).
| Table V.Correlation between gene expression
and clinical features of breast cancer patients. |
Table V.
Correlation between gene expression
and clinical features of breast cancer patients.
|
| Gene name |
|---|
|
|
|
|---|
| Variable | EXT1 | WISP1 | TSPYL5 | MTDH | ATAD2 | CCNE2 |
|---|
|
Pathologyb |
|
| r
coefficient | 0.191 | 0.100 | 0.058 | 0.070 | 0.187 | 0.270 |
|
P-value | 0.116 | 0.414 | 0.638 | 0.570 | 0.266 | 0.077 |
| Stageb |
|
| r
coefficient | 0.166 | 0.188 | 0.155 | 0.021 | 0.066 | 0.061 |
|
P-value | 0.174 | 0.122 | 0.203 | 0.865 | 0.693 | 0.696 |
| Gradeb |
|
| r
coefficient | 0.052 | 0.070 | 0.110 | 0.066 | 0.056 | 0.009 |
|
P-value | 0.688 | 0.584 | 0.389 | 0.606 | 0.761 | 0.956 |
| Lymphovascular
invasionb |
|
| r
coefficient | 0.040 | 0.182 | 0.309 | 0.186 | 0.200 | 0.223 |
|
P-value | 0.761 | 0.161 | 0.016 | 0.152 | 0.272 | 0.185 |
| Progesterone
receptorb |
|
| r
coefficient | 0.128 | 0.162 | 0.109 | 0.153 | 0.032 | 0.018 |
|
P-value | 0.296 | 0.184 | 0.373 | 0.211 | 0.848 | 0.909 |
| Human epidermal
growth factor receptorb |
|
| r
coefficient | 0.150 | 0.075 | 0.177 | 0.150 | 0.272 | 0.049 |
|
P-value | 0.243 | 0.561 | 0.168 | 0.243 | 0.108 | 0.759 |
| P53b |
|
| r
coefficient | 0.074 | 0.032 | 0.111 | 0.037 | 0.043 | 0.318 |
|
P-value | 0.642 | 0.839 | 0.485 | 0.817 | 0.856 | 0.113 |
| Tumor
sizea |
|
| r
coefficient | −0.059 | −0.242 | −0.235 | −0.014 | −0.084 | 0.020 |
|
P-value | 0.630 | 0.047 | 0.054 | 0.911 | 0.622 | 0.900 |
| Surgery
typeb |
|
| r
coefficient | 0.198 | 0.240 | 0.276 | 0.028 | 0.221 | 0.319 |
|
P-value | 0.103 | 0.047 | 0.022 | 0.821 | 0.183 | 0.033 |
|
Chemotherapyb |
|
| r
coefficient | 0.191 | 0.100 | 0.058 | 0.070 | 0.187 | 0.270 |
|
P-value | 0.116 | 0.414 | 0.638 | 0.570 | 0.266 | 0.077 |
|
Radiotherapyb |
|
| r
coefficient | 0.082 | 0.159 | 0.213 | 0.009 | 0.089 | 0.121 |
|
P-value | 0.557 | 0.251 | 0.122 | 0.947 | 0.624 | 0.477 |
| Hormone
therapyb |
|
| r
coefficient | 0.368 | 0.264 | 0.247 | 0.083 | 0.082 | 0.092 |
|
P-value | 0.002 | 0.026 | 0.038 | 0.493 | 0.621 | 0.543 |
|
Estrogen-progesteroneb |
|
| r
coefficient | 0.019 | 0.052 | 0.025 | 0.031 | 0.171 | 0.310 |
|
P-value | 0.883 | 0.691 | 0.847 | 0.811 | 0.358 | 0.062 |
| Vitamin
Da |
|
| r
coefficient | 0.056 | 0.220 | 0.057 | 0.172 | 0.451 | 0.104 |
|
P-value | 0.767 | 0.242 | 0.766 | 0.362 | 0.106 | 0.692 |
|
Diabetesb |
|
| r
coefficient | 0.008 | 0.040 | 0.035 | 0.128 | 0.274 | 0.120 |
|
P-value | 0.947 | 0.739 | 0.773 | 0.292 | 0.092 | 0.425 |
Discussion
Following a large number of investigations, the gene
expression profiling approach has been established to serve as an
appropriate predictor for the clinical outcome of human breast
cancer (27,28). The 8q22-24 position has recently drawn
the interest of a number of investigators in this field, worldwide
(13–17,29).
However, to date the majority of relevant publications contradict
each other (18–20,30–32),
leaving the prognostic value of the 8q22-24 position uncertain.
Therefore, in the current study the mRNA expression patterns of
WISP1, EXT1, ATAD2, TSPYL5, MTDH
and CCNE2 genes, located at the 8q22-24 position, were
examined in metastatic and non-metastatic early-stage breast
cancers. However, the results of the present study contradicted
numerous previous reports. All patients included in the present
study were lymph-node negative, ER positive and exhibited stage I
and II breast cancer, which may be a logical explanation for this
observed difference. By contrast, the majority of previous
investigations have included patients with advanced stage breast
cancers, regardless of ER status. Furthermore, to the best of our
knowledge, the present study is the first to investigate target
genes in lymph node-negative early stage breast cancers.
The WISP1 gene is located in the
8q24.1–8q24.3 region, and encodes WNT1-inducible-signaling pathway
protein 1, a microcellular protein that is also known as CCN4, in
humans (8). An increasing number of
studies indicate that WISP1 may be implicated in the development
and progression of various types of cancer, suggesting this
molecule may be a marker for disease (6,18,26,33).
However, conflicting data exist regarding the stimulatory or
suppressive role of WISP1 in cancer development (17–19). In
the current study, it was observed that the mRNA expression of
WISP1 in non-metastatic breast cancer patients was unchanged
compared to normal individuals, while its expression significantly
declined in metastatic patients. This finding is in accordance with
Davies et al (19) who
reported WISP1 as a tumor suppressor gene; it was observed
that mRNA transcripts of WISP1 were decreased in node-positive
breast cancer patients who subsequently developed metastasis and
died. In line with results of Davies et al (19), the decline observed in the expression
of the WISP1 gene in the present study appears to be
associated with aggressive behavior of the tumor in metastatic
breast cancer. However, the results of other previous studies
contradict this finding. In contrast to the present study, Xie
et al (17) observed that
expression level of WISP1 was elevated in primary breast
cancer, and this may have contributed to more advanced features of
the disease. Chen et al (18)
also reported that increased expression of WISP1 may be
associated with the pathogenesis of primary lung cancers.
The present study also observed that the expression
of WISP1 was associated with a patient's age, serum vitamin
D level, tumor size, surgery type and hormone therapy, but showed
no association with stage, grade, pathological type and disease
features. The negative correlation of WISP1 with a patient's
age, serum vitamin D level and tumor size does not support the
hypothesis that a reduced level of WISP1 is a marker for
tumor progression or aggressive features. However, referring to the
relevant literature, no evidence regarding the correlation of
WISP1 with any demographic or pathological features in
breast cancer was identified. Furthermore, Xie et al
(34) reported no significant
association between expression of WISP1 and pathological
features, including tumor grade and stage, in primary glioma. Taken
together, the results of the present study may suggest WISP1
as a prognostic marker for breast cancer metastasis; though,
whether it is a tumor stimulator or suppressor remains to be
elucidated.
The EXT1 gene is located at 8q24.11, and
encodes exostosin glycosyltransferase 1, primarily known to serve
as a tumor suppressor (30). However,
there is evidence suggesting a tumor promoting role for EXT1
(32,35,36). For
example, it has been demonstrated that expression of the
EXT1 gene was amplified following treatment with heparan
sulfate proteoglycans, which indicated that, as a glycosylation
enzyme, EXT1 participates in heparan biosynthesis, and therefore
potentially contributes to the proliferation and invasive potential
of breast cancer epithelial cells in ER-negative tumors (32,35).
Furthermore, an increased plasma level of EXT1 has been associated
with tumorigenesis in cholangiocarcinoma, a form of malignancy in
the biliary duct system (36). In the
current study, the mRNA expression pattern of EXT1 was
similar to that of WISP1. Furthermore, positive correlation
was observed between the expression of the EXT1 and
WISP1 genes, and unlike the other investigated genes,
EXT1 was not associated with the demographic or clinical
features of the patients. Based on these findings and following
investigations in the future, monitoring mRNA levels of EXT1
along with WISP1 may assist with assessing the risk of
breast cancer metastasis.
The TSPYL5 gene is located at 8q22.1, and
encodes the testis-specific Y encoded like protein 5 (24). Elevated expression of this gene has
been implicated in breast oncogenesis and poor prognosis, via
suppression of P53 function (24).
Although little is known about the role of TSPYL5 in the
context of cancer, it has been previously suggested to serve as a
transcription factor for a number of genes involved in ER-positive
breast cancer (37). In addition, Lyu
et al (38) demonstrated that
regulator of G-protein signaling 2 overexpression in human breast
cancer MCF7 cells diminished TSPYL5 expression, and thereby
inhibited growth of the cells. By contrast, in the current study,
it was observed that mRNA expression of TSPYL5 was
diminished in metastatic and non-metastatic breast tumors compared
with normal tissues, and the expression levels declined even
further in the metastatic compared to the non-metastatic tumors.
Furthermore, it was observed that mRNA expression of TSPYL5
was associated with WISP1 and EXT1 mRNA expression.
TSPYL5 expression was also significantly associated with
family history, smoking, LVI, surgery type and hormone therapy. As
the expression of TSPYL5 was altered in metastatic and
non-metastatic breast tumors, this gene cannot be considered as a
promising prognostic tool for breast cancer metastasis, and is more
likely to be implicated in the pathogenesis of the disease.
The MTDH gene is located at 8q22.1, and
encodes metadherin, also known as astrocyte elevated gene-1 protein
or protein LYRIC (39). Elevated
expression of the MTDH gene is associated with an increased
risk of metastasis of breast cancer to the lungs (31), leading to poor prognosis (40). Hu et al (16), suggested that MTDH may have a
dual role in inducing metastasis and chemoresistance of breast
cancer with a poor prognosis. Furthermore, inhibition of
MTDH has been reported to enhance the sensitivity of breast
cancer cells to anti-cancer agents (22,23).
However, unlike this previous data, the present study demonstrated
that mRNA expression of MTDH, similar to that of
TSPYL5, in metastatic and non-metastatic tumors was lower
compared to normal tissues, and its expression in the metastatic
tumors was reduced compared with the non-metastatic tumors.
Furthermore, the expression of MTDH was directly correlated
with that of TSPYL5. In contrast to previous studies, the
results of the present study do not suggest the MTDH gene as
a prognosticator for metastasis, but rather that it may be
implicated in breast cancer development.
The ATAD2 gene is located at 8q24.13, and
encodes an ATPase containing two AAA domains, as well as a
bromodomain (15). Previous studies
have defined a tumor-driving role for ATAD2 in breast
carcinomas and other malignancies (15,21,41–43).
Ciro et al (41) suggested
that high expression levels of ATAD2 result in the
development of aggressive breast cancer and poor clinical outcomes
for patients, potentially via enhancement of transcriptional
activity of the MYC oncogene. In addition, Caron et al
(42) reported that overexpression of
ATAD2 in somatic cells may affect basic features of
chromatin, leading to malignant transformation during the
development of breast and lung cancer, and resulting in poor
prognosis. Additionally, according to Kalashnikova et al
(21), increased expression of
ATAD2 correlated with poor prognosis in breast cancer
patients. Raeder et al (15)
recently indicated that the amplified expression of the
ATAD2 gene is associated with an aggressive nature in
endometrial cancer and a poor outcome for patients. However, the
results of the present study contradict those of Kalashnikova et
al (21), Ciro et al
(41), Caron et al (42) and Raeder et al (15). The present study observed that
expression of the ATAD2 gene was significantly decreased in
metastatic and non-metastatic patients compared to normal
individuals, and this expression was positively correlated with
TSPYL5 and MTDH expression, and vitamin D level. Taken
together, the results of the present study indicate that the
ATAD2 gene, similar to TSPYL5 and MTDH, cannot
be considered as a metastasis gene in lymph node-negative breast
cancer, but may be involved in the pathogenesis of the disease.
The CCNE2 gene is located at 8q22.1, and
encodes cyclin E2 protein in humans (44). It has been demonstrated to have a
significant role in the pathogenesis and invasiveness of breast
cancer (25,45). By way of example, Li et al
(45) reported that the CCNE2
gene is overexpressed, simultaneously with c-Myc, in human breast
cancer, and potentially acts as a promoter for development of the
disease. In addition, Caldon et al (46) demonstrated that increased expression
of CCNE2 may be associated with drug-resistance in breast
cancer cells. Furthermore, Rogers et al (47) suggested that overexpression of
CCNE2 is associated with poor prognosis and decreased
genomic instability in human breast cancer. In the current study,
it was observed that CCNE2 is overexpressed in metastatic
and non-metastatic breast tumors compared with normal tissues.
Furthermore, the expression of CCNE2 was negatively
correlated with that of TSPYL5 and MTDH, while it did
not exhibit any association with the demographic and clinical
features of the patients. The results of the present study are in
agreement with those of Li et al (45), Caldon et al (46) and Rogers et al (47), suggesting that amplified expression of
CCNE2 is potentially implicated in breast cancer
development; however, it cannot be considered as a biomarker for
metastasis risk.
In conclusion, according to the results of the
current study, reductions in mRNA expression levels of
TSPYL5, ATAD2 and MTDH and increases in
CCNE2 mRNA levels may be implicated in the pathogenesis and
development of human breast cancer, whereas declines in
WISP1 and EXT1 mRNA expression among early-stage
ER-positive lymph node-negative breast cancer patients may be
associated with increased risk of metastasis. Therefore, if
validated in future studies considering individual genetic
background and ethnic variations, the WISP1 and EXT1
genes may serve as a promising indicator of metastasis risk.
Acknowledgements
The present study was financially supported by
grant no. 13012 provided from the Cancer Research Center of Shahid
Beheshti University of Medical Sciences (Tehran, Iran), and is
published as part of PhD dissertation project of Dr Afsoon
Taghavi.
References
|
1
|
Porter PL: Global trends in breast cancer
incidence and mortality. Salud Publica Mex. 51(Suppl 2): S141–S146.
2009. View Article : Google Scholar : PubMed/NCBI
|
|
2
|
MacMahon B: Epidemiology and the causes of
breast cancer. Int J Cancer. 118:2373–2378. 2006. View Article : Google Scholar : PubMed/NCBI
|
|
3
|
Rossi RE, Pericleous M, Mandair D, Whyand
T and Caplin ME: The role of dietary factors in prevention and
progression of breast cancer. Anticancer Res. 34:6861–6875.
2014.PubMed/NCBI
|
|
4
|
Amani D, Khalilnezhad A, Ghaderi A,
Niikawa N and Yoshiura K: Transforming growth factor beta1 (TGFβ1)
polymorphisms and breast cancer risk. Tumour Biol. 35:4757–4764.
2014. View Article : Google Scholar : PubMed/NCBI
|
|
5
|
Vaidya JS, Baldassarre G, Thorat MA and
Massarut S: Role of glucocorticoids in breast cancer. Curr Pharm
Des. 16:3593–3600. 2010. View Article : Google Scholar : PubMed/NCBI
|
|
6
|
Planque N and Perbal B: A structural
approach to the role of CCN (CYR61/CTGF/NOV) proteins in
tumourigenesis. Cancer Cell Int. 3:152003. View Article : Google Scholar : PubMed/NCBI
|
|
7
|
Tian S, Roepman P, Van't Veer LJ, Bernards
R, de Snoo F and Glas AM: Biological functions of the genes in the
mammaprint breast cancer profile reflect the hallmarks of cancer.
Biomark Insights. 5:129–138. 2010.PubMed/NCBI
|
|
8
|
Holbourn KP, Acharya KR and Perbal B: The
CCN family of proteins: Structure-function relationships. Trends
Biochem Sci. 33:461–473. 2008. View Article : Google Scholar : PubMed/NCBI
|
|
9
|
Martin M: Researchers hope new database
becomes universal cancer genomics tool. J Natl Cancer Inst.
104:1045–1047. 2012. View Article : Google Scholar : PubMed/NCBI
|
|
10
|
Cingoz S, Altungoz O, Canda T, Saydam S,
Aksakoglu G and Sakizli M: DNA copy number changes detected by
comparative genomic hybridization and their association with
clinicopathologic parameters in breast tumors. Cancer Genet
Cytogenet. 145:108–114. 2003. View Article : Google Scholar : PubMed/NCBI
|
|
11
|
Dellas A, Torhorst J, Schultheiss E,
Mihatsch MJ and Moch H: DNA sequence losses on chromosomes 11p and
18q are associated with clinical outcome in lymph node-negative
ductal breast cancer. Clin Cancer Res. 8:1210–1216. 2002.PubMed/NCBI
|
|
12
|
Climent J, Martinez-Climent JA, Blesa D,
Garcia-Barchino MJ, Saez R, Sánchez-Izquierdo D, Azagra P, Lluch A
and Garcia-Conde J: Genomic loss of 18p predicts an adverse
clinical outcome in patients with high-risk breast cancer. Clin
Cancer Res. 8:3863–3869. 2002.PubMed/NCBI
|
|
13
|
Horlings HM, Lai C, Nuyten DS, Halfwerk H,
Kristel P, van Beers E, Joosse SA, Klijn C, Nederlof PM, Reinders
MJ, et al: Integration of DNA copy number alterations and
prognostic gene expression signatures in breast cancer patients.
Clin Cancer Res. 16:651–663. 2010. View Article : Google Scholar : PubMed/NCBI
|
|
14
|
Han S, Park K, Shin E, Kim HJ, Kim JY, Kim
JY and Gwak G: Genomic change of chromosome 8 predicts the response
to taxane-based neoadjuvant chemotherapy in node-positive breast
cancer. Oncol Rep. 24:121–128. 2010.PubMed/NCBI
|
|
15
|
Raeder MB, Birkeland E, Trovik J, Krakstad
C, Shehata S, Schumacher S, Zack TI, Krohn A, Werner HM, Moody SE,
et al: Integrated genomic analysis of the 8q24 amplification in
endometrial cancers identifies ATAD2 as essential to MYC-dependent
cancers. PLoS One. 8:e548732013. View Article : Google Scholar : PubMed/NCBI
|
|
16
|
Hu G, Chong RA, Yang Q, Wei Y, Blanco MA,
Li F, Reiss M, Au JL, Haffty BG and Kang Y: MTDH activation by 8q22
genomic gain promotes chemoresistance and metastasis of
poor-prognosis breast cancer. Cancer Cell. 15:9–20. 2009.
View Article : Google Scholar : PubMed/NCBI
|
|
17
|
Xie D, Nakachi K, Wang H, Elashoff R and
Koeffler HP: Elevated levels of connective tissue growth factor,
WISP-1, and CYR61 in primary breast cancers associated with more
advanced features. Cancer Res. 61:8917–8923. 2001.PubMed/NCBI
|
|
18
|
Chen PP, Li WJ, Wang Y, Zhao S, Li DY,
Feng LY, Shi XL, Koeffler HP, Tong XJ and Xie D: Expression of
Cyr61, CTGF, and WISP-1 correlates with clinical features of lung
cancer. PLoS One. 2:e5342007. View Article : Google Scholar : PubMed/NCBI
|
|
19
|
Davies SR, Watkins G, Mansel RE and Jiang
WG: Differential expression and prognostic implications of the CCN
family members WISP-1, WISP-2, and WISP-3 in human breast cancer.
Ann Surg Oncol. 14:1909–1918. 2007. View Article : Google Scholar : PubMed/NCBI
|
|
20
|
Davies SR, Davies ML, Sanders A, Parr C,
Torkington J and Jiang WG: Differential expression of the CCN
family member WISP-1, WISP-2 and WISP-3 in human colorectal cancer
and the prognostic implications. Int J Oncol. 36:1129–1136.
2010.PubMed/NCBI
|
|
21
|
Kalashnikova EV, Revenko AS, Gemo AT,
Andrews NP, Tepper CG, Zou JX, Cardiff RD, Borowsky AD and Chen HW:
ANCCA/ATAD2 overexpression identifies breast cancer patients with
poor prognosis, acting to drive proliferation and survival of
triple-negative cells through control of B-Myb and EZH2. Cancer
Res. 70:9402–9412. 2010. View Article : Google Scholar : PubMed/NCBI
|
|
22
|
Kong X, Moran MS, Zhao Y and Yang Q:
Inhibition of metadherin sensitizes breast cancer cells to AZD6244.
Cancer Biol Ther. 13:43–49. 2012. View Article : Google Scholar : PubMed/NCBI
|
|
23
|
Song Z, Wang Y, Li C, Zhang D and Wang X:
Molecular Modification of Metadherin/MTDH impacts the sensitivity
of breast cancer to doxorubicin. PLoS One. 10:e01275992015.
View Article : Google Scholar : PubMed/NCBI
|
|
24
|
Epping MT, Meijer LA, Krijgsman O, Bos JL,
Pandolfi PP and Bernards R: TSPYL5 suppresses p53 levels and
function by physical interaction with USP7. Nat Cell Biol.
13:102–108. 2011. View Article : Google Scholar : PubMed/NCBI
|
|
25
|
Pegoraro S, Ros G, Ciani Y, Sgarra R,
Piazza S and Manfioletti G: A novel HMGA1-CCNE2-YAP axis regulates
breast cancer aggressiveness. Oncotarget. 6:19087–19101. 2015.
View Article : Google Scholar : PubMed/NCBI
|
|
26
|
Livak KJ and Schmittgen TD: Analysis of
relative gene expression data using real-time quantitative PCR and
the 2(−Delta Delta C(T)) Method. Methods. 25:402–408. 2001.
View Article : Google Scholar : PubMed/NCBI
|
|
27
|
van 't Veer LJ, Dai H, van de Vijver MJ,
He YD, Hart AA, Mao M, Peterse HL, van der Kooy K, Marton MJ,
Witteveen AT, et al: Gene expression profiling predicts clinical
outcome of breast cancer. Nature. 415:530–536. 2002. View Article : Google Scholar : PubMed/NCBI
|
|
28
|
Gevaert O, De Smet F, Timmerman D, Moreau
Y and De Moor B: Predicting the prognosis of breast cancer by
integrating clinical and microarray data with Bayesian networks.
Bioinformatics. 22:e184–e190. 2006. View Article : Google Scholar : PubMed/NCBI
|
|
29
|
Beroukhim R, Mermel CH, Porter D, Wei G,
Raychaudhuri S, Donovan J, Barretina J, Boehm JS, Dobson J,
Urashima M, et al: The landscape of somatic copy-number alteration
across human cancers. Nature. 463:899–905. 2010. View Article : Google Scholar : PubMed/NCBI
|
|
30
|
McCormick C, Leduc Y, Martindale D,
Mattison K, Esford LE, Dyer AP and Tufaro F: The putative tumour
suppressor EXT1 alters the expression of cell-surface heparan
sulfate. Nat Genet. 19:158–161. 1998. View
Article : Google Scholar : PubMed/NCBI
|
|
31
|
Brown DM and Ruoslahti E: Metadherin, a
cell surface protein in breast tumors that mediates lung
metastasis. Cancer Cell. 5:365–374. 2004. View Article : Google Scholar : PubMed/NCBI
|
|
32
|
Julien S, Ivetic A, Grigoriadis A, QiZe D,
Burford B, Sproviero D, Picco G, Gillett C, Papp SL, Schaffer L, et
al: Selectin ligand sialyl-Lewis x antigen drives metastasis of
hormone-dependent breast cancers. Cancer Res. 71:7683–7693. 2011.
View Article : Google Scholar : PubMed/NCBI
|
|
33
|
Saxena N, Banerjee S, Sengupta K, Zoubine
MN and Banerjee SK: Differential expression of WISP-1 and WISP-2
genes in normal and transformed human breast cell lines. Mol Cell
Biochem. 228:99–104. 2001. View Article : Google Scholar : PubMed/NCBI
|
|
34
|
Xie D, Yin D, Wang HJ, Liu GT, Elashoff R,
Black K and Koeffler HP: Levels of expression of CYR61 and CTGF are
prognostic for tumor progression and survival of individuals with
gliomas. Clin Cancer Res. 10:2072–2081. 2004. View Article : Google Scholar : PubMed/NCBI
|
|
35
|
Okolicsanyi RK, van Wijnen AJ, Cool SM,
Stein GS, Griffiths LR and Haupt LM: Heparan sulfate proteoglycans
and human breast cancer epithelial cell tumorigenicity. J Cell
Biochem. 115:967–976. 2014. View Article : Google Scholar : PubMed/NCBI
|
|
36
|
Khoontawad J, Hongsrichan N, Chamgramol Y,
Pinlaor P, Wongkham C, Yongvanit P, Pairojkul C, Khuntikeo N,
Roytrakul S, Boonmars T and Pinlaor S: Increase of exostosin 1 in
plasma as a potential biomarker for opisthorchiasis-associated
cholangiocarcinoma. Tumour Biol. 35:1029–1039. 2014. View Article : Google Scholar : PubMed/NCBI
|
|
37
|
Liu M, Ingle JN, Fridley BL, Buzdar AU,
Robson ME, Kubo M, Wang L, Batzler A, Jenkins GD, Pietrzak TL, et
al: TSPYL5 SNPs: Association with plasma estradiol concentrations
and aromatase expression. Mol Endocrinol. 27:657–670. 2013.
View Article : Google Scholar : PubMed/NCBI
|
|
38
|
Lyu JH, Park DW, Huang B, Kang SH, Lee SJ,
Lee C, Bae YS, Lee JG and Baek SH: RGS2 suppresses breast cancer
cell growth via a MCPIP1-dependent pathway. J Cell Biochem.
116:260–267. 2015. View Article : Google Scholar : PubMed/NCBI
|
|
39
|
Lee SG, Su ZZ, Emdad L, Sarkar D and
Fisher PB: Astrocyte elevated gene-1 (AEG-1) is a target gene of
oncogenic Ha-ras requiring phosphatidylinositol 3-kinase and c-Myc.
Proc Natl Acad Sci USA. 103:17390–17395. 2006. View Article : Google Scholar : PubMed/NCBI
|
|
40
|
van de Vijver MJ, He YD, van't Veer LJ,
Dai H, Hart AA, Voskuil DW, Schreiber GJ, Peterse JL, Roberts C,
Marton MJ, et al: A gene-expression signature as a predictor of
survival in breast cancer. N Engl J Med. 347:1999–2009. 2002.
View Article : Google Scholar : PubMed/NCBI
|
|
41
|
Ciró M, Prosperini E, Quarto M, Grazini U,
Walfridsson J, McBlane F, Nucifero P, Pacchiana G, Capra M,
Christensen J and Helin K: ATAD2 is a novel cofactor for MYC,
overexpressed and amplified in aggressive tumors. Cancer Res.
69:8491–8498. 2009. View Article : Google Scholar : PubMed/NCBI
|
|
42
|
Caron C, Lestrat C, Marsal S, Escoffier E,
Curtet S, Virolle V, Barbry P, Debernardi A, Brambilla C, Brambilla
E, et al: Functional characterization of ATAD2 as a new
cancer/testis factor and a predictor of poor prognosis in breast
and lung cancers. Oncogene. 29:5171–5181. 2010. View Article : Google Scholar : PubMed/NCBI
|
|
43
|
Hsia EY, Kalashnikova EV, Revenko AS, Zou
JX, Borowsky AD and Chen HW: Deregulated E2F and the AAA+
coregulator ANCCA drive proto-oncogene ACTR/AIB1 overexpression in
breast cancer. Mol Cancer Res. 8:183–193. 2010. View Article : Google Scholar : PubMed/NCBI
|
|
44
|
Gudas JM, Payton M, Thukral S, Chen E,
Bass M, Robinson MO and Coats S: Cyclin E2, a novel G1 cyclin that
binds Cdk2 and is aberrantly expressed in human cancers. Mol Cell
Biol. 19:612–622. 1999. View Article : Google Scholar : PubMed/NCBI
|
|
45
|
Li Z, Meng Q, Yu Q, Zhou Z and Li L:
Evaluation of c-myc and CCNE2 amplification in breast cancer with
quantitative multi-gene fluorescence in-situ hybridization.
Zhonghua Bing Li Xue Za Zhi. 43:455–458. 2014.(In Chinese).
PubMed/NCBI
|
|
46
|
Caldon CE, Sergio CM, Kang J,
Muthukaruppan A, Boersma MN, Stone A, Barraclough J, Lee CS, Black
MA, Miller LD, et al: Cyclin E2 overexpression is associated with
endocrine resistance but not insensitivity to CDK2 inhibition in
human breast cancer cells. Mol Cancer Ther. 11:1488–1499. 2012.
View Article : Google Scholar : PubMed/NCBI
|
|
47
|
Rogers S, Gloss BS, Lee CS, Sergio CM,
Dinger ME, Musgrove EA, Burgess A and Caldon CE: Cyclin E2 is the
predominant E-cyclin associated with NPAT in breast cancer cells.
Cell Div. 10:12015. View Article : Google Scholar : PubMed/NCBI
|