Introduction
Despite a large attrition rate primarily due to
their lack of predictivity for in vivo activity, 2D cellular
assays of pharmacological efficacy, including cytotoxicity
assessment, have been extensively used to evaluate novel candidate
anticancer drugs at the preclinical stage (1). However, the development and use of 3D
models that reproduce the spatial organization of normal or tumor
tissue as closely as possible is necessary (2).
Tumor spheroids are of great interest in overcoming
this limitation as they recapitulate numerous key features of
tissue, thus providing accurate predictions of drug activity in
vivo (3,4). Spheroids are either grown in suspension,
or in natural or synthetic matrices, and each method has its own
respective advantages and disadvantages (5). Liquid-based growth allows very precise
control of spheroid size, dynamic control of culture media and is
adapted to low-throughput imaging and analytical methods. However,
this method of growth does not allow control of the physical and
mechanical properties of the environment. By contrast,
scaffold-based culture methods allow for easy handling and offer
precise environmental control of growth conditions and
compatibility with high-throughput screening. However, one
technical limitation of the latter method is the heterogeneity of
the size of spheres grown in the matrix. This factor results in
imaging being limited when using classical microscopy and
difficulties in quantifying the effect.
Due to innovations in hydrogel chemistry, a number
of options are currently available that provide researchers with
synthetic and natural matrices partially mimicking in vivo
extracellular matrix (6). These may
be used in tissue engineering as well as to evaluate the growth of
3D cell aggregates (7,8). Drug activity evaluation in medium-scale
assays using multiwell plates containing such matrices often relies
on a global assessment of the effects by a cell viability readout.
Consequently, these approaches do not allow researchers to consider
and explore the 3D aspect of the response to drug treatment,
thereby restricting the parameters that may be analyzed and the
possibility of investigating the mechanisms of action of a given
candidate drug. A major limitation of fast imaging with wide-field
fluorescence microscopy is the poor quality of the images obtained.
However, the use of 3D imaging strategies, including confocal and
two-photon microscopy, results in a substantial increase in
acquisition time, as well as laser illumination-induced bleaching.
The poor quality of images obtained by conventional wide-field
fluorescence microscopy is due to out-of-focus light; spheres
located throughout the matrix are illuminated, therefore those
above or below the imaging plane appear highly blurred. Structured
illumination using ApoTome technology fitted on a conventional
wide-field fluorescence microscope enables researchers to obtain
images with similar resolution to confocal microscopy (9). The principle is based on projecting a
grid onto the in-focus plane of the sample and acquiring at least
three raw images with the grid in three different positions in
order to identify in-focus areas (10). Combining the three raw images results
in a very clear single image, with no out-of-focus fluorescence
signal.
Thus, to fully exploit the potential of an
experimental approach based on evaluating drug activity on tumor
spheres grown in 3D matrices, it is necessary to develop robust and
calibrated procedures allowing for perfectly controlled microscopic
imaging conditions and accurate quantitative assessment of growth
parameters. The present study aimed to develop the necessary 3D
imaging and quantitative characterization methods capable of
measuring the features of individual tumor spheres in a large
volume of matrix.
Materials and methods
Cell culture and pharmacological
treatments
Human HCT116 colorectal cancer cells (ATCC;
Teddington, UK) were cultured in Dulbecco's modified Eagle's medium
(DMEM) + Glutamax™ (Thermo Fisher Scientific, Inc., Waltham, USA)
containing 10% fetal calf serum (Thermo Fisher Scientific, Inc.)
with penicillin/streptomycin (Sigma-Aldrich, St. Louis, MO, USA) in
a humidified atmosphere of 5% CO2 at 37°C. A suspension
of cells was inoculated in Biomimesys® (Celenys, Rouen,
France), commercially available 96-well plates containing a
hyaluronic acid matrix. A total of 50,000 cells were seeded in 25
µl of culture media per well. Following incubation at 37°C, in 5%
CO2 for 30 min, 175 µl of culture media was added to
each well. After 3 days, half of the volume of the culture medium
was renewed. Six days following cell seeding, 100 µl of culture
media per well was replaced by 100 µl of culture media containing a
2X topotecan concentration (Sigma-Aldrich, St. Louis, MO, USA). On
each plate, 6 different concentrations were applied with 6 wells
treated per concentration. Plates were fixed 72 h following
treatment.
4′,6-diamidino-2-phenylindole (DAPI)
staining
Hydrogel matrices were fixed for 15 min at room
temperature with 4% paraformaldehyde in phosphate-buffered saline
(PBS). Following 3 washes in PBS, the samples were permeabilized
for 6 min in 0.5% Triton X-100 solution, washed 3 times in PBS and
subsequently incubated with 1 µg/ml DAPI fluorescent nuclear stain
for 10 min prior to PBS wash.
Image acquisition
Image acquisition was performed using an inverted
widefield fluorescence microscope, Axio Observer. Z1, with ApoTome
fitted with an axiocam 506 mono camera (Zeiss GmbH, Jena, Germany;
objective magnification, ×10 and numerical aperture 0.3). For each
well, 9 tiles with 10% surface overlap were acquired. For each
tile, a 400–500 µm-z stack with a 20 µm-z step was performed with 3
images corresponding to different ApoTome grid positions per z
position. A total of 9 z-stacks were acquired per well. For each
z-stack, ApoTome deconvolution was performed using ZEN software
ver. 2012 (Zeiss GmbH).
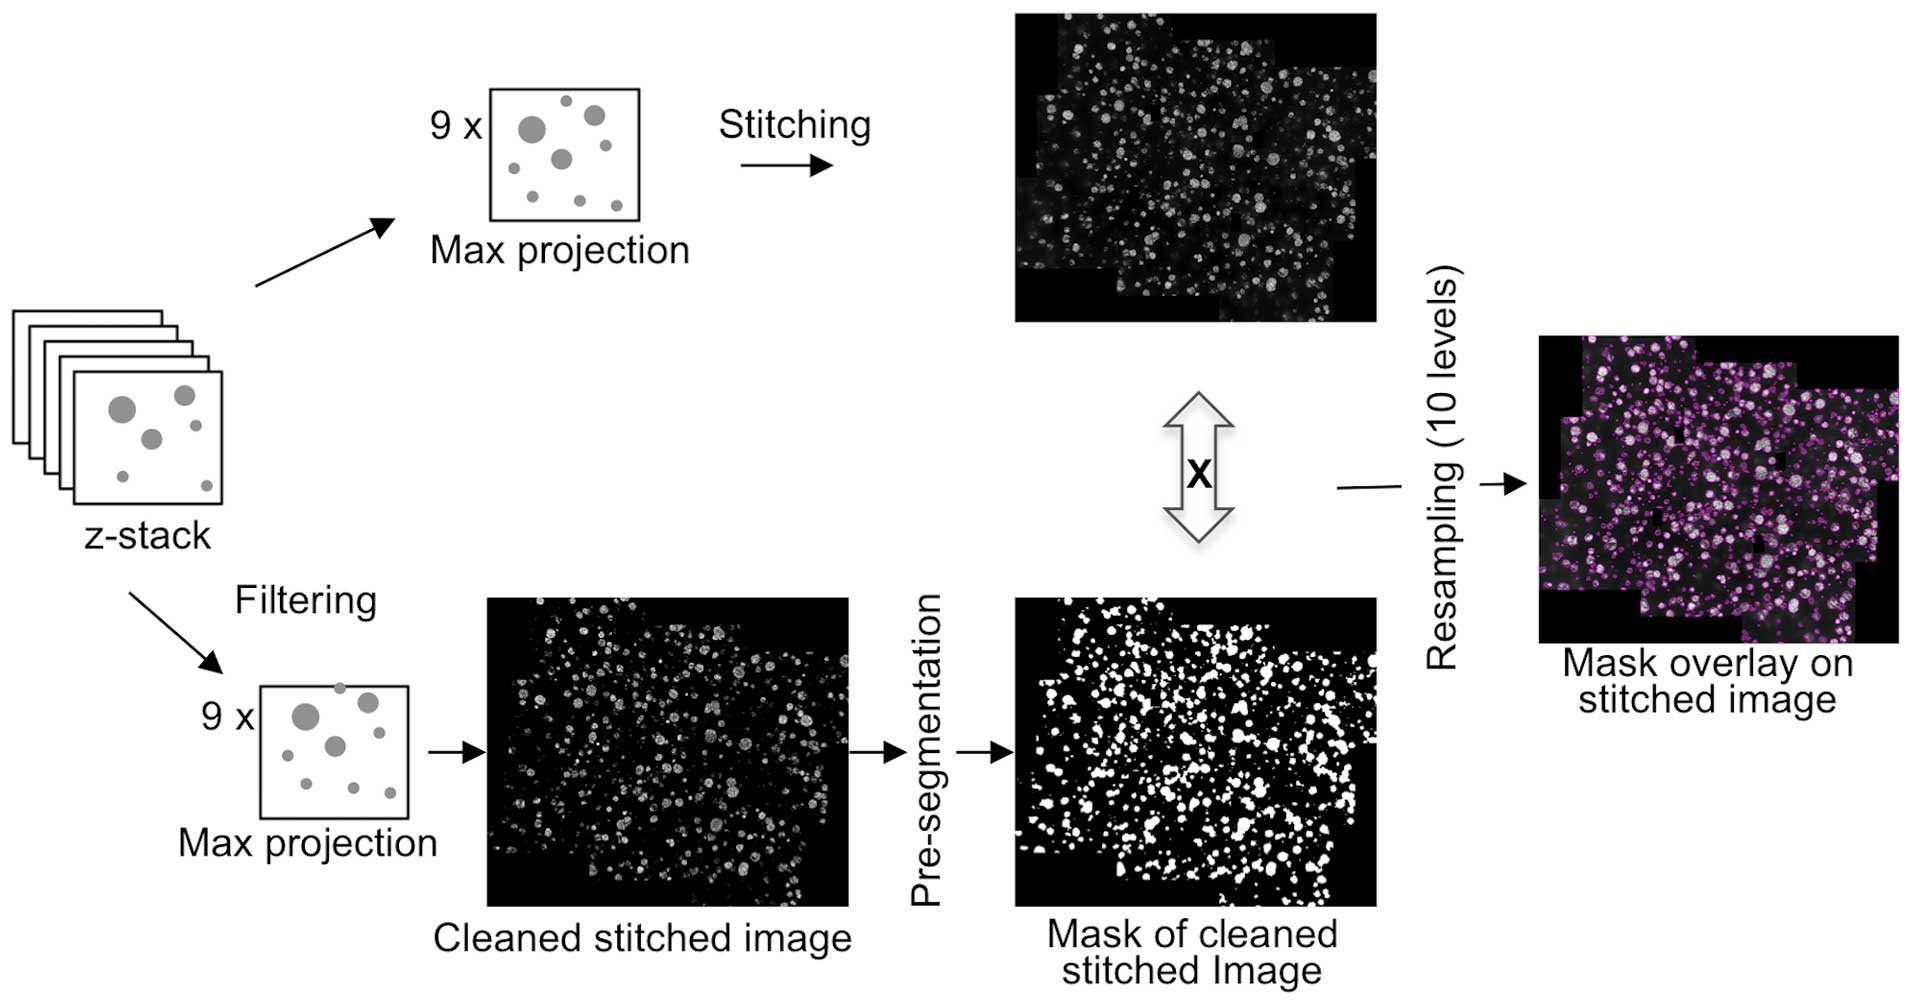
Image processing pipeline
For each z-stack, a maximum projection was performed
and the 9 images obtained per well were stitched together. Image
filtering, projections and the stitching process were executed by
an ImageJ macro running on a Dell™ T7X series Workstation equipped
with 192 GB RAM, a Xeon-phi 32 core processor and a 4 GB VRAM
NVidia Graphics card. This level of power is required to process
large batches of images (>60 megapixels per image). The stitched
images were subsequently processed using a MATLAB®
script to remove noise and background, set saturation level, and
perform Otsu's automatic threshold and morphological dilatation on
stitched images (11). Combining the
resulting binary mask with the original image made it possible to
select only those pixels corresponding to clusters along with those
in their close vicinity. This pre-segmented image was then
resampled on 10 levels of grey, with the elimination of the first
one leading to final segmentation. For the final step of the
analysis process, i.e. quantification, MATLAB's built-in methods of
clustering and quantification were used exclusively to compute the
per cluster projected area and average intensity response.
Results and Discussion
Matrix-embedded tumor multisphere
imaging in a large volume using structured illumination
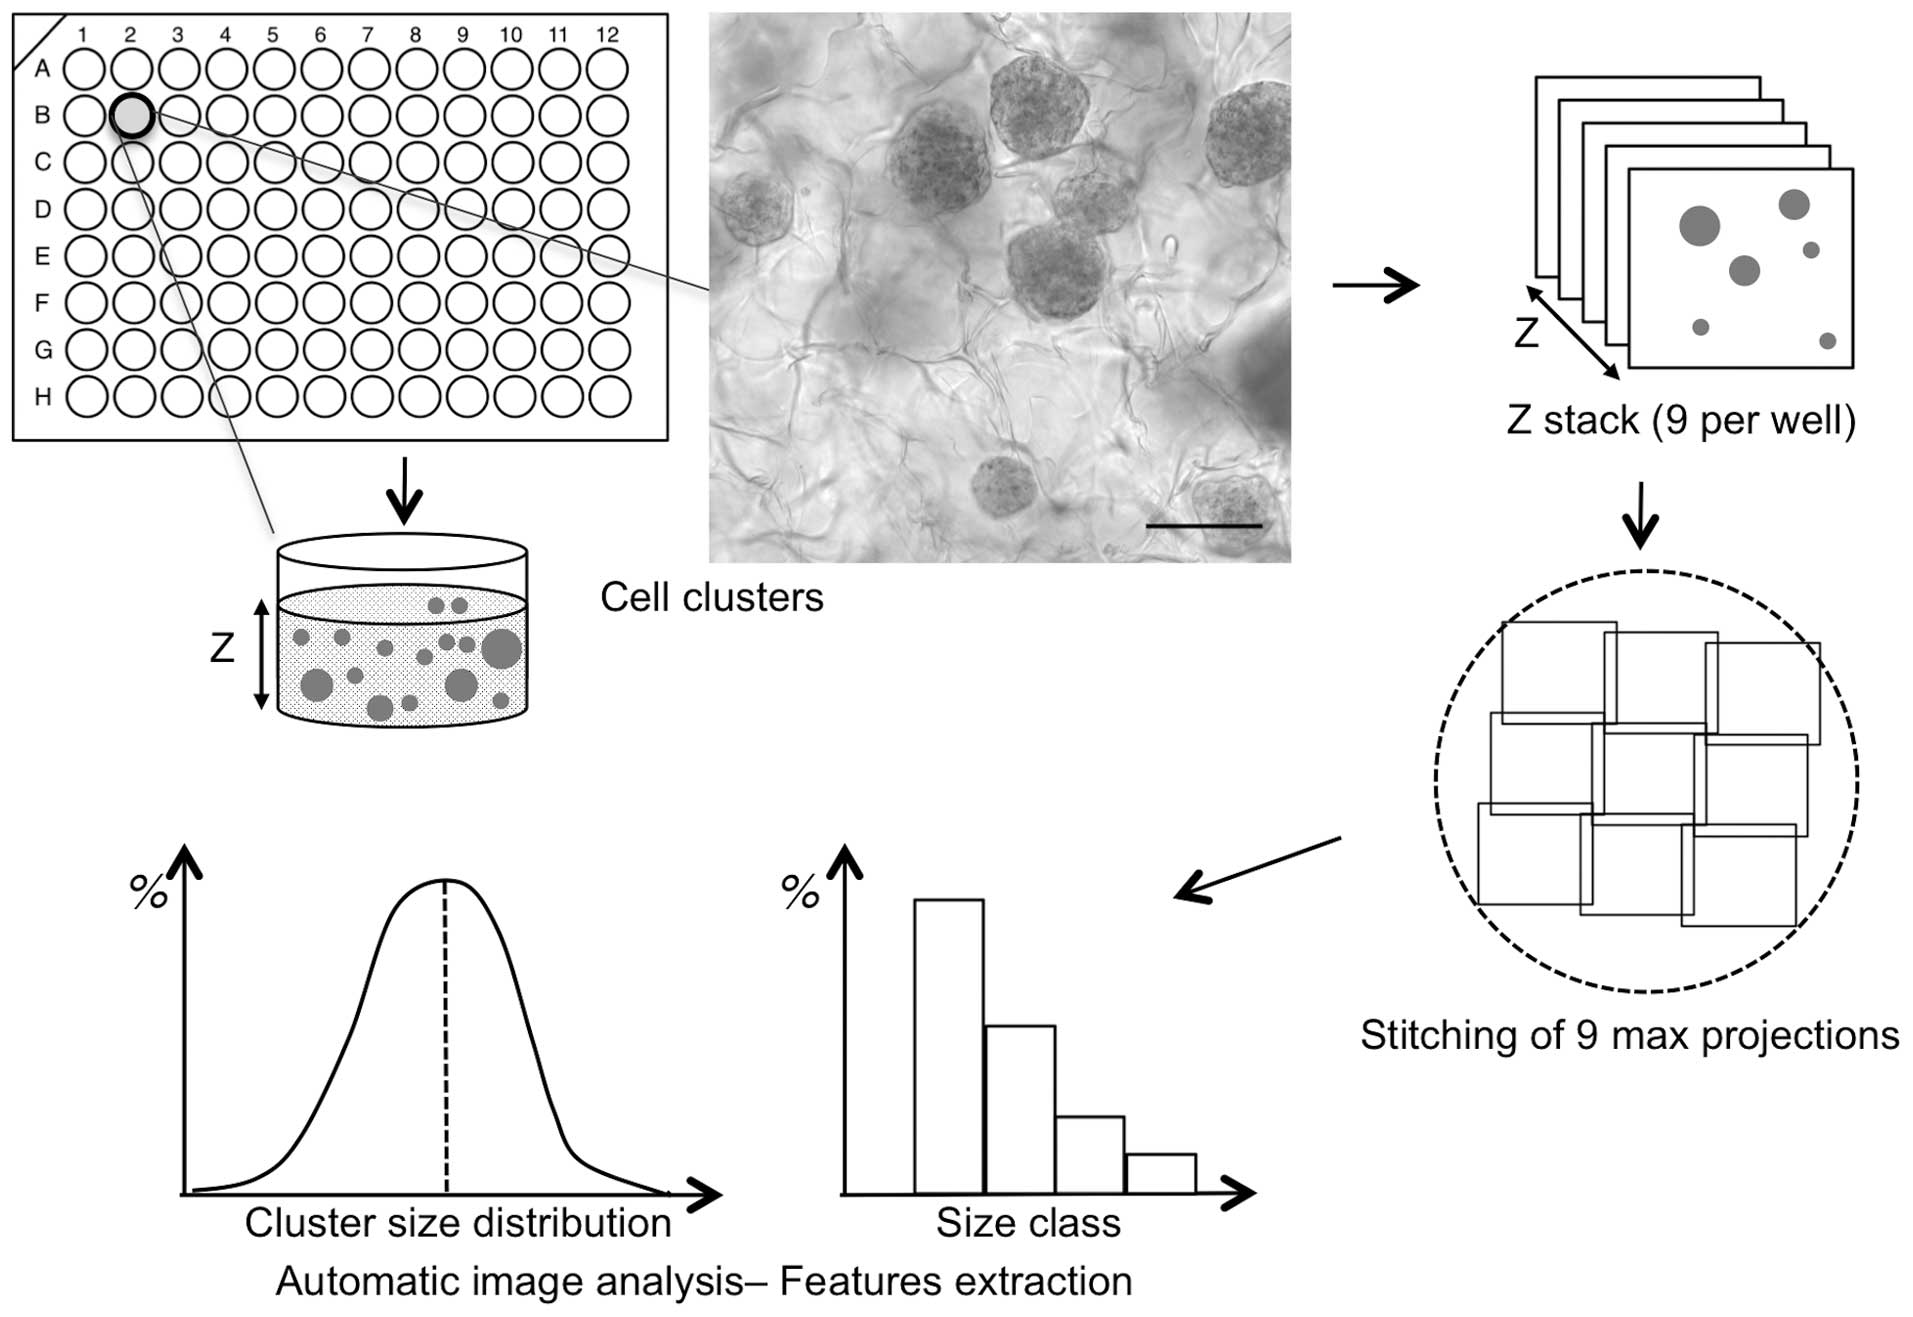
Fig. 1 summarizes the
workflow and the specific procedures reported, starting from the
seeding step of cancer cells in the matrix and 3D sphere formation
to the final results of the quantification analysis. As
illustrated, 96-well plates containing a hydrogel made of
cross-linked hyaluronic acid were seeded with HCT116 colon
adenocarcinoma cells. It has been demonstrated that cancer cells
proliferate actively in such a matrix (12), recapitulating optimal
microenvironmental conditions. After 6 days of growth, a number of
3D cell clusters of various shapes and sizes were formed and
detected under bright field microscopy (Fig. 1).
To individually characterize a large number of
spheres per well, spheres were fixed inside the matrix and stained
with DAPI to be detected by fluorescence microscopy. The aim of the
present study was to acquire images of a large number of spheres
from each of the 96 wells, therefore, multi-position 3D
fluorescence microscopy was utilised. Structured illumination was
used with an ApoTome fitted to a conventional wide-field
fluorescence microscope. This technology is not based on
pixel-by-pixel scanning, therefore it allows for a much more rapid
z-stack acquisition of all in-depth information from each of the 96
wells. Individual acquisitions consist of a 400–500 µm z-stack,
with each z separated by 20 µm (Fig.
1). A movie (available for download at https://mycore.core-cloud.net/public.php?service=files&t=bcd82c01cd45e93c3c55ce5e175cd7cb)
presents a z-stack acquisition of a field of view prior to and
following ApoTome deconvolution. These data indicate that following
ApoTome deconvolution, nuclei of individual spheres are visible and
it is possible to identify each sphere. These findings are
confirmed with the maximal projection of the z-stack (data not
shown), which makes it possible to qualitatively assess
proliferation and count the number of individual cell clusters.
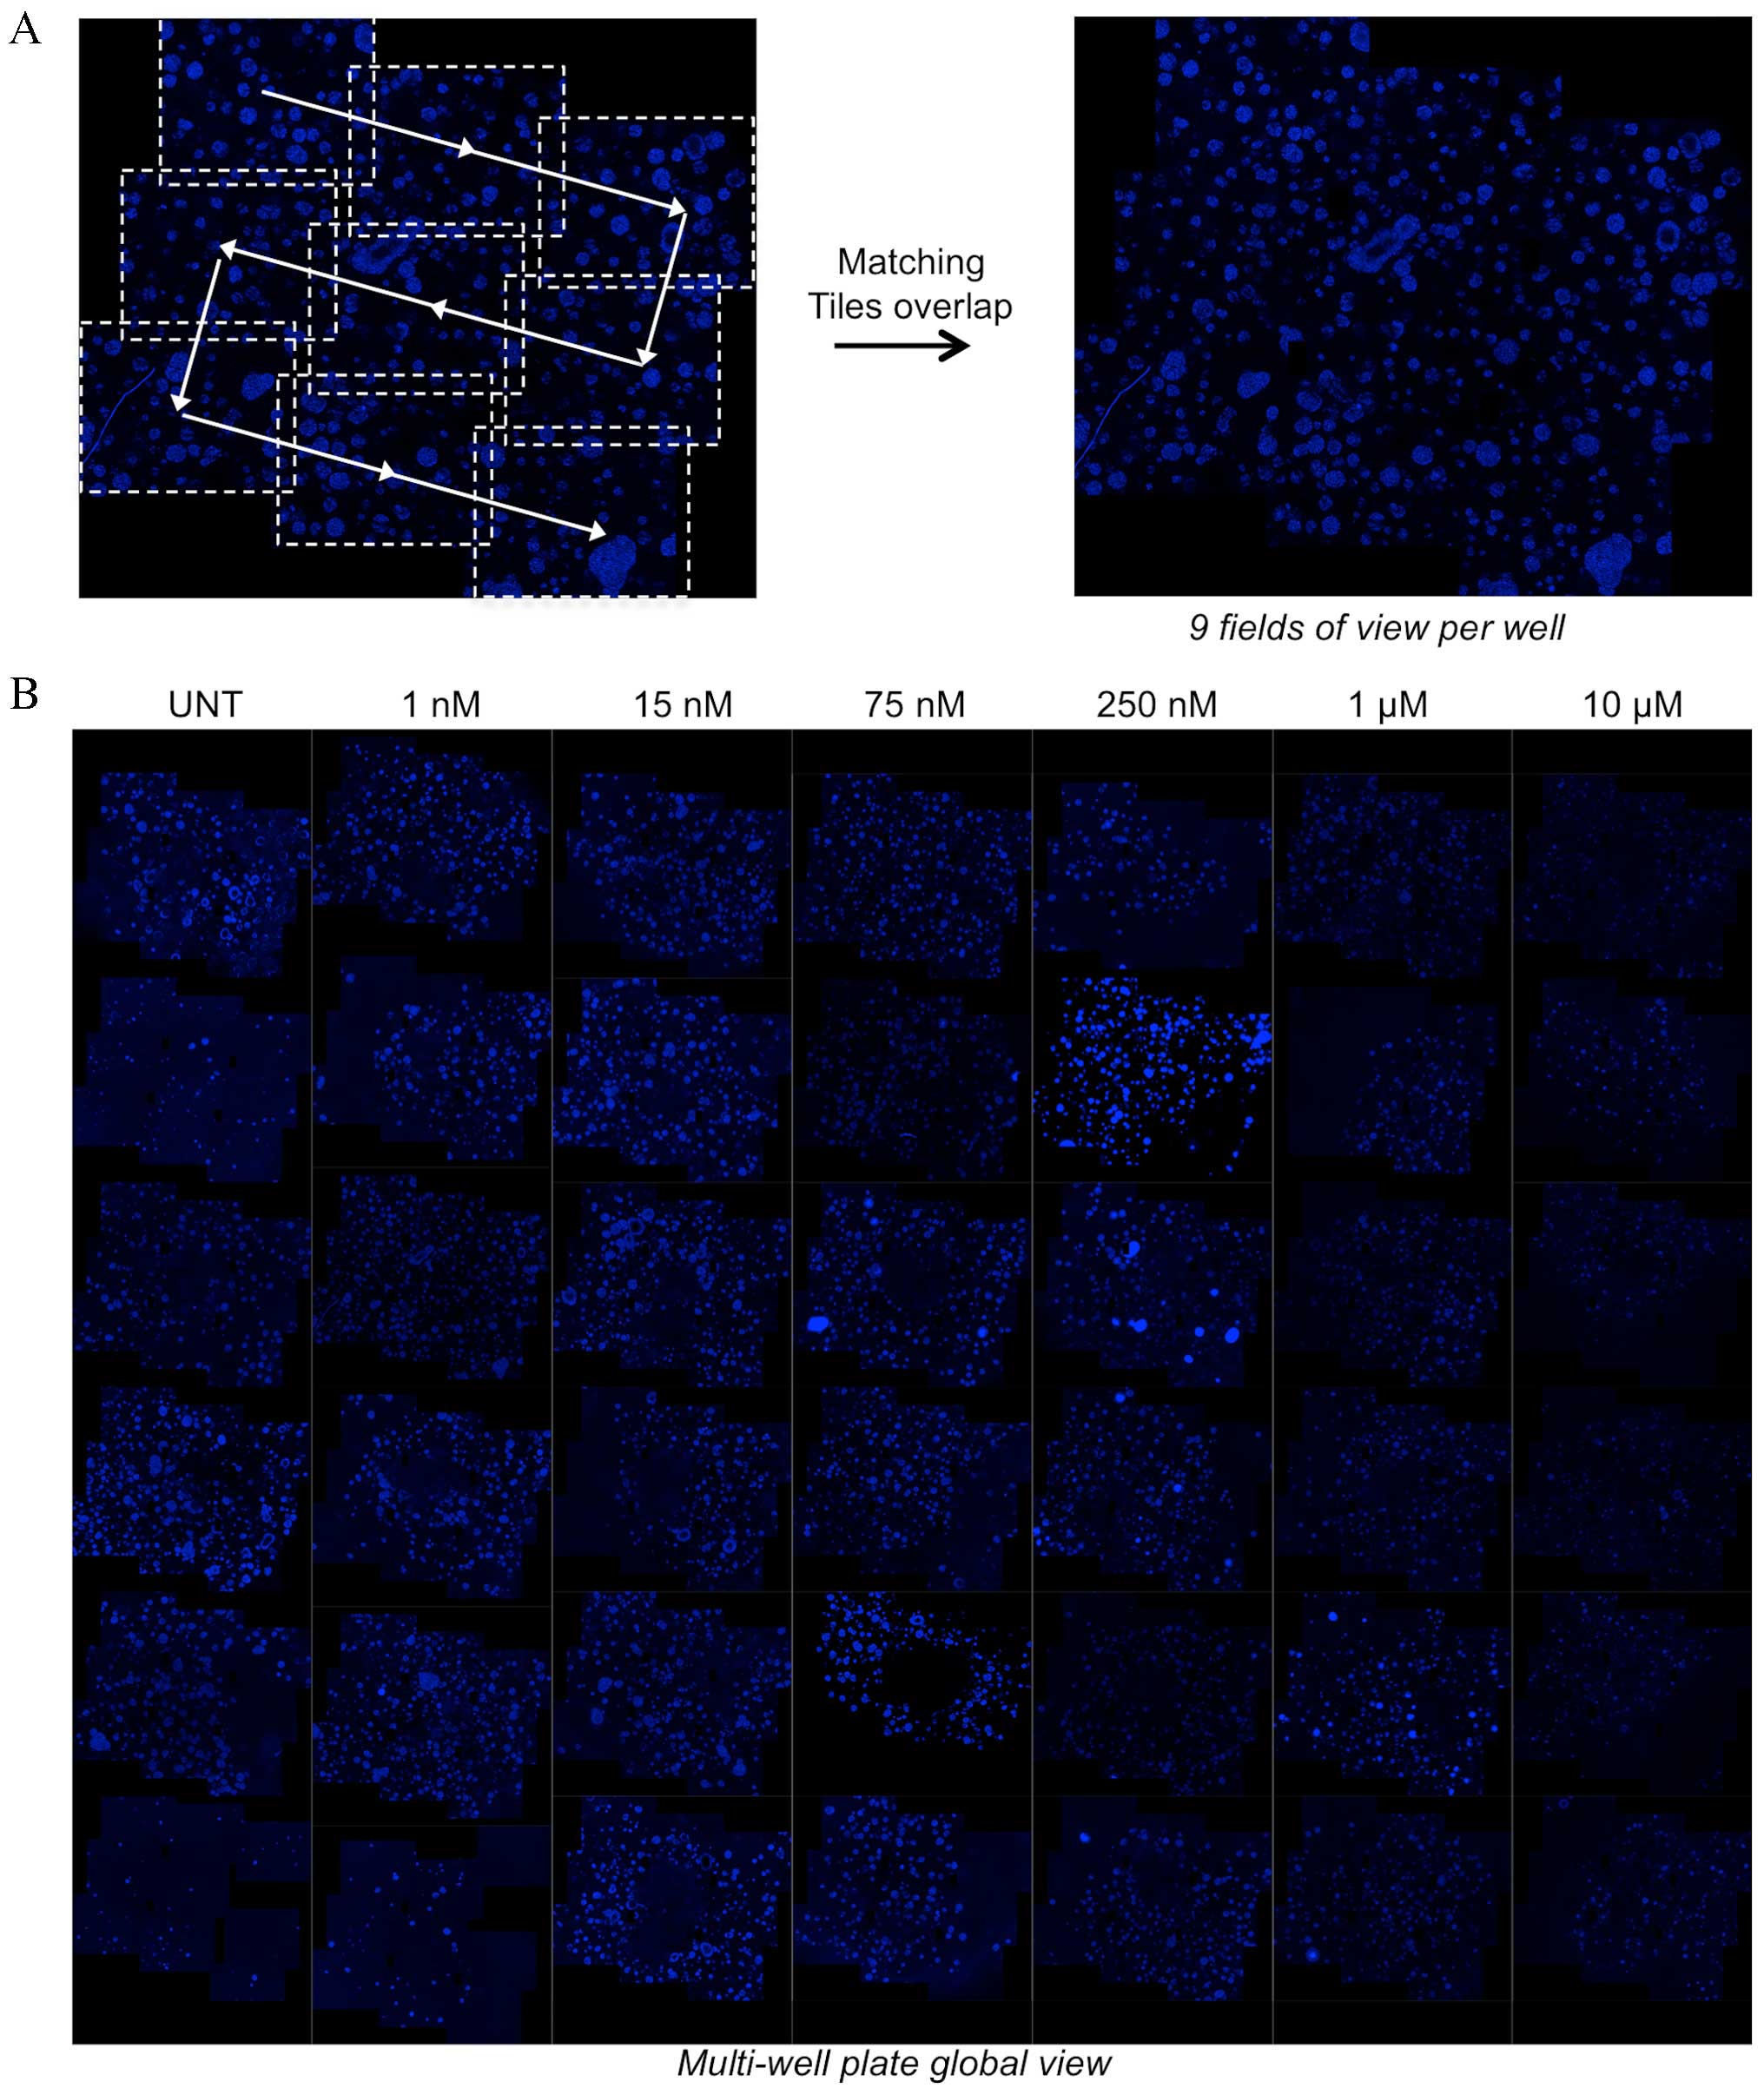
A total of 9 z-stack acquisitions were performed for
each well to avoid restricting the analysis to a single field of
view and to provide global quantitative information (Figs. 1 and 2A). The nine 400 µm z-stack acquisitions
with ApoTome covered half of the well area and made it possible to
identify each sphere in the volume. To generate the global image of
each micro-well (Fig. 2A), the
z-stacks of the 9 overlapping tiles of each well were stitched
together using a previously described procedure (13). This procedure was applied to wells
treated with increasing doses of the DNA topoisomerase inhibitor,
topotecan. A total of 6 concentrations were used and 6 wells were
treated for each concentration. The stitched images obtained for
each well are presented in the mosaic image (Fig. 2B), which represents a virtual
multiwell plate reconstructing each well using the aforementioned
procedure and including fluorescence information for spheres
throughout the matrix in the well's central area (~13
mm2). Cluster size decreases upon treatment with higher
concentrations of topotecan, thereby making it possible to
qualitatively evaluate the effect of this drug on matrix-embedded
multispheres. This representation provides a global view of the
experiment, offering an assessment of the effect of a given
drug.
Image processing and features
extraction
Stitched images from ApoTome acquisition provided
all of the cancer cell cluster information available in each well.
However, its analysis and interpretation require further processing
(Figs. 1 and 3). To this end, a methodology was developed
based on image analysis tools and was subsequently applied to
images of the mosaic (Fig. 2B). This
provided morphometric and multiparametric quantitative data,
including cluster size distribution.
The objective was to avoid any manual threshold for
image segmentation and to use a single tool to identify large
clusters, as well as individual cells. The first step was to filter
stitched images and perform a pre-segmentation pass to eliminate
background and focus on the upper class of Otsu's segmentation
method (11). Extracted areas were
then expanded, creating a very coarse mask (binary image, Fig. 3) to identify areas of interest
containing cell clusters. Following the combination of this binary
mask with the original stitched image, the pixels corresponding to
the background were set to 0, leaving only pixels corresponding to
clusters and their near vicinity. The goal here was to avoid
removing any of the few multi-sized clusters. To account for the
variability of nuclei fluorescence intensities that disrupt
traditional segmentation algorithms and to more accurately
distinguish clusters from background noise, an intensity scale was
used, resampling in 10 levels. Finally, an additional segmentation
and refinement was performed from the 9 stitched image tiles to
obtain the boundary of each cluster (pink lines on the final image,
Fig. 3) and to extract morphometric
features.
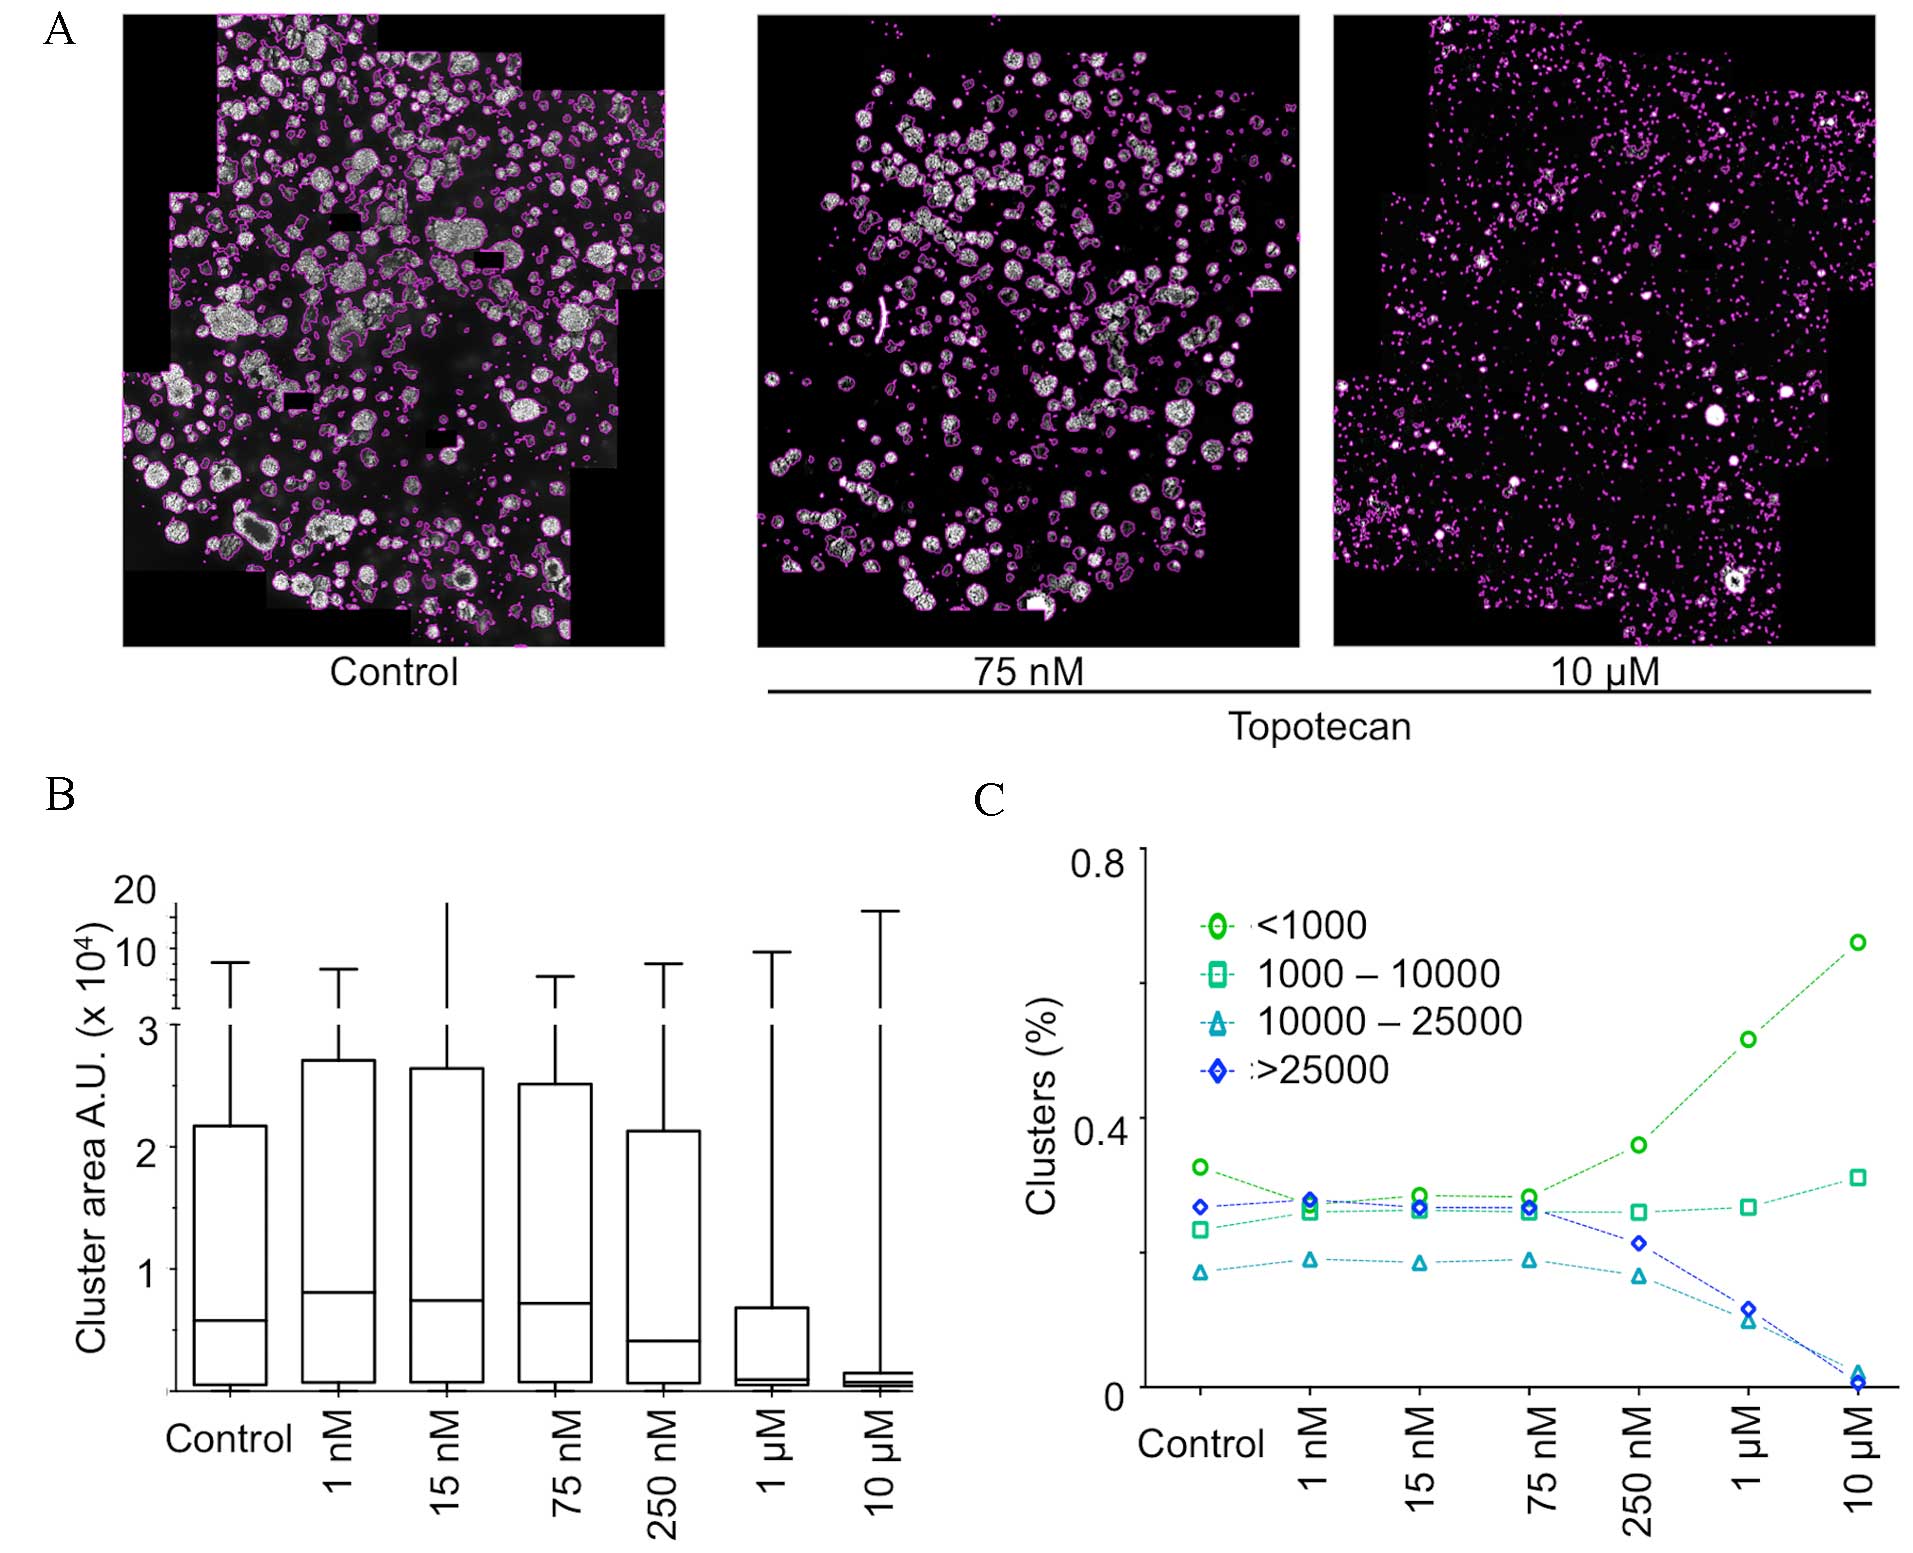
Procedure application to analyze the
cytotoxic effect of topotecan on matrix-embedded multispheres
The quantitative analysis methodology was applied to
the stitched images of the wells following topotecan treatment at
different concentrations. Fig. 4A
illustrates the result of the final segmentation performed on
cancer tumor spheroids grown in matrix in a 96-well format and
treated with increasing concentrations of the topoisomerase
inhibitor topotecan. The left panel presents an untreated control
well, where a large number of 3D clusters of various sizes were
detected and segmented. The middle and right panel show wells
treated, respectively, with 75 nM and 10 µM topotecan. As
evidenced, the segmentation process detects fewer and mostly
smaller clusters in a topotecan concentration-dependent manner.
Fig. 4B illustrates
the distribution of the size (median, quartile and extreme values)
of the detected clusters in these three conditions. The data show
that the median decreases in cells treated with ≥250 nM topotecan,
with a clear decrease of the interquartile range from 1 µM, thus
highlighting a marked decrease of cluster size in response to an
increasing dose of topotecan. Cluster size distribution in the
control illustrates the great heterogeneity normally observed in
such an assay. This heterogeneity is largely lost upon treatment
with topotecan and only very small clusters or single cells are
detected.
Additional parameters may be extracted from this
experiment, including the evolution of the distribution by class of
cluster size (Fig. 4C). These data
quantitatively reflect the loss of large clusters and the
accumulation of aggregates of a very small number of cells, in
cells treated with ≥250 nM.
In conclusion, these results illustrate the power of
the approach and capability of this imaging and processing pipeline
to detect and accurately quantify the effect of a compound, such as
a cytotoxic agent, on a heterogeneous cell population grown in 3D
in a hyaluronic acid matrix. Powerful methods for reconstructing
and live 3D in vivo analysis of the process of cancer cell
aggregation and growth have already been documented, however, they
rely on the use of sophisticated microscopy and/or image processing
tools (14,15). The approach reported in the present
study aims to provide a simple, robust pipeline to do so based on
technologies that are readily available to many investigators.
Acknowledgements
The present study was financially supported by the
CNRS and the University of Toulouse and by a grant (PC201410) from
ITMO Cancer AVIESAN (Alliance Nationale pour les Sciences de la Vie
et de la Santé, National Alliance for Life Sciences & Health,
Paris) within the framework of the National Cancer Plan. The
support of the ITAV imaging facility is gratefully acknowledged and
the authors wish to acknowledge the TRI-Genotoul facilities.
References
|
1
|
Ocana A, Pandiella A, Siu LL and Tannock
IF: Preclinical development of molecular-targeted agents for
cancer. Nat Rev Clin Oncol. 8:200–209. 2010. View Article : Google Scholar : PubMed/NCBI
|
|
2
|
Lee GY, Kenny PA, Lee EH and Bissell MJ:
Three-dimensional culture models of normal and malignant breast
epithelial cells. Nat Methods. 4:359–365. 2007. View Article : Google Scholar : PubMed/NCBI
|
|
3
|
Friedrich J, Ebner R and Kunz-Schughart
LA: Experimental anti-tumor therapy in 3-D: Spheroids-old hat or
new challenge? Int J Radiat Biol. 83:849–871. 2007. View Article : Google Scholar : PubMed/NCBI
|
|
4
|
Hirschhaeuser F, Menne H, Dittfeld C, West
J, Mueller-Klieser W and Kunz-Schughart LA: Multicellular tumor
spheroids: An underestimated tool is catching up again. J
Biotechnol. 148:3–15. 2010. View Article : Google Scholar : PubMed/NCBI
|
|
5
|
Thoma CR, Zimmermann M, Agarkova I, Kelm
JM and Krek W: 3D cell culture systems modeling tumor growth
determinants in cancer target discovery. Adv Drug Deliv Rev 69–70.
29–41. 2014. View Article : Google Scholar
|
|
6
|
DeVolder R and Kong HJ: Hydrogels for in
vivo-like three-dimensional cellular studies. Wiley Interdiscip Rev
Syst Biol Med. 4:351–365. 2012. View Article : Google Scholar : PubMed/NCBI
|
|
7
|
Magin CM, Alge DL and Anseth KS:
Bio-inspired 3D microenvironments: A new dimension in tissue
engineering. Biomed Mater. 11:0220012016. View Article : Google Scholar : PubMed/NCBI
|
|
8
|
Astashkina A and Grainger DW: Critical
analysis of 3-D organoid in vitro cell culture models for
high-throughput drug candidate toxicity assessments. Adv Drug Deliv
Rev 69–70. 1–18. 2014. View Article : Google Scholar
|
|
9
|
Das RK, Pal M, Barui A, Chakraborty C, Ray
AK and Chatterjee J: ApoTome to visualize E-cadherin and p63
expression in oral pre-cancer. Biotechnol J. 7:602–607. 2012.
View Article : Google Scholar : PubMed/NCBI
|
|
10
|
Gustafsson MG: Surpassing the lateral
resolution limit by a factor of two using structured illumination
microscopy. J Microsc. 198:82–87. 2000. View Article : Google Scholar : PubMed/NCBI
|
|
11
|
Otsu N: A threshold selection method from
gray-level histograms. IEEE Trans Sys Man Cyber. 9:62–66. 1979.
View Article : Google Scholar
|
|
12
|
David L, Dulong V, Le Cerf D, Cazin L,
Lamacz M and Vannier JP: Hyaluronan hydrogel: An appropriate
three-dimensional model for evaluation of anticancer drug
sensitivity. Acta Biomater. 4:256–263. 2008. View Article : Google Scholar : PubMed/NCBI
|
|
13
|
Preibisch S, Saalfeld S and Tomancak P:
Globally optimal stitching of tiled 3D microscopic image
acquisitions. Bioinformatics. 25:1463–1465. 2009. View Article : Google Scholar : PubMed/NCBI
|
|
14
|
Scherer A, Kuhl S, Wessels D, Lusche DF,
Hanson B, Ambrose J, Voss E, Fletcher E, Goldman C and Soll DR: A
computer-assisted 3D model for analyzing the aggregation of
tumorigenic cells reveals specialized behaviors and unique cell
types that facilitate aggregate coalescence. PLoS One.
10:e01186282015. View Article : Google Scholar : PubMed/NCBI
|
|
15
|
Lorenzo C, Frongia C, Jorand R, Fehrenbach
J, Weiss P, Maandhui A, Gay G, Ducommun B and Lobjois V: Live cell
division dynamics monitoring in 3D large spheroid tumor models
using light sheet microscopy. Cell Div. 6:222011. View Article : Google Scholar : PubMed/NCBI
|