Introduction
Cancer is a major public health problem and is a
leading cause of mortality worldwide (1). Annual cancer cases are predicted to rise
from 14 million in 2012 to 22 million within the next two decades
(2). In Jordan, there has been a
notable increase in the incidence and burden of cancer and,
according to the most recent report from the Jordan National Cancer
Registry, the number of new cancer cases diagnosed among Jordanians
increased by ~46% from 2000–2012 (3).
The most common types of cancer among Jordanian patients were
breast, colorectal, lung, lymphoma and urinary bladder cancer
(3). At present, epidemiological and
experimental evidence suggests an association between obesity and
increased risk of several types of cancer (4,5).
Obesity is defined as an excess accumulation of
adipose tissue in the body (6).
According to the World Health Organization (WHO), the accepted
classification of obesity for epidemiological purposes defines
overweight individuals as having a body mass index (BMI) of ≥25
kg/m2 and obese subjects as having BMI of ≥30 (7). Globally, >1.9 billion adults were
overweight and, of these, >600 million were obese in 2014
(6). At present, ~5% of cancer cases
may be directly associated with patients being overweight (8). In addition to increasing the likelihood
of developing cancer, obesity has also been associated with
increased cancer mortality (4). A
number of underlying mechanisms may mediate obesity-induced
carcinogenesis, including insulin resistance, increased
inflammation and altered adipokine secretion (5,8,9).
Adiponectin and leptin are adipokines that are
exclusively secreted by adipose tissue (10). Obesity is associated with reduced
circulating levels of secreted adiponectin and increased
circulating levels of leptin (11). A
number of studies have focused on major adipokines in association
with the risk of solid tumors (12–14).
However, few studies have evaluated the correlations between
circulating adipokine levels and the tumor characteristics of
patients at the time of diagnosis. Hepatocyte growth factor (HGF)
and its tyrosine kinase receptor, c-Met, have been associated with
the majority of human cancer types, and their expression levels
frequently correlate with poor prognosis and the presence of
metastases (15,16). Previous studies have revealed that HGF
is secreted by adipose tissue and that its circulating levels are
elevated in obese individuals (9,17).
Although a number of studies have demonstrated that HGF is an
important factor in solid tumor progression and metastasis, the
interplay between HGF and common adipokines, in terms of adiposity
and the tumor characteristics of patients with cancer at the time
of presentation, remains to be elucidated.
Obesity contributes to an increased risk of cancer
development, and it is established that adiposity alters the levels
of adipokines secreted, which promotes cancer proliferation and
dissemination (18). However, the
association between the circulating levels of adipokines in
patients with cancer at the time of diagnosis has yet to be
characterized. In addition, the associations between certain
adipokines and measures of adiposity among patients with cancer
require further study. Therefore, the purpose of the current study
was to assess plasma adipokine levels in a sample of patients
diagnosed with solid tumors, and to further assess changes to
baseline levels following the administration of chemotherapy. The
present study also assessed the correlations between the
circulating levels of selected adipokines and the tumor
characteristics and measures of adiposity at the time of diagnosis
among patients with cancer.
Materials and methods
Patients and study design
Patients with a diagnosis of solid malignancy
(described below) were recruited prospectively from the Oncology
Clinic at King Abdullah University Hospital (KAUH; Ar Ramtha,
Jordan) between June 2014 and December 2015. Types of solid cancers
diagnosed among patients in this study included colorectal, breast,
lung, testicular and gastric. The study population was composed of
adult patients (>18 years) who had a first-time diagnosis of
solid malignancy. The diagnosis of malignancy was performed using
histopathological analysis of resected tumor, biopsy or cytology
specimens at the pathology department of KAUH. The stage of the
diagnosed tumors was determined according to the
tumor-node-metastasis classification system (19). Newly diagnosed patients with cancer
who were receiving neoadjuvant chemotherapy or radiation therapy at
time of the current study were not eligible to participate. The
study sample was matched to healthy volunteers based on age, gender
and BMI. Healthy volunteers were recruited from individuals who
attended KAUH as visitors or for other purposes. All patients
provided written informed consent prior to their participation in
the study. The study was approved by the Institutional Review Board
at KAUH and the Jordan University of Science and Technology
(research number 20140057).
Data collection and tumor
characteristics
All the relevant data for eligible patients was
collected through a detailed review of medical records and
retrieval of patient information from electronic databases at the
time of the diagnosis of malignancy. Tumor data for patients was
extracted from relevant pathology reports issued by KAUH.
Anthropometric measurements for body weight (kg), height (cm),
waist (cm) and hip (cm) circumferences were obtained for all
subjects according to the WHO recommendations (20). Visceral obesity was evaluated using
measurements of waist circumference and the waist-hip ratio, which
was calculated by dividing the waist circumference by the hip
circumference (18). BMI was
calculated using the standard method, in which weight in kilograms
is divided by the square of the height in meters (7). Patients were divided into groups based
on their obesity classifications (7).
WHO defines BMI classes as follows: Underweight (<18.5
kg/m2), normal (18.5–24.99 kg/m2), overweight
(≥25.00 kg/m2) and obese (≥30.00 kg/m2)
(7).
Collection and processing of
biological samples
Blood samples for the studied adipokines were
obtained at baseline level and after two months of chemotherapy
administration for patients with cancer. Baseline blood samples
were collected from eligible patients following a diagnosis of
solid malignancy and prior to surgical intervention or the
administration of chemotherapy or radiation. The second blood
sample was collected after eight weeks of administrating of the
assigned chemotherapy (21). This
time point represents an adequate trial of chemotherapy, and
clinical assessment of patients can be considered at this stage for
future decision-making (21). The
interval between the two time points of blood sampling in the
current study was hypothesized to be sufficiently long for the
detection of any alterations in the circulating levels of target
adipokines. Blood samples for all patients were obtained by
venipuncture of an antecubital vein of the forearm. Blood samples
were collected in EDTA tubes (Greiner Bio-One GmbH, Kremsmünster,
Austria) and were processed within two h of collection. Plasma
samples were prepared by double centrifugations at 3000 × g for 15
min each at room temperature (22).
Plasma aliquots were stored at −80°C until analysis.
Adipokine analysis
Plasma concentrations of adipokines were measured
using ELISA kits (Quantikine® or DuoSet®
ELISA kits; R&D Systems, Inc., Minneapolis, MN, USA), according
to the manufacturer's protocol. Analysis was performed to measure
plasma levels of human HGF (#DHG00), adiponectin (#DRP300), and
leptin (#DY398-05). The assay sensitivity was 40 pg/ml for HGF,
0.891 ng/ml for adiponectin and 31.2 pg/ml for leptin. Plasma
samples were diluted 1:200 for the quantification of adiponectin. A
standard concentration curve was produced for each ELISA plate with
the manufacturer's control solution and used to calculate plasma
concentrations in the samples assayed. Plasma samples were thawed
at 37°C immediately prior to analysis. During sample analysis,
researchers were blinded to the sample anthropometric and clinical
data. All samples were analyzed in duplicate, and a fresh aliquot
was used for each analysis with no prior freeze-thaw cycles.
Statistical analysis
Data analysis was performed using SPSS version 21.0
(IBM SPSS, Armonk, NY, USA). As the continuous variables were not
normally distributed, non-parametric statistical tests were
applied. Continuous variables were presented as medians and
interquartile ranges (IQRs) expressed by the 25th and 75th
percentiles. Categorical variables were presented as the frequency
and percentages. In order to compare between two groups, the
Mann-Whitney U test was applied for independent groups and the
Wilcoxon signed rank test was used for paired data. Kruskal-Wallis
analysis of variance was used to compare multiple independent
groups when indicated. To compare categorical variables between
groups, Pearson's χ2 test of independence was used. To
assess correlations between continuous variables, Spearman's
correlation test was applied. All P-values were two-sided at a
value of 0.05. Boxplots are non-parametric representations of
continuous data. In this type of graph, the median is presented as
a vertical line and the IQR spans from the lower to the upper edge
of the box. The whiskers above and below the box represent
non-outlying maximum and minimum data points, respectively
(23). P<0.05 was considered to
indicate a statistically significant difference.
Results
Study population
A total of 32 plasma samples were collected from
patients with cancer at the baseline level, and 2 patients
subsequently requested to withdraw their consent and not
participate in the study. Therefore, 30 samples were available for
final analysis. In total, 16 patients with cancer provided blood
samples after 8 weeks of chemotherapy (16/30). Certain patients
were unable to provide follow-up samples due to succumbing to
mortality prior to the assigned time for the second blood
withdrawal and/or due to alterations in scheduled chemotherapeutic
treatments for various reasons.
The demographic, anthropometric and
adipokine characteristics of the study population
The demographic and anthropometric characteristics
for patients with cancer (n=30) and their matched healthy controls
(n=30) are presented in Table I. The
median age for patients with cancer was 47 years (IQR, 38.8–57.5),
and the median age for healthy controls was 45 years (IQR,
38.8–56.5). The median BMI for patients with cancer was 26.5
kg/m2 (IQR, 22.4–31.4). The median waist circumference
and waist-hip ratio among cancer patients at the time of diagnosis
were 95 cm and 0.91, respectively. There were no significant
differences in all reported anthropometric measurements of general
and abdominal obesity between patients with cancer and healthy
controls (Table I). In addition,
there were no significant differences in the baseline circulating
plasma concentrations of HGF, adiponectin and leptin between
patients with cancer and healthy controls (Table I).
 | Table I.Demographic, anthropometric and basal
adipokine characteristics of study groups (n=60). |
Table I.
Demographic, anthropometric and basal
adipokine characteristics of study groups (n=60).
| Variable | Healthy controls
(n=30) | Patients with
cancer (n=30) | P-value |
|---|
| Age, years | 45
(38.75–56.5) | 47
(38.75–57.5) | 0.569 |
| Waist, cm | 87 (78–109) | 95
(86.3–103.8) | 0.312 |
| Waist-hip
ratio | 0.91
(0.82–0.99) | 0.91
(0.85–0.96) | 0.886 |
| BMI, kg/m2 | 28.52
(24.33–34.76) | 26.5
(22.4–31.4) | 0.110 |
| HGF, pg/ml | 729.98
(620.13–886.90) | 721.66
(558.43–850.59) | 0.894 |
| Adiponectin,
ng/ml | 5,152.03
(3,364.09–7,293.30) | 5,695.63
(39,94.04–7,680.45) | 0.340 |
| Leptin, pg/ml | 25,349.74
(21,355.73–29,139.97) | 22,741.41
(20,622.14–29,669.79) | 0.679 |
| Gender |
|
| 1.000 |
|
Male | 16 (53.3) | 16 (53.3) |
|
|
Female | 14 (46.7) | 14 (46.7) |
|
| Marital status |
|
| 0.431 |
|
Single | 4 (13.3) | 2 (6.7) |
|
|
Married | 26 (86.7) | 27 (90.0) |
|
|
Divorced | 0 (0.0) | 1 (3.3) |
|
| Education |
|
| 0.001a |
|
Uneducated | 2 (6.7) | 10 (33.3) |
|
| High
school | 17 (56.7) | 8 (26.7) |
|
|
Diploma | 0 (0.0) | 6 (20.0) |
|
| College
graduate | 11 (36.7) | 6 (20.0) |
|
| Smoking |
|
| 0.016a |
|
Never | 16 (53.3) | 14 (46.7) |
|
|
Past | 1 (3.3) | 9 (30.0) |
|
|
Current | 13 (43.3) | 7 (23.3) |
|
| Family history of
cancer in first-degree relatives |
|
| 0.01a |
|
Present | 10 (33.3) | 20 (66.7) |
|
|
Absent | 20 (66.7) | 10 (33.3) |
|
Analysis of baseline adipokines for
patients with cancer
Table II presents an
analysis of baseline adipokine levels and tumor characteristics for
patients with cancer. The majority of patients had a diagnosis of
colorectal carcinoma (43.3%). Other patients (33.3%) were diagnosed
with breast cancer. Other types of solid malignancies diagnosed
included lung, gastric and testicular cancer. In total, 70% of
patients had advanced-stage disease (stage III and IV) at the time
of diagnosis, and the majority of patients had lymph-node
involvement (75%) and received surgical intervention following the
diagnosis of malignancy (80%). All patients received adjuvant
chemotherapy, whereas only four patients received adjuvant
radiotherapy. An analysis of baseline adipokine levels among
patients with cancer revealed a significant difference in leptin
plasma levels according to the type of carcinoma diagnosed
(P=0.004; Table II). The median
plasma levels of HGF and adiponectin were not significantly
different among the tumor types analyzed in this study (P=0.840 and
P=0.483 for HGF and adiponectin, respectively). Baseline HGF plasma
levels differed significantly between patients diagnosed with
early-stage disease, as compared with advanced-stage disease
(P=0.044). The median HGF plasma levels were higher for patients
who presented with advanced-stage disease (median, 797.30; IQR,
628.40–958.67 pg/ml) compared with early-stage disease (median,
674.90; IQR, 493.68–742.90 pg/ml). Furthermore, baseline plasma
levels of HGF were significantly lower in patients receiving
surgical treatment compared with those who were not candidates for
surgical interventions (P=0.038). There were no significant
differences in baseline adipokine plasma levels between patients
with cancer who had lymph-node involvement at the time of
diagnosis, and those who had lymph-node negative disease (Table II).
| Table II.Adipokines and tumor characteristics
of patients with cancer at baseline (n=30). |
Table II.
Adipokines and tumor characteristics
of patients with cancer at baseline (n=30).
|
| HGF, pg/ml | Adiponectin,
ng/ml | Leptin, pg/ml |
|---|
|
|
|
|
|
|---|
| Tumor
characteristic | Median | IQR | Median | IQR | Median | IQR |
|---|
| Tumor type (no. of
patients) |
|
|
|
|
|
|
|
Colorectal (13) | 687.81 | 548.66–871.77 | 5,695.63 |
3,892.57–8,048.04 | 21,192.70 |
19,481.00–23,638.00 |
| Breast
(10) | 775.57 | 638.06–912.65 | 5,792.86 |
5,058.33–7,956.21 | 30,240.40 |
25,105.20–52,610.00 |
| Other
(7) | 713.91 | 648.85–836.69 | 4,954.11 |
3,605.30–7,388.97 | 22,496.90 |
19,888.50–2,9017.7 |
|
P-value |
| 0.840 |
| 0.483 |
| 0.004a |
|
| Stage (no. of
patients) |
|
|
|
|
|
|
| Early
(I and II) (9) | 674.90 | 493.68–742.90 | 5,210.12 |
4,307.43–7,138.86 | 29,506.80 |
22,659.90–31055.50 |
|
Advanced (III and IV)
(21) | 797.30 | 628.40–958.67 | 5,891.02 |
3,838.95–7,702.83 | 22,496.90 |
19,888.50–26,735.40 |
|
P-value |
| 0.044a |
| 0.803 |
| 0.081 |
| Lymph-node
involvement (no. of patients)b |
|
|
|
|
|
|
|
Positive (21) | 735.84 | 584.04–890.17 | 5,695.63 |
3,838.95–7,332.77 | 22,822.90 |
19,888.50–29,588.30 |
|
Negative (7) | 697.00 | 499.00–756.40 | 5,430.26 |
4,602.96–8,582.09 | 28,039.60 |
22,659.90–30,974.00 |
|
P-value |
| 0.194 |
| 0.614 |
| 0.441 |
| Surgical procedure
(no. of patients) |
|
|
|
|
|
|
| Yes
(24) | 704.81 | 546.31–799.56 | 5,695.63 |
4,112.60–7,562.70 | 23,638.00 |
20,948.20–30,770.20 |
| None
(6) | 1016.43 |
697.65–1,640.32 | 6,171.56 |
3,766.51–8,603.78 | 21,763.30 |
19,847.80–23,352.70 |
|
P-value |
| 0.038a |
| 0.959 |
| 0.120 |
Correlation analysis of baseline
adipokine levels with anthropometric parameters of patients with
cancer
The correlations between baseline adipokine levels
and anthropometric measurements among patients with cancer are
presented in Table III. There was a
significant positive correlation between plasma HGF levels and age
at diagnosis (ρ=0.432; P=0.017). In addition, a significant
positive correlation was detected between plasma leptin levels and
the BMI of patients at the time of diagnosis (ρ=0.657; P<0.001;
Table III). However, baseline HGF
and adiponectin plasma concentrations were not significantly
associated with the BMI of patients (Table III). Plasma HGF, adiponectin and
leptin levels were not significantly correlated with waist
circumference or waist-hip ratio among patients with cancer at the
baseline level (Table III).
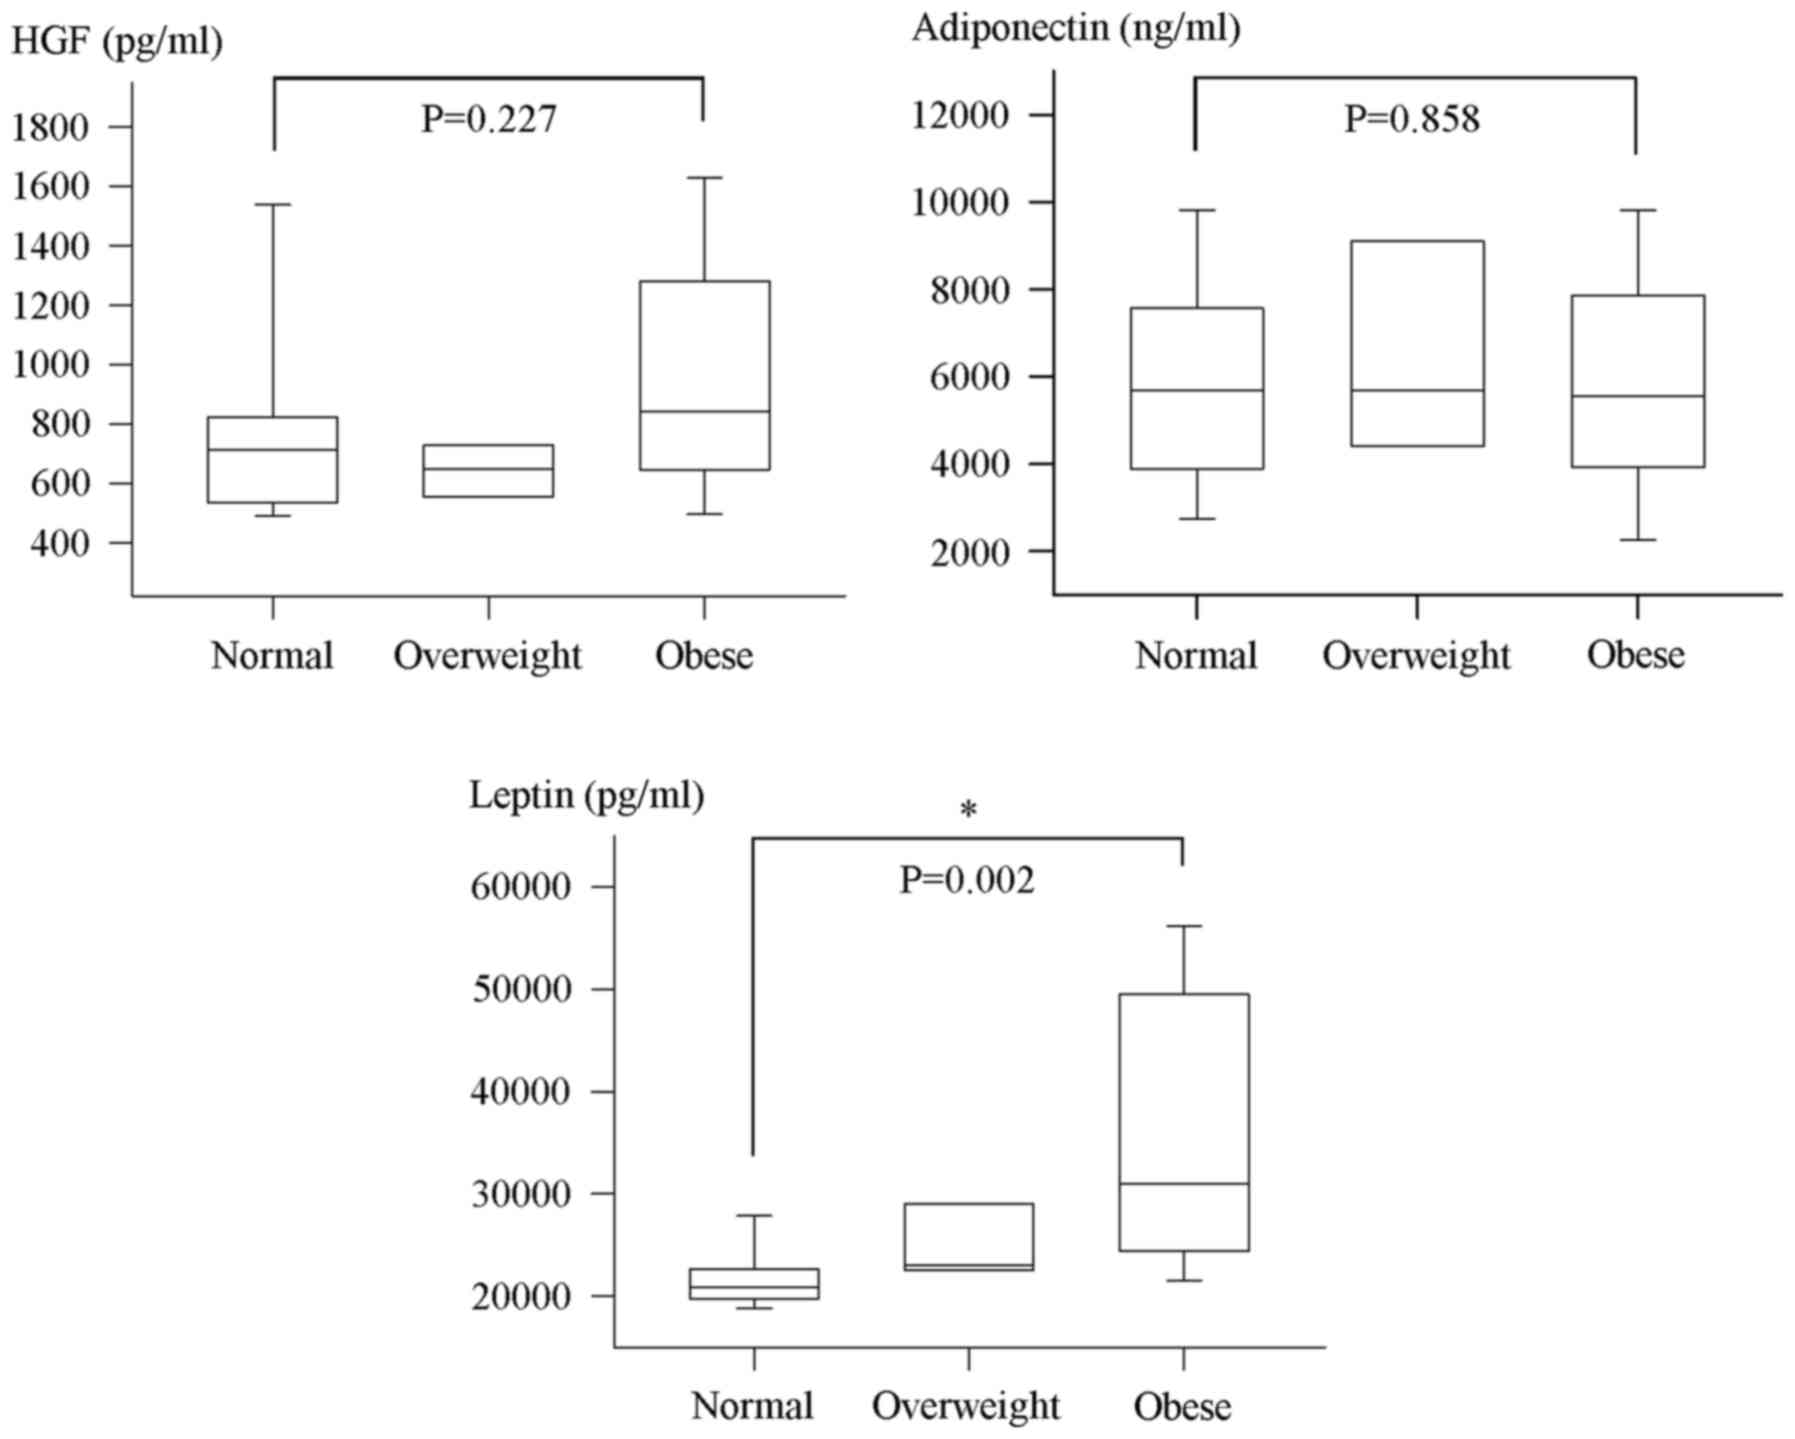
Additional multiple comparison analysis revealed a significant
difference in the median leptin plasma concentration among the
various BMI categories of patients with cancer (P=0.002; Fig. 1). In this regard, median plasma levels
of leptin at diagnosis were significantly higher for obese cancer
patients compared with patients who were of normal weights
(P=0.002; Fig. 1). However, no
significant difference was detected in median plasma HGF and
adiponectin levels between normal, overweight and obese patients at
baseline (Fig. 1). Notably, there
were no significant correlations between the baseline levels of the
evaluated adipokines (Table
III).
| Table III.Correlation analysis of baseline
adipokine levels with the anthropometric characteristics of
patients with cancer (n=30). |
Table III.
Correlation analysis of baseline
adipokine levels with the anthropometric characteristics of
patients with cancer (n=30).
|
| HGF, pg/ml | Adiponectin,
ng/ml | Leptin, pg/ml |
|---|
|
|
|
|
|
|---|
| Anthropometric
characteristic | ρ | P-value | ρ | P-value | ρ | P-value |
|---|
| Age, years | 0.432 | 0.017a | −0.144 | 0.447 | 0.079 | 0.680 |
| BMI,
kg/m2 | 0.072 | 0.704 | 0.019 | 0.921 | 0.657 |
<0.001a |
| Waist, cm | −0.093 | 0.666 | −0.211 | 0.323 | 0.118 | 0.582 |
| Waist-hip
ratio | 0.164 | 0.443 | −0.182 | 0.394 | 0.194 | 0.363 |
| HGF, pg/ml | – | – | 0.019 | 0.921 | −0.081 | 0.669 |
| Adiponectin,
ng/ml | 0.019 | 0.921 | – | – | 0.066 | 0.729 |
| Leptin, pg/ml | −0.081 | 0.669 | 0.066 | 0.729 | – | − |
Alterations in circulating adipokines
following chemotherapy in patients with cancer
In order to investigate the changes in the blood
profile levels of evaluated adipokines in patients with cancer
following an adequate trial of chemotherapy, a second blood sample
was collected after eight weeks of administration and then analyzed
for the adipokines of interest. Notably, the plasma levels of all
evaluated adipokines were increased following chemotherapy
(Table IV). However, a significant
alteration in the median plasma levels between baseline and
follow-up was observed for adiponectin only (P=0.013). The median
adiponectin plasma levels were significantly increased by 22.87% to
6,998.37 ng/ml (IQR, 4749.21–10,647.22) at follow-up among patients
with cancer (Table IV). The median
HGF and leptin plasma levels did not differ significantly between
the baseline and follow-up samples (P=0.93 and P=0.223 for HGF and
leptin levels, respectively; Table
IV). The results of Spearman's correlation analysis revealed a
significant positive correlation between baseline and follow-up
adiponectin levels (ρ=0.706; P=0.002). However, no significant
correlation was detected between the levels of HGF and leptin at
baseline and at follow-up among patients with cancer (ρ=0.365,
P=0.165 for HGF; ρ=0.144, P=0.594 for leptin). Further analysis
revealed no significant correlation between the evaluated
adipokines at follow-up. Subgroup analysis to examine whether the
levels of adipokines at follow-up predicted the patient response to
therapy was not performed due to the small sample size (n=16).
| Table IV.Variations in HGF, adiponectin and
leptin titers following chemotherapy administration in patients
with cancer (n=16). |
Table IV.
Variations in HGF, adiponectin and
leptin titers following chemotherapy administration in patients
with cancer (n=16).
|
| HGF, pg/ml | Adiponectin,
ng/ml | Leptin, pg/ml |
|---|
|
|
|
|
|
|---|
| Time point | Median | IQR | Median | IQR | Median | IQR |
|---|
| Baseline | 721.66 | 558.43–850.59 | 5695.63 |
3,994.04–7,680.45 | 22,741.41 |
20,622.14–29,669.79 |
| Follow-up | 829.12 |
651.92–1,219.27 | 6998.37 |
4,749.21–10,647.22 | 23,067.45 |
20,255.34–29,343.75 |
| Percentage change
vs. baseline |
| 14.890 |
| 22.870 |
| 1.430 |
| P-value |
| 0.930 |
| 0.013a |
| 0.223 |
Discussion
The current study assessed the circulating levels of
selected adipokines in a series of patients newly diagnosed with
solid malignancy, in order to define their correlation with tumor
characteristics and measures of adiposity. The results demonstrated
that the levels of circulating HGF, adiponectin and leptin included
in the present study did not vary between patients with cancer and
the healthy controls at the time of diagnosis. In addition, the
evaluated adipokines did not correlate with each other at baseline
or following chemotherapy among patients with cancer. The plasma
levels of HGF were significantly higher in patients with
advanced-stage disease; however, none of the circulating adipokines
evaluated in the present study were associated with lymph node
status. There was no significant difference in HGF and leptin
levels between baseline and follow-up among patients with cancer.
However, follow-up adiponectin levels differed significantly from
the baseline levels, demonstrating a positive correlation. With the
exception of leptin plasma levels, which exhibited a positive
association with BMI, the evaluated adipokines did not correlate
significantly with anthropometric parameters or the measures of
general and visceral obesity assessed in the current study.
The development and progression of cancer is
hypothesized to be a complex and multi-factorial process (5). Obesity is a global health problem
associated with a variety of metabolic diseases (24) and, at present, obesity is an
established risk factor for epithelial tumors (25–27).
Obesity is characterized as an excess of adipose tissue and defined
by a BMI ≥30 kg/m2 according to the WHO criteria
(7). Additional measures of body fat
include waist circumference and the waist-hip ratio, which are
important for the evaluation of abdominal/visceral obesity, an
additional marker of increased obesity-associated morbidity
(20). Abdominal fat mass may vary
considerably within a narrow range of total body fat and BMI
(20). Previous studies focusing on
populations that reside in the Middle East have determined cut-off
points for waist circumference and waist-hip ratio that are similar
to those suggested for Europeans (20,28,29).
According to the WHO, a waist circumference of >94 cm in men and
>80 cm in women is associated with increased risk of metabolic
complications (20). A waist-hip
ratio of ≥0.90 cm in males and ≥0.85 cm in females is also
associated with an increased risk of metabolic complications
(20). Previous epidemiological and
clinical data revealed that obesity is associated with increased
rates of colorectal, breast, renal and endometrial cancer, as well
as several other types of solid malignancy (24,25). In
addition, numerous studies have reported an association between
visceral obesity and an increased risk of solid cancer and
mortality (30–33). In the current study, baseline plasma
adipokine levels measured in patients with cancer did not
significantly differ from those of healthy controls. This finding
suggests a lack of diagnostic potential for the adipokines HGF,
adiponectin and leptin in this cohort of patients with solid
cancer.
At present, it is well established that adipose
tissue is a metabolically active endocrine organ that produces and
secretes a wide range of hormones, cytokines and inflammatory
molecules (4,10,11,17,26,34).
Adipokines refer to substances secreted from adipose tissue
(10,11,17,35) and
the obese state alters the physiological functions of adipose
tissue, leading to differing adipokine secretion and influencing
the levels and functions of a variety of adipokines (25,35).
Adiponectin and leptin are abundant adipokines secreted by adipose
tissue (10,11,17,26).
Leptin has been the focus of a number of studies as a potential
mediator of obesity-associated cancer (36,37).
Leptin actions are mediated through the transmembrane leptin
receptor, ObR (38–40). Signaling pathways activated by leptin
include the cytokine Janus kinase/signal transducer and activator
of transcription (STAT), phosphoinositide 3-kinase (PI3K) and
mitogen-activated protein kinase (MAPK) signaling cascades
(11,38–41). In
addition, leptin increases the expression levels of vascular
endothelial growth factor, promoting endothelial cell proliferation
and migration (42). Collectively,
these signaling pathways increase cancer cell proliferation,
motility and overall cancer progression (25). Previous studies revealed that
circulating leptin levels positively correlate with adiposity
(11,38). Concordant with these findings, the
results of the current study revealed that plasma leptin levels
were positively correlated with BMI among patients with cancer.
However, leptin levels did not exhibit a significant correlation
with measured parameters of visceral obesity (waist circumference
and waist-hip ratio). Although leptin levels are increased in the
obese state, clinical studies providing correlations between
circulating leptin levels and risk or prognosis among patients with
cancer revealed conflicting results (43–46). In
the present study, median plasma leptin levels exhibited
differences based on tumor type. This suggests that leptin may
serve as a potential prognostic or predictive marker for certain
types of tumor, but not for others. However, leptin levels were not
associated with tumor stage or lymph node status in the present
study.
In human serum, adiponectin exists as a low
molecular weight trimer, intermediate molecular weight hexamer and
high molecular weight multimer (47).
Adiponectin activity is mediated through its seven transmembrane
receptors, including AdipoR1 and AdipoR2 (48). Adiponectin functions via the 5′
adenosine monophosphate-activated protein kinase (AMPK), mammalian
target of rapamycin (mTOR), PI3K/protein kinase B (Akt), MAPK,
STAT, nuclear factor κB (NF-κB) and the sphingolipid metabolic
signaling pathways (11,47). At present, the results from certain
studies support the hypothesis of a protective effect for
adiponectin in cancer, through its antiproliferative and
apoptosis-inducing activities (49,50).
Previous studies have revealed that plasma adiponectin
concentrations correlate inversely with BMI (50–52).
However, in the present study, the results did not reveal a
significant association between plasma levels of adiponectin and
BMI among patients with cancer. Although adiponectin plasma levels
were inversely correlated with measures of visceral obesity, this
correlation did not reach statistical significance in the present
study. In addition, there were no significant correlations between
adiponectin plasma levels and the assessed tumor characteristics in
patients. However, adiponectin was the only adipokine in the
current study that exhibited a significant alteration in patients
with cancer, following the adequate administration of chemotherapy.
Despite the low number of subjects in the present study, these
findings may suggest that adiponectin is a potential adipokine to
evaluate during the follow-up of patients with cancer, in order to
further investigate the correlation between its plasma levels and
patient response to treatment.
Although a number of studies have focused on key
adipokines, such as adiponectin and leptin (18,53), a
number of other candidate adipokines have been investigated with
regard to adiposity and cancer (12,54). The
results of previous studies revealed that HGF is expressed and
secreted by adipocytes, qualifying it as an adipokine (9,17,55). HGF is an angiogenic growth factor
that, when bound to its receptor c-Met, promotes cancer cell
proliferation, migration, invasion and metastasis in numerous types
of solid human tumors (56,57). The biological functions of the
HGF/c-Met axis are mediated through a variety of downstream
effectors, including the RAS-MAPK and PI3K/Akt/NF-kB signaling
pathways (58,59). Circulating HGF levels have been
observed to be elevated in obese individuals, compared with those
in individuals of a normal body weight (9,26,34,60). In
the present study, no association was detected between HGF levels
and BMI or measures of visceral obesity in patients with cancer.
However, Faber et al (61)
revealed that visceral adipose tissue was significantly associated
with circulating levels of HGF, irrespective of BMI. The current
study demonstrated that increased HGF levels were associated with
advanced age among patients, and plasma HGF levels were
significantly higher in patients with cancer with advanced-stage
disease, compared with patients presenting with early-stage
disease. In this regard, the circulating levels of HGF may be
considered to evaluate the grade of malignancy and degree of
invasiveness, particularly in patients whose disease state is not
able to be determined effectively with the use of more reliable
blood markers. The results of the present study revealed no
correlation between the plasma levels of HGF and those of leptin
and adiponectin among patients with cancer.
In the present study, the interval between plasma
samples was relatively long (eight weeks). Although this time point
may provide a sufficient duration to detect alterations in
circulating adipokine levels, it is possible that early changes in
adipokine levels may have been missed in the current study.
However, a marked change in the plasma concentration of adiponectin
was detected in certain patients. This primary finding may suggest
that adiponectin levels are the most sensitive to chemotherapy;
therefore, further investigations are required to assess the
prognostic and predictive potential of this adipokine.
Although, to the best of our knowledge, this study
is the first of its type among Jordanian patients with cancer,
previous evaluations of the prognostic and predictive roles of
circulating adipokines have been conducted. Karapanagiotou et
al (62) investigated the
significance of serum adipokines as diagnostic and prognostic
markers in patients with advanced non-small cell lung cancer
(NSCLC). Data from the current study are concordant with the
results obtained by this previous study, which revealed that serum
leptin and adiponectin levels at the time of diagnosis did not
differ significantly between patients with NSCLC and healthy
controls. Although baseline serum leptin levels were significantly
associated with increased BMI among patients with lung cancer,
adiponectin levels lacked a significant correlation with BMI
(62), concordant with the data from
the current study. Additionally, consistent with the results of the
current study, Karapanagiotou et al (62) also reported increased serum levels of
leptin and adiponectin following an adequate trial of chemotherapy.
Although beyond the scope of this study, Karapanagiotou et
al (62) revealed a lack of
prognostic value for the assessed adipokines in patients with
advanced NSCLC. Concordant with these findings, a recent study by
Slomian et al (63) revealed a
significant increase in circulating levels of leptin and
adiponectin in a cohort of patients with advanced colorectal cancer
who required palliative chemotherapy.
The current study had certain limitations, including
the low number of patients enrolled and the lack of follow-up blood
sampling. The limited sample size available hindered further
subgroup analysis and sample stratification. In addition, due to
the relatively small sample size of the present study, particular
associations may not have reached the required significance
level.
In conclusion, the circulating levels of a number of
adipokines have been previously investigated in patients with
cancer; however, the current study provides additional insights
into the variations in adipokine levels over time, their
intercorrelations and the associations of these adipokines with
general measures of adiposity in patients with cancer. To the best
of our knowledge, this is the first study to assess the
correlations between circulating adipokine levels and disease
characteristics and adiposity measures among Jordanian patients
with cancer at the time of diagnosis. The findings in the current
study revealed no correlation between patient HGF, adiponectin and
leptin plasma levels at the time of diagnosis or following
chemotherapy. Circulating leptin levels were positively associated
with BMI. However, none of the measured adipokines were associated
with visceral obesity, as determined by waist circumference and
waist-hip ratio. Plasma adipokine levels increased following
chemotherapy administration; however the levels of adiponectin may
be the most reliably altered, and this adipokine requires further
evaluation for its potential role as a prognostic marker. In
addition, further studies are required to clarify the associations
between adipokines and solid tumor burden, and examine how
adipokine levels are altered upon the administration of systemic
therapy. The use of circulating adipokines as markers to stratify
patients and monitor responses to therapy may warrant further
investigation. Evaluation of specific adipokine levels may be
useful in epidemiological studies, and may improve the methods of
characterizing disease risk and response to therapy among
overweight and obese individuals.
Acknowledgements
The current study was supported by the Deanship of
Research at Jordan University of Science and Technology (grant no.
20140057). The authors would like to thank the patients who
contributed blood samples for this study and the hospital staff for
assistance with sample collection.
Glossary
Abbreviations
Abbreviations:
|
HGF
|
hepatocyte growth factor
|
|
BMI
|
body mass index
|
References
|
1
|
Siegel RL, Miller KD and Jemal A: Cancer
statistics, 2016. CA Cancer J Clin. 66:7–30. 2016. View Article : Google Scholar : PubMed/NCBI
|
|
2
|
World Health Organization (WHO), . Cancer
Fact Sheet 2015. http://www.who.int/mediacentre/factsheets/fs297/en/Accessed.
July 2–2016.
|
|
3
|
Jordan Ministry of Health (MOH), .
National Cancer Registry 2012. simplefile:///C:/Users/ws/Downloads/annual%20report-2012.pdfAccessed.
June 23–2016.
|
|
4
|
Ceschi M, Gutzwiller F, Moch H, Eichholzer
M and Probst-Hensch NM: Epidemiology and pathophysiology of obesity
as cause of cancer. Swiss Med Wkly. 137:50–56. 2007.PubMed/NCBI
|
|
5
|
Davoodi SH, Malek-Shahabi T,
Malekshahi-Moghadam A, Shahbazi R and Esmaeili S: Obesity as an
important risk factor for certain types of cancer. Iran J Cancer
Prev. 6:186–194. 2013.PubMed/NCBI
|
|
6
|
World Health Organization (WHO), . Obesity
and overweight Fact Sheet 2016. http://www.who.int/mediacentre/factsheets/fs311/en/Accessed
on. July 2–2016.
|
|
7
|
Obesity, . Preventing and managing the
global epidemic. Report of a WHO Consultation. World Health Organ
Tech Rep Ser. 894:i-xii. 1–253. 2000.
|
|
8
|
Hillon P, Guiu B, Vincent J and Petit JM:
Obesity, type 2 diabetes and risk of digestive cancer.
Gastroenterol Clin Biol. 34:529–533. 2010. View Article : Google Scholar : PubMed/NCBI
|
|
9
|
Lin JH, Gunter MJ, Manson JE, Rexrode KM,
Cook NR, Kraft P, Cochrane BB, Chlebowski RT, Ho GY and Zhang SM:
The aromatase gene (CYP19A1) variants and circulating hepatocyte
growth factor in postmenopausal women. PloS One. 7:e42079.
2012.
|
|
10
|
Fain JN, Madan AK, Hiler ML, Cheema P and
Bahouth SW: Comparison of the release of adipokines by adipose
tissue, adipose tissue matrix and adipocytes from visceral and
subcutaneous abdominal adipose tissues of obese humans.
Endocrinology. 145:2273–2282. 2004. View Article : Google Scholar : PubMed/NCBI
|
|
11
|
Vucenik I and Stains JP: Obesity and
cancer risk: Evidence, mechanisms and recommendations. Ann N Y Acad
Sci. 1271:37–43. 2012. View Article : Google Scholar : PubMed/NCBI
|
|
12
|
Assiri AM and Kamel HF: Evaluation of
diagnostic and predictive value of serum adipokines: Leptin,
resistin and visfatin in postmenopausal breast cancer. Obes Res
Clin Pract. 10:442–453. 2016. View Article : Google Scholar : PubMed/NCBI
|
|
13
|
Alshaker H, Sacco K, Alfraidi A, Muhammad
A, Winkler M and Pchejetski D: Leptin signalling, obesity and
prostate cancer: Molecular and clinical perspective on the old
dilemma. Oncotarget. 6:35556–35563. 2015.PubMed/NCBI
|
|
14
|
Lin T, Zhao X and Kong WM: Association
between adiponectin levels and endometrial carcinoma risk: Evidence
from a dose-response meta-analysis. BMJ Open. 5:e008541. 2015.
View Article : Google Scholar
|
|
15
|
Zhang YW, Su Y, Volpert OV and Woude GF
Vande: Hepatocyte growth factor/scatter factor mediates
angiogenesis through positive VEGF and negative thrombospondin 1
regulation. Proc Natl Acad Sci USA. 100:12718–12723. 2003.
View Article : Google Scholar : PubMed/NCBI
|
|
16
|
Scagliotti GV, Novello S and von Pawel J:
The emerging role of MET/HGF inhibitors in oncology. Cancer Treat
Rev. 39:793–801. 2013. View Article : Google Scholar : PubMed/NCBI
|
|
17
|
Faber DR, Moll FL, Vink A, van der Waal C,
Kalkhoven E, Schipper HS, Hajer GR, Monajemi H and Visseren FL:
Adipose tissue quantity and composition contribute to adipokine
concentrations in the subclavian vein and the inferior mesenteric
vein. Int J Obes (Lond). 36:1078–1085. 2012. View Article : Google Scholar : PubMed/NCBI
|
|
18
|
Hefetz-Sela S and Scherer PE: Adipocytes:
Impact on tumor growth and potential sites for therapeutic
intervention. Pharmacol Ther. 138:197–210. 2013. View Article : Google Scholar : PubMed/NCBI
|
|
19
|
Edge S, Byrd DR, Compton CC, Fritz AG,
Greene FL and Trotti A: AJCC cancer staging handbook from the AJCC
cancer staging manual. 7th. 2010
|
|
20
|
World HealthOrganization (WHO), .
Circumference and Waist-Hip Ratio: Report of a WHO Expert
Consultation. Geneva: pp. 8–11. 2008
|
|
21
|
Eisenhauer EA, Therasse P, Bogaerts J,
Schwartz LH, Sargent D, Ford R, Dancey J, Arbuck S, Gwyther S,
Mooney M, et al: New response evaluation criteria in solid tumours:
Revised RECIST guideline (version 1.1). Eur J Cancer. 45:228–247.
2009. View Article : Google Scholar : PubMed/NCBI
|
|
22
|
Bonen A, Campbell SE, Benton CR, Chabowski
A, Coort SL, Han XX, Koonen DP, Glatz JF and Luiken JJ: Regulation
of fatty acid transport by fatty acid translocase/CD36. Proc Nutr
Soc. 63:245–249. 2004. View Article : Google Scholar : PubMed/NCBI
|
|
23
|
Hong Y, Davis B, Marron JS, Kwitt R, Singh
N, Kimbell JS, Pitkin E, Superfine R, Davis SD, Zdanski CJ and
Niethammer M: Statistical atlas construction via weighted
functional boxplots. Med Image Anal. 18:684–698. 2014. View Article : Google Scholar : PubMed/NCBI
|
|
24
|
Dubois V, Delort L, Billard H, Vasson MP
and Caldefie-Chezet F: Breast cancer and obesity: In vitro
interferences between adipokines and proangiogenic features and/or
antitumor therapies? PloS One. 8:e585412013. View Article : Google Scholar : PubMed/NCBI
|
|
25
|
Strong AL, Burow ME, Gimble JM and Bunnell
BA: Concise review: The obesity cancer paradigm: Exploration of the
interactions and crosstalk with adipose stem cells. Stem Cells.
33:318–326. 2015. View Article : Google Scholar : PubMed/NCBI
|
|
26
|
Silha JV, Krsek M, Sucharda P and Murphy
LJ: Angiogenic factors are elevated in overweight and obese
individuals. Int J Obes (Lond). 29:1308–1314. 2005. View Article : Google Scholar : PubMed/NCBI
|
|
27
|
Moore T, Beltran L, Carbajal S, Hursting
SD and DiGiovanni J: Energy balance modulates mouse skin tumor
promotion through altered IGF-1R and EGFR crosstalk. Cancer Prev
Res (Phila). 5:1236–1246. 2012. View Article : Google Scholar : PubMed/NCBI
|
|
28
|
Lear SA, James PT, Ko GT and Kumanyika S:
Appropriateness of waist circumference and waist-to-hip ratio
cutoffs for different ethnic groups. Eur J Clin Nutr. 64:42–61.
2010. View Article : Google Scholar : PubMed/NCBI
|
|
29
|
Alberti KG, Eckel RH, Grundy SM, Zimmet
PZ, Cleeman JI, Donato KA, Fruchart JC, James WP, Loria CM, Smith
SC Jr, et al: Harmonizing the metabolic syndrome: A joint interim
statement of the international diabetes federation task force on
epidemiology and prevention; National heart, lung and blood
institute; American heart association; World heart federation;
International atherosclerosis society; and international
association for the study of obesity. Circulation. 120:1640–1645.
2009. View Article : Google Scholar : PubMed/NCBI
|
|
30
|
Moghaddam AA, Woodward M and Huxley R:
Obesity and risk of colorectal cancer: A meta-analysis of 31
studies with 70,000 events. Cancer Epidemiol Biomarkers Prev.
16:2533–2547. 2007. View Article : Google Scholar : PubMed/NCBI
|
|
31
|
Harvie M, Hooper L and Howell AH: Central
obesity and breast cancer risk: A systematic review. Obes Rev.
4:157–173. 2003. View Article : Google Scholar : PubMed/NCBI
|
|
32
|
Wierup I, Carlsson AC, Wündell P, Riserus
U, Ärnlöv J and Borné Y: Low anthropometric measures and
mortality-results from the Malmö Diet and cancer study. Ann Med.
47:325–331. 2015. View Article : Google Scholar : PubMed/NCBI
|
|
33
|
Park SW, Lee HL, Doo EY, Lee KN, Jun DW,
Lee OY, Han DS, Yoon BC, Choi HS and Lee KH: Visceral obesity
predicts fewer lymph node metastases and better overall survival in
colon cancer. J Gastrointest Surg. 19:1513–1521. 2015. View Article : Google Scholar : PubMed/NCBI
|
|
34
|
Lee SA, Kallianpur A, Xiang YB, Wen W, Cai
Q, Liu D, Fazio S, Linton MF, Zheng W and Shu XO: Intra-individual
variation of plasma adipokine levels and utility of single
measurement of these biomarkers in population-based studies. Cancer
Epidemiol Biomarkers Prev. 16:2464–2470. 2007. View Article : Google Scholar : PubMed/NCBI
|
|
35
|
Ayoub NM and Kaddoumi A: Obesity and
breast cancer: Molecular and epidemiological evidence. Journal of
Cancer Research Updates. 4:30–42. 2015. View Article : Google Scholar
|
|
36
|
Giordano C, Vizza D, Panza S, Barone I,
Bonofiglio D, Lanzino M, Sisci D, De Amicis F, Fuqua SA, Catalano S
and Andò S: Leptin increases HER2 protein levels through a
STAT3-mediated up-regulation of Hsp90 in breast cancer cells. Mol
Oncol. 7:379–391. 2013. View Article : Google Scholar : PubMed/NCBI
|
|
37
|
Huang CY, Yu HS, Lai TY, Yeh YL, Su CC,
Hsu HH, Tsai FJ, Tsai CH, Wu HC and Tang CH: Leptin increases
motility and integrin up-regulation in human prostate cancer cells.
J Cell Physiol. 226:1274–1282. 2011. View Article : Google Scholar : PubMed/NCBI
|
|
38
|
Fiorio E, Mercanti A, Terrasi M, Micciolo
R, Remo A, Auriemma A, Molino A, Parolin V, Di Stefano B, Bonetti
F, et al: Leptin/HER2 crosstalk in breast cancer: In vitro study
and preliminary in vivo analysis. BMC Cancer. 8:305. 2008.
View Article : Google Scholar : PubMed/NCBI
|
|
39
|
Alegre MM, Knowles MH, Robison RA and
O'Neill KL: Mechanics behind breast cancer prevention-focus on
obesity, exercise and dietary fat. Asian Pac J Cancer Prev.
14:2207–2212. 2013. View Article : Google Scholar : PubMed/NCBI
|
|
40
|
Ray A, Nkhata KJ and Cleary MP: Effects of
leptin on human breast cancer cell lines in relationship to
estrogen receptor and HER2 status. Int J Oncol. 30:1499–1509.
2007.PubMed/NCBI
|
|
41
|
Wang D, Chen J, Chen H, Duan Z, Xu Q, Wei
M, Wang L and Zhong M: Leptin regulates proliferation and apoptosis
of colorectal carcinoma through PI3K/Akt/mTOR signalling pathway. J
Biosci. 37:91–101. 2012. View Article : Google Scholar : PubMed/NCBI
|
|
42
|
Terrasi M, Bazan V, Caruso S, Insalaco L,
Amodeo V, Fanale D, Corsini LR, Contaldo C, Mercanti A, Fiorio E,
et al: Effects of PPARγ agonists on the expression of leptin and
vascular endothelial growth factor in breast cancer cells. J Cell
Physiol. 228:1368–1374. 2013. View Article : Google Scholar : PubMed/NCBI
|
|
43
|
Du J, Han JC, Zhang YJ, Qi GB, Zhang Y and
Li HB: Relationship between serum leptin levels and non-small cell
lung carcinoma: A meta-analysis. Genet Mol Res. 14:13699–13708.
2015. View Article : Google Scholar : PubMed/NCBI
|
|
44
|
Grossmann ME and Cleary MP: The balance
between leptin and adiponectin in the control of
carcinogenesis-focus on mammary tumorigenesis. Biochimie.
94:2164–2171. 2012. View Article : Google Scholar : PubMed/NCBI
|
|
45
|
Stolzenberg-Solomon RZ, Newton CC,
Silverman DT, Pollak M, Nogueira LM, Weinstein SJ, Albanes D,
Männistö S and Jacobs EJ: Circulating leptin and risk of pancreatic
cancer: A pooled analysis from 3 cohorts. Am J Epidemiol.
182:187–197. 2015. View Article : Google Scholar : PubMed/NCBI
|
|
46
|
Gong TT, Wu QJ, Wang YL and Ma XX:
Circulating adiponectin, leptin and adiponectin-leptin ratio and
endometrial cancer risk: Evidence from a meta-analysis of
epidemiologic studies. Int J Cancer. 137:1967–1978. 2015.
View Article : Google Scholar : PubMed/NCBI
|
|
47
|
Obeid S and Hebbard L: Role of adiponectin
and its receptors in cancer. Cancer Biol Med. 9:213–220.
2012.PubMed/NCBI
|
|
48
|
Shin E, Yu YD, Kim DS and Won NH:
Adiponectin receptor expression predicts favorable prognosis in
cases of hepatocellular carcinoma. Pathol Oncol Res. 20:667–675.
2014. View Article : Google Scholar : PubMed/NCBI
|
|
49
|
Dalamaga M, Diakopoulos KN and Mantzoros
CS: The role of adiponectin in cancer: A review of current
evidence. Endocr Rev. 33:547–594. 2012. View Article : Google Scholar : PubMed/NCBI
|
|
50
|
Delort L, Jardé T, Dubois V, Vasson MP and
Caldefie-Chezet F: New insights into anticarcinogenic properties of
adiponectin: A potential therapeutic approach in breast cancer?
Vitam Horm. 90:397–417. 2012. View Article : Google Scholar : PubMed/NCBI
|
|
51
|
Vona-Davis L and Rose DP: Adipokines as
endocrine, paracrine, and autocrine factors in breast cancer risk
and progression. Endocr Relat Cancer. 14:189–206. 2007. View Article : Google Scholar : PubMed/NCBI
|
|
52
|
Otvos L Jr, Haspinger E, La Russa F,
Maspero F, Graziano P, Kovalszky I, Lovas S, Nama K, Hoffmann R,
Knappe D, et al: Design and development of a peptide-based
adiponectin receptor agonist for cancer treatment. BMC Biotechnol.
11:90. 2011. View Article : Google Scholar : PubMed/NCBI
|
|
53
|
Lee CH, Woo YC, Wang Y, Yeung CY, Xu A and
Lam KS: Obesity, adipokines and cancer: An update. Clin Endocrinol
(Oxf). 83:147–156. 2015. View Article : Google Scholar : PubMed/NCBI
|
|
54
|
Dalamaga M: Obesity, insulin resistance,
adipocytokines and breast cancer: New biomarkers and attractive
therapeutic targets. World J Exp Med. 3:34–42. 2013. View Article : Google Scholar : PubMed/NCBI
|
|
55
|
Rehman J, Traktuev D, Li J, Merfeld-Clauss
S, Temm-Grove CJ, Bovenkerk JE, Pell CL, Johnstone BH, Considine RV
and March KL: Secretion of angiogenic and antiapoptotic factors by
human adipose stromal cells. Circulation. 109:1292–1298. 2004.
View Article : Google Scholar : PubMed/NCBI
|
|
56
|
Stein GY, Yosef N, Reichman H, Horev J,
Laser-Azogui A, Berens A, Resau J, Ruppin E, Sharan R and Tsarfaty
I: Met kinetic signature derived from the response to HGF/SF in a
cellular model predicts breast cancer patient survival. PloS One.
7:e45969. 2012. View Article : Google Scholar
|
|
57
|
Tang Z, Du R, Jiang S, Wu C, Barkauskas
DS, Richey J, Molter J, Lam M, Flask C, Gerson S, et al: Dual
MET-EGFR combinatorial inhibition against T790M-EGFR-mediated
erlotinib-resistant lung cancer. Br J Cancer. 99:911–922. 2008.
View Article : Google Scholar : PubMed/NCBI
|
|
58
|
Sattler M and Salgia R: The MET axis as a
therapeutic target. Update Cancer Ther. 3:109–118. 2009. View Article : Google Scholar : PubMed/NCBI
|
|
59
|
Lawrence RE and Salgia R: MET molecular
mechanisms and therapies in lung cancer. Cell Adh Migr. 4:146–152.
2010. View Article : Google Scholar : PubMed/NCBI
|
|
60
|
Rehman J, Considine RV, Bovenkerk JE, Li
J, Slavens CA, Jones RM and March KL: Obesity is associated with
increased levels of circulating hepatocyte growth factor. J Am Coll
Cardiol. 41:1408–1413. 2003. View Article : Google Scholar : PubMed/NCBI
|
|
61
|
Faber DR, van der Graaf Y, Westerink J,
Kanhai DA, Monajemi H and Visseren FL: SMART study Group:
Hepatocyte growth factor and interferon-γ inducible protein-10 are
related to visceral adiposity. Eur J Clin Invest. 43:369–378. 2013.
View Article : Google Scholar : PubMed/NCBI
|
|
62
|
Karapanagiotou EM, Tsochatzis EA, Dilana
KD, Tourkantonis I, Gratsias I and Syrigos KN: The significance of
leptin, adiponectin, and resistin serum levels in non-small cell
lung cancer (NSCLC). Lung cancer. 61:391–397. 2008. View Article : Google Scholar : PubMed/NCBI
|
|
63
|
Slomian G, Swietochowska E,
Malinowska-Borowska J, Kasperczyk S, Rogalska A and Nowak P:
Association between chemotherapy and plasma adipokines in patients
with colorectal cancer. Pharmacol Rep. 66:902–907. 2014. View Article : Google Scholar : PubMed/NCBI
|