Introduction
Adenocarcinoma (AC) and squamous cell carcinoma
(SCC) are two major histological types of non-small cell lung
cancer (NSCLC), and it has previously been demonstrated that their
underlying mechanisms, including tumor development, growth and
invasion, are quite different (1). In
clinical practice, however, homogeneous treatment strategies have
been traditionally implemented for each subtype (2). The poor treatment response of NSCLC may
be due to such indifferent treatment strategies for two
fundamentally different subtypes. Therefore, a better understanding
of their pathogenesis is critical for finding subtype-specific
treatment strategies. The investigation of differentially-expressed
genes (DEGs) between these two NSCLC subtypes is useful for
determining and understanding the biological differences between
these two diseases.
A number of studies exist with the objective of
identifying DEGs between AC and SCC subtypes. Such investigation
enhances our understanding of the cellular and molecular
differences between these two subtypes (3–6). However,
inconsistencies among those studies, due to small sample sizes and
different microarray platforms and analysis techniques used
(7), make the integration of results
from multiple similar studies difficult. In order to gain more
robust, reproducible and accurate results by combining multiple
studies with the same objective, meta-analysis methods have been
increasingly applied to microarray data.
For instance, previous studies obtained overall
summary statistics based on either P-values or effect sizes of each
individual study to conduct a meta-analysis (8,9). Moreover,
Choi et al (10) proposed a
novel method that combined the probability of expression (POE),
which is calculated based on the relative expression levels of one
phenotype versus the other in individual studies, and then applied
this method to identify genes capable of discriminating metastatic
and primary tumors. This so-called POE method makes direct
comparison of gene expression values from different studies more
feasible. In the present study, this method was applied to identify
DEGs between early-stage AC and SCC lung cancers.
The Gene Expression Barcode is a novel algorithm in
which the absolute expression value of a gene in a specific sample
is used to determine its expression status (11). Namely, genes are coded as expressed or
unexpressed rather than with relative expression intensity in a
specific sample by this algorithm. In this way, genes with certain
patterns, such as never/all-expressed or
subtype-specific-expressed, may be recognized more easily.
Therefore, the present study conducted a meta-analysis using the
barcode expression values of a gene, aiming to identify DEGs
between AC and SCC. To the best of our knowledge, the present study
is the first to apply the barcode method in a meta-analysis.
Previous meta-analyses on NSCLC have mainly focused
on either DEGs between NSCLC and normal controls (12–14) or
those among different clinical stages of NSCLC (15,16). In
the present analysis, however, the objective was to compare the
differential expression profile between AC and SCC of NSCLC.
Furthermore, the patients in this study were all at early clinical
stages (i.e., stage I and II).
Materials and methods
Microarray data
The Gene Expression Omnibus (GEO) database
(www.ncbi.nlm.nih.gov/geo/) was searched
using the keywords ‘non-small cell lung cancer’, ‘adenocarcinomas’,
‘squamous cell carcinomas’ and ‘Affymetrix Human Genome U133 Plus
2.0 Array’ between April 7, 2007 and October 31, 2013. Database
searches initially yielded 6 studies in total, and 5 studies
remained after duplications were removed. The abstracts were
examined carefully and studies with original experimental
objectives that analyzed the gene expression profiling between the
two major subtypes of human lung cancer were included.
Additionally, it was known from the SBV Challenge (sbvimprover.com) that partial samples in the GSE2109
dataset met the inclusion criteria (contained the keywords and met
the aforementioned abstract criteria). Finally, the study included
four experiments whose raw data were deposited in the GEO
repository under the accession numbers of GSE10245, GSE18842,
GSE2109 and GSE43580. The microarray expression data formed by
these experiments contains the expression data of 54,675 probes in
325 specimens, which consist of 164 AC and 161 SCC specimens. It is
also worth noting that all these samples were obtained from
early-stage NSCLC patients. The details for the four studies are
summarized in Table I.
 | Table I.Description of data used in the
meta-analysis. |
Table I.
Description of data used in the
meta-analysis.
| Data source | Platform | Year | Sample | AC, n | SCC, n |
|---|
| GSE10245 | GPL570 | 2008 | 58 | 40 | 18 |
| GSE18842 | GPL570 | 2009 | 46 | 14 | 32 |
| GSE2109 | GPL570 | 2004 | 71 | 33 | 38 |
| GSE43580 | GPL570 | 2013 | 150 | 77 | 73 |
Pre-processing procedures
Raw data (CEL files) of all data sets were
downloaded from the GEO repository, and expression values were
obtained using the frozen robust multiarray analysis algorithm
(17). R package
hgu133plus2.db was used to annotate the probe-set
identifications (IDs) to gene IDs. For those multiple probe-sets
that mapped to a same gene, their average values were used. To
improve the reproducibility of gene co-expression patterns across
studies, only genes that have similar inter-gene correlations
across the studies can be used for meta-analysis. The integrative
correlation coefficient (ICC) (18,19) is a
measure of cross-study reproducibility for gene expression array
data. Using the median ICCs (r=0.356) of all genes as a
threshold, 9,925 genes with higher ICCs were fed into downstream
meta-analysis.
Meta-analysis model
Let Yij represent the measured
effect for study j (j=1, … J) for a specific gene i,
let ti2 represent the variability
between studies and let σ2 represent the within-study
variance for the ith study. Yij and σ2 are
already known from previous analysis/studies (20). In a meta-analysis setting, the
following equation is used:
Yij=θij+εij,εij~N(0,σij2)θij=μi+δij,δij~N(0,τi2)
Here, µi is regarded as the average
measure of differential expression across all datasets/studies for
this gene, which is the parameter of interest. This is estimated
using the following equation:
μˆi=∑j=1Jwijyij∑j=1Jwij,se(μˆi)=1∑j=1Jwij
In this equation, wij equals the
inverse of the variance of Yij. The division of
this estimate by its estimated standard error, the resultant
Z-score, being assumed to follow a standard normal distribution, is
used to decide the statistical significance of a gene.
POE model
In the POE model, let xij denote the gene
expression measurement for gene i from sample j, and
let eij be an indicator of this value being overexpressed,
underexpressed or non-differentially expressed in one phenotype
relative to the other. xij is then assumed to follow a
uniform distribution when it is overexpressed or underexpressed,
and a normal distribution when it is non-differentially expressed.
Let pij+=P(eij=1|xij) and
pij−=P (eij=−1|xij) be the
conditional probabilities of eij being 1 and −1 given
xij, respectively. Here,
pijd=pij+-pij−
is the signed conditional probability being differentially
expressed and is termed as POE. Details on POE and on its
estimation using expectation maximization or Markov chain Monte
Carlo algorithms have been described previously (10).
Barcode model
In the barcode algorithm, the expressed genes are
coded with ones and the silenced genes are coded with zeros.
Briefly, McCall et al (21)
used a mixture model to parametrically fit observed log2
transformed intensity values (yig) for each gene.
First, they assume that yjg follows a mixture of
a silenced normal distribution of N (µg,
τg2) and an expressed uniform distribution of
U(µg, Sg) from the silenced mean to a
saturation value represented by Sg. Next, a
parametric distribution is specified for the silenced means and
variances for each gene, one coming from a normal distribution and
the other from an inverse γ distribution. To identify whether the
observed log2 expression value yig is
more likely to come from the silenced distribution or the expressed
distribution, standardized intensity value, i.e.,
(yig-µg)/τg, which follows a standard normal
distribution under the null hypothesis, was calculated. Using a
hard-threshold C, the expression barcode for a gene, a
vector of ones and zeros denoting the samples that are expressed
and silenced, was coined as follows:
big={1Φ(–(yig–μg)/τg)<;C0otherwise
Here Φ is the cumulative density function of a
standard normal distribution. The detailed description on how to
estimate the parameters has been previously described in the
supplementary material of the study by McCall et al
(21).
Dichotomization of the actual expression values of a
gene into barcoded values may result in numerous genes having the
same barcode values in almost all samples. In the present analysis,
using barcoded values, there were 6,312 genes expressed in <5%
of the total samples and 1,084 genes expressed in >95% of the
total samples. Those genes were unlikely to be DEGs and thus were
excluded from the barcode meta-analysis.
Statistical analysis
Statistical analysis was performed in the R
language, version 3.0 (www.r-project.org), and packages used were from the R
Bioconductor project (www.bioconductor.org). Gene function annotation and
pathway analysis was conducted by DAVID software (david.ncifcrf.gov). Fisher's exact test was used to
decide if a gene was differentially expressed in the barcode
meta-analysis method and I2 test was used to determine
the heterogeneity level among the five studies. P<0.05 was
considered to indicate a statistically significant difference.
Results
Study schema
Two meta-analysis methods were applied to four
independent studies, with the aim of identifying DEGs between two
major subtypes of NSCLC. The raw gene expression data had been
transformed into POE and barcode data. These two methods are
referred to as the POE meta-analysis and the barcode meta-analysis
correspondingly herein. Next, the results of the two methods were
compared and it was found that among the DEGs there were a number
of genes that were closely related with the different subtypes of
NSCLC, and that certain genes belonged to NSCLC biologically
meaningful processes.
Meta-analysis using POE values and
barcoded data
To combine gene expression data across multiple
studies using a meta-analysis, the expression values of genes were
firstly transformed to the POE statistics, as previously described
(10). In the POE model, a latent
variable eij is introduced, with −1/1 representing
underexpressed/overexpressed and 0 representing non-differentially
expressed. The POE statistics are then computed to obtain the
probability of a gene being overexpressed, underexpressed and
non-differentially expressed compared with the baseline.
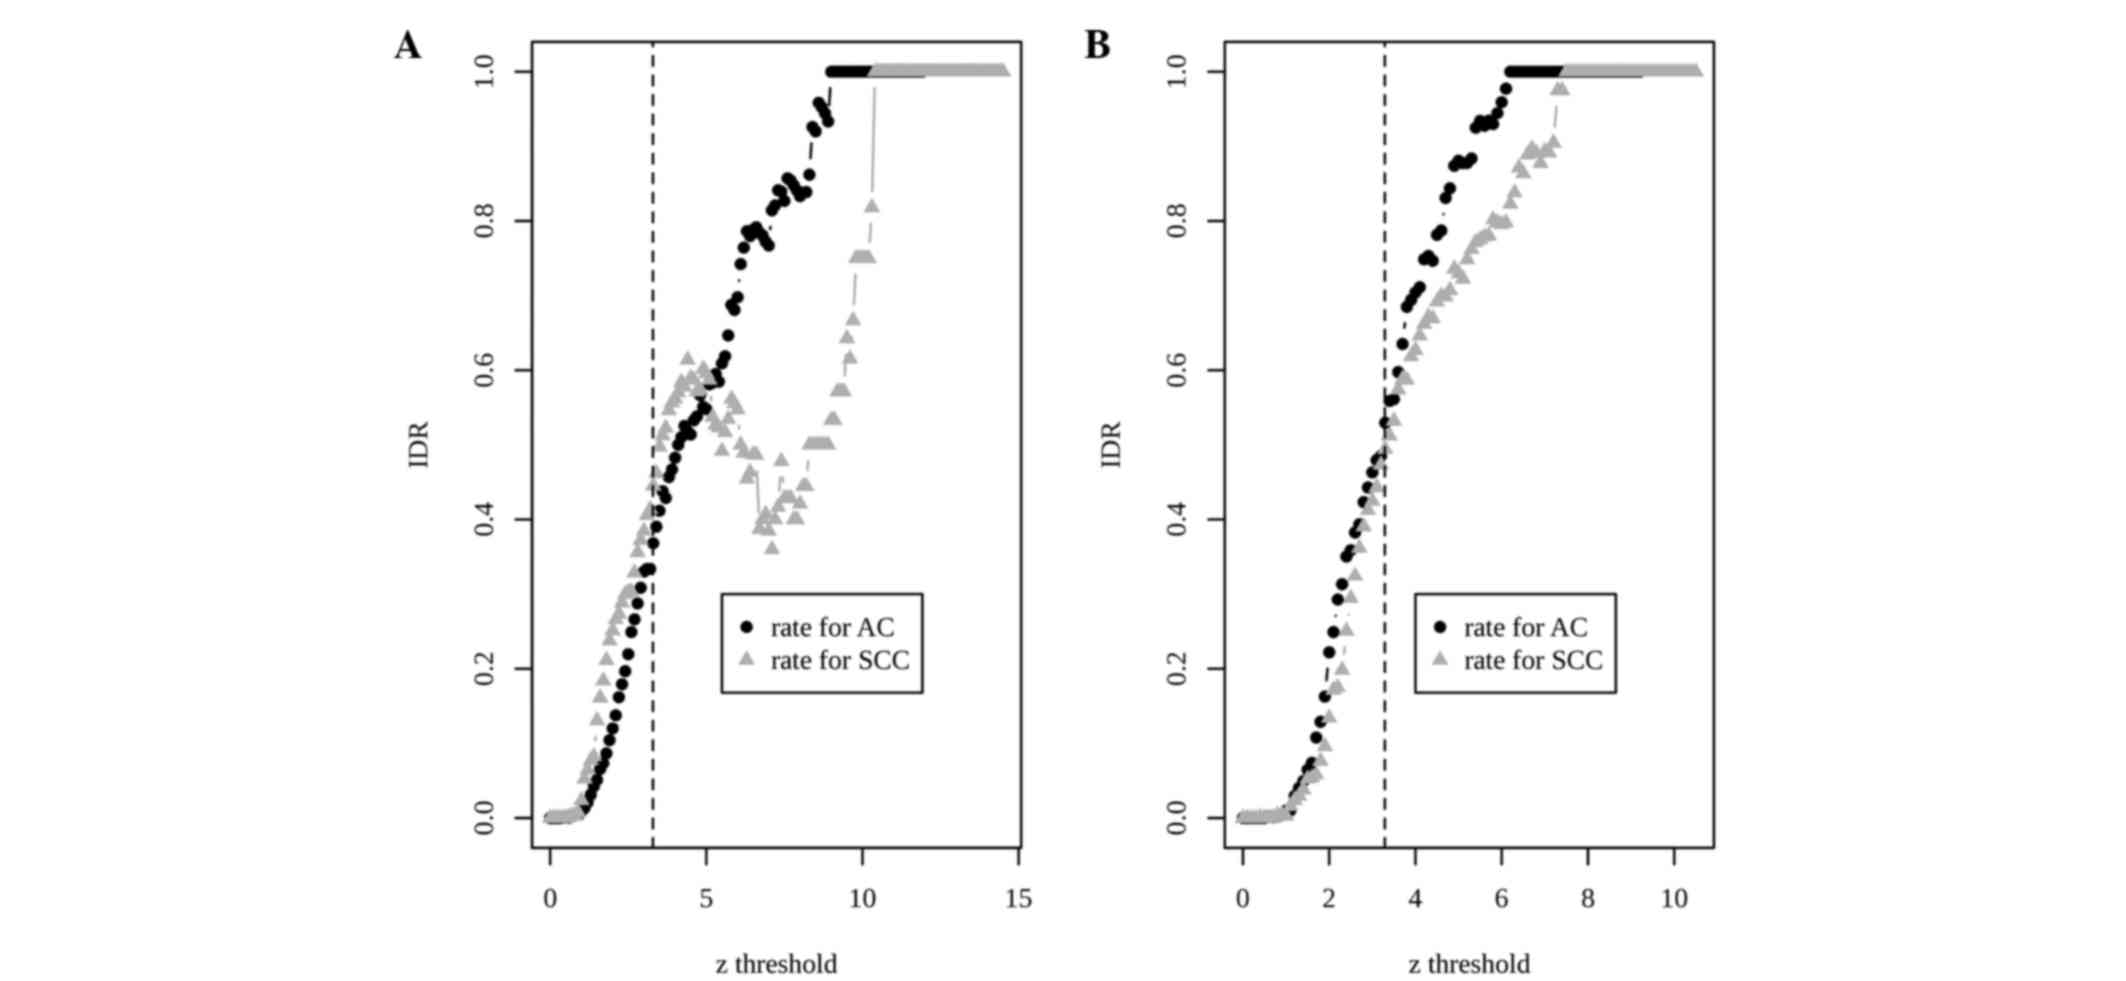
Based on Cochran's Q statistics (22) and quantile-quantile (QQ) plots (data
not shown), a random effect model (REM) was chosen and then the
z scores of effect sizes were calculated. Using a z
score (zth) of 3.29 (P=0.001) as a threshold, there were
1,318 DEGs between the two NSCLC subtypes. An integration-driven
discovery (IDD) gene (23) is a gene
that can only be found with significantly changed expression level
by meta-analysis rather than any single study at the same level of
statistical significance. Usually, IDDs are those genes exhibiting
weak but consistent signals across studies. Thus, the IDD rate
(IDR), the ratio of IDD to total discoveries, may reflect the
statistical power of a meta-analysis to gain extra information
compared with single-study analysis. In the POE meta-analysis, IDD
genes accounted for 36% of the 813 upregulated genes in the AC
subtype and for 44% of the 505 upregulated genes in the SCC subtype
(Fig. 1A).
For barcoded data, Cochran's Q statistics were again
calculated and a QQ plot was made. Based on the QQ plot, an REM was
chosen. Due to the dichotomous feature of barcoded values, the
effect size is chosen as the odds ratio on log scale. At the same
threshold of z score (zth=3.29), the barcode
meta-analysis identified 720 DEGs with 287 overexpressed and 433
underexpressed genes in AC compared with SCC. The IDRs using
barcode data increased to 53 and 50% in the AC and SCC upregulated
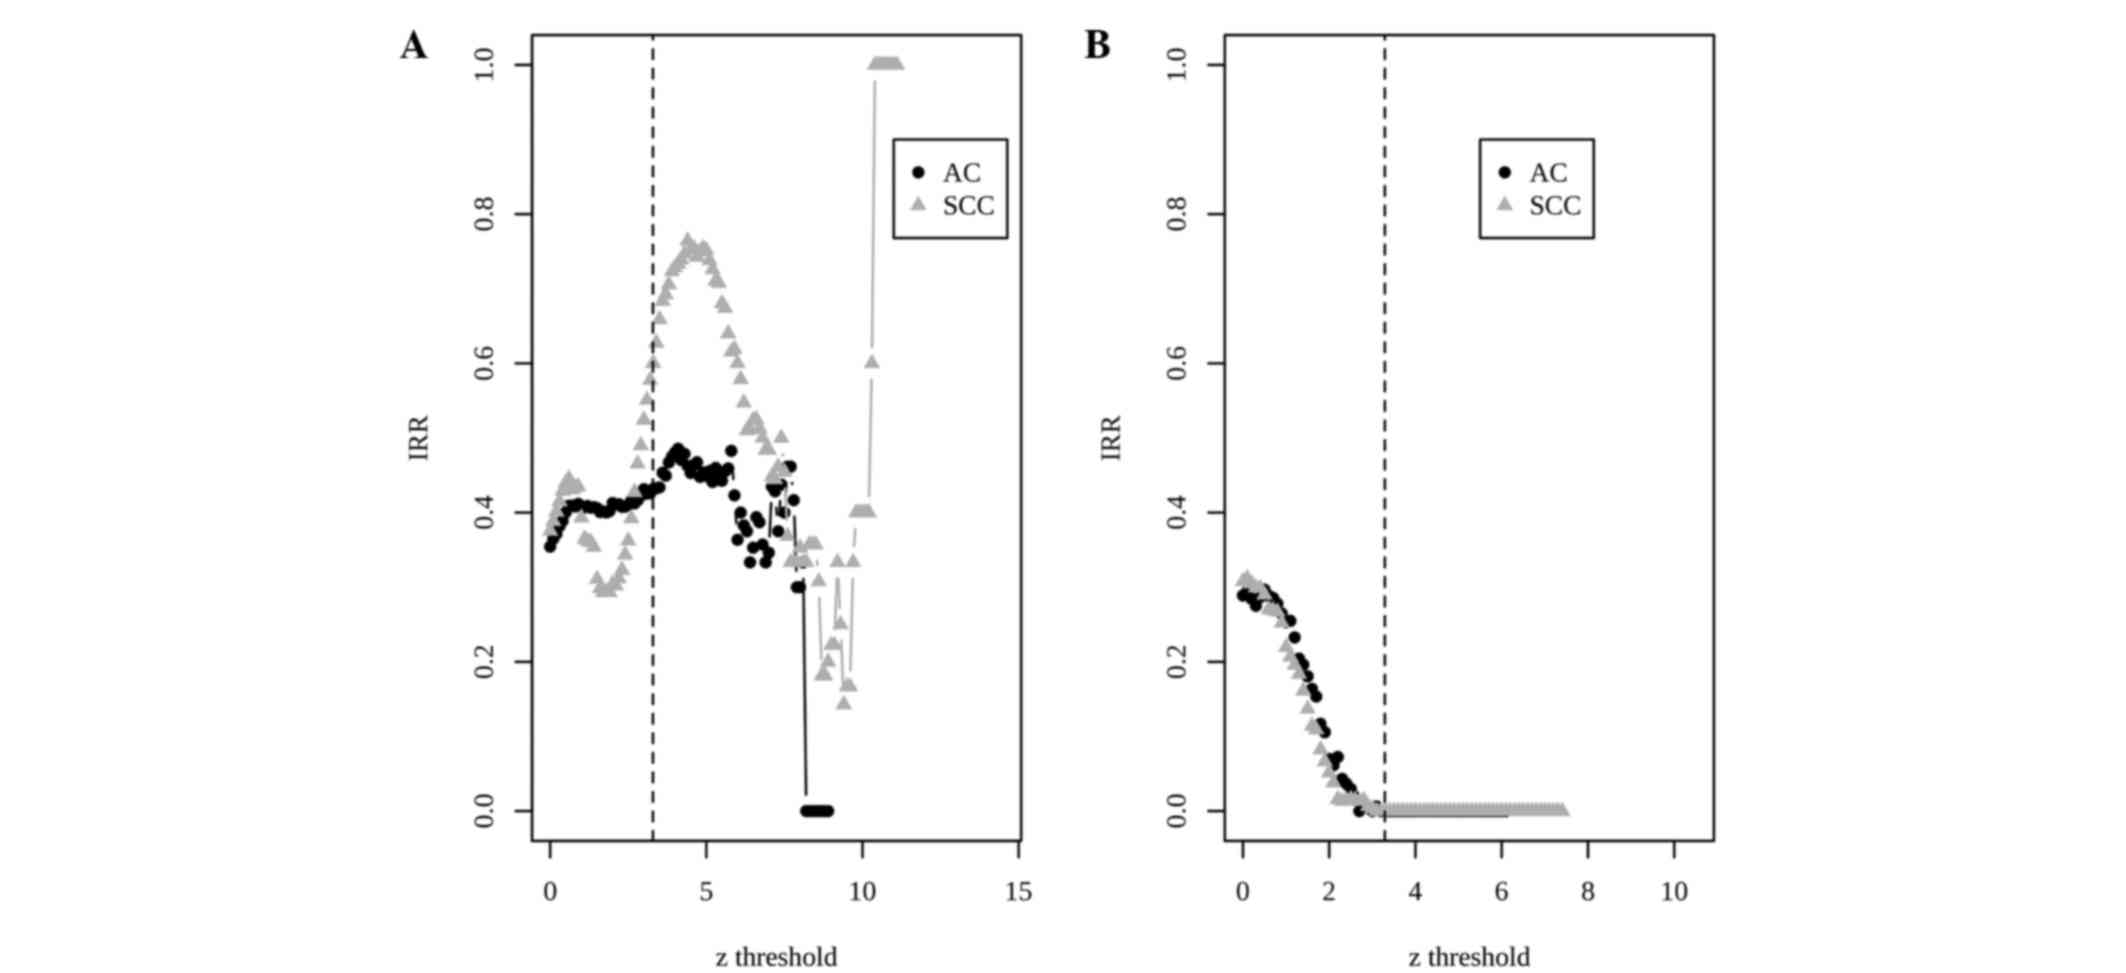
DEGs, respectively (Fig. 1B). The
integration-driven revision rate (IRR) was defined in previous
studies (23,24) as the percentage of genes that is
declared to be differentially expressed in any individual study,
but not in meta-analysis. Differing from IDR, which demonstrates
the superiority of a meta-analysis, IRR may measure the deficiency
of a meta-analysis. In the POE meta-analysis, the IRRs were 43 and
60% for AC and SCC upregulated genes, respectively (Fig. 2A). By contrast, the IRRs decreased to
0% in the two types of DEGs in the barcode meta-analysis (Fig. 2B).
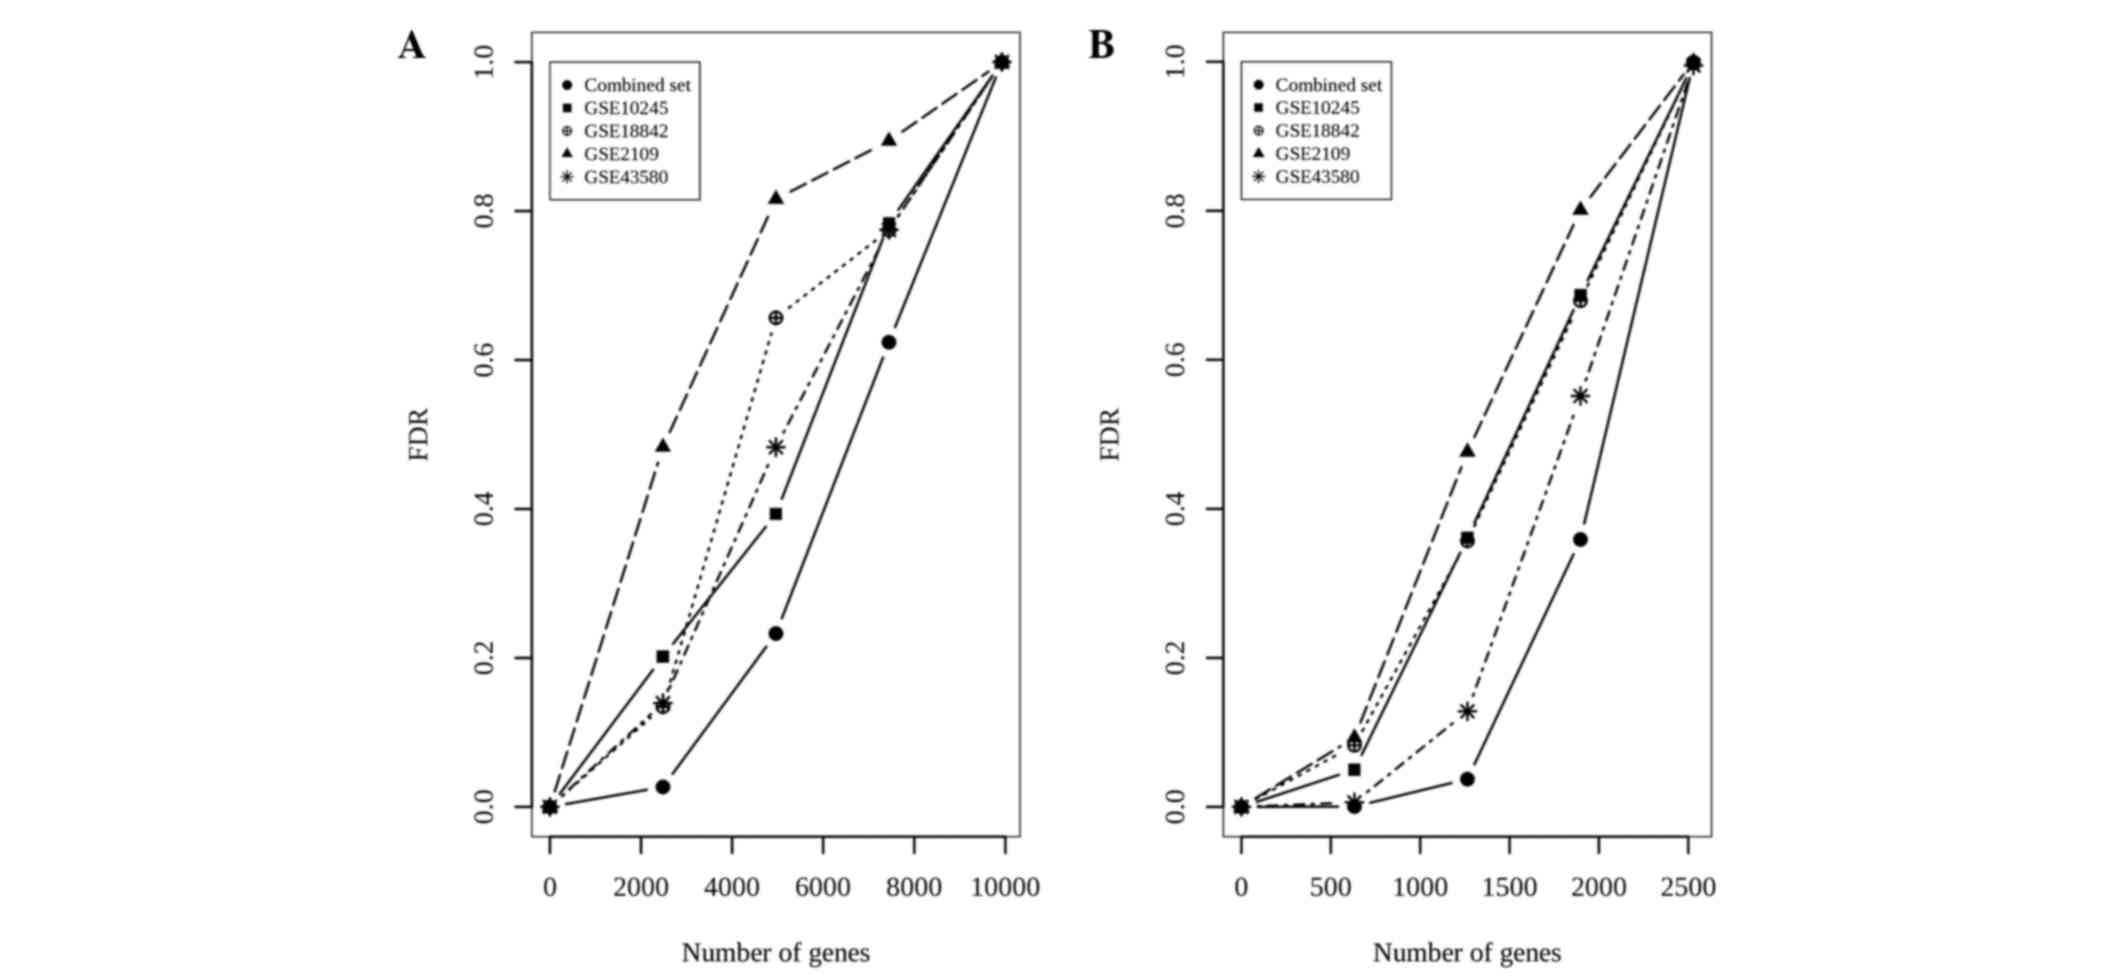
Another metric used to evaluate the performance of a
meta-analysis is the false discovery rate (FDR). The calculation of
FDRs is described in (25). In
general, high IDRs and low FDRs indicate a meta-analysis that
outperforms a single-study analysis. In the POE meta-analysis, a
corresponding FDR value of 2.5×10⁻³ was obtained for
zth=3.29 (Fig. 3A). The
false-positive ratios in the meta-analysis were markedly reduced
compared with any individual study.
In the barcode meta-analysis, the global FDR of
0.001 (Fig. 3B) was non-marginally
lower compared with that of the POE meta-analysis. The results
indicated that the barcode meta-analysis was more effective than
any single-study analysis, and it also outperformed the POE
meta-analysis in terms of IDR, IRR and FDR.
Comparison between two methods
The size of overlap between the DEGs in the two
meta-analysis methods was 392. Not counting those extra genes
excluded from the barcode meta-analysis, this number represented
54.4 and 64.9% of the DEGs in the barcode and POE methods,
respectively. The DEGs of these two methods (Fisher's exact test,
P=1.3×10⁻⁴) were substantially overlapped.
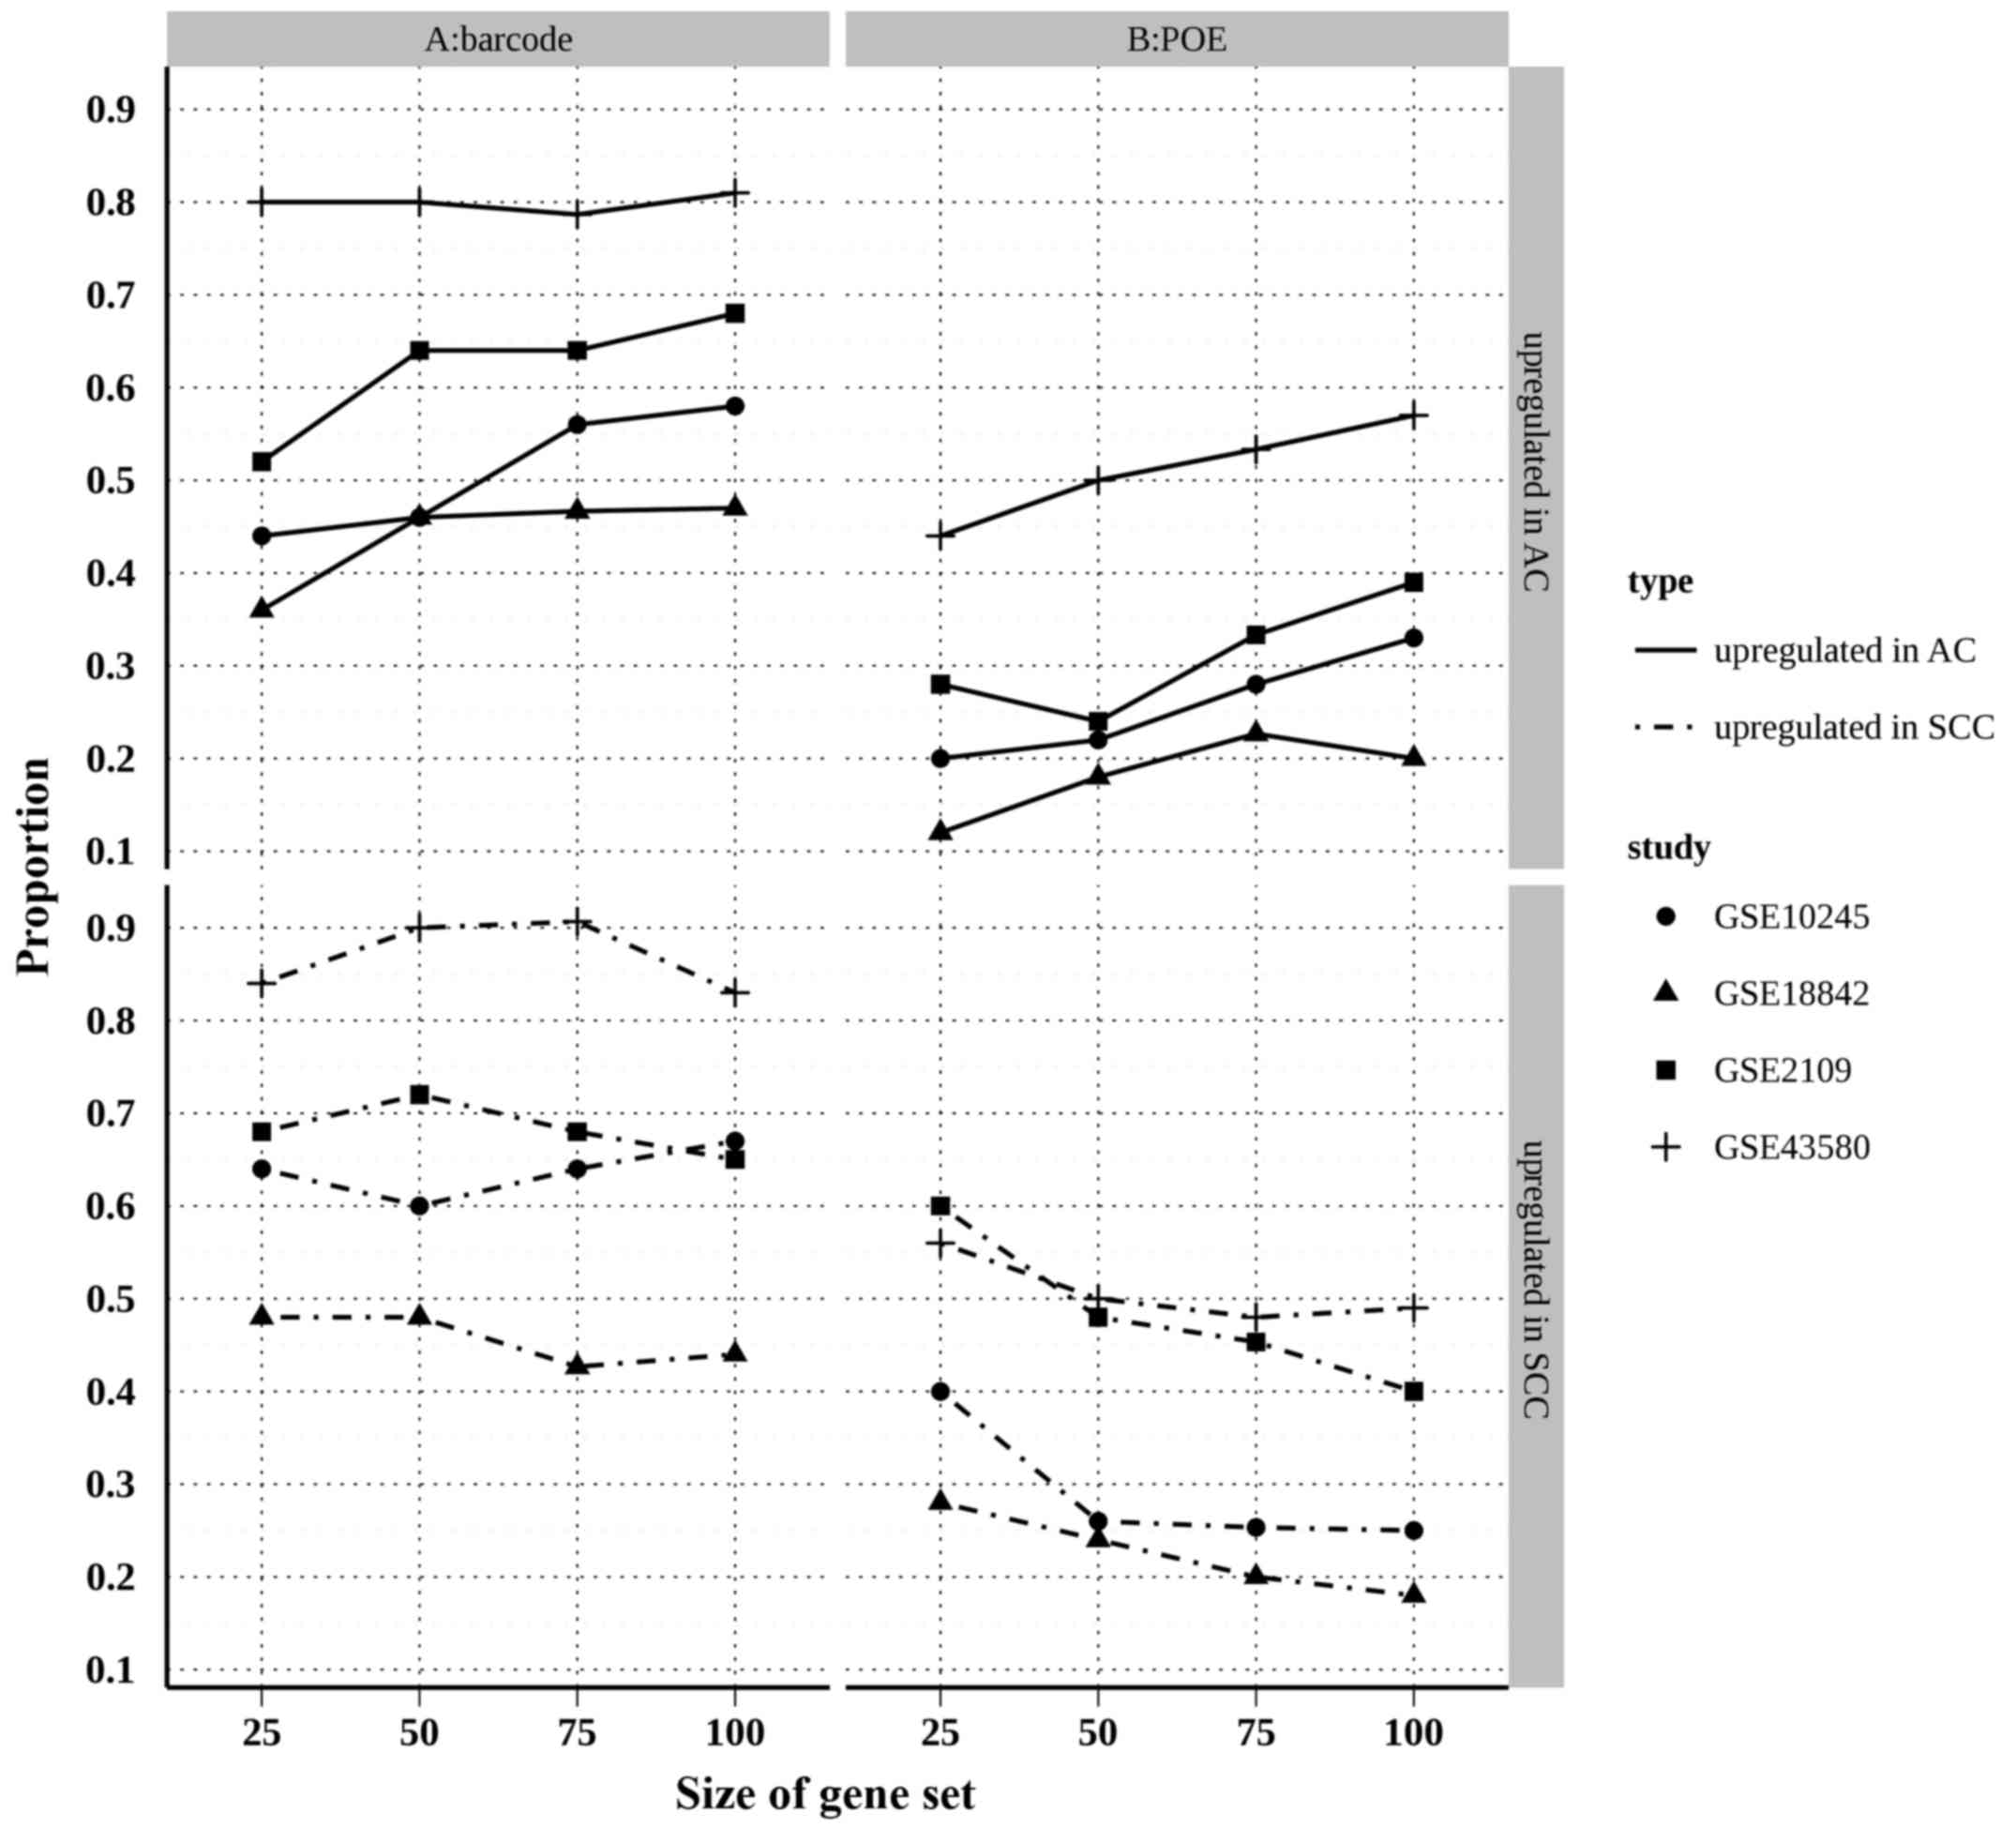
To assess the reliability of the two meta-analysis
methods, the consistency of results was compared between the
meta-analyses and individual studies. A large proportion of common
DEGs between an individual study and a meta-analysis indicates the
high reliability of the meta-analysis. In practice, the present
study was typically interested in a small subset of genes that
appeared to be truly differentially expressed. Therefore, it was
more important to assess the consistency of genes that were
identified to be most significant in each independent study
(26). A correspondence at the top
(CAT) plot (27) is a visual means to
evaluate the agreement of identified genes between each of two
studies. In the present study, CAT plots were created using the top
200 genes (100 upregulated in AC and 100 upregulated in SCC)
identified by each individual study and the two meta-analyses
(Fig. 4). The results showed that the
proportion of overlapped top genes in the barcode method was
substantially higher than that of the POE method for the AC and SCC
upregulated genes, suggesting that barcode meta-analysis
outperformed POE meta-analysis in terms of reliability.
Functional annotation of DEGs
Gene Ontology (GO) annotation and Kyoto Encyclopedia
of Genes and Genomes pathway analysis were performed using the
Database for Annotation, Visualization and Integrated Discovery
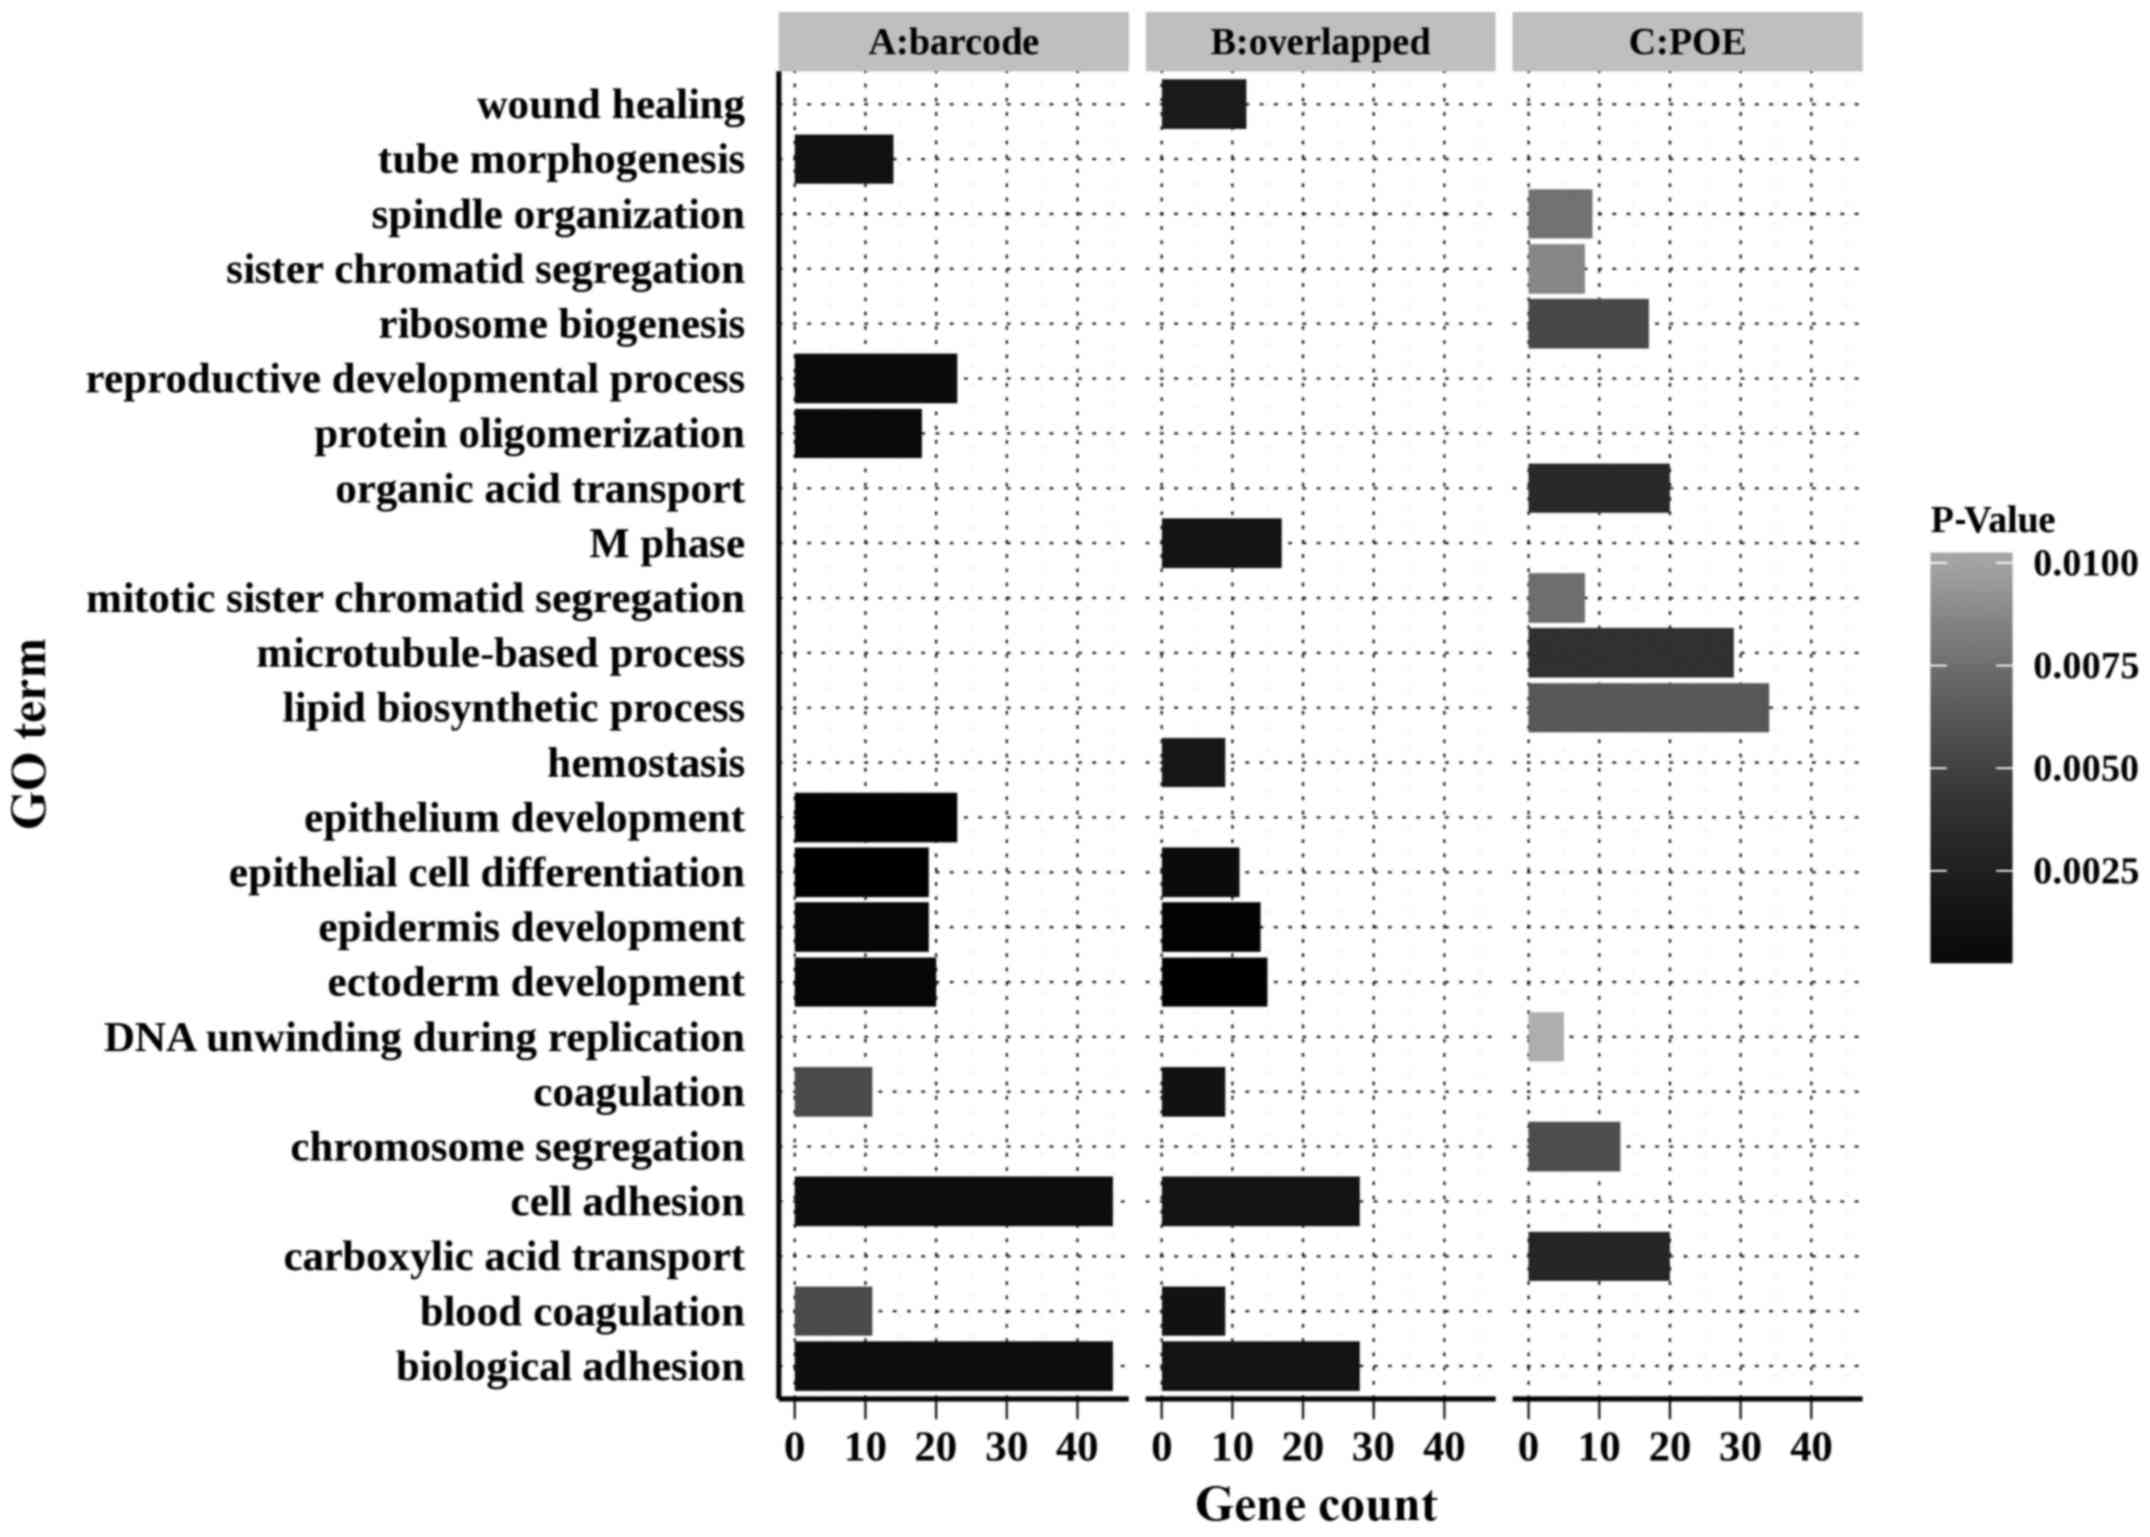
(DAVID) (28,29). The top 11 enriched biological
processes (please note two processes were tied for 10th place) of
those DEGs are illustrated in Fig.
5.
The DEGs of the barcode meta-analysis and the shared
DEGs of these two methods were significantly associated with
biological processes such as epithelium development, epidermis
development, epithelial cell differentiation, cell adhesion and
coagulation. However, the DEGs identified by POE meta-analysis did
not present such enrichment.
Additionally, the present study examined the top 50
DEGs from the barcode meta-analysis for their biological relevance
and found that a number of the genes have previously been reported
to be associated with NSCLC. For example, it has previously been
proven that the presence of lung AC depends on the expression of
NK2 homeobox 1 (NKX2-1) (30).
In the present analysis, NKX2-1 showed a higher expression
level in AC compared with that in the SCC subtype. The protein
encoded by desmocollin 3 (DSC3) is a member of the
desmocollin family that is primarily found in epithelial cells and
is required for cell-cell junctions. Desmoglein 3 (DSG3) is
a calcium-binding transmembrane glycoprotein component of
desmosomes in vertebrate epithelial cells. In the present analysis,
DSC3 and DSG3 were significantly upregulated in SCC.
Moreover, gap junction protein β5 (GJB5) (4), tumor protein p63 (TP63) (31), tripartite motif containing 29
(32) and keratin 5 (KRT5)
(33) have also been reported to be
associated with either of the two subtypes and are among the top
DEGs identified by meta-analysis.
Using the overlapped DEGs (188 upregulated genes in
SCC versus 204 upregulated genes in AC) in the two methods, the
enriched GO terms were examined for each subtype, respectively. For
AC upregulated DEGs, biological processes, including cell adhesion,
biological adhesion and coagulation, were significantly enriched.
Elevated expression of the genes associated with blood coagulation
in AC is consistent with the claim that patients who have advanced
lung AC are prone to thrombophilia (34), even though the present study
population consisted of NSCLC patients at early histology stages.
In SCC, over-representation of genes in three GO categories,
epidermis development, cell division and epithelial cell
differentiation, was observed. Furthermore, the high expression of
genes involved in the keratinization process was observed, which is
consistent with the characteristic of well- and
moderately-differentiated SCC (35).
Significant GO terms associated with the two subtypes,
respectively, are illustrated in Table
II.
| Table II.Enriched GO terms of DEGs between AC
and SCC. |
Table II.
Enriched GO terms of DEGs between AC
and SCC.
|
|
| 188 genes in SCC
vs. AC | 204 genes in AC vs.
SCC |
|---|
|
|
|
|
|
|---|
| GO term | GO ID | Count | % of genes | P-value | FDR | Count | % of genes | P-value | FDR |
|---|
| Epidermis
development | GO:0008544 | 13 | 7.0 |
3.0×10⁻⁷ |
4.8×10⁻⁶ | – | – | – | – |
| Ectoderm
development | GO:0007398 | 13 | 7.0 |
7.0×10⁻⁷ |
1.1×10⁻⁵ | – | – | – | – |
| Cell division | GO:0051301 | 14 | 7.5 |
7.8×10⁻⁶ |
1.3×10⁻⁴ | – | – | – | – |
| M phase | GO:0000279 | 16 | 8.6 |
9.9×10⁻⁷ |
1.6×10⁻⁵ | – | – | – | – |
| DNA
replication | GO:0006260 | 8 | 4.3 |
3.0×10⁻³ |
4.6×10⁻² | – | – | – | – |
| Epithelial cell
differentiation | GO:0030855 | 7 | 3.7 |
2.5×10⁻³ |
3.9×10⁻² | – | – | – | – |
| Keratinization | GO:0031424 | 3 | 1.6 |
6.8×10⁻² |
8.5×10⁻³ | – | – | – | – |
| Cell adhesion | GO:0007155 | – | – | – | – | 19 | 9.5 |
4.2×10⁻⁴ |
6.7×10⁻¹ |
| Biological
adhesion | GO:0022610 | – | – | – | – | 19 | 9.5 |
4.2×10⁻⁴ |
6.8×10⁻¹ |
| Blood
coagulation | GO:0007596 | – | – | – | – | 7 | 3.5 |
7.4×10⁻⁴ |
1.2×10⁻² |
| Coagulation | GO:0050817 | – | – | – | – | 7 | 3.5 |
7.4×10⁻⁴ |
1.2×10⁻² |
Analysis based on the POE data only reflects the
relativity of expression intensity, namely, genes are expressed at
higher/lower levels in AC samples than in SCC samples. Little
attention has been devoted to determining which genes are expressed
in a specific subtype. By contrast, barcode gene expression values
have only binary values and a thorough examination of genes that
are silenced in one phenotype but expressed in the other is
possible. In the present study, there were 415 such genes,
including 219 genes expressed in SCC and 196 genes expressed in AC.
Pathway analysis using these subtype specific genes was also
conducted. AC-specific genes were significantly involved in the
mitogen-activated protein kinase signaling pathway and the O-glycan
biosynthesis pathway, while SCC-specific genes were significantly
mapped into the Wnt signaling pathway, adherens junctions and the
Hedgehog signaling pathway (Table
III). Using meta-analysis, the present study further confirmed
that different pathological mechanisms are involved in these two
NSCLC subtypes.
| Table III.KEGG pathway analysis of
subtype-specific genes in barcode meta-analysis. |
Table III.
KEGG pathway analysis of
subtype-specific genes in barcode meta-analysis.
|
| 219 genes specific
in SCC | 196 genes specific
in AC |
|---|
|
|
|
|
|---|
| KEGG pathway | Count | % of genes | P-value | FDR | Count | % of genes | P-value | FDR |
|---|
| Wnt signaling
pathway | 7 | 3.3 |
3.0×10⁻³ | 0.03 | – | – | – | – |
| Basal cell
carcinoma | 4 | 1.9 |
1.6×10⁻² | 0.15 | – | – | – | – |
| Hedgehog signaling
pathway | 4 | 1.9 |
1.6×10⁻² | 0.16 | – | – | – | – |
| Adherens
junction | 4 | 1.9 |
3.7×10⁻² | 0.33 | – | – | – | – |
| MAPK signaling
pathway | – | – | – | – | 8 | 4.2 |
9.4×10⁻³ | 0.09 |
| O-glycan
biosynthesis | – | – | – | – | 3 | 1.6 |
3.0×10⁻² | 0.27 |
Discussion
To conduct a meta-analysis, gene expression values
were transformed into two different data types, namely, POE and
barcode values. To assess the heterogeneity for each gene,
I2 statistics for the two approaches were calculated.
Overall, 21% of genes out of the POE gene set showed high
heterogeneity (I2>50%), and this number decreased to 9%
for the barcode gene set. Among all of the common genes with
heterogeneity across the studies, 71.74% showed a heterogeneity
reduction in barcoded data. This implies that when using the
barcode values rather than POE, the heterogeneity of a gene across
studies can be reduced.
The transformation of the raw expression value to
the gene expression barcode made certain genes present with no
difference at all between subtypes. Loosely speaking, exclusion of
such genes simplified the analysis. However, even when
expressed/silenced in all samples, the expression intensity of a
gene may differ between the two NSCLC subtypes. The POE
meta-analysis identified 187 and 527 DEGs out of 1,084 expressed
and 6,312 silenced genes, respectively. Although these DEGs showed
no significant enrichment in any biological processes or pathways,
genes involved in the same process showed a similar expression
pattern. For example, eukaryotic translation initiation factors
such as eukaryotic translation initiation factor 4γ1
(EIF4G1), EIF2A, EIF4H, EIF3J and EIF4D were
overexpressed in the majority of the SCC samples. By contrast,
major histocompatibility complex genes, including human leukocyte
antigen (HLA)-B, HLA-G, HLA-DMB and
HLA-DMA, were overexpressed in the AC subtype.
Each meta-analysis method identified 53 common IDD
genes (data not shown). Among them, a number are biologically
relevant to NSCLC. Namely, claudin 18 (CLDN18), which is
commonly expressed in lung AC and in tumors of non-smokers
(36), encodes a protein critical for
tight junctions. Secretoglobin 3A2 is a downstream target for
NKX2-1 in the lungs (37) and
is overexpressed in lung AC (38).
Aurora-B is a key regulator of mitosis and its overexpression is
correlated with NSCLC (39). The
inhibition of aurora kinase activity, leading to defective cell
division and endoreduplication of NSCLC cells, as well as high
aurora B expression levels, were significantly associated with
squamous cell carcinoma histology (39).
For those subtype-specific genes identified by
barcode meta-analysis, a consistent expression pattern was
observed. For instance, TP63, which was silenced in the AC
samples but was expressed in the majority of SCC samples, plays a
critical role in the development and maintenance of stratified
epithelial tissues. KRT5, −14, −13, −16 all belongs to KRT
gene family and showed a similar expression pattern of being
silenced in almost all the AC subtype tissues but expressed in the
majority of the SCC subtype tissues. The proteins encoded by genes
in this family are usually tough, fibrous proteins that form the
structural framework of epithelial cells (40). In the present study, the two tumor
subtypes showed deregulation in the cell junction process through
different mechanisms. Tight junction genes, such as CLDN2,
and cell adhesion genes, such a hyaluronan binding protein 2, were
exclusively overexpressed in the AC tumors, while gap junction
genes GJB3 and GJB5 were overexpressed in the SCC
tumors.
Previous genome-wide association studies have also
made contributions to determining the susceptibility genes
associated with a specific subtype of lung cancer. For example, a
single-nucleotide polymorphism marker located on the CLPTM1-like
(CLPTM1L)-telomerase reverse transcriptase gene region at
chromosome 5p15 has been proven to be associated with the risk of
AC, but not with SCC (41,42). CLPTM1L at this location
exhibited overexpression in AC tumors compared with normal or other
lung cancer tissues (43). Consistent
with this previous conclusion, CLPTM1L was expressed at
higher levels in the AC subtype than in the SCC subtype in the
present analysis. By contrast, the polymorphism in the solute
carrier family 17 member 8-nuclear receptor subfamily 1 group H
member 4 (NR1H4) gene region at 12q23.1 was only
significantly associated with the risk of the SCC subtype (44). Loss of NR1H4 will promote Wnt
signaling pathway and increase tumor progression (45), and in the present analysis,
NR1H4 was expressed at a lower level in the SCC subtype than
in the AC subtype.
In conclusion, DEGs identified by POE and barcode
meta-analysis substantially overlap. The functional analysis based
on DEGs confirmed that there are biological differences between AC
and SCC. Thus, these DEGs are useful for diagnosis and personalized
treatments in these two subtypes of NSCLC, and future studies are
warranted.
Glossary
Abbreviations
Abbreviations:
|
NSCLC
|
non-small cell lung cancer
|
|
AC
|
adenocarcinoma
|
|
SCC
|
squamous cell carcinoma
|
|
DEG
|
differentially-expressed gene
|
|
POE
|
probability of expression
|
|
IDD
|
integration-driven discovery
|
|
IDR
|
IDD rate
|
|
IRR
|
integration-driven revision rate
|
|
ICC
|
integrative correlation
coefficient
|
|
REM
|
random effect model
|
|
CAT
|
correspondence at the top
|
References
|
1
|
Kikuchi T, Daigo Y, Katagiri T, Tsunoda T,
Okada K, Kakiuchi S, Zembutsu H, Furukawa Y, Kawamura M, Kobayashi
K, et al: Expression profiles of non-small cell lung cancers on
cDNA microarrays: Identification of genes for prediction of
lymph-node metastasis and sensitivity to anti-cancer drugs.
Oncogene. 22:2192–2205. 2003. View Article : Google Scholar : PubMed/NCBI
|
|
2
|
Lemjabbar-Alaoui H, Hassan OU, Yang YW and
Buchanan P: Lung cancer: Biology and treatment options. Biochim
Biophys Acta. 1856:189–210. 2015.PubMed/NCBI
|
|
3
|
Liu J, Yang XY and Shi WJ: Identifying
differentially expressed genes and pathways in two types of
non-small cell lung cancer: Adenocarcinoma and squamous cell
carcinoma. Genet Mol Res. 13:95–102. 2014. View Article : Google Scholar : PubMed/NCBI
|
|
4
|
Kuner R, Muley T, Meister M, Ruschhaupt M,
Buness A, Xu EC, Schnabel P, Warth A, Poustka A, Sültmann H and
Hoffmann H: Global gene expression analysis reveals specific
patterns of cell junctions in non-small cell lung cancer subtypes.
Lung Cancer. 63:32–38. 2009. View Article : Google Scholar : PubMed/NCBI
|
|
5
|
Li L, Zhu J, Guo SX and Deng Y: Bicluster
and regulatory network analysis of differentially expressed genes
in adenocarcinoma and squamous cell carcinoma. Genet Mol Res.
12:1710–1719. 2013. View Article : Google Scholar : PubMed/NCBI
|
|
6
|
Li J, Li D, Wei X and Su Y: In silico
comparative genomic analysis of two non-small cell lung cancer
subtypes and their potentials for cancer classification. Cancer
Genomics Proteomics. 11:303–310. 2014.PubMed/NCBI
|
|
7
|
Siddiqui AS, Delaney AD, Schnerch A,
Griffith OL, Jones SJ and Marra MA: Sequence biases in large scale
gene expression profiling data. Nucleic Acids Res. 34:e832006.
View Article : Google Scholar : PubMed/NCBI
|
|
8
|
Choi JK, Yu U, Kim S and Yoo OJ: Combining
multiple microarray studies and modeling interstudy variation.
Bioinformatics. 19:(Suppl 1). i84–i90. 2003. View Article : Google Scholar : PubMed/NCBI
|
|
9
|
Rhodes DR, Barrette TR, Rubin MA, Ghosh D
and Chinnaiyan AM: Meta-analysis of microarrays: Interstudy
validation of gene expression profiles reveals pathway
dysregulation in prostate cancer. Cancer Res. 62:4427–4433.
2002.PubMed/NCBI
|
|
10
|
Choi H, Shen R, Chinnaiyan AM and Ghosh D:
A latent variable approach for meta-analysis of gene expression
data from multiple microarray experiments. BMC Bioinformatics.
8:3642007. View Article : Google Scholar : PubMed/NCBI
|
|
11
|
Zilliox MJ and Irizarry RA: A gene
expression bar code for microarray data. Nat Methods. 4:911–913.
2007. View Article : Google Scholar : PubMed/NCBI
|
|
12
|
Amelung JT, Bührens R, Beshay M and
Reymond MA: Key genes in lung cancer translational research: A
meta-analysis. Pathobiology. 77:53–63. 2010. View Article : Google Scholar : PubMed/NCBI
|
|
13
|
Kim B, Lee HJ, Choi HY, Shin Y, Nam S, Seo
G, Son DS, Jo J, Kim J, Lee J, et al: Clinical validity of the lung
cancer biomarkers identified by bioinformatics analysis of public
expression data. Cancer Res. 67:7431–7438. 2007. View Article : Google Scholar : PubMed/NCBI
|
|
14
|
Tian ZQ, Li ZH, Wen SW, Zhang YF, Li Y,
Cheng JG and Wang GY: Identification of commonly dysregulated genes
in non-small-cell lung cancer by integrated analysis of microarray
data and qRT-PCR validation. Lung. 193:583–592. 2015. View Article : Google Scholar : PubMed/NCBI
|
|
15
|
Tan X and Chen M: MYLK and MYL9 expression
in non-small cell lung cancer identified by bioinformatics analysis
of public expression data. Tumour Biol. 35:12189–12200. 2014.
View Article : Google Scholar : PubMed/NCBI
|
|
16
|
Huang CH, Chang PM, Lin YJ, Wang CH, Huang
CY and Ng KL: Drug repositioning discovery for early- and
late-stage non-small-cell lung cancer. Biomed Res Int.
2014:1938172014. View Article : Google Scholar : PubMed/NCBI
|
|
17
|
McCall MN, Bolstad BM and Irizarry RA:
Frozen robust multiarray analysis (fRMA). Biostatistics.
11:242–253. 2010. View Article : Google Scholar : PubMed/NCBI
|
|
18
|
Lee JK, Bussey KJ, Gwadry FG, Reinhold W,
Riddick G, Pelletier SL, Nishizuka S, Szakacs G, Annereau JP,
Shankavaram U, et al: Comparing cDNA and oligonucleotide array
data: Concordance of gene expression across platforms for the
NCI-60 cancer cells. Genome Biol. 4:R822003. View Article : Google Scholar : PubMed/NCBI
|
|
19
|
Parmigiani G, Garrett-Mayer ES, Anbazhagan
R and Gabrielson E: A cross-study comparison of gene expression
studies for the molecular classification of lung cancer. Clin
Cancer Res. 10:2922–2927. 2004. View Article : Google Scholar : PubMed/NCBI
|
|
20
|
Borenstein M, Hedges LV, Higgins JPT and
Rothstein HR: Introduction to Meta-Analysis. 1st. John Wiley and
Sons, Ltd.; Chichester, UK: 2009, View Article : Google Scholar
|
|
21
|
McCall MN, Uppal K, Jaffee HA, Zilliox MJ
and Irizarry RA: The gene expression barcode: Leveraging public
data repositories to begin cataloging the human and murine
transcriptomes. Nucleic Acids Res. 39:D1011–D1015. 2011. View Article : Google Scholar : PubMed/NCBI
|
|
22
|
Cochran WG: The comparison of percentages
in matched samples. Biometrika. 37:256–266. 1950. View Article : Google Scholar : PubMed/NCBI
|
|
23
|
Stevens JR and Doerge RW: Combining
Affymetrix microarray results. BMC Bioinformatics. 6:572005.
View Article : Google Scholar : PubMed/NCBI
|
|
24
|
Conlon EM, Song JJ and Liu A: Bayesian
meta-analysis models for microarray data: A comparative study. BMC
Bioinformatics. 8:802007. View Article : Google Scholar : PubMed/NCBI
|
|
25
|
Tusher VG, Tibshirani R and Chu G:
Significance analysis of microarrays applied to the ionizing
radiation response. Proc Natl Acad Sci USA. 98:5116–5121. 2001.
View Article : Google Scholar : PubMed/NCBI
|
|
26
|
Hong F and Breitling R: A comparison of
meta-analysis methods for detecting differentially expressed genes
in microarray experiments. Bioinformatics. 24:374–382. 2008.
View Article : Google Scholar : PubMed/NCBI
|
|
27
|
Irizarry RA, Warren D, Spencer F, Kim IF,
Biswal S, Frank BC, Gabrielson E, Garcia JG, Geoghegan J, Germino
G, et al: Multiple-laboratory comparison of microarray platforms.
Nat Methods. 2:345–350. 2005. View Article : Google Scholar : PubMed/NCBI
|
|
28
|
da Huang W, Sherman BT and Lempicki RA:
Bioinformatics enrichment tools: Paths toward the comprehensive
functional analysis of large gene lists. Nucleic Acids Res.
37:1–13. 2009. View Article : Google Scholar : PubMed/NCBI
|
|
29
|
da Huang W, Sherman BT and Lempicki RA:
Systematic and integrative analysis of large gene lists using DAVID
bioinformatics resources. Nat Protoc. 4:44–57. 2009. View Article : Google Scholar : PubMed/NCBI
|
|
30
|
Kwei KA, Kim YH, Girard L, Kao J,
Pacyna-Gengelbach M, Salari K, Lee J, Choi YL, Sato M, Wang P, et
al: Genomic profiling identifies TITF1 as a lineage-specific
oncogene amplified in lung cancer. Oncogene. 27:3635–3640. 2008.
View Article : Google Scholar : PubMed/NCBI
|
|
31
|
Massion PP, Taflan PM, Rahman Jamshedur
SM, Yildiz P, Shyr Y, Edgerton ME, Westfall MD, Roberts JR,
Pietenpol JA, Carbone DP and Gonzalez AL: Significance of p63
amplification and overexpression in lung cancer development and
prognosis. Cancer Res. 63:7113–7121. 2003.PubMed/NCBI
|
|
32
|
Zhou ZY, Yang GY, Zhou J and Yu MH:
Significance of TRIM29 and β-catenin expression in non-small-cell
lung cancer. J Chin Med Assoc. 75:269–274. 2012. View Article : Google Scholar : PubMed/NCBI
|
|
33
|
Angulo B, Suarez-Gauthier A, Lopez-Rios F,
Medina PP, Conde E, Tang M, Soler G, Lopez-Encuentra A, Cigudosa JC
and Sanchez-Cespedes M: Expression signatures in lung cancer reveal
a profile for EGFR-mutant tumours and identify selective PIK3CA
overexpression by gene amplification. J Pathol. 214:347–356. 2008.
View Article : Google Scholar : PubMed/NCBI
|
|
34
|
Li Y, Wei S, Wang J, Hong L, Cui L and
Wang C: Analysis of the factors associated with abnormal
coagulation and prognosis in patients with non-small cell lung
cancer. Zhongguo Fei Ai Za Zhi. 17:789–796. 2014.(In Chinese).
PubMed/NCBI
|
|
35
|
Kogan EA, Ugriumov DA and Jaques G:
Morphologic and molecular-genetic characteristics of keratinization
and apoptosis in squamous cell lung carcinoma. Arkh Patol.
62:16–20. 2000.PubMed/NCBI
|
|
36
|
Merikallio H, Pääkkö P, Harju T and Soini
Y: Claudins 10 and 18 are predominantly expressed in lung
adenocarcinomas and in tumors of nonsmokers. Int J Clin Exp Pathol.
4:667–673. 2011.PubMed/NCBI
|
|
37
|
Kurotani R, Tomita T, Yang Q, Carlson BA,
Chen C and Kimura S: Role of secretoglobin 3A2 in lung development.
Am J Respir Crit Care Med. 178:389–398. 2008. View Article : Google Scholar : PubMed/NCBI
|
|
38
|
Davidson B, Stavnes HT, Risberg B, Nesland
JM, Wohlschlaeger J, Yang Y, Shih IeM and Wang TL: Gene expression
signatures differentiate adenocarcinoma of lung and breast origin
in effusions. Hum Pathol. 43:684–694. 2012. View Article : Google Scholar : PubMed/NCBI
|
|
39
|
Vischioni B, Oudejans JJ, Vos W, Rodriguez
JA and Giaccone G: Frequent overexpression of aurora B kinase, a
novel drug target, in non-small cell lung carcinoma patients. Mol
Cancer Ther. 5:2905–2913. 2006. View Article : Google Scholar : PubMed/NCBI
|
|
40
|
Lane EB and McLean WH: Keratins and skin
disorders. J Pathol. 204:355–366. 2004. View Article : Google Scholar : PubMed/NCBI
|
|
41
|
Landi MT, Chatterjee N, Yu K, Goldin LR,
Goldstein AM, Rotunno M, Mirabello L, Jacobs K, Wheeler W, Yeager
M, et al: A genome-wide association study of lung cancer identifies
a region of chromosome 5p15 associated with risk for
adenocarcinoma. Am J Hum Genet. 85:679–691. 2009. View Article : Google Scholar : PubMed/NCBI
|
|
42
|
Hsiung CA, Lan Q, Hong YC, Chen CJ,
Hosgood HD, Chang IS, Chatterjee N, Brennan P, Wu C, Zheng W, et
al: The 5p15.33 locus is associated with risk of lung
adenocarcinoma in never-smoking females in Asia. PLoS Genet. 6:pii:
e1001051. 2010. View Article : Google Scholar : PubMed/NCBI
|
|
43
|
Ni Z, Tao K, Chen G, Chen Q, Tang J, Luo
X, Yin P, Tang J and Wang X: CLPTM1L is overexpressed in lung
cancer and associated with apoptosis. PLoS One. 7:e525982012.
View Article : Google Scholar : PubMed/NCBI
|
|
44
|
Dong J, Jin G, Wu C, Guo H, Zhou B, Lv J,
Lu D, Shi Y, Shu Y, Xu L, et al: Genome-wide association study
identifies a novel susceptibility locus at 12q23.1 for lung
squamous cell carcinoma in han Chinese. PLoS Genet. 9:e10031902013.
View Article : Google Scholar : PubMed/NCBI
|
|
45
|
Modica S, Murzilli S, Salvatore L, Schmidt
DR and Moschetta A: Nuclear bile acid receptor FXR protects against
intestinal tumorigenesis. Cancer Res. 68:9589–9594. 2008.
View Article : Google Scholar : PubMed/NCBI
|