Introduction
Hepatocellular carcinoma (HCC) is the sixth most
common type of cancer in the world, and has received considerable
attention in previous years (1). The
occurrence and development of HCC is a result of a multiple gene
regulation cascade (2,3). During a multiple gene regulation
cascade, there is often an alteration of protein glycosylation
(4). Glycosylation is one of the most
important protein post-translational modifications, and >50% of
proteins in nature are presumed to have undergone glycosylation.
Glycosylation performs a key role in controlling various cellular
processes, including cellular adhesion, receptor activation, signal
transduction and endocytosis (5).
Alteration of glycosylation can be observed in numerous diseases
and some of these alterations are well-known biomarkers in cancer
progression (6,7). During the occurrence and development of
HCC, glycan branched structures such as GlcNAc-branched N-glycans,
sialic acid and multi-antennary glycans with fucose residues are
highly expressed (8,9).
Sorafenib, which has been approved by the U.S. Food
and Drug Administration and the European Medicine Agency, is a
multikinase inhibitor (10). Growing
evidence suggests that sorafenib has shown efficacy against a wide
variety of tumors such as advanced renal cell carcinoma and HCC
(11). Sorafenib has the following
possible targets: Raf; epidermal growth factor receptor; vascular
endothelial growth factor receptor; FMS-like tyrosine kinase-3;
platelet-derived growth factor receptor; and c-kit, and may block
cellular proliferation and angiogenesis (12). Sorafenib, as a molecular targeted drug
against HCC, has increased effectiveness and fewer adverse
reactions in comparison with other HCC chemotherapy drugs,
including Adriamycin (13). As an
intracellular signaling pathway blocking agent, a number of studies
have explored the exact molecular mechanism of how sorafenib works
(14–16). However, there have been few studies
into the sorafenib-induced alteration of protein glycosylation. If
more attention was paid to the alteration of protein glycosylation
in sorafenib-treated HCC cells, novel and interesting findings may
be identified.
With the development of glycan-captured techniques,
the lectin microarray is widely used for glycoproteomics and
glycomics studies (17,18). In previous studies, we designed and
established a lectin microarray with 50 different lectins (19,20). To
detect the effect of sorafenib on the alteration of protein
glycosylation, the present study compared the glycosylation
profiles of HCC cells with or without sorafenib treatment using a
lectin microarray and found that expression levels of 2 tumor
metastasis-associated glycan structures, sialic acid and
tetra-antennary complex-type N-glycan, were decreased.
The present study also compared expression levels of
signaling molecules such as erythroblastosis 26-1 (Ets-1), which
takes part in tumor invasion, metastasis and glycosylation. To the
best of our knowledge, the present study is the first to report
that sorafenib treatment could reduce the expression of Ets-1.
Materials and methods
Cell cultures and treatment
Human HCC MHCC97L and MHCC97H cell lines have the
same genetic background and were established in the Liver Cancer
Institute of Fudan University (Shanghai, China) (21). All cells were cultured in Dulbecco's
modified Eagle's medium (Thermo Fisher Scientific, Inc., Waltham,
MA, USA) supplemented with 10% fetal bovine serum (Thermo Fisher
Scientific, Inc.) and were incubated at 37°C with 5%
CO2. Sorafenib was provided by Bayer HealthCare
Pharmaceuticals Inc. (Whippany, NJ, USA) and was solubilized using
dimethyl sulfoxide (DMSO; Sigma-Aldrich; Merck KGaA, Darmstadt,
Germany). Subsequent to cells being seeded for 24 h,
sorafenib-treated groups were supplemented with the 50% inhibitory
concentration (IC50) of sorafenib (MHCC97L, 14.18
µmol/l; MHCC97H, 15.08 µmol/l). A 0.1% solution of DMSO (vol/vol)
was also added to culture medium to serve as the control group, and
the two treatments were then incubated at 37°C for a further 24 h.
In order to investigate the effect on expression levels of Ets-1 by
targeting the Ras/Raf/mitogen-activated protein kinase (MAPK)
signaling pathway, HCC MHCC97L and MHCC97H cells were incubated
with or without U0126 (20 µmol/l; Selleck Chemicals, Houston, TX,
USA) for 48 h.
Cell proliferation assay
The Cell Counting Kit-8 (CCK-8; Dojindo Molecular
Technologies, Inc., Kumamoto, Kyushu, Japan) assay was used to
determine the relative growth of cell groups with or without
sorafenib treatment. MHCC97L and MHCC97H (3×10³
cells/well) were seeded into 96-well plates. Subsequent to a 24 h
incubation at 37°C, cells were incubated with distinct sorafenib
concentrations (0, 4, 8, 12, 16, 20, 24, 28 and 32 µmol/l) and the
experiment was performed three times at each concentration. DMSO
was added to cultures at 0.1% (v/v) as solvent controls, all cells
were incubated at 37°C for another 24 h. Cells were then stained
with 10 µl CCK-8 solution for 1 h at 37°C. Absorbance was measured
at 450 nm using the microplate reader, Infinite 200 PRO NanoQuant
(Tecan, Männedorf, Switzerland). Each treatment was repeated in 5
wells and the IC50 values were calculated from growth
inhibition curves.
Protein extraction
Cells were rinsed with PBS (Thermo Fisher
Scientific, Inc.) 3 times and lysed with radioimmunoprecipitation
assay lysis buffer (Thermo Fisher Scientific, Inc.) containing an
complete EDTA-free protease inhibitor cocktail (Roche Diagnostics,
Basel, Switzerland). Protein concentrations were measured with a
Pierce BCA Protein assay kit (Thermo Fisher Scientific, Inc.),
according to the manufacturer's protocol, and used for additional
experiments as described below.
Lectin microarray
Total extracted proteins from the cells were
exchanged in PBS by PD-10 desalting columns (GE Healthcare,
Piscataway, NJ, USA) and were biotinylated by the Lightning-Link
Biotin Labeling kit according to the manufacturer's protocol
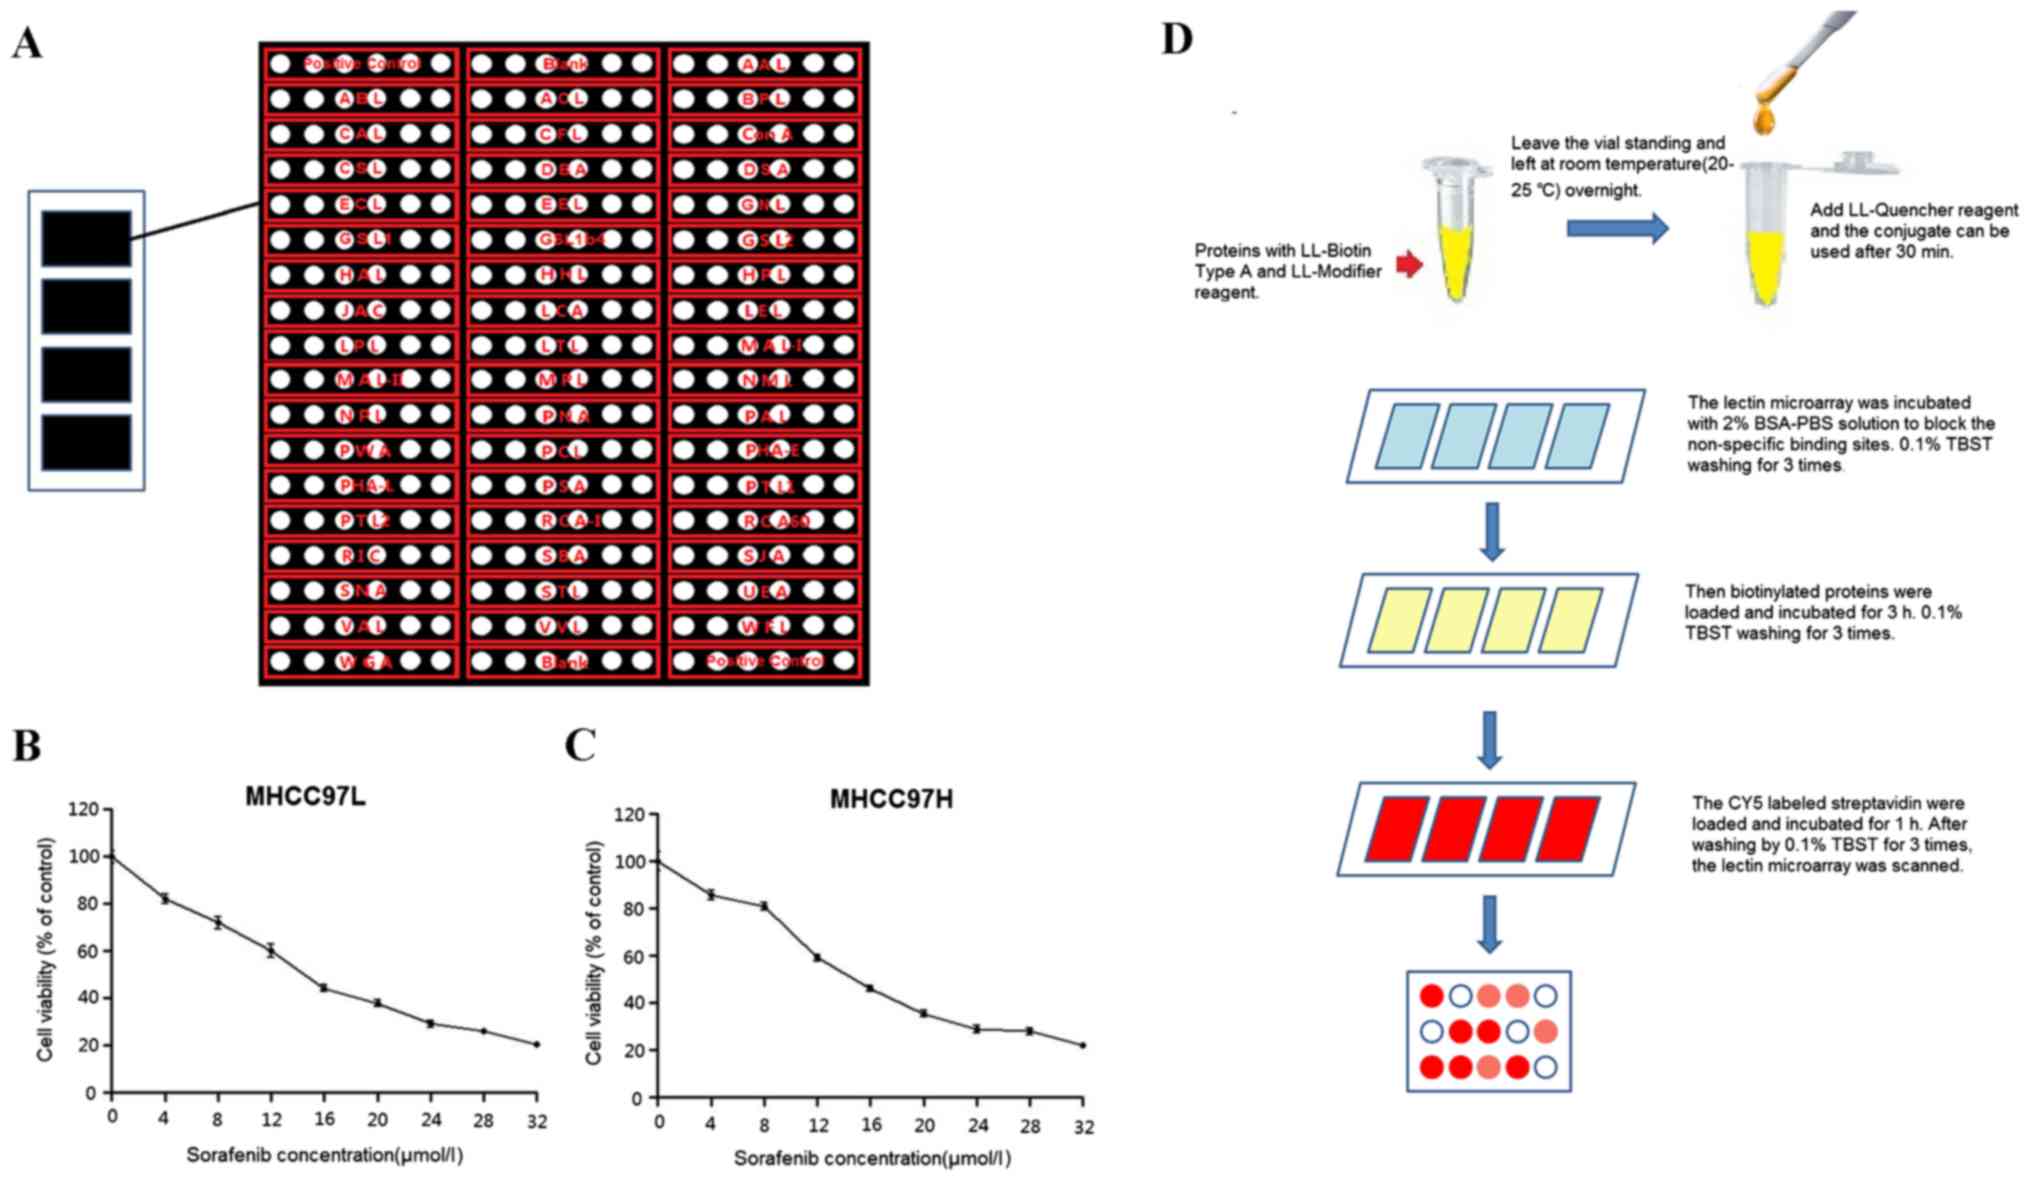
(Innova Biosciences, Cambridge, UK). The lectin microarray with 50
different types of lectins, 2 CY3 positive controls and 2 blank
controls (Fig. 1A) was used according
to the following protocol: The lectin microarray covered with 2%
bovine serum albumin (BSA; Santa Cruz Biotechnology, Inc., Dallas,
TX, USA) in PBS solution at room temperature for 1 h to block the
non-specific binding sites, followed by washing with 0.1%
TBS-Tween-20 (TBST; 50 mM Tris, 150 mM NaCl, 0.1% Tween-20, pH 7.6)
for 5 min 3 times. Biotinylated proteins were then loaded (100
µl/block) and incubated at room temperature with gentle agitation
for 3 h. The lectin microarray was then washed with 0.1% TBST for 5
min 3 times. Subsequently, the CY5 labeled streptavidin (Thermo
Fisher Scientific, Inc.) was loaded into each block and incubated
for 1 h at room temperature with gentle agitation. Subsequent to
washing with 0.1% TBST for 5 min 3 times, the lectin microarray was
scanned using the LuxScan 10K/A scanner system (CapitalBio,
Beijing, China).
Lectin microarray data were analyzed as previously
described (12). Briefly, the spot
intensity median (S), which was the lectin spot-glycoprotein
binding intensity median, and the background intensity median (B)
were extracted by Luxscan 3.0 (CapitalBio, Beijing, China). The S
to B (S/B) of each lectin spot and average S/B of 6 replicate spots
for each lectin in every block were calculated. MeV 4.8.1 software
(Dana-Farber Cancer Institute, Boston, MA, USA) was used to map
hierarchical clustering of S/B of lectins with the same tendency in
the two kinds of sorafenib-treated cells compared with control
groups. S/B ≥2 was set as the cut off and spots with S/B ≥2 were
termed the positive lectin binding spots.
Lectin blotting
Equal proteins extracted from cells were
additionally separated by 10% SDS-PAGE and transferred onto
polyvinylidene fluoride (PVDF) membranes (Merck Millipore).
Membranes were blocked for nonspecific binding with 3% BSA-TBST at
room temperature for 1 h and then incubated with biotinylated
Maackia amurensis lectin I (MAL-I; catalog no., B-1315;
Vector Laboratories, Inc., Burlingame, CA, USA), biotinylated
leucoagglutinin (PHA-L; catalog no., B-1115; Vector Laboratories,
Inc.) at a dilution of 1:2,000 or a primary monoclonal mouse
anti-human β-actin antibody (cat. no. KC-5A08; KangCheng Bio-tech,
Shanghai, China) at a dilution of 1:2,000 at room temperature for
30 min. Subsequent to washing with 0.1% TBST for 10 min 3 times,
membranes were incubated with streptavidin horseradish peroxidase
(HRP) conjugate (Invitrogen; Thermo Fisher Scientific, Inc.) at a
dilution of 1:10,000 or HRP-conjugated secondary antibody (cat. no.
KC-MM-035; KangCheng Bio-tech) at a dilution of 1:10,000 at room
temperature for another 30 min, and washed by 0.1% TBST for 10 min
3 times. The bands on the membranes were detected by using Amersham
enhanced chemiluminescence (ECL) prime western blotting detection
reagents (GE Healthcare). Anti-β-actin antibody was used as the
protein loading control.
Western blotting
Equal proteins were separated using 10% SDS-PAGE and
transferred to PVDF membranes. Subsequent to blocking with 5%
milk-TBST at room temperature for 1 h, membranes were incubated
with 4 different antibodies followed by an incubation at 4°C
overnight. The antibodies used are as follows: Polyclonal rabbit
anti-human Ets-1 antibody (dilution, 1:1,000; cat. no. 6258; Cell
Signaling Technology, Danvers, MA, USA); monoclonal rabbit
anti-human extracellular signal-related kinase (ERK) antibody
(dilution, 1:2,000; cat. no. 4695; Cell Signaling Technology);
monoclonal rabbit anti-human phospho-ERK antibody (p-ERK; dilution,
1:2,000; cat. no. 4370; Cell Signaling Technology); and a
monoclonal mouse anti-human β-actin antibody (dilution, 1:2,000).
Membranes were washed using 0.1% TBST for 10 min 3 times and
incubated in HRP-conjugated secondary polyclonal antibodies
(dilution, 1:10,000; KC-MM-035 and KC-RB-035; KangCheng Bio-tech)
at room temperature for 1 h, and washed using 0.1% TBST for 10 min
3 times. Amersham ECL detection (GE Healthcare) was used to
visualize the bands on membranes and β-actin was detected using the
anti-β-actin antibody that was used as the loading control for
proteins. Quantitative analysis of protein bands was performed
using Quantity One software (version 4.62; Bio-Rad Laboratories,
Inc., Hercules, CA, USA).
Statistical analysis
IC50 values were calculated using
GraphPad Prism version 5.0 software (GraphPad Software, Inc., La
Jolla, CA, USA). Statistical analyses were performed using SPSS
16.0 statistical packages (SPSS Inc., Chicago, IL, USA).
Quantitative variables were analyzed using the Student's t-test.
P<0.05 was considered to indicate a statistically significant
difference.
Results
Inhibitory effect on cell
proliferation in sorafenib-treated HCC cells
The present study treated MHCC97L and MHCC97H cells
with several different doses of sorafenib: 0, 4, 8, 12, 16, 20, 24,
28 and 32 µmol/l for 24 h to determine the IC50.
Proliferation of MHCC97L and MHCC97H cells was inhibited following
sorafenib treatment and the IC50 values were 14.18 and
15.08 µmol/l, respectively (Fig. 1B and
C). The present study chose to treat MHCC97L and MHCC97H cells
with IC50 to additionally investigate the glycosylation
profiles of HCC cells following sorafenib treatment.
Alteration of protein glycosylation in
sorafenib-treated HCC cells
Proteins extracted from sorafenib-treated groups and
control groups were applied to the lectin microarray, including 50
lectins, 2 CY3 positive controls and 2 blank controls for each
block. The workflow is shown in Fig.
1D and lectin microarrays were scanned by a LuxScan 10K/A
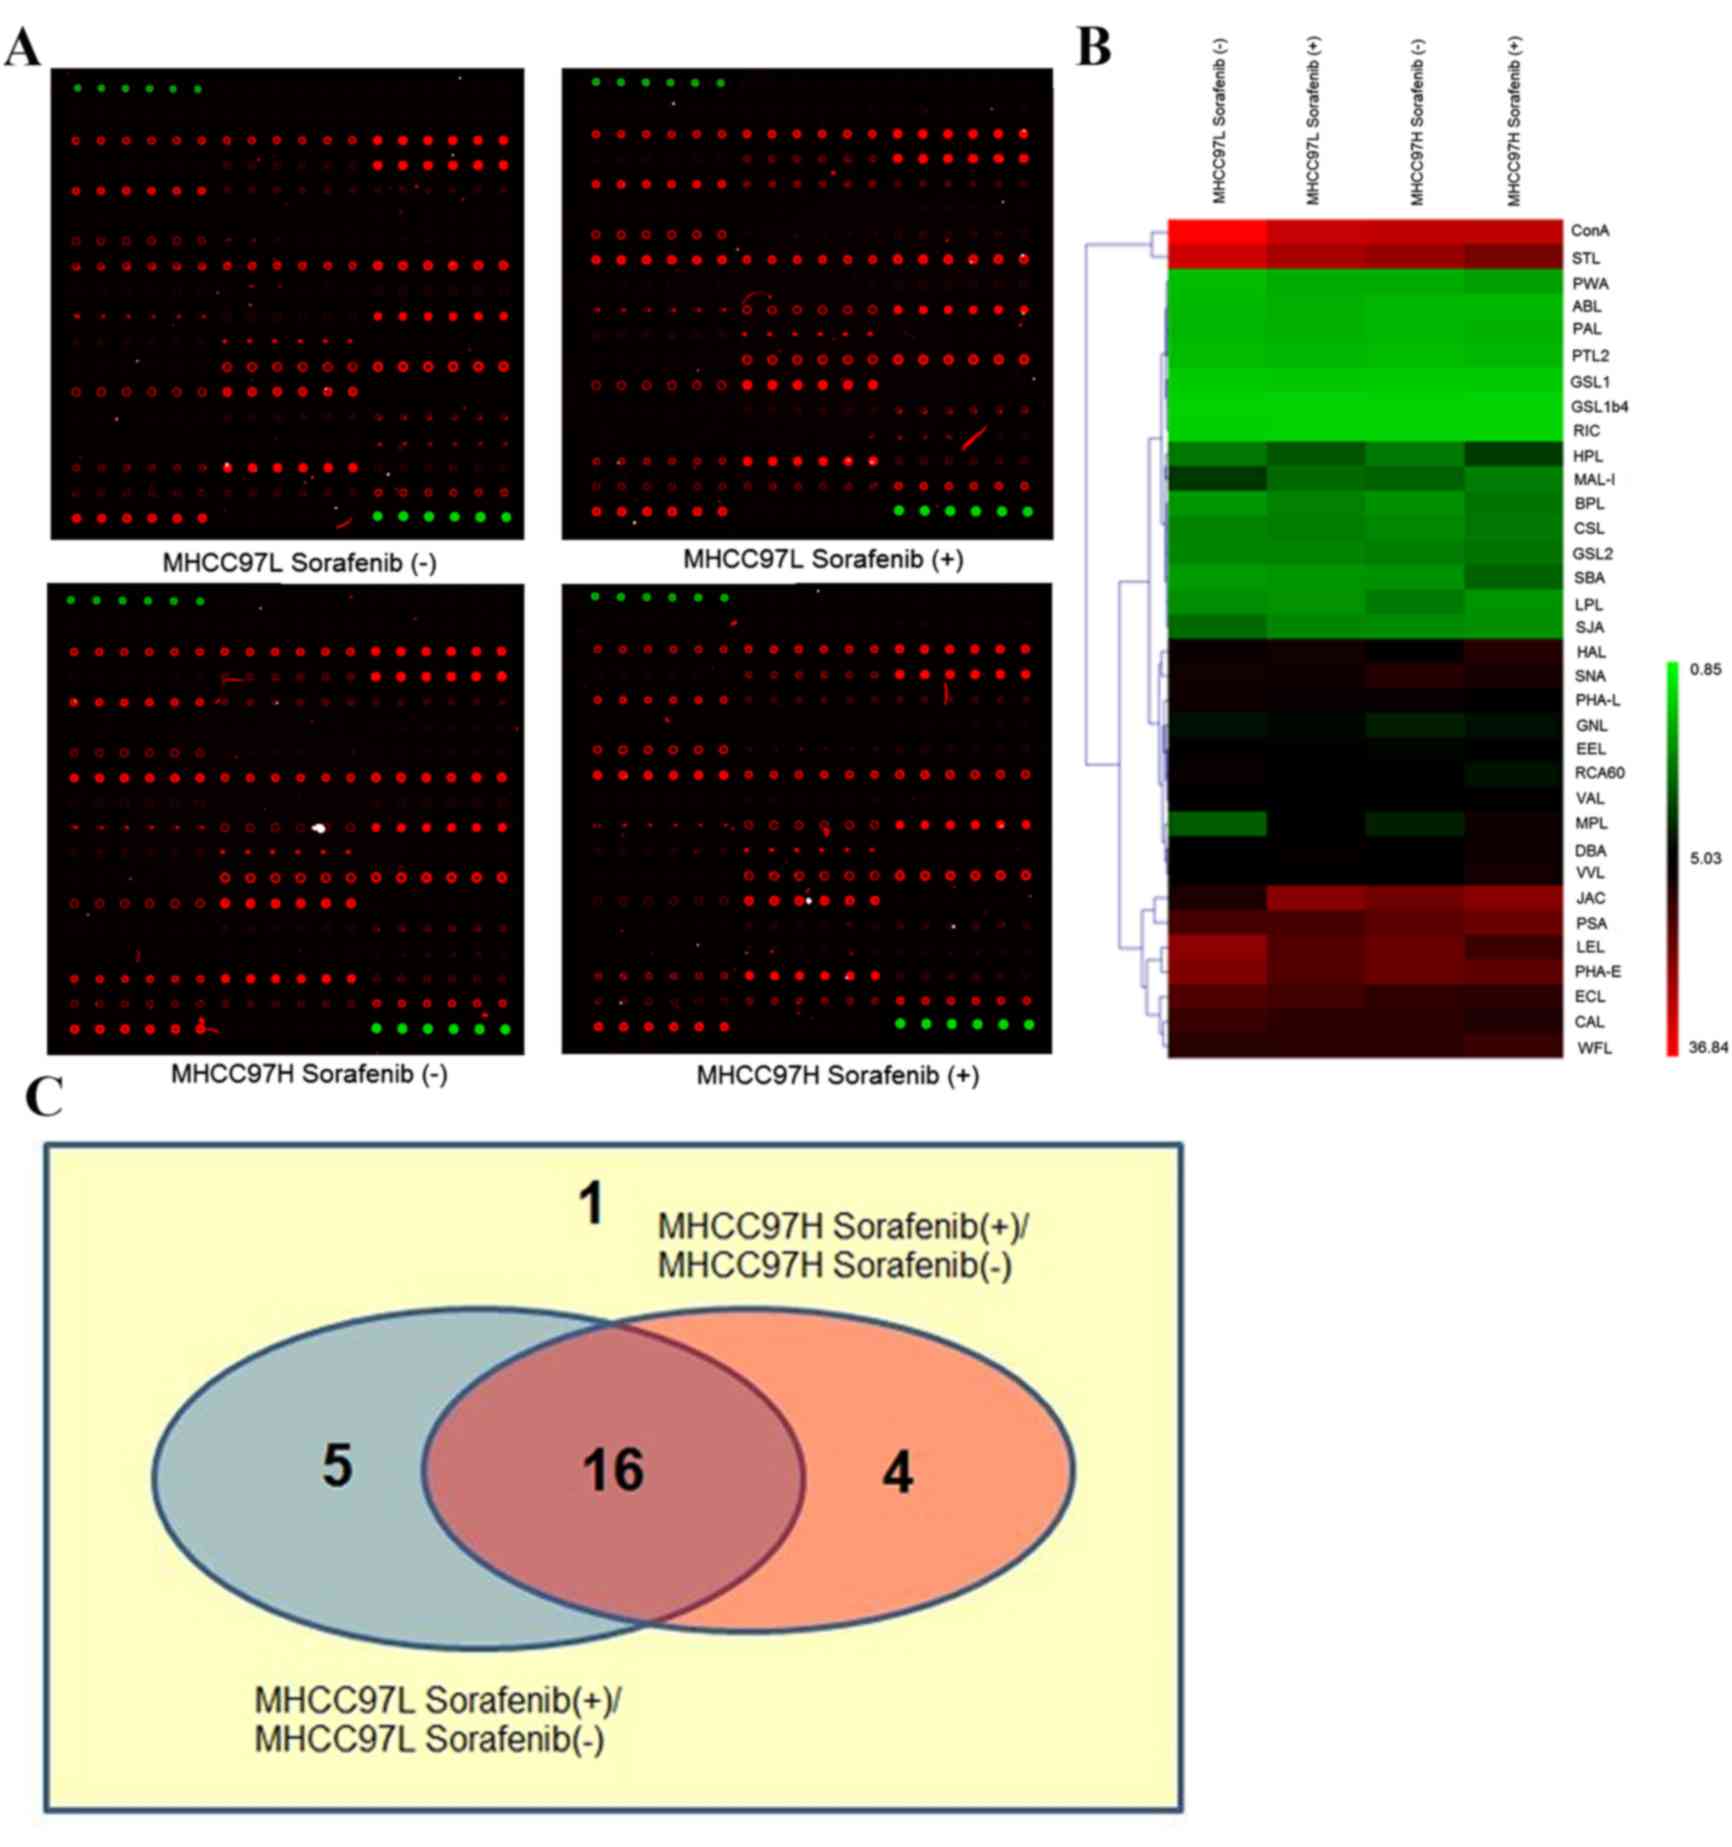
scanner system. The data obtained indicated that the protein
glycosylation profiles had been changed in sorafenib-treated HCC
cells compared with the control groups (Fig. 2A). The binding capacities of 34
lectins had the same tendency in the two types of sorafenib-treated
cells compared with control groups, in which 19 were upregulated
while 15 were downregulated. The hierarchical clustering of S/B of
these lectins was mapped using the MeV 4.8.1 software (Fig. 2B).
Among these 34 lectins, S/B of 26 lectins was ≥2 and
these were defined as positive lectin binding spots (Fig. 2C). Viscum album lectin, shown as ‘1’
in the Venn diagram, was the lectin whose binding capacity was
unchanged in the two types of sorafenib-treated HCC cells compared
with control groups (MHCC97L, P=0.939; MHCC97H, P=0.389).
Concanavalin A, Erythrina crista-galli lectin, Phaseolus
vulgaris Erythroagglutinin, Pisum sativum agglutinin and
Sophora japonica agglutinin, are shown as ‘5’ in the Venn
diagram, and were lectins with P<0.05 in sorafenib-treated
MHCC97L cells compared with untreated MHCC97L cells, but their
binding capacities of proteins in sorafenib-treated MHCC97H cells
were unchanged (P≥0.05). In contrast to the untreated MHCC97H
cells, Cytisus scoparius lectin, Galanthus nivalis
lectin, Griffonia simplicifolia lectin II and wheat germ
agglutinin, (shown as ‘4’ in the Venn diagram), were lectins whose
binding capacities were significantly different in
sorafenib-treated MHCC97H cells (P<0.05), but were not
significant (P≥0.05) in sorafenib-treated MHCC97L cells compared
with the control group. Finally, the binding capacities of 16
letins: Bauhinia purpurea lectin (BPL), Caragana
arborescens lectin (CAL), Dolichos biflorus agglutinin
(DBA), Euonymus europaeus lectin (EEL), Helix aspersa
lectin (HAL), Helix pomatia lectin (HPL), Jacalin (JAC),
Lycopersicon esculentum lectin (LEL), Limulus
polyphemus lectin (LPL), MAL-I, Maclura pomifera lectin
(MPL), PHA-L, Ricinus communis agglutinin 60 (RCA60),
Sambucus nigra lectin (SNA), Solanum tuberosum lectin
(STL) and Vicia villosa lectin (VVL), shown as ‘16’ in the
Venn diagram, were changed significantly in the two
sorafenib-treated HCC cells compared with control groups (all
P<0.05). Their full names and specificities were listed in
Table I.
 | Table I.Lectins with changed binding
capacities and their specific binding abilities. |
Table I.
Lectins with changed binding
capacities and their specific binding abilities.
| Abbreviation | Lectin | Specificity | Monosaccharide
specificity |
|---|
| BPL | Bauhinia
purpurea lectin | Galβ1-3GalNAc | Galactose |
| CAL | Caragana
arborescens lectin |
N-Acetylgalactosamine | GalNAc |
| DBA | Dolichos
biflorus agglutinin | GalNAcα1-3Gal;
GalNAcα-Ser/Thr(Tn) | GalNAc |
| EEL | Euonymus
europaeus lectin |
Galα1-3(Fucα1-2)Gal | Galactose |
| HAL | Helix
aspersa lectin | terminal
N-acetyl-α-D-galactosaminyl residues | αGalNAc |
| HPL | Helix
pomatia lectin |
α-N-acetyl-D-galactosamine | αGalNAc |
| JAC | Jacalin |
Galβ1-3GalNAcα-Ser/Thr(T);
GalNAcα-Ser/Thr(T) | Galactose;
GalNAc |
| LEL | Lycopersicon
esculentum lectin | Ploy-LacNAc;
(GlcNAc)n | LacNAc; GlcNAc |
| LPL | Limulus
polyphemus lectin |
N-acetyl-D-hexosamines | HexNac |
| MAL-I | Maackia
amurensis lecin I | gal (β-1,4) glcNAc;
Siaα2-3Gal | Galactose; Sialic
acid |
| MPL | Maclura
pomifera lectin | αGalNAc T
antigen/Tn antigen | αGalNAc |
| PHA-L | Phaseolus
vulgaris leucoagglutinin | Tetraantennary
complex-type N-glycan | Complex |
| RCA60 | Ricinus
communis agglutinin 60 | galactose;
N-Acetylgalactosamine | Galactose;
GalNAc |
| SNA | Sambucus
nigra lectin |
Sia2-6Galβ1-4GlcNAc | Sialic acid |
| STL | Solanum
tuberosum lectin | (GlcNAc)n | GlcNAc |
| VVL | Vicia
villosa lectin |
N-Acetylgalactosamine;
GalNAcα-Ser/Thr(Tn) | GalNAc |
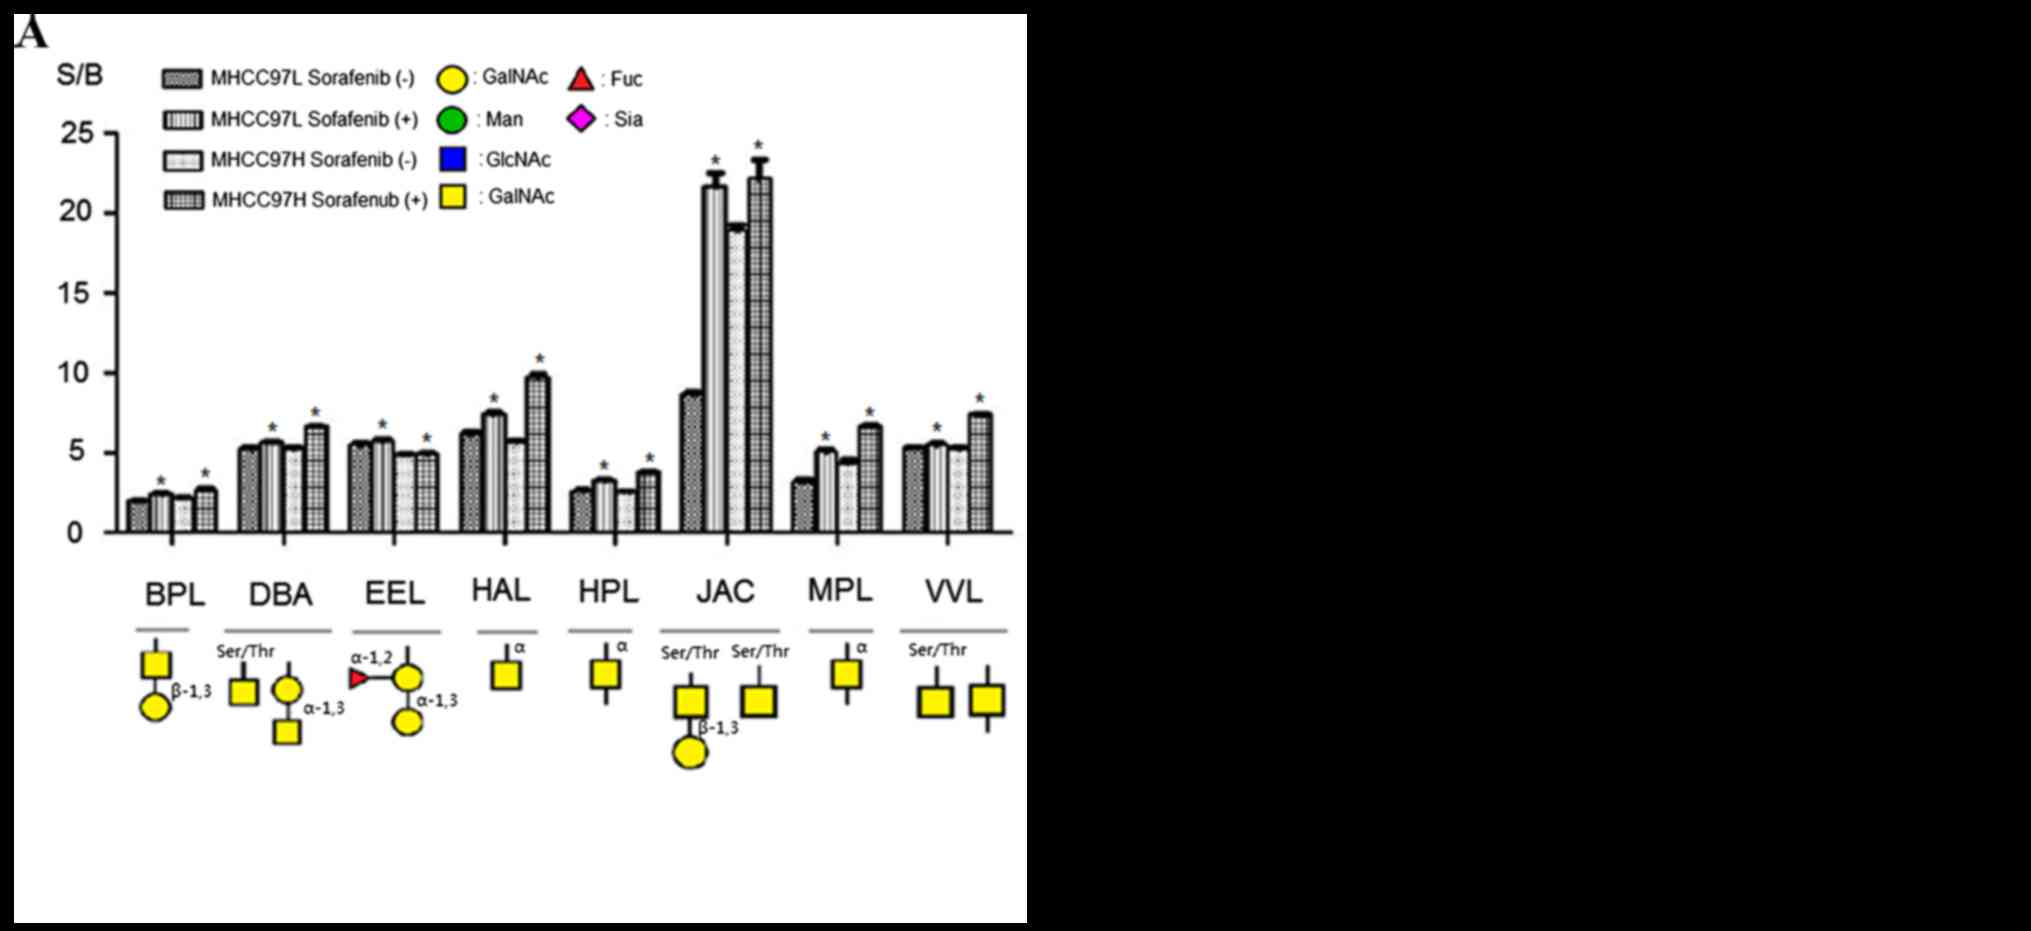
Fig. 3 showed specific
binding abilities and quantitative results of S/B of the
aforementioned 16 lectins. Binding capacities of 8 lectins were
upregulated in sorafenib-treated cells comparing with control
groups (Fig. 3A). This group included
β-1,3Gal binder BPL, Galβ1-3GalNAcα-Ser/Thr(T) and
GalNAcα-Ser/Thr(Tn) binder JAC, α-1,3 Gal binder EEL, α-1,3GalNAc
and GalNAcα-Ser/Thr(Tn) binder DBA, GalNAc and GalNAcα-Ser/Thr(Tn)
binder VVL, α-GalNAc binders HAL, HPL and MPL. By contrast, the
binding capacities of 8 lectins were reduced compared with the
controls; this group of lectins included α-2,3Sia and β-1,4Gal
binder MAL-I, α-2,6Sia binder SNA, GlcNAc and Ploy-LacNAc binder
LEL, GlcNAc binder STL, GlcNAc and GalNAc binder LPL,
tetra-antennary complex-type N-glycan binder PHA-L, Gal and GalNAc
binder RCA60, GalNAc binder CAL (Fig.
3B). According to these results, sorafenib treatment could
increase binding capacities of glycoproteins to α-1,3GalNAc/Gal,
β-1,3Gal, GalNAcα-Ser/Thr(Tn) and αGalNAc binder lectins, but
decrease binding capacities to GlcNAc, sialic acid, tetra-antennary
complex-type N-glycan and β-1,4Gal binder lectins in MHCC97L and
MHCC97H cells.
Validation of protein glycosylation
alteration
To validate these results and provide increased
evidence, lectin blotting was performed using the biotinylated
MAL-I, biotinylated PHA-L lectins. Results are shown in Fig. 4A and additionally confirmed that
sorafenib treatment could reduce sialic acid and tetra-antennary
complex-type N-glycan in HCC cells.
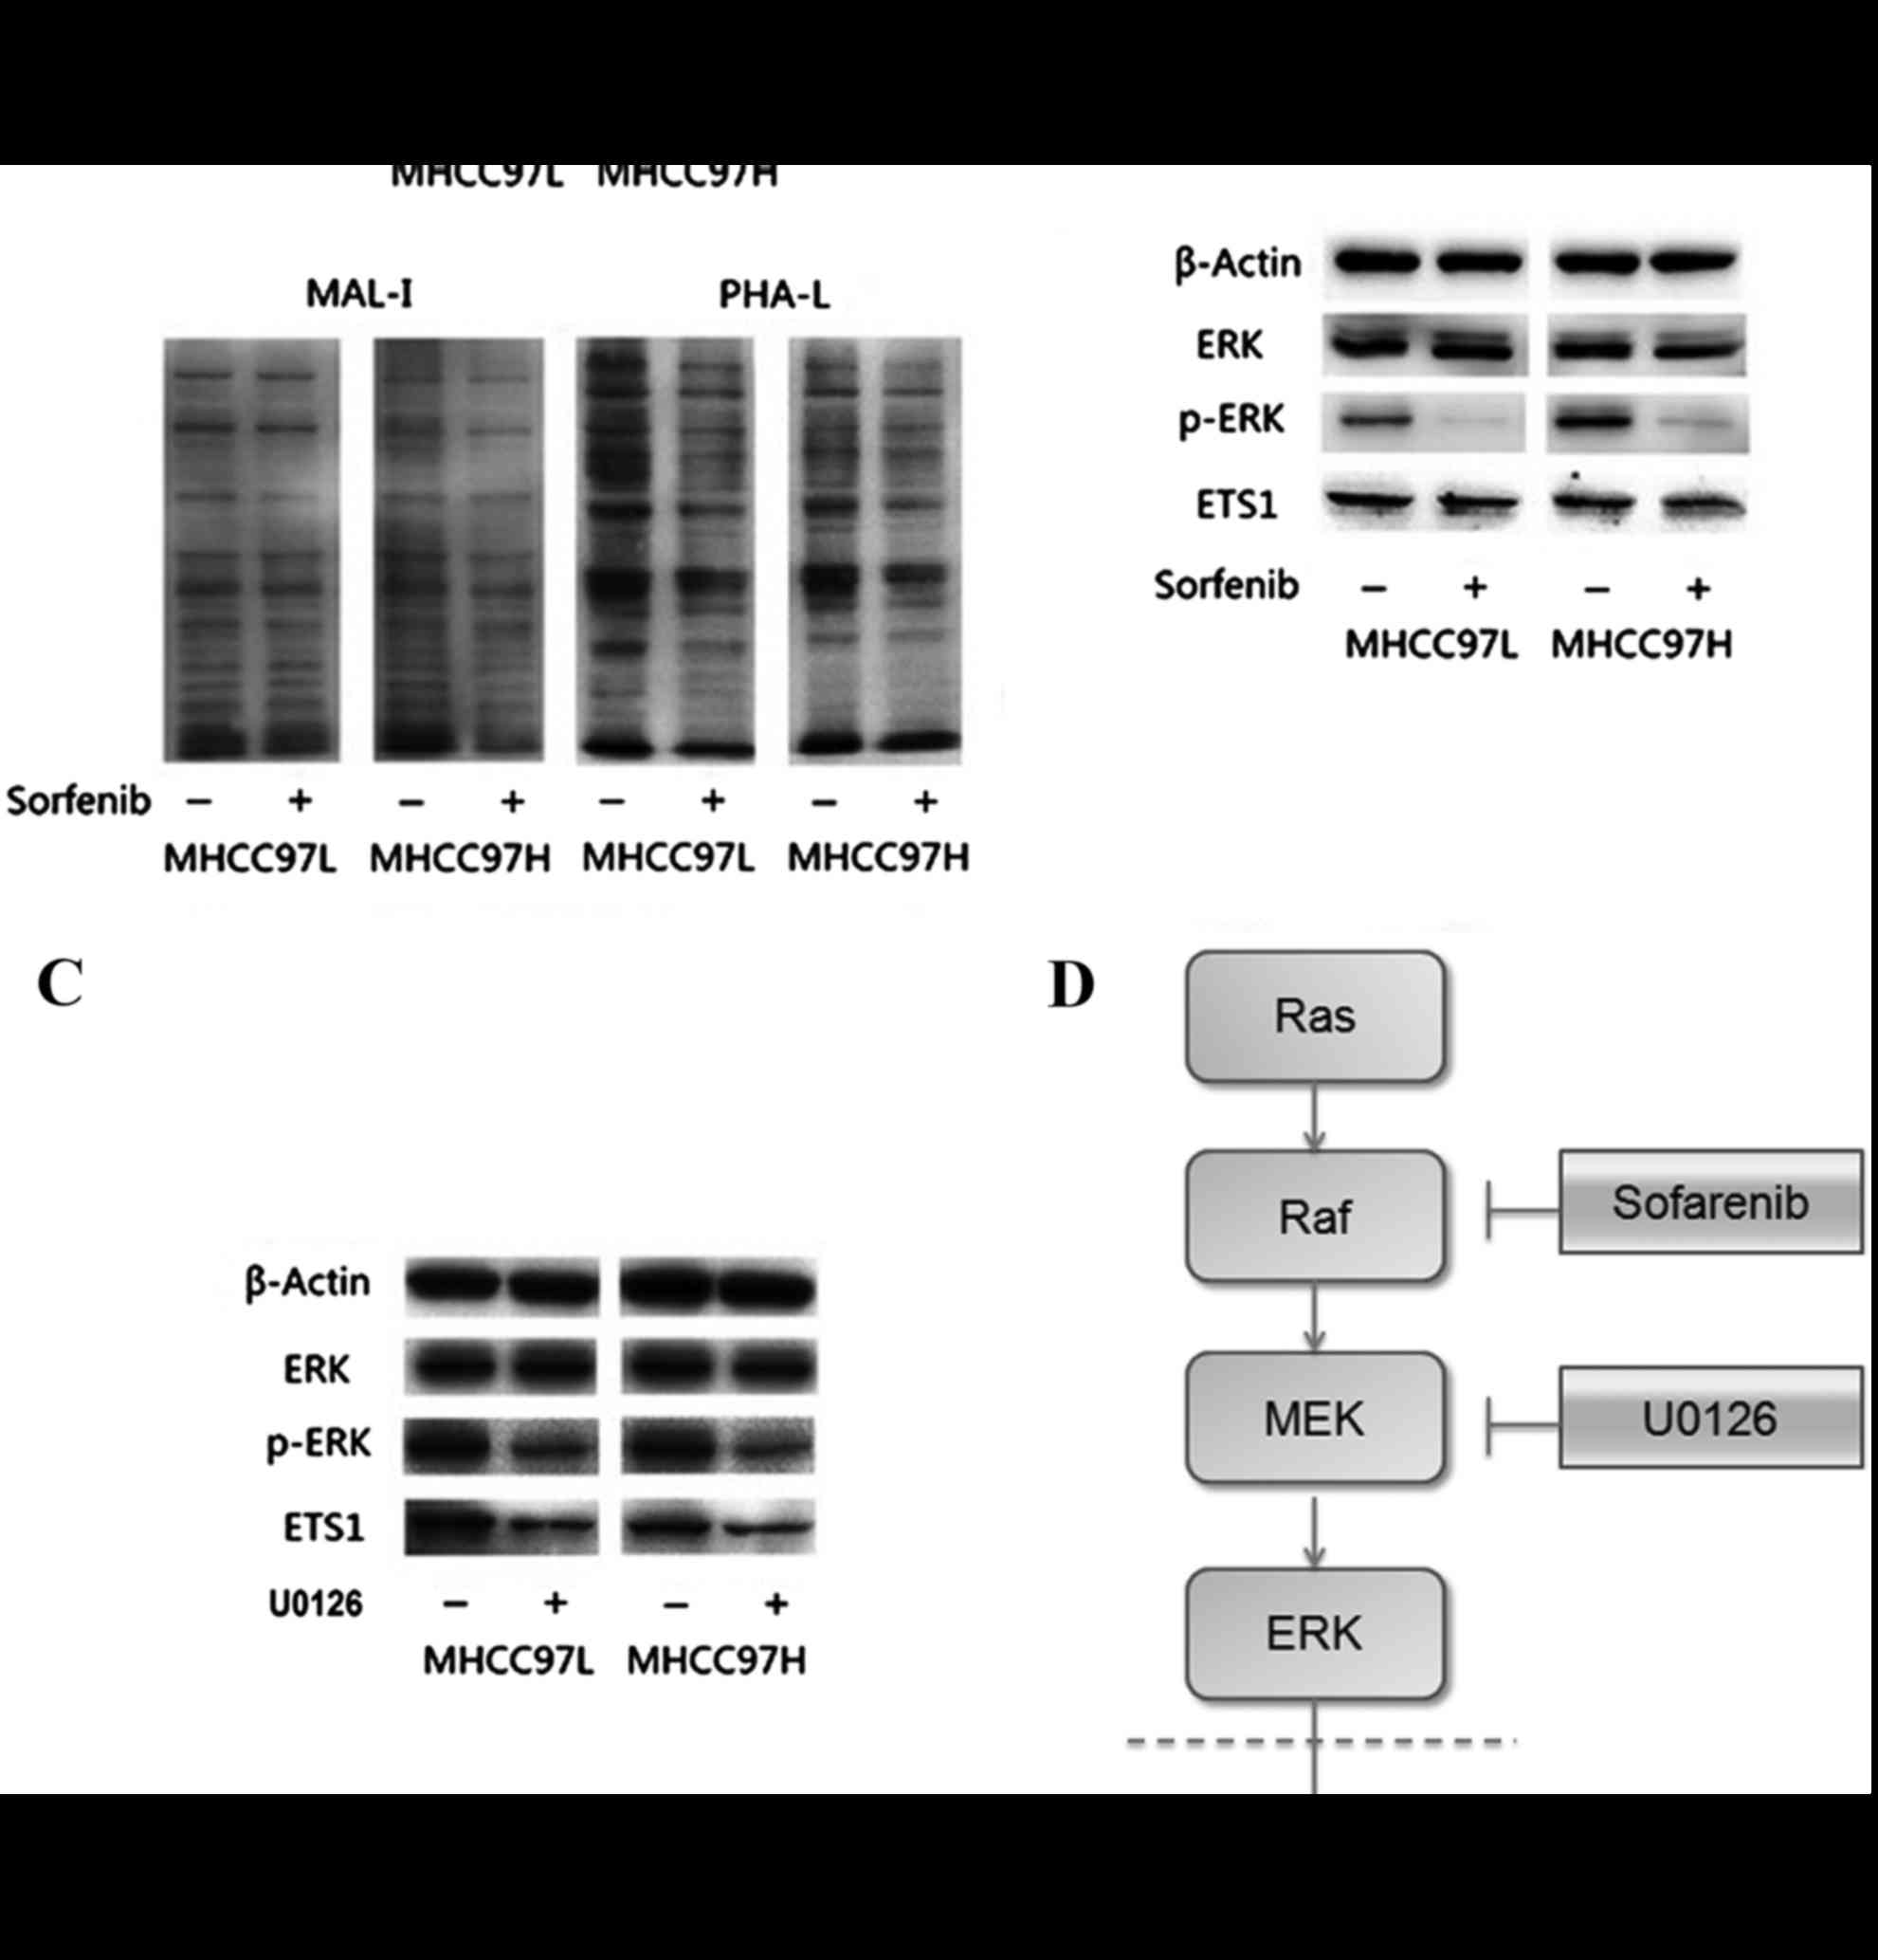 | Figure 4.Results of lectin blotting and western
blotting. (A) Lectin blotting validated Sorafenib induced
alteration by the biotinylated MAL-I and biotinylated PHA-L.
Anti-β-actin antibody was used to show the protein loading. (B)
Downregulation of p-ERK in sorafenib-treated MHCC97L and MHCC97H
cells. (C) Downregulation of p-ERK in MHCC97L and MHCC97H cells
with U0126 treatment. (D) Diagram of the possible mechanism by
which sorafenib treatment reduced the expression of Ets-1.
sorafenib treatment decreased the expression of Ets-1 by blocking
the Ras/Raf/MAPK signaling pathway in HCC cells. MAL-1, Maackia
amurensis lecin I; PHA-L, Phaseolus vulgaris leucoagglutinin;
p-, phosphorylated; MEK, mitogen activated protein kinase; ERK,
extracellular signal-related kinases; Ets-1, erythroblastosis-26;
U0126, 1,4-Diamino-2,3-dicyano-1,4-bis (2-aminophenylthio)
butadiene. |
Sorafenib inhibited the Ras/Raf/MAPK
signaling pathway and reduced the expression of Ets-1
To determine whether sorafenib could affect the
expression of Ets-1, the present study measured expression levels
of Ets-1, ERK and p-ERK by western blotting. As presented in
Fig. 4B, expression levels of ERK
were not apparently altered in sorafenib-treated MHCC97L and
MHCC97H HCC cells. However, the relative band intensity
(sorafenib-treated/without sorafenib-treated) showed that the
expression levels of ERK and Ets-1 phosphorylation were
significantly reduced following sorafenib treatment in both cell
lines compared with the control (all P<0.05). The same results
could be observed in HCC MHCC97L and MHCC97H cells treated with
1,4-Diamino-2,3-dicyano-1,4-bis (2-aminophenylthio) butadiene
(U0126), an inhibitor on kinase activity of MEK1/2 (Fig. 4C).
Discussion
There are 5 types of glycosylation: N-linked
glycosylation; O-linked glycosylation; C-glycosylation;
phosphoglycosylation and glypiation (GPI anchor attachment).
Glycosylation is an important protein posttranslational
modification and regulates numerous critical cellular processes.
Blomme et al (22) revealed
that in association with the development of HCC, the
N-glycosylation of serum proteins was modified and the branching
was increased. The study by Dennis et al (23) has shown that high branching of
N-linked glycans appears to be associated with the development of
malignancy. Shao et al (24)
has suggested that an increased formation of tetra-antennary
complex-type N-glycan may contribute to the malignant and
metastatic potential of tumor cells. A recent study revealed that
sialylation may regulate the invasion and chemosensitivity of HCC
by regulating the activity of the phosphoinositol 3-kinase/protein
kinase B signaling pathway (25).
The present study demonstrated that glycosylation
was altered in sorafenib-treated HCC cells. Glycosylation profiles
were analyzed in a rapid, sensitive and high-throughput manner
using the lectin microarray. In contrast to the control groups,
glycoproteins extracted from sorafenib-treated HCC cells had
altered binding capacities to 16 lectins (S/B≥2, P<0.05).
Previous studies regarding sorafenib have mostly focused on
discovering associated signaling molecules as potential targets for
the therapy of HCC. To the best of our knowledge, the present study
is the first report on the effect of sorafenib on glycosylation
profiles. The present study demonstrated that the binding
capacities of proteins extracted from sorafenib treated HCC cells
to α-1,3GalNAc/Gal, β-1,3Gal, GalNAcα-Ser/Thr(Tn) and αGalNAc
binder lectins were upregulated, while binding capacities to
GlcNAc, sialic acid, tetra-antennary complex-type N-glycan and
β-1,4Gal binder lectins were downregulated. These results suggest
that sorafenib may inhibit the progression of HCC by affecting
chain structures of glycoproteins. In addition, this finding
provides a novel way for designing new anti-HCC drugs by
anti-abnormal glycosylation.
In the HCC model PLC/PRF/5, sorafenib could block
the Ras/Raf/MAPK signaling pathway (12), and the present western blotting
results were consistent with this finding. Furthermore, it was
first identified and confirmed that the expression of Ets-1, which
is associated with tumor angiogenesis and tumor invasion, was
reduced following the blocking of the Ras/Raf/MAPK signaling
pathway with sorafenib or U0126 (Fig.
4D). Circumstantial evidence from an earlier study led the
authors to consider that blocking the Ras/Raf/MAPK signaling
pathway may affect the activation of vascular endothelial growth
factor by inhibited ERK phosphorylation, which then leads to a
reduced expression of Ets-1 (26).
The expression levels of downstream Ets-1 in the Ras/Raf/MAPK
signaling path way exhibited a pattern similar to GnT-V expression
in a variety of HCC cell lines, including HuH7, Hep3B and HepG2,
and Ets-1 would be expected to promote tumor metastasis by
enhancing the expression of
UDP-N-acetylglucosamine:α-6-D-manno-side
β1-6-N-acetylglucosaminyltransferase (GnT-V; enzyme accession
number, EC2.4.1.155) (27). Glycans
are catalyzed by glycosyltransferases. The concept of one
enzyme-one linkage describes that glycosyltransferases are specific
for a single glycosyl donor, acceptor or alteration in
transcription (28,29). Changes in expression levels of
glycosyltransferases are associated with abnormal glycosylation
(30). GnT-V located in the golgi
apparatus synthesizes tetra-antennary complex-type N-glycan and the
increased tetra-antennary complex-type N-glycan is linked to
increased tumor metastasis (31,32). The
gene Mgat5 codes for GnT-V and there are 3 Ets binding sites
located in the 5′ flanking region of Mgat5 and expression levels of
Ets-1 and GnT-V are similar in human hepatoma tissues (27). The present results highlighted that
tetra-antennary complex-type N-glycan was reduced in
sorafenib-treated HCC cells. However, additional studies are
required to determine whether sorafenib reduces the tetra-antennary
complex-type N-glycan by affecting the expression of GnT-V by
blocking the Ras/Raf/MAPK signaling pathway. In addition,
influences of altered glycosylation by sorafenib treatment to HCC
cells biological behavior may be worthy of additional
investigation.
In conclusion, the present findings indicate that
sorafenib could inhibit proliferation of HCC cells and in
sorafenib-treated HCC cells glycan structures α-1,3GalNAc/Gal,
β-1,3Gal, GalNAcα-Ser/Thr(Tn) and α-GalNAc were highly expressed,
while GlcNAc, sialic acid, tetra-antennary complex-type N-glycan
and β-1,4Gal had low expression levels. Furthermore, the present
study is the first to identify that sorafenib reduces the
expression of Ets-1, which was associated with the glycosylation of
proteins, by blocking the Ras/Raf/MAPK signaling pathway. The
present findings may therefore provide research to identify new
anti-HCC drugs.
Acknowledgements
The present study was supported by the National
Basic Research Program of China (973 Program; grant no.
2011CB910604) and the China National Key Projects for Infectious
Diseases (grant nos. 2012ZX 10002-009 and 2012ZX 10002-012).
References
|
1
|
Ferlay J, Shin HR, Bray F, Forman D,
Mathers C and Parkin DM: Estimates of worldwide burden of cancer in
2008: GLOBOCAN 2008. Int J Cancer. 127:2893–2917. 2010. View Article : Google Scholar : PubMed/NCBI
|
|
2
|
Center MM and Jemal A: International
trends in liver cancer incidence rates. Cancer Epidemiol Biomarkers
Prev. 20:2362–2368. 2011. View Article : Google Scholar : PubMed/NCBI
|
|
3
|
Nault JC and Zucman-Rossi J: Genetics of
hepatobiliary carcinogenesis. Semin Liver Dis. 31:173–187. 2011.
View Article : Google Scholar : PubMed/NCBI
|
|
4
|
Wong CH: Protein glycosylation: New
challenges and opportunities. J Org Chem. 70:4219–4225. 2005.
View Article : Google Scholar : PubMed/NCBI
|
|
5
|
Ohtsubo K and Marth JD: Glycosylation in
cellular mechanisms of health and disease. Cell. 126:855–867. 2006.
View Article : Google Scholar : PubMed/NCBI
|
|
6
|
Li M, Song L and Qin X: Glycan changes:
Cancer metastasis and anti-cancer vaccines. J Biosci. 35:665–673.
2010. View Article : Google Scholar : PubMed/NCBI
|
|
7
|
Comunale MA, Wang M, Hafner J, Krakover J,
Rodemich L, Kopenhaver B, Long RE, Junaidi O, Bisceglie AM, Block
TM and Mehta AS: Identification and development of fucosylated
glycoproteins as biomarkers of primary hepatocellular carcinoma. J
Proteome Res. 8:595–602. 2009. View Article : Google Scholar : PubMed/NCBI
|
|
8
|
Ang IL, Poon TC, Lai PB, Chan AT, Ngai SM,
Hui AY, Johnson PJ and Sung JJ: Study of serum haptoglobin and its
glycoforms in the diagnosis of hepatocellular carcinoma: A
glycoproteomic approach. J Proteome Res. 5:2691–2700. 2006.
View Article : Google Scholar : PubMed/NCBI
|
|
9
|
Chen GQ, Zhang Q, Xu YF, Zhang WZ, Guan M,
Su B, Liang HQ and Lu Y: Changes of alkaline phosphatase sugar
chains in hepatocellular carcinoma tissue. Zhonghua Gan Zang Bing
Za Zhi. 11:739–741. 2003.(In Chinese). PubMed/NCBI
|
|
10
|
Chow AK, Ng L, Lam CS, Wong SK, Wan TM,
Cheng NS, Yau TC, Poon RT and Pang RW: The Enhanced metastatic
potential of hepatocellular carcinoma (HCC) cells with sorafenib
resistance. PloS One. 8:e786752013. View Article : Google Scholar : PubMed/NCBI
|
|
11
|
Wilhelm SM, Carter C, Tang L, Wilkie D,
McNabola A, Rong H, Chen C, Zhang X, Vincent P, McHugh M, et al:
BAY 43–9006 exhibits broad spectrum oral antitumor activity and
targets the RAF/MEK/ERK pathway and receptor tyrosine kinases
involved in tumor progression and angiogenesis. Cancer Res.
64:7099–7109. 2004. View Article : Google Scholar : PubMed/NCBI
|
|
12
|
Liu L, Cao Y, Chen C, Zhang X, McNabola A,
Wilkie D, Wilhelm S, Lynch M and Carter C: Sorafenib blocks the
RAF/MEK/ERK pathway, inhibits tumor angiogenesis, and induces tumor
cell apoptosis in hepatocellular carcinoma model PLC/PRF/5. Cancer
Res. 66:11851–11858. 2006. View Article : Google Scholar : PubMed/NCBI
|
|
13
|
Llovet JM, Ricci S, Mazzaferro V, Hilgard
P, Gane E, Blanc JF, De Oliveira AC, Santoro A, Raoul JL, Forner A,
et al: Sorafenib in advanced hepatocellular carcinoma. N Engl J
Med. 359:378–390. 2008. View Article : Google Scholar : PubMed/NCBI
|
|
14
|
Deng YR, Liu WB, Lian ZX, Li X and Hou X:
Sorafenib inhibits macrophage-mediated epithelial-mesenchymal
transition in hepatocellular carcinoma. Oncotarget. 7:38292–38305.
2016.PubMed/NCBI
|
|
15
|
Fu QH, Zhang Q, Zhang JY, Sun X, Lou Y, Li
GG, Chen ZL, Bai XL and Liang TB: LB-100 sensitizes hepatocellular
carcinoma cells to the effects of sorafenib during hypoxia by
activation of Smad3 phosphorylation. Tumour Biol. 37:7277–7286.
2016. View Article : Google Scholar : PubMed/NCBI
|
|
16
|
Adjibade P, St-Sauveur VG, Huberdeau M
Quevillon, Fournier MJ, Savard A, Coudert L, Khandjian EW and
Mazroui R: Sorafenib, a multikinase inhibitor, induces formation of
stress granules in hepatocarcinoma cells. Oncotarget.
6:43927–43943. 2015.PubMed/NCBI
|
|
17
|
Xin AJ, Cheng L, Diao H, Wang P, Gu YH, Wu
B, Wu YC, Chen GW, Zhou SM, Guo SJ, et al: Comprehensive profiling
of accessible surface glycans of mammalian sperm using a lectin
microarray. Clin Proteomics. 11:102014. View Article : Google Scholar : PubMed/NCBI
|
|
18
|
Tan Z, Lu W, Li X, Yang G, Guo J, Yu H, Li
Z and Guan F: Altered N-Glycan expression profile in
epithelial-to-mesenchymal transition of NMuMG cells revealed by an
integrated strategy using mass spectrometry and glycogene and
lectin microarray analysis. J Proteome Res. 13:2783–2795. 2014.
View Article : Google Scholar : PubMed/NCBI
|
|
19
|
Li S, Mo C, Peng Q, Kang X, Sun C, Jiang
K, Huang L, Lu Y, Sui J, Qin X and Liu Y: Cell surface glycan
alterations in epithelial mesenchymal transition process of Huh7
hepatocellular carcinoma cell. PloS one. 8:e712732013. View Article : Google Scholar : PubMed/NCBI
|
|
20
|
Gu Y, Tang Y, Zhou X and Liu Y: Alteration
of the glycan profile of serum glycoproteins during the
seroconversion process in hepatitis B virus-infected patients
treated with antiviral therapy and its clinical significance.
Zhonghua Gan Zang Bing Za Zhi. 22:660–666. 2014.(In Chinese).
PubMed/NCBI
|
|
21
|
Li Y, Tang ZY, Ye SL, Liu YK, Chen J, Xue
Q, Chen J, Gao DM and Bao WH: Establishment of cell clones with
different metastatic potential from the metastatic hepatocellular
carcinoma cell line MHCC97. World J Gastroenterol. 7:630–636.
2001.PubMed/NCBI
|
|
22
|
Blomme B, van Steenkiste C, Callewaert N
and Van Vlierberghe H: Alteration of protein glycosylation in liver
diseases. J Hepatol. 50:592–603. 2009. View Article : Google Scholar : PubMed/NCBI
|
|
23
|
Dennis JW, Laferte S, Waghorne C, Breitman
ML and Kerbel RS: Beta 1–6 branching of Asn-linked oligosaccharides
is directly associated with metastasis. Science. 236:582–585. 1987.
View Article : Google Scholar : PubMed/NCBI
|
|
24
|
Shao DM, Wang QH, Chen C, Shen ZH, Yao M,
Zhou XD, Tang ZY and Gu JX: N-acetylglucosaminyltransferase V
activity in metastatic models of human hepatocellular carcinoma in
nude mice. J Exp Clin Cancer Res. 18:331–335. 1999.PubMed/NCBI
|
|
25
|
Zhao Y, Li Y, Ma H, Dong W, Zhou H, Song
X, Zhang J and Jia L: Modification of sialylation mediates the
invasive properties and chemosensitivity of human hepatocellular
carcinoma. Mol Cell Proteomics. 13:520–536. 2014. View Article : Google Scholar : PubMed/NCBI
|
|
26
|
Watanabe D, Takagi H, Suzuma K, Suzuma I,
Oh H, Ohashi H, Kemmochi S, Uemura A, Ojima T, Suganami E, et al:
Transcription factor Ets-1 mediates ischemia- and vascular
endothelial growth factor-dependent retinal neovascularization. Am
J Pathol. 164:1827–1835. 2004. View Article : Google Scholar : PubMed/NCBI
|
|
27
|
Ko JH, Miyoshi E, Noda K, Ekuni A, Kang R,
Ikeda Y and Taniguchi N: Regulation of the GnT-V promoter by
transcription factor Ets-1 in various cancer cell lines. J Biol
Chem. 274:22941–22948. 1999. View Article : Google Scholar : PubMed/NCBI
|
|
28
|
Tamagawa H, Inoshita E, Takeshita T,
Takagaki M, Shizukuishi S and Tsunemitsu A: Purification and some
properties of fucosyltransferase in human parotid saliva. J Dent
Res. 66:72–77. 1987. View Article : Google Scholar : PubMed/NCBI
|
|
29
|
Galili U: Interaction of the natural
anti-Gal antibody with alpha-galactosyl epitopes: A major obstacle
for xenotransplantation in humans. Immunol Today. 14:480–482. 1993.
View Article : Google Scholar : PubMed/NCBI
|
|
30
|
Venkitachalam S, Revoredo L, Varadan V,
Fecteau RE, Ravi L, Lutterbaugh J, Markowitz SD, Willis JE, Gerken
TA and Guda K: Biochemical and functional characterization of
glycosylation-associated mutational landscapes in colon cancer. Sci
Rep. 6:236422016. View Article : Google Scholar : PubMed/NCBI
|
|
31
|
Kizuka Y and Taniguchi N: Enzymes for
N-glycan branching and their genetic and nongenetic regulation in
cancer. Biomolecules. 6:E252016. View Article : Google Scholar : PubMed/NCBI
|
|
32
|
Taniguchi N and Kizuka Y: Glycans and
cancer: Role of N-glycans in cancer biomarker, progression and
metastasis, and therapeutics. Adv Cancer Res. 126:11–51. 2015.
View Article : Google Scholar : PubMed/NCBI
|