Introduction
Epithelial ovarian cancer (EOC), the primary
gynecological cause of oncological mortality, accounts for 4% of
all cancer types in women (1).
Despite medical and surgical advances, patients with advanced EOC
continue to endure poor long-term survival rates (2). This is largely a result of the limited
understanding of the molecular mechanisms of EOC pathogenesis.
Recently, marked achievements in the investigation
of molecular mechanisms of EOC have been made. In ovarian cancer
cells, the Janus kinase 2/signal transducer and activator of
transcription 3 pathway was found to be constitutively active and
directly dependent on the activation of epidermal growth factor
receptor (EGFR) or interleukin 6 receptor (IL-6R) (3); this pathway is required to sustain
EGF-induced epithelial-mesenchymal transition-associated phenotypes
in ovarian cancer cells (4). A
previous study also demonstrated that the Kirsten rat sarcoma 2
viral homolog (KRAS)-V-Raf murine sarcoma viral oncogene homolog B1
(BRAF)-mitogen-activated protein kinase kinase 1
(MEK)-mitogen-activated protein kinase 1 (MAPK) pathway has a key
biological role in the development of serous EOC tumors, and
activating mutations in KRAS or BRAF result in the
constitutive activation of MAPK-mediated signaling (5). Mutations in BRCA1/2 are
frequently identified in high-grade serous ovarian cancer; these
mutations sensitize EOC patients to the inhibition of poly
(ADP-ribose) polymerase-1, increasing the number of patients who
benefit (6). Furthermore, low
expression of the microRNA (miRNA/miR) miR-100 is associated with
the shorter overall survival times of EOC patients; miR-100 affects
the growth of EOC cells by post-transcriptionally regulating
polo-like kinase 1 expression (7). A
previous study demonstrated that overexpression of miR-193a and
miR-193b activates caspase 3/7, leading to apoptotic cell death in
EOC A2780 cells (8).
Ovarian surface epithelia cells have long been
hypothesized to be crucial progenitors of serous EOC (9). In 2009, Bowen et al (10) revealed that differentially expressed
genes (DEGs) of human ovarian surface epithelial cells are
implicated in the cell-cycle pathway, as well as the WNT, hedgehog
and retinoid pathways, which had previously been implicated in the
development of EOC. In 2012, Lee et al (11) observed that the presence of a
combination of five genes (1-acylglycerol-3-phosphate
O-acyltransferase 1, β-2-microglobulin, immediate early response 3,
interleukin 1 β and brain abundant membrane attached signal protein
1) in the saliva had the robust ability to detect ovarian cancer,
based on the highest area under the curve value from a receiver
operating characteristic plot. The study by Lee et al
(11) demonstrated that RNA
signatures in saliva acted as biomarkers for the detection of
ovarian cancer with high specificity and sensitivity; however, the
study only used a single sample source in its analysis and did not
investigate regulatory mechanisms involving transcription factors
(TFs) or miRNAs. Therefore, more potential molecular mechanisms of
EOC pathogenesis must be revealed.
In the present study, two gene expression profile
datasets, GSE14407 deposited by Bowen et al (10) and GSE29220 deposited by Lee et
al (11), were combined to
identify potential key genes and their regulators associated with
the pathogenesis of EOC. DEGs between EOC and control samples were
screened for, and their functions were analyzed using Gene Ontology
(GO) functional analysis and pathway enrichment analysis. A
protein-protein interaction (PPI) network was the constructed for
these DEGs. Functional enrichment analysis of genes in the PPI
network modules was also performed, and potential regulatory TFs
and miRNAs of these DEGs were predicted. This microarray analysis
may be conducive to providing novel information for the study of
EOC pathogenesis and could provide potential biomarkers for the
therapy of EOC.
Materials and methods
Affymetrix microarray data
The gene expression profile data of GSE14407
(10) and GSE29220 (11) were obtained from the Gene Expression
Omnibus (GEO, http://www.ncbi.nlm.nih.gov/geo/) database, which was
based on the platform of the GPL570 [HG-U133_Plus_2] Affymetrix
Human Genome U133 Plus 2.0 Array (Affymetrix, Inc., Santa Clara,
CA, USA). The GSE14407 dataset contains 12 samples of epithelial
cells from patients with serous papillary ovarian adenocarcinomas
and 12 normal human ovarian surface epithelial cell samples.
GSE29220 contains 11 salivary transcriptomes from ovarian cancer
patients with serous papillary adenocarcinoma and 11 matched
controls.
CEL files and probe annotation files were downloaded
and the two datasets were combined into one matrix expression
profile. The batch deviation (12) in
the gene expression data of all samples was wiped out by ComBat
order in the surrogate variable analysis package in R (version
3.22.0; http://www.bioconductor.org/packages/release/bioc/html/sva.html)
(13). The data were then
preprocessed using background correction, quantile normalization
and expression calculation using the preprocessCore package in R
(version 1.36.0; http://www.bioconductor.org/packages/release/bioc/html/preprocessCore.html)
(14). Afterwards, probe IDs were
translated into gene symbols. If one gene symbol was matched by
multiple probe IDs, the mean expression value was selected as the
expression level of the gene.
DEG screening
Genes that differed significantly in their
expression in EOC samples were identified by the Linear Models for
Microarray Data package (version 3.30.13; http://www.bioconductor.org/packages/release/bioc/html/limma.html)
(15). The raw P-value was adjusted
using the Benjamini-Hochberg method (16) and only the genes with a |log2Fold
change|>1 and an adjusted P-value <0.05 were identified as
DEGs in ovarian cancer samples.
GO functional and pathway enrichment
analyses
The screened DEGs were submitted to the Database for
Annotation, Visualization and Integrated Discovery (DAVID)
(17) for GO functional analysis and
Kyoto Encyclopedia of Genes and Genomes (18) pathway enrichment analysis, with a
cut-off of P<0.05.
PPI network construction
The Search Tool for the Retrieval of Interacting
Genes (http://string-db.org/) (19) was used to analyze the PPIs for DEGs by
calculating their combined score; a score >0.4 was chosen as the
cut-off point. PPI networks of upregulated and downregulated DEGs
were then visualized by Cytoscape (version 3.4.0; http://cytoscape.org/) (20). Hub proteins (the essential proteins in
PPI networks, which have higher degrees) (21) were screened by counting the degree of
connectivity of each node in the network. In the network, a node
represents a protein (gene) and lines represent the interactions of
the proteins. The ‘degree’ of each node refers to the number of
nodes that interact with this node. The larger the degree is, the
closer the connections with other nodes are.
Screening and analysis of relevant
network modules
On the basis of MCODE analysis (22) of original PPI networks, the network
modules were obtained with a cut-off criterion of an MCODE score of
>5. In order to achieve a better understanding of the function
of genes in modules at the molecular level, functional annotation
was performed using DAVID and the functional enrichment network was
visualized using the plug-in enrichment map in Cytoscape (version
3.4.0; http://cytoscape.org/) (23).
Construction of integrated TF-DEG
regulatory network and miRNA-DEG regulatory network
The University of California Santa Cruz database
(http://genome.ucsc.edu/) (24) was used to obtain information on the
associations between DEGs and related TFs. The integrated
regulatory networks containing TFs with the 5 highest degrees and
their corresponding upregulated or downregulated DEGs were then
respectively visualized by Cytoscape (version 3.4.0, http://cytoscape.org/).
The common miRNAs predicted to be expressed by the
databases of miRecords (http://c1.accurascience.com/miRecords/) (25), TarBase (http://diana.imis.athena-innovation.gr/DianaTools/index.php?r=tarbase/index)
(26) and TargetScan (http://www.targetscan.org/) (27) were selected for the DEGs.
Subsequently, the upregulated and downregulated miRNA-DEG
regulatory networks were respectively visualized using Cytoscape
(version 3.4.0, http://cytoscape.org/).
Results
Identification of DEGs
After data preprocessing, 20,927 probes were
obtained. On the basis of the cut-off criteria, 95 DEGs, including
31 upregulated DEGs and 64 downregulated DEGs, were screened.
Enrichment analysis of upregulated and
downregulated DEGs
To reveal the functions of DEGs, GO functional and
pathway enrichment analyses were conducted. Upregulated DEGs,
including non-SMC condensin I complex subunit H, BUB1 mitotic
checkpoint serine/threonine kinase B, CENPF and baculoviral
IAP repeat containing 5 (BIRC5), were significantly enriched
in the following functional terms: M phase
(P=1.56×10⁻⁶), mitosis (P=2.36×10⁻⁶),
microtubule cytoskeleton (P=1.78×10⁻⁵), chromosome
(P=4.44×10⁻⁵) and ATP binding (P=2.58×10⁻²)
(Table I). Meanwhile, several DEGs in
the Wnt signaling pathway (SRY-box 17, frizzled class receptor 2
and Wnt family member 7a) were clearly enriched
(P=1.6678×10⁻²) (Table
II).
 | Table I.Top 5 enriched terms for upregulated
and downregulated differently expressed genes in BP, CC and MF
categories. |
Table I.
Top 5 enriched terms for upregulated
and downregulated differently expressed genes in BP, CC and MF
categories.
| Category | Term | Count | P-value | Genes |
|---|
| Upregulated |
|
|
|
|
|
GOTERM_BP_FAT | GO:0000279-M
phase | 8 |
1.56×10⁻⁶ | NCAPH, MKI67,
TPX2, BUB1B, CENPF, BIRC5, ESPL1, ERCC6L |
|
GOTERM_BP_FAT |
GO:0007067-mitosis | 7 | 2.36×10⁻⁶ | NCAPH, TPX2,
BUB1B, CENPF, BIRC5, ESPL1, ERCC6L |
|
GOTERM_BP_FAT | GO:0000280-nuclear
division | 7 |
2.36×10⁻⁶ | NCAPH, TPX2,
BUB1B, CENPF, BIRC5, ESPL1, ERCC6L |
|
GOTERM_BP_FAT | GO:0000087-M phase
of mitotic cell cycle | 7 | 2.62×10⁻⁶ | NCAPH, TPX2,
BUB1B, CENPF, BIRC5, ESPL1, ERCC6L |
|
GOTERM_BP_FAT |
GO:0048285-organelle fission | 7 |
2.98×10⁻⁶ | NCAPH, TPX2,
BUB1B, CENPF, BIRC5, ESPL1, ERCC6L |
|
GOTERM_CC_FAT |
GO:0015630-microtubule cytoskeleton | 8 | 1.78×10⁻⁵ | KIF4A, TPX2,
BUB1B, CENPF, BIRC5, ESPL1, TOP2A, KIF20A |
|
GOTERM_CC_FAT |
GO:0000775-chromosome, centromeric
region | 5 |
4.44×10⁻⁵ | MKI67, BUB1B,
CENPF, BIRC5, ERCC6L |
|
GOTERM_CC_FAT |
GO:0000793-condensed chromosome | 5 | 5.19×10⁻⁵ | NCAPH, MKI67,
BUB1B, CENPF, ERCC6L |
|
GOTERM_CC_FAT |
GO:0005694-chromosome | 7 |
7.20×10⁻⁵ | NCAPH, MKI67,
BUB1B, CENPF, BIRC5, TOP2A, ERCC6L |
|
GOTERM_CC_FAT |
GO:0005819-spindle | 5 | 8.63×10⁻⁵ | KIF4A, TPX2,
BUB1B, CENPF, BIRC5 |
|
GOTERM_MF_FAT | GO:0042803-protein
homodimerization activity | 4 |
1.59×10⁻² | CENPF, BIRC5,
TOP2A, S100A1 |
|
GOTERM_MF_FAT | GO:0008022-protein
C-terminus binding | 3 | 2.15×10⁻² | MKI67, CENPF,
TOP2A |
|
GOTERM_MF_FAT | GO:0005524-ATP
binding | 7 |
2.58×10⁻² | KIF4A, MKI67,
TPX2, BUB1B, TOP2A, ERCC6L, KIF20A |
|
GOTERM_MF_FAT | GO:0032559-adenyl
ribonucleotide binding | 7 |
2.74×10⁻² | KIF4A, MKI67,
TPX2, BUB1B, TOP2A, ERCC6L, KIF20A |
|
GOTERM_MF_FAT | GO:0030554-adenyl
nucleotide binding | 7 |
3.45×10⁻² | KIF4A, MKI67,
TPX2, BUB1B, TOP2A, ERCC6L, KIF20A |
|
GOTERM_BP_FAT | GO:0043627-response
to estrogen stimulus | 5 |
4.73×10⁻⁴ | TXNIP, ALDH1A2,
GSTM3, CAV1, GHR |
|
GOTERM_BP_FAT | GO:0048545-response
to steroid hormone stimulus | 6 |
5.17×10⁻⁴ | TXNIP, ALDH1A2,
GSTM3, CAV1, BCHE, GHR |
|
GOTERM_BP_FAT | GO:0009725-response
to hormone stimulus | 7 |
1.61×10⁻³ | TXNIP, RERG,
ALDH1A2, GSTM3, CAV1, BCHE, GHR |
| Downregulated |
|
|
|
|
|
GOTERM_BP_FAT | GO:0009719-response
to endogenous stimulus | 7 |
2.64×10⁻³ | TXNIP, RERG,
ALDH1A2, GSTM3, CAV1, BCHE, GHR |
|
GOTERM_BP_FAT | GO:0042493-response
to drug | 5 |
6.59×10⁻³ | TXNIP, CAV1,
BCHE, ALDH1A3, SEMA3C |
|
GOTERM_CC_FAT |
GO:0005576-extracellular region | 15 |
1.24×10⁻³ | SPOCK1, C4ORF31,
OGN, CHRDL1, RSPO1, CPE, BCHE, SEMA3C, PROS1, GHR |
|
GOTERM_CC_FAT |
GO:0044421-extracellular region part | 8 |
2.14×10⁻² | C4ORF31, OGN,
RSPO1, BCHE, EFEMP1, SEMA3C, SPOCK1, GHR |
|
GOTERM_MF_FAT |
GO:0030246-carbohydrate binding | 6 |
7.32×10⁻³ | C4ORF31, RSPO1,
PRG4, ITLN1, GFPT2, LGALS2 |
|
GOTERM_MF_FAT | GO:0005509-calcium
ion binding | 9 |
1.27×10⁻² | ANXA8, NELL2,
EFEMP1, DSC3, PCDH9, SPOCK1, PCDH17, PROS1, GCA |
| Table II.Pathway enrichment analysis of
upregulated and downregulated differently expressed genes. |
Table II.
Pathway enrichment analysis of
upregulated and downregulated differently expressed genes.
| Category | Term | Count | P-value | Genes |
|---|
| Upregulated | hsa04310: Wnt
signaling pathway | 3 |
1.67×10⁻² | SOX17, FZD2,
WNT7A |
| Downregulated | hsa00982: Drug
metabolism | 4 |
3.51×10⁻⁴ | GSTM3, ALDH1A3,
AOX1, ADH1C |
|
| hsa00350: Tyrosine
metabolism | 3 |
4.57×10⁻³ | ALDH1A3, AOX1,
ADH1C |
|
| hsa00980:
Metabolism of xenobiotics by cytochrome P450 | 3 |
8.36×10⁻³ | GSTM3, ALDH1A3,
ADH1C |
Downregulated DEGs, such as ALDH1A2 and
growth hormone receptor (GHR), were distinctly involved in
the estrogen stimulus response (P=4.73×10⁻⁴); these
DEGs, including SPARC/osteonectin, cwcv and kazal like domains
proteoglycan 1 (SPOCK1) and GHR, were primarily
associated with the extracellular region (P=1.241×10⁻³),
and DEGs (e.g., PCDH9 and SPOCK1) were associated
with calcium ion binding (P=1.2652×10⁻²) (Table I). ALDH1A3 and ADH1C
were markedly enriched in three pathways, including drug metabolism
(P=3.51×10⁻⁴), tyrosine metabolism
(P=4.571×10⁻³) and metabolism of xenobiotics by
cytochrome P450 (P=8.375×10⁻³) (Table II).
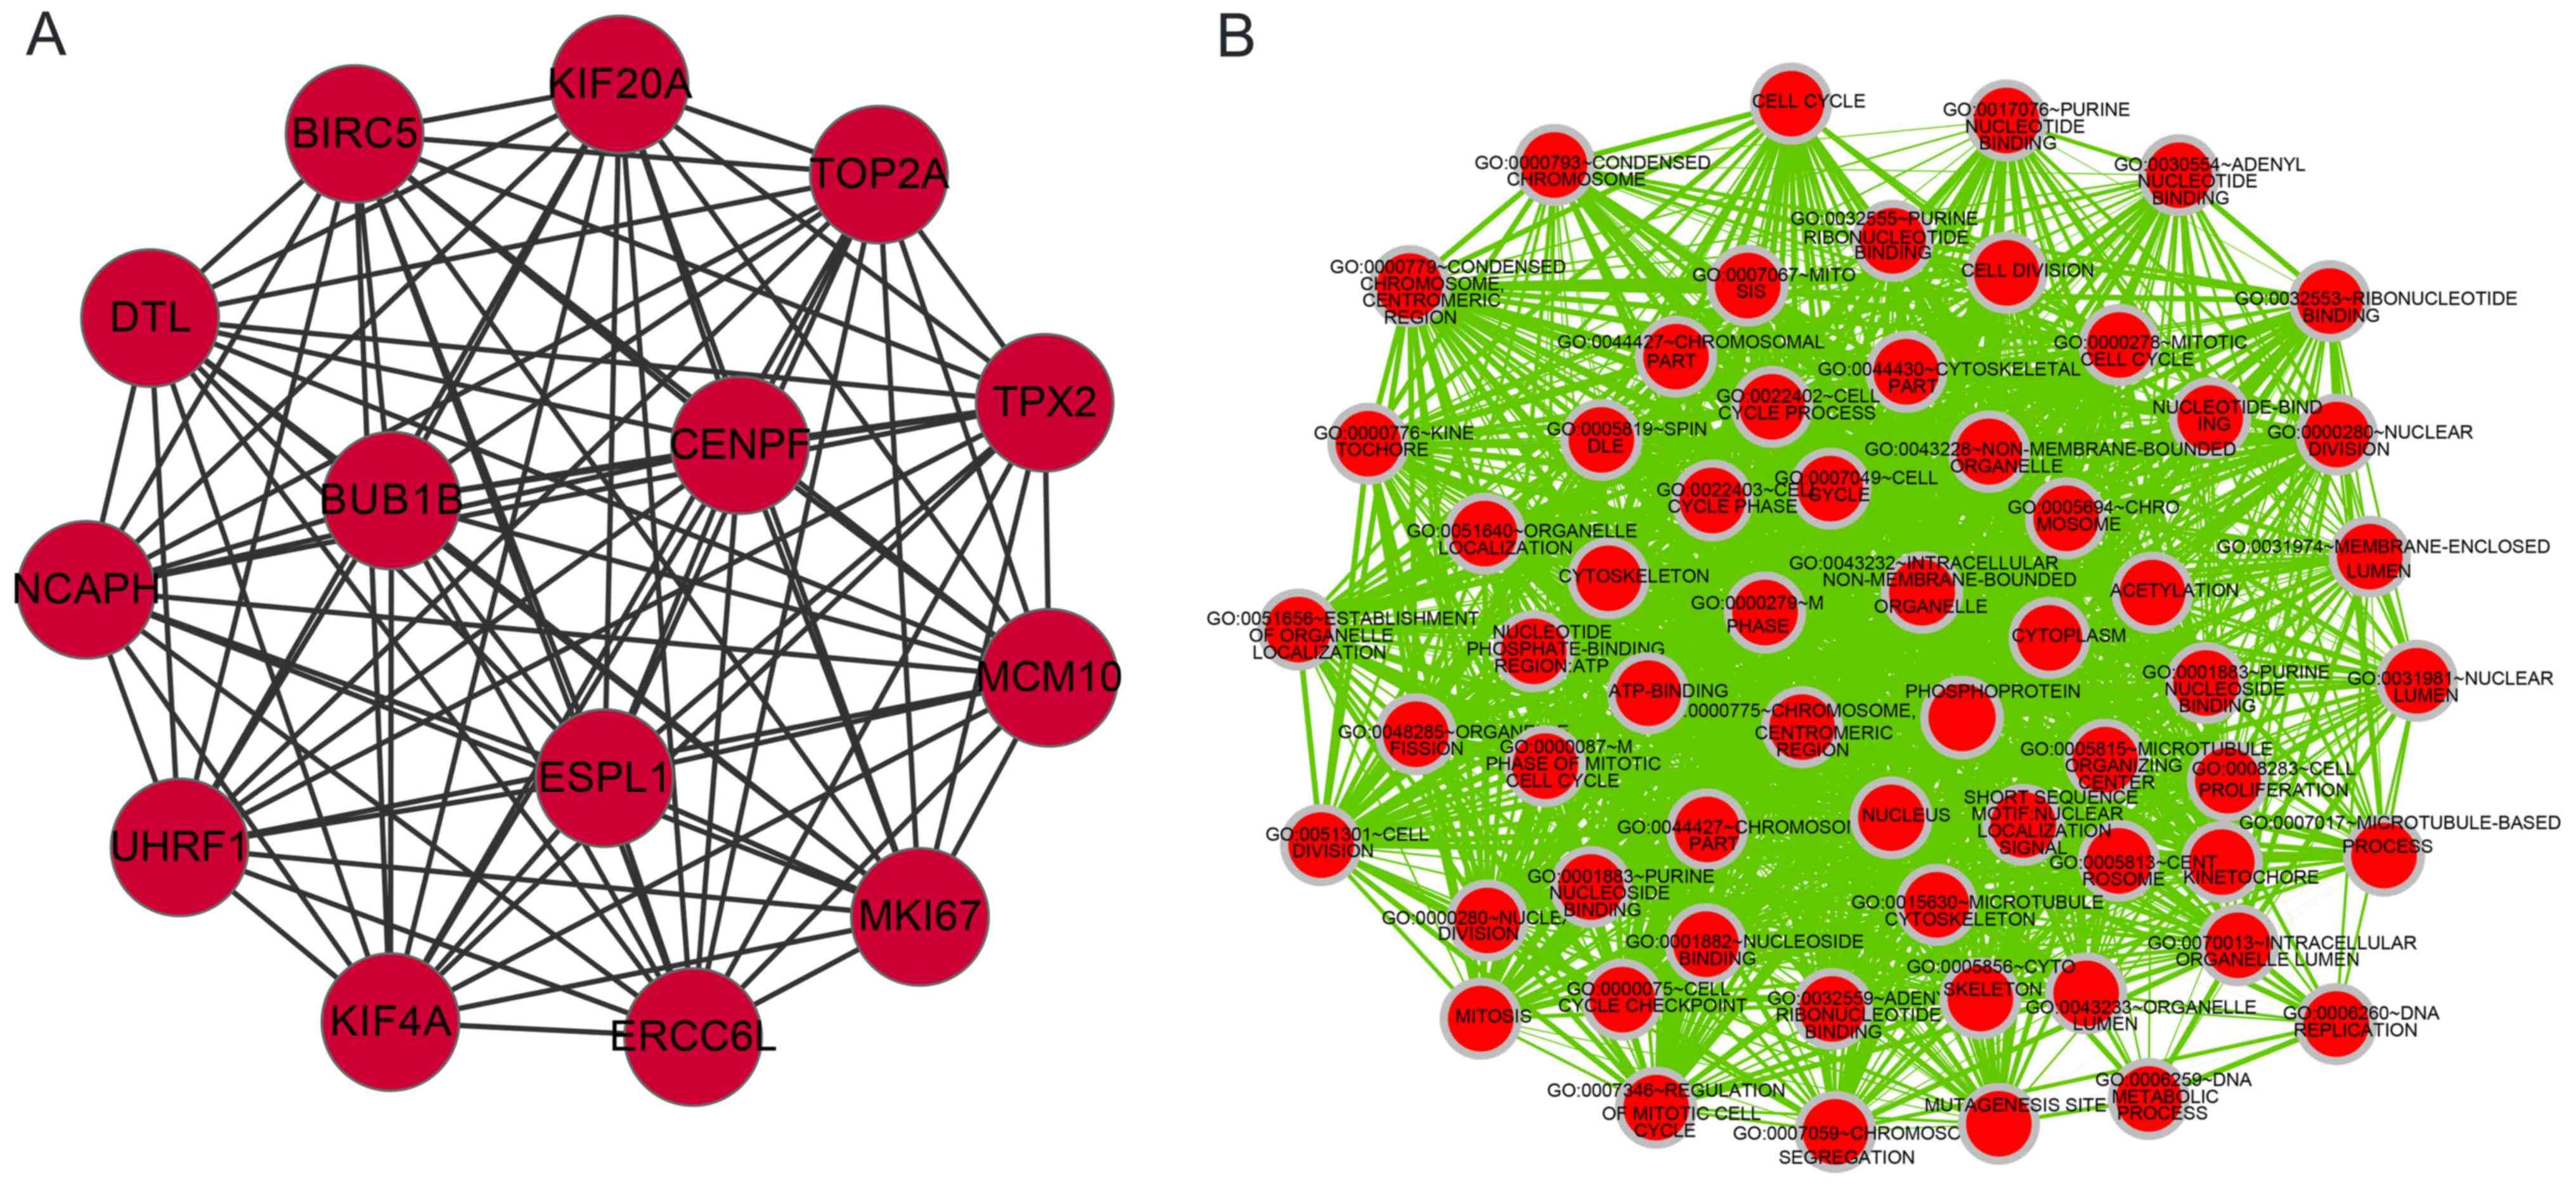
Analysis of network module in PPI
network
To investigate the interactions of DEGs further,
PPIs of upregulated and downregulated DEGs were respectively
analyzed and the PPI network modules were then screened. On the
basis of the analysis of PPI networks for upregulated and
downregulated DEGs, only one significant network module for
upregulated DEGs was screened. The DEGs UHRF1 and
CENPF interacted with each other (Fig. 1A). To investigate the functions of
genes in the network module, functional enrichment analysis for the
upregulated module was performed. The genes in the module were
primarily enriched in cell proliferation functions. A set of DEGs,
including UHRF1 and CENPF, mainly participated in the
cell cycle, mitosis and ATP binding (Fig.
1B).
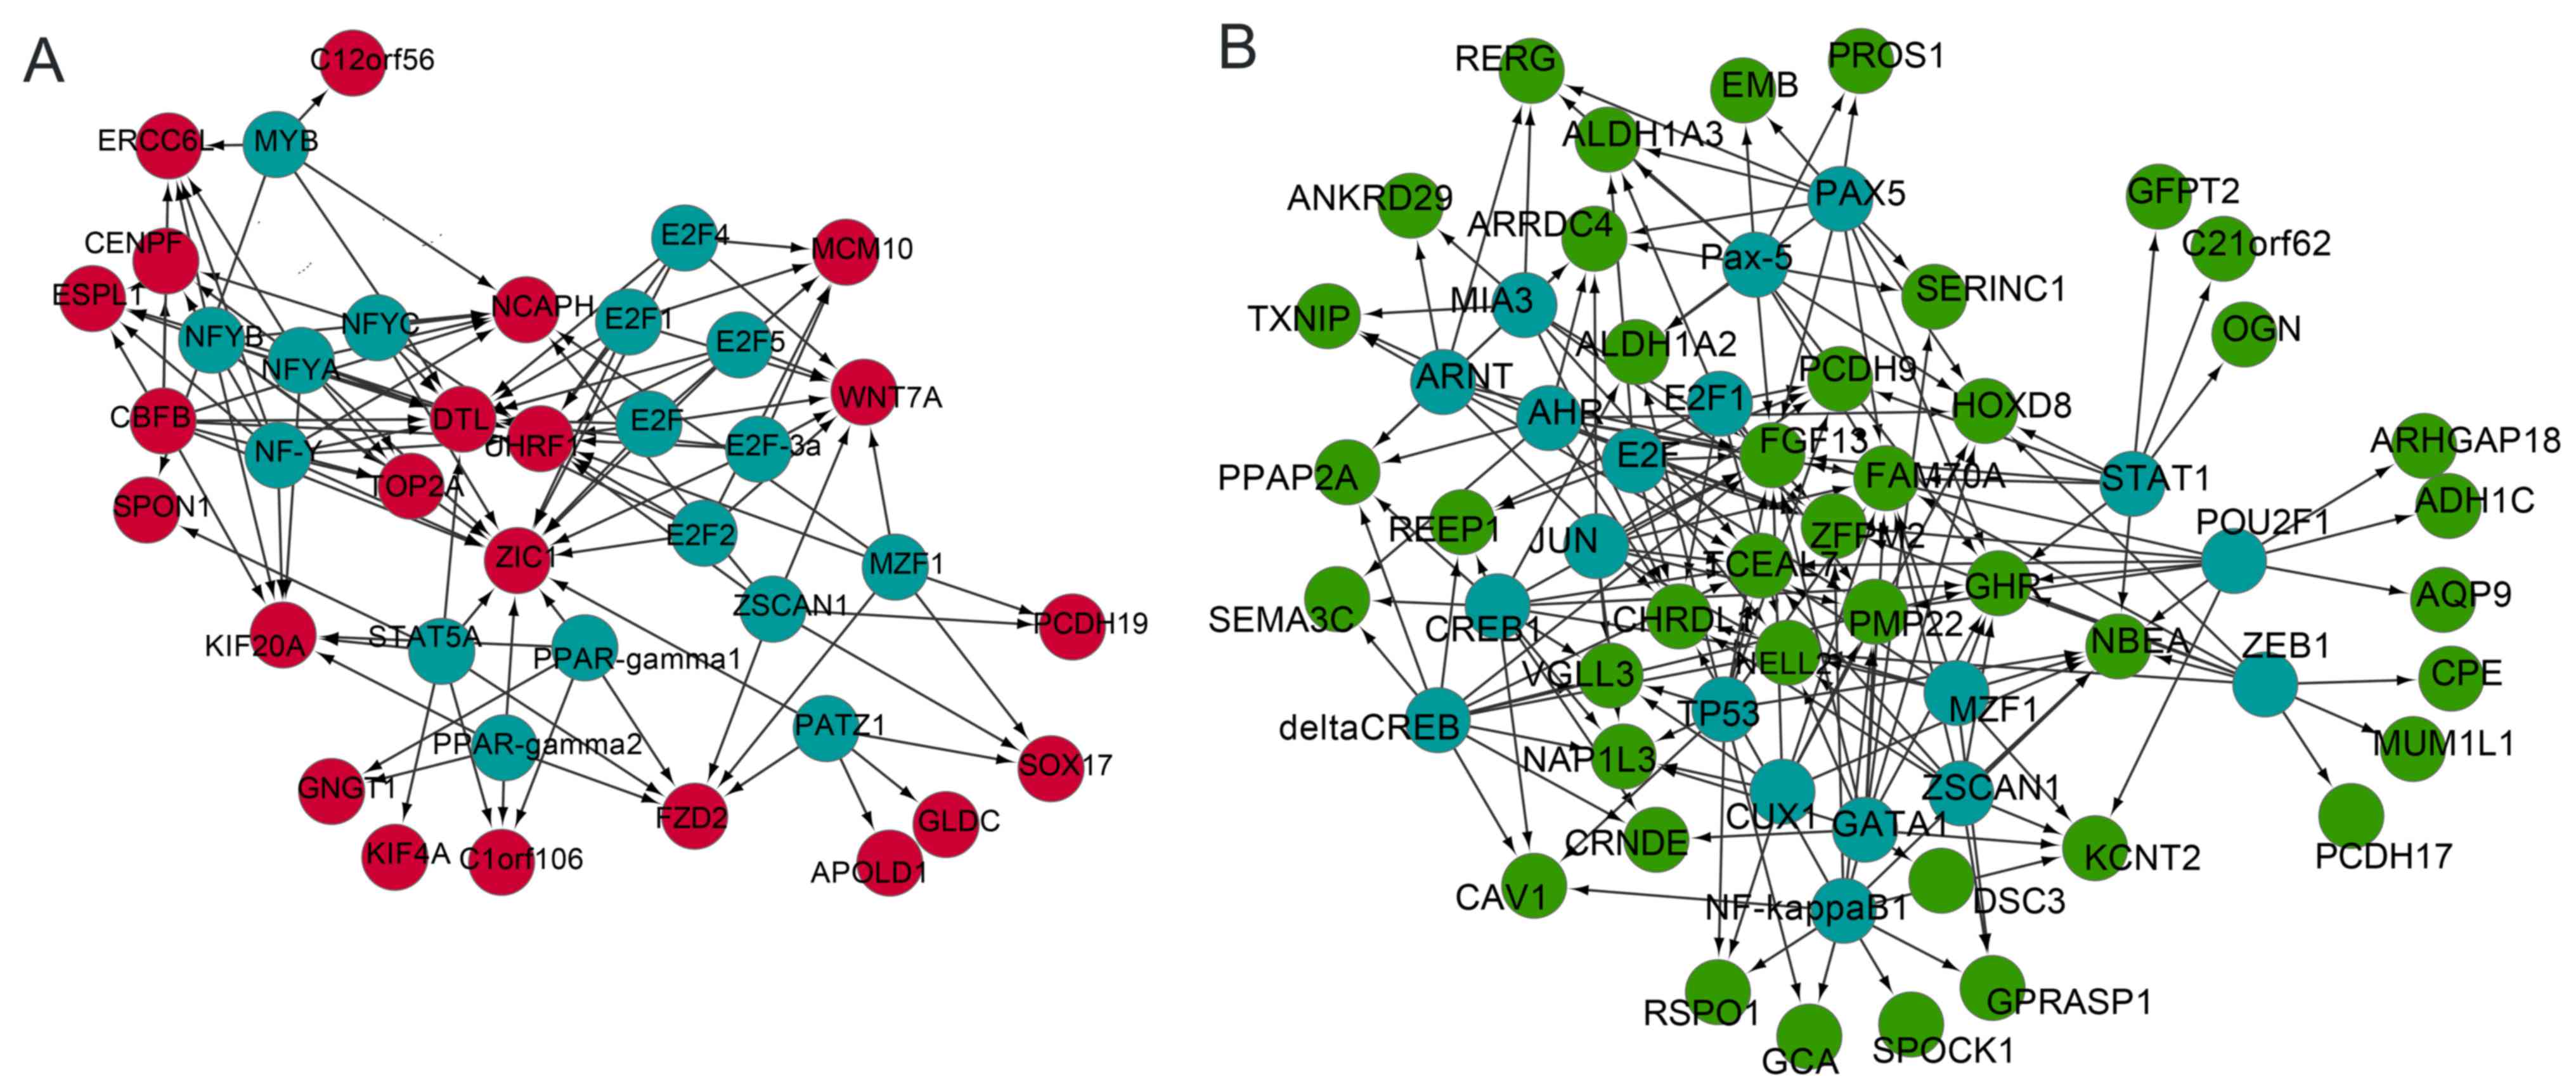
Analysis of the integrated TF-DEG
regulatory networks
To investigate regulators that modulated the DEGs in
EOC further, the TFs that regulated upregulated and downregulated
DEGs were analyzed, and TF-DEG regulatory networks were
constructed. In the upregulated regulatory network, expression of
CENPF was regulated by the TFs NFY; UHRF1 was
modulated by all E2F genes and NFY; Zic family member
1 (ZIC1) was targeted by E2F and NFY (Fig. 2A). In the downregulated regulatory
network, ALDH1A2 and PCDH9 were regulated by
TP53. PCDH9 was also regulated by E2F,
E2F1 and NFY (Fig.
2B).
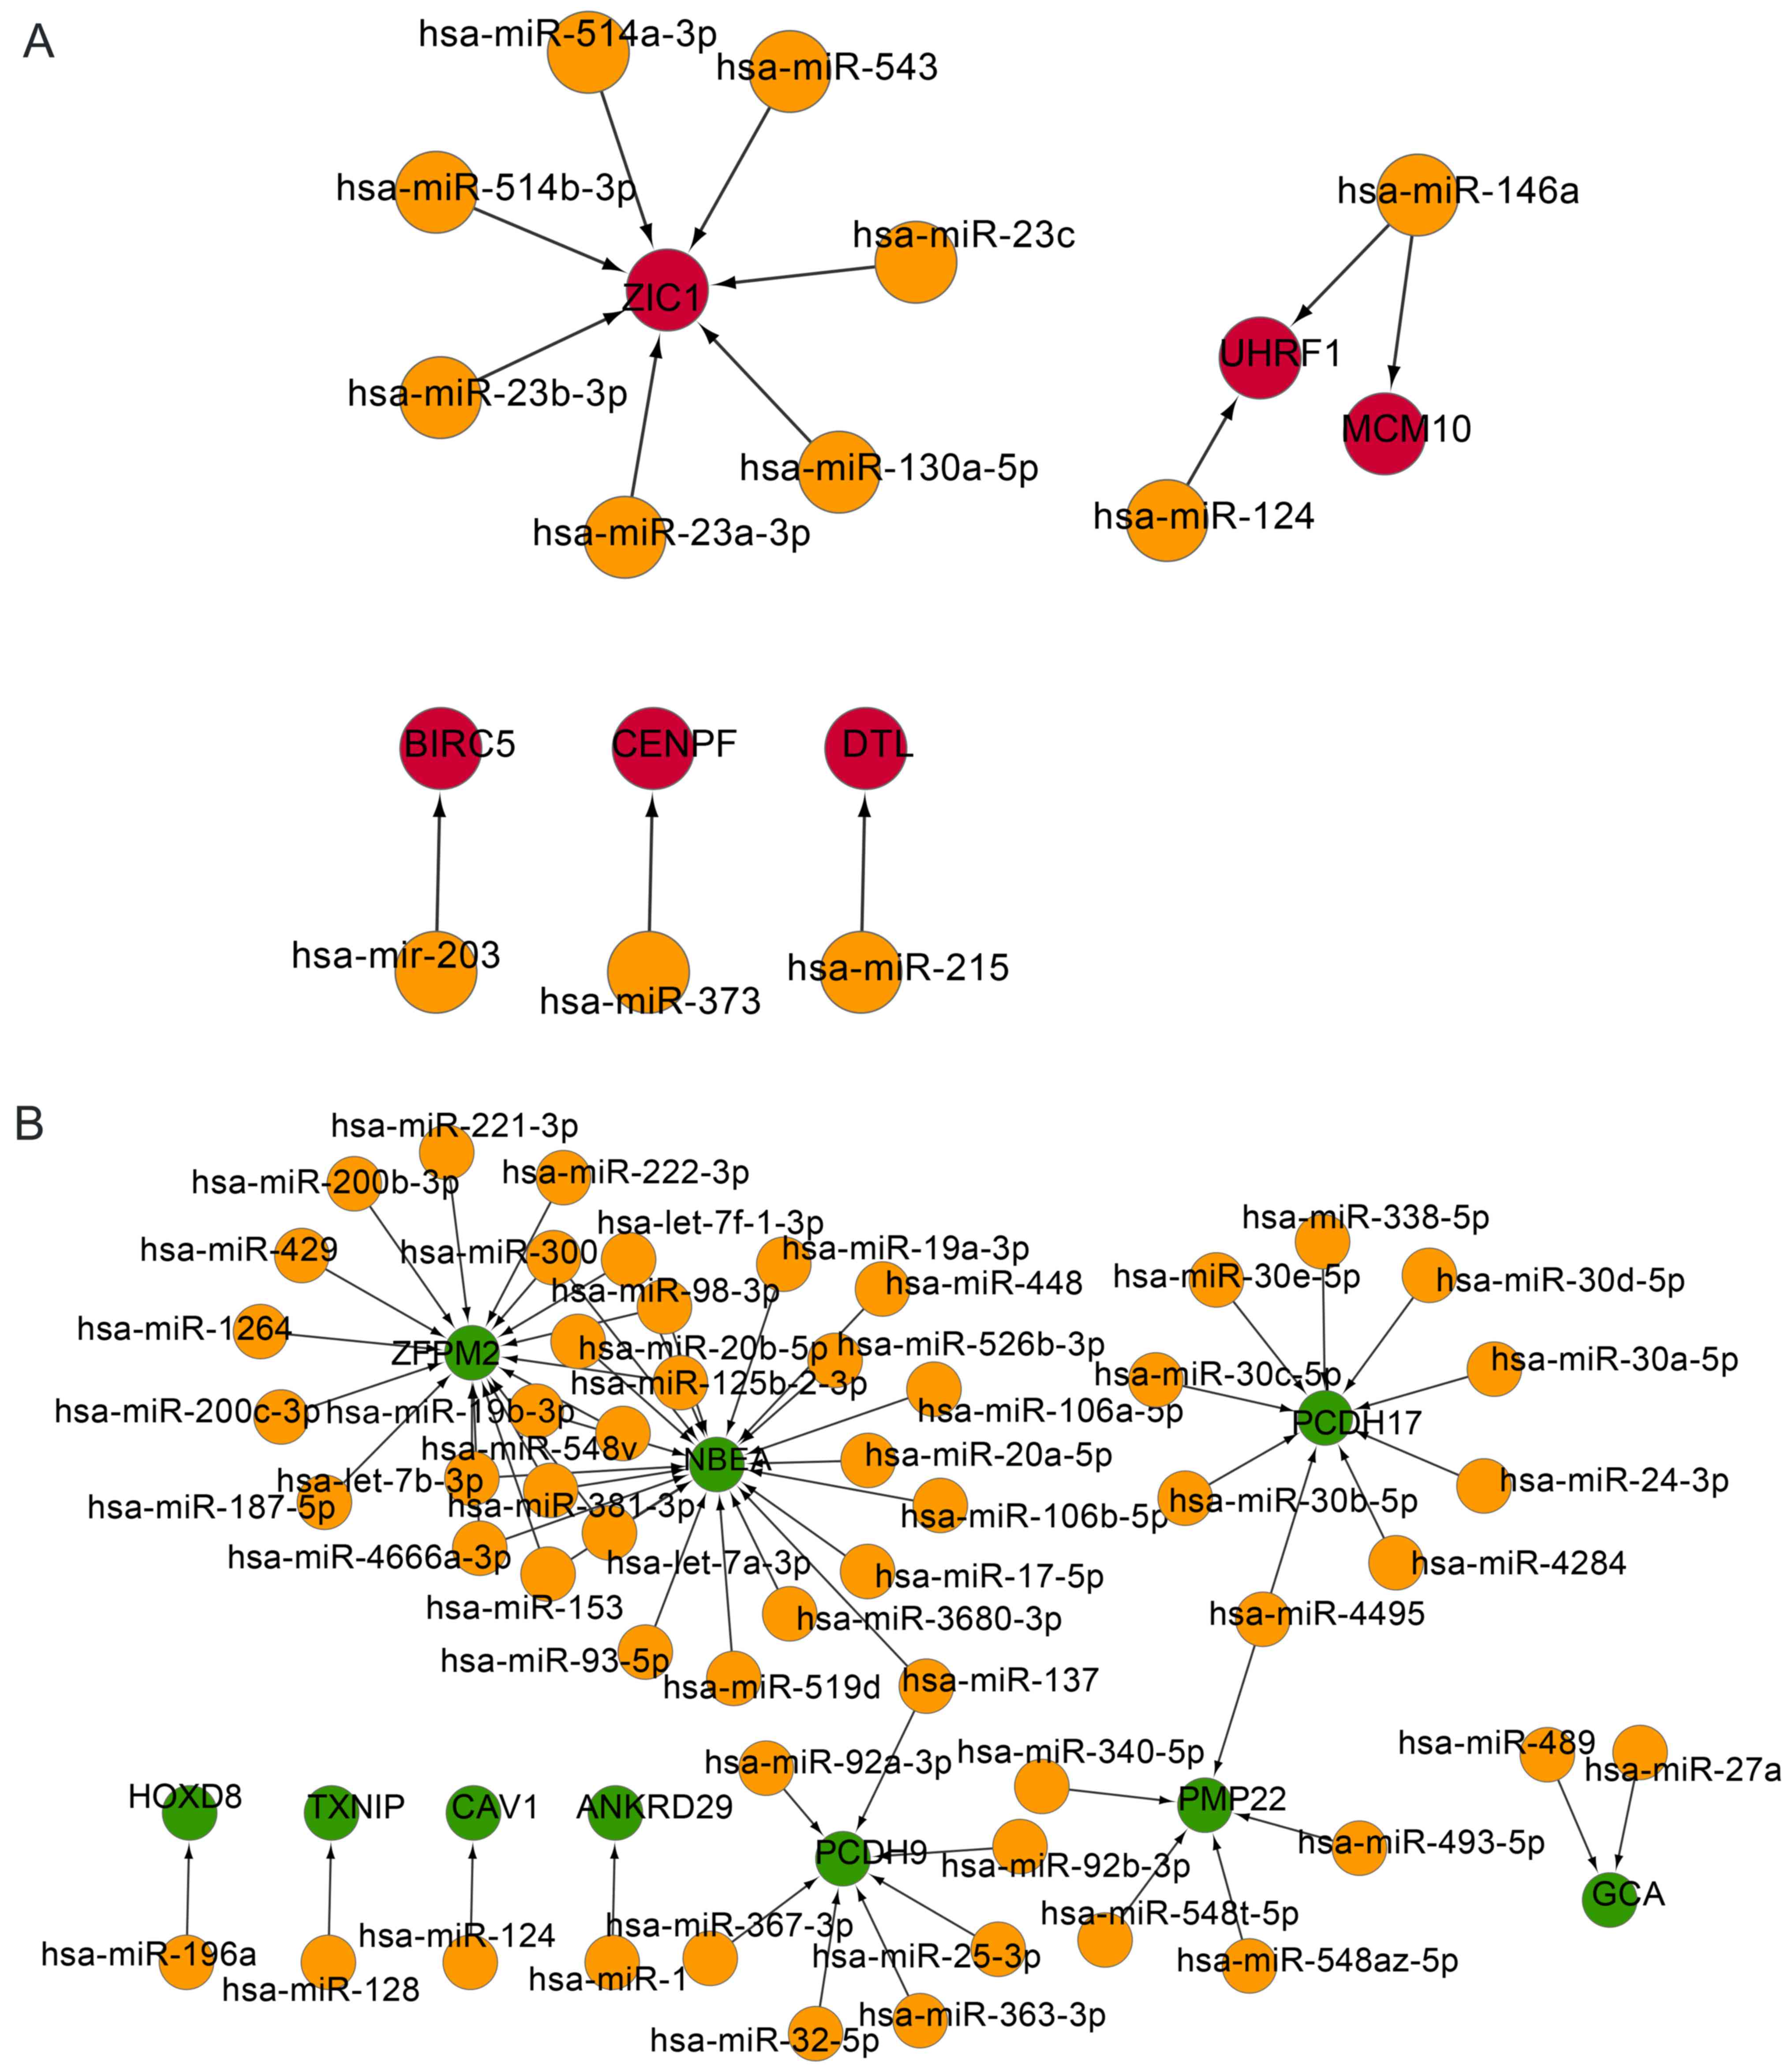
Analysis of the integrated miRNA-DEG
regulatory network
To investigate the associations between DEGs and
miRNAs further, miRNA-DEG regulatory networks were constructed. In
the upregulated regulatory network, the gene ZIC1 was
regulated by seven miRNAs, including miR-543, miR-23c, miR-23a-3p
and miR-514a-3p. Gene UHRF1 was regulated by miR-146a and
miR-124. Expression of the DEGs BIRC5, CENPF,
denticleless E3 ubiquitin protein ligase homolog and minichromosome
maintenance 10 replication initiation factor were modulated by
miR-203, miR-373, miR-215 and miR-146a, respectively (Fig. 3A).
In the downregulated regulatory network, DEGs, such
as zinc finger protein, FOG family member 2 and neurobeachin, were
primarily regulated by miRNAs, including miR-300 and miR-153;
PCDH17 was primarily modulated by miRNAs, including
miR-30a-5p, miR-30b-5p and miR-30d-5p; and PCDH9 was
regulated by multiple miRNAs, including miR-32-5p, miR-137 and
miR-92a-3p (Fig. 3B).
Discussion
EOC is the leading cause of mortality in
gynecological malignancies (1). In
the present study, using the combined analysis of two microarray
datasets, 31 genes were identified as being markedly upregulated
and 64 downregulated in EOC samples compared with healthy
controls.
According to the functional analysis of upregulated
module genes, a series of DEGs, including CENPF and
UHRF1, were primarily enriched in the cell cycle.
CENPF encodes a protein that associates with the
centromere-kinetochore complex, which is part of the nuclear matrix
during the G2 phase of interphase (28). The kinetochore is a large complex of
proteins and associated centromeric DNA that is essential in
mitosis (29). CENPF encodes
centromere protein F, which drives ovarian cancer growth through
regulation of the cell cycle (30).
It has been reported that CENPF is differentially expressed
in EOC cells upon the overexpression or knockdown of downstream of
tyrosine kinase 1 (31). Furthermore,
a recent study has reported that overexpression of CENPK, a
homolog of CENPF, is associated with poorer patient survival
(32). UHRF1 encodes a member
of a subfamily of RING-finger type E3 ubiquitin ligases, which can
promote G1/S transition by binding to specific DNA sequences and
recruiting a histone deacetylase to regulate gene expression
(33). UHRF1 is required for
tumor cell proliferation and acts as a dominant effector of cell
growth (34). A recent study showed
that expression of UHRF1 is higher in ovarian cancer tissue
than that in adjacent healthy tissues (35), which is consistent with the results of
the present study. This suggests that the genes associated with the
cell cycle, such as CENPF and UHRF1, may play key
roles in the process of EOC. Furthermore, CENPF and
UHRF1 were predicted to be regulated by the transcription
factor NF-Y. NFYA, NFYB and NFYC encode NF-Y,
a heterotrimeric protein composed of three subunits, NF-YA, NF-YB
and NF-YC (36). The NF-Y complex
supports the basal transcription of regulatory genes that are
responsible for cell-cycle progression, among which are mitotic
cyclin complexes (37). A previous
study showed that NF-Y regulates mitosis-associated genes, such as
CENPF, in multiple cancer types (38). NF-Y is a pivotal regulator of enhancer
of zeste 2 polycomb repressive complex 2 subunit expression and is
essential for EOC cell proliferation (39). In addition, CENPF was found to
be regulated by miR-373 in the present study. It has been reported
that miR-373 expression is downregulated in human EOC and that
silencing of miR-373 expression leads to the increased migration
and invasion of EOC cells (40). In
the present study, UHRF1 was modulated by miR-146a. Another
study showed that ovarian cancer patients with the C variant allele
of miR-146a may have high levels of mature miR-146a (41). Changes in miR-146a expression and/or
binding have also been implicated in the metastatic and
proliferative response associated with the development of ovarian
cancer (41). Collectively,
CENPF and UHRF1 may play pivotal roles in the cell
cycle and migration in EOC, via the regulation of expression of
NFY and miRNAs, including miR-373 and miR-146a.
With regard to the downregulated DEGs,
ALDH1A2 and PCDH9 were regulated by the TF
TP53. Genetic alterations to TP53 serve a vital role
in ovarian cancer development and progression, as they promote
ovarian cancer epithelial cell survival and proliferation (42). However, wild-type TP53 is
expressed in ovarian serous carcinomas, particularly in patients
with high-grade serous ovarian carcinomas (43), who experience significantly shorter
survival times and higher chemoresistance than those with mutated
TP53 (44). ALDH1A2
encodes a member of the aldehyde dehydrogenase 1 family, which
converts retinaldehyde to retinoic acid, a known marker of
lineage-specific stem cells (45). In
the present study, ALDH1A2 was significantly associated with
the estrogen stimulus response. Estrogen has been implicated in the
etiology and progression of serous ovarian carcinoma by inducing
the expression of genes targeted by canonical estrogen receptor α
(46), which has been revealed to
serve an important role in ovarian cancer development; its
expression is a marker of better prognosis (47). PCDH9 encodes a member of the
protocadherin family (and cadherin superfamily) of transmembrane
proteins that contain cadherin domains (48). Cadherins can modulate cell adhesion by
trans-homodimerization between their membrane-distal EC1
domains that extend from apposed cells and gather at intercellular
adherens junctions (49). Cell
adhesion plays a notable role in cancer progression and metastasis
(50). The intercellular interactions
between cancer cells and the endothelium determine the metastatic
spread of the disease (50).
PCDH9 expression has been observed in ovarian cancer cells
(51). In the present study,
PCDH9 was also found to be regulated by miR-92b-3p and
miR-137. miR-92b-3p and miR-137 have been reported to exhibit
altered expression levels in ovarian tumor cells (52,53). Taken
together, ALDH1A2 and PCDH9 may be important in the
progression of EOC through the regulation of TP53 or
miR-92b-3p and miR-137.
In conclusion, a set of 31 upregulated and 64
downregulated genes (compared with healthy controls) were
identified in EOC samples. Among them, upregulated genes that are
associated with the cell cycle, including CENPF and
UHRF1, and downregulated genes, including ALDH1A2 and
PCDH9, may be implicated in the progress of EOC via the
regulation of TFs, such as NFY and TP53, and miRNAs,
such as miR-373, miR-146a, miR-92b-3p and miR-137. The findings of
the present study may contribute to a greater understanding of the
pathogenesis of EOC; however, these results require future
experimental confirmation.
References
|
1
|
Jemal A, Siegel R, Xu J and Ward E: Cancer
statistics, 2010. CA Cancer J Clin. 60:277–300. 2010. View Article : Google Scholar : PubMed/NCBI
|
|
2
|
Marchetti C, Pisano C, Facchini G, Bruni
GS, Magazzino FP, Losito S and Pignata S: First-line treatment of
advanced ovarian cancer: Current research and perspectives. Expert
Rev Anticancer Ther. 10:47–60. 2010. View Article : Google Scholar : PubMed/NCBI
|
|
3
|
Sansone P and Bromberg J: Targeting the
interleukin-6/Jak/stat pathway in human malignancies. J Clin Oncol.
30:1005–1014. 2012. View Article : Google Scholar : PubMed/NCBI
|
|
4
|
Colomiere M, Ward AC, Riley C, Trenerry
MK, Cameron-Smith D, Findlay J, Ackland L and Ahmed N: Cross talk
of signals between EGFR and IL-6R through JAK2/STAT3 mediate
epithelial-mesenchymal transition in ovarian carcinomas. Br J
Cancer. 100:134–144. 2009. View Article : Google Scholar : PubMed/NCBI
|
|
5
|
Mayr D, Hirschmann A, Löhrs U and Diebold
J: KRAS and BRAF mutations in ovarian tumors: A comprehensive study
of invasive carcinomas, borderline tumors and extraovarian
implants. Gynecol Oncol. 103:883–887. 2006. View Article : Google Scholar : PubMed/NCBI
|
|
6
|
Hennessy B, Timms KM, Carey MS, Gutin A,
Meyer LA, Flake DD II, Abkevich V, Potter J, Pruss D, Glenn P, et
al: Somatic mutations in BRCA1 and BRCA2 could expand the number of
patients that benefit from poly (ADP ribose) polymerase inhibitors
in ovarian cancer. J Clin Oncol. 28:3570–3576. 2010. View Article : Google Scholar : PubMed/NCBI
|
|
7
|
Peng DX, Luo M, Qiu LW, He YL and Wang XF:
Prognostic implications of microRNA-100 and its functional roles in
human epithelial ovarian cancer. Oncol Rep. 27:1238–1244.
2012.PubMed/NCBI
|
|
8
|
Nakano H, Yamada Y, Miyazawa T and Yoshida
T: Gain-of-function microRNA screens identify miR-193a regulating
proliferation and apoptosis in epithelial ovarian cancer cells. Int
J Oncol. 42:1875–1882. 2013.PubMed/NCBI
|
|
9
|
Auersperg N, Wong AS, Choi KC, Kang SK and
Leung PC: Ovarian surface epithelium: Biology, endocrinology, and
pathology. Endocr Rev. 22:255–288. 2001. View Article : Google Scholar : PubMed/NCBI
|
|
10
|
Bowen NJ, Walker LD, Matyunina LV, Logani
S, Totten KA, Benigno BB and McDonald JF: Gene expression profiling
supports the hypothesis that human ovarian surface epithelia are
multipotent and capable of serving as ovarian cancer initiating
cells. BMC Med Genomics. 2:712009. View Article : Google Scholar : PubMed/NCBI
|
|
11
|
Lee YH, Kim JH, Zhou H, Kim BW and Wong
DT: Salivary transcriptomic biomarkers for detection of ovarian
cancer: For serous papillary adenocarcinoma. J Mol Med (Berl).
90:427–434. 2012. View Article : Google Scholar : PubMed/NCBI
|
|
12
|
Johnson WE, Li C and Rabinovic A:
Adjusting batch effects in microarray expression data using
empirical Bayes methods. Biostatistics. 8:118–127. 2007. View Article : Google Scholar : PubMed/NCBI
|
|
13
|
Leek JT and Storey JD: A general framework
for multiple testing dependence. Proc Natl Acad Sci USA. 105:pp.
18718–18723. 2008; View Article : Google Scholar : PubMed/NCBI
|
|
14
|
Bolstad BM, Irizarry RA, Astrand M and
Speed TP: A comparison of normalization methods for high density
oligonucleotide array data based on variance and bias.
Bioinformatics. 19:185–193. 2003. View Article : Google Scholar : PubMed/NCBI
|
|
15
|
Smyth GK: Linear models and empirical
bayes methods for assessing differential expression in microarray
experiments. Stat Appl Genet Mol Biol. 3:Article32004. View Article : Google Scholar : PubMed/NCBI
|
|
16
|
Benjamini Y and Hochberg Y: Controlling
the false discovery rate: A practical and powerful approach to
multiple testing. J Royal Statist Society Series B Methodol.
57:289–300. 1995.
|
|
17
|
Huang DW, Sherman BT, Tan Q, Collins JR,
Alvord WG, Roayaei J, Stephens R, Baseler MW, Lane HC and Lempicki
RA: The DAVID gene functional classification tool: A novel
biological module-centric algorithm to functionally analyze large
gene lists. Genome Biol. 8:R1832007. View Article : Google Scholar : PubMed/NCBI
|
|
18
|
Kanehisa M and Goto S: KEGG: Kyoto
encyclopedia of genes and genomes. Nucleic Acids Res. 28:27–30.
2000. View Article : Google Scholar : PubMed/NCBI
|
|
19
|
von Mering C, Huynen M, Jaeggi D, Schmidt
S, Bork P and Snel B: STRING: A database of predicted functional
associations between proteins. Nucleic Acids Res. 31:258–261. 2003.
View Article : Google Scholar : PubMed/NCBI
|
|
20
|
Kohl M, Wiese S and Warscheid B:
Cytoscape: Software for visualization and analysis of biological
networksData Mining in Proteomics. Springer; pp. 291–303. 2011
|
|
21
|
He X and Zhang J: Why do hubs tend to be
essential in protein networks? PLoS Genet. 2:e882006. View Article : Google Scholar : PubMed/NCBI
|
|
22
|
Bader GD and Hogue CW: An automated method
for finding molecular complexes in large protein interaction
networks. BMC Bioinformatics. 4:22003. View Article : Google Scholar : PubMed/NCBI
|
|
23
|
Merico D, Isserlin R, Stueker O, Emili A
and Bader GD: Enrichment map: A network-based method for gene-set
enrichment visualization and interpretation. PLoS One.
5:e139842010. View Article : Google Scholar : PubMed/NCBI
|
|
24
|
Karolchik D, Hinrichs AS, Furey TS, Roskin
KM, Sugnet CW, Haussler D and Kent WJ: The UCSC table browser data
retrieval tool. Nucleic Acids Res. 32:D493–D496. 2004. View Article : Google Scholar : PubMed/NCBI
|
|
25
|
Papadopoulos GL, Reczko M, Simossis VA,
Sethupathy P and Hatzigeorgiou AG: The database of experimentally
supported targets: A functional update of TarBase. Nucleic Acids
Res. 37:D155–D158. 2009. View Article : Google Scholar : PubMed/NCBI
|
|
26
|
Garcia DM, Baek D, Shin C, Bell GW,
Grimson A and Bartel DP: Weak seed-pairing stability and high
target-site abundance decrease the proficiency of lsy-6 and other
microRNAs. Nat Struct Mol Biol. 18:1139–1146. 2011. View Article : Google Scholar : PubMed/NCBI
|
|
27
|
Xiao F, Zuo Z, Cai G, Kang S, Gao X and Li
T: miRecords: An integrated resource for microRNA-target
interactions. Nucleic Acids Res. 37:D105–D110. 2009. View Article : Google Scholar : PubMed/NCBI
|
|
28
|
Sayer JA, Otto EA, O'Toole JF, Nurnberg G,
Kennedy MA, Becker C, Hennies HC, Helou J, Attanasio M, Fausett BV,
et al: The centrosomal protein nephrocystin-6 is mutated in Joubert
syndrome and activates transcription factor ATF4. Nat Genet.
38:674–681. 2006. View
Article : Google Scholar : PubMed/NCBI
|
|
29
|
Yuen KW, Montpetit B and Hieter P: The
kinetochore and cancer: What's the connection? Curr Opin Cell Biol.
17:576–582. 2005. View Article : Google Scholar : PubMed/NCBI
|
|
30
|
Ghosh-Choudhury T, Loomans HA, Wan YW, Liu
Z, Hawkins SM and Anderson ML: Abstract 3113: Hyperactivation of
FOXM1 drives ovarian cancer growth and metastasis independent of
the G2-M cell cycle checkpoint. Cancer Res. 73 Suppl:S31132013.
View Article : Google Scholar
|
|
31
|
Mercier PL, Bachvarova M, Plante M,
Gregoire J, Renaud MC, Ghani K, Têtu B, Bairati I and Bachvarov D:
Characterization of DOK1, a candidate tumor suppressor gene, in
epithelial ovarian cancer. Mol Oncol. 5:438–453. 2011. View Article : Google Scholar : PubMed/NCBI
|
|
32
|
Lee YC, Huang CC, Lin DY, Chang WC and Lee
KH: Overexpression of centromere protein K (CENPK) in ovarian
cancer is correlated with poor patient survival and associated with
predictive and prognostic relevance. PeerJ. 3:e13862015. View Article : Google Scholar : PubMed/NCBI
|
|
33
|
Unoki M, Brunet J and Mousli M: Drug
discovery targeting epigenetic codes: The great potential of UHRF1,
which links DNA methylation and histone modifications, as a drug
target in cancers and toxoplasmosis. Biochem Pharmacol.
78:1279–1288. 2009. View Article : Google Scholar : PubMed/NCBI
|
|
34
|
Jenkins Y, Markovtsov V, Lang W, Sharma P,
Pearsall D, Warner J, Franci C, Huang B, Huang J, Yam GC, et al:
Critical role of the ubiquitin ligase activity of UHRF1, a nuclear
RING finger protein, in tumor cell growth. Mol Biol Cell.
16:5621–5629. 2005. View Article : Google Scholar : PubMed/NCBI
|
|
35
|
Yan F, Wang X, Shao L, Ge M and Hu X:
Analysis of UHRF1 expression in human ovarian cancer tissues and
its regulation in cancer cell growth. Tumor Biol. 36:8887–8893.
2015. View Article : Google Scholar
|
|
36
|
Mantovani R: The molecular biology of the
CCAAT-binding factor NF-Y. Gene. 239:15–27. 1999. View Article : Google Scholar : PubMed/NCBI
|
|
37
|
Gurtner A, Fuschi P, Magi F, Colussi C,
Gaetano C, Dobbelstein M, Sacchi A and Piaggio G: NF-Y dependent
epigenetic modifications discriminate between proliferating and
postmitotic tissue. PLoS One. 3:e20472008. View Article : Google Scholar : PubMed/NCBI
|
|
38
|
Yamanaka K, Mizuarai S, Eguchi T, Itadani
H, Hirai H and Kotani H: Expression levels of NF-Y target genes
changed by CDKN1B correlate with clinical prognosis in multiple
cancers. Genomics. 94:219–227. 2009. View Article : Google Scholar : PubMed/NCBI
|
|
39
|
Garipov A, Li H, Bitler BG, Thapa RJ,
Balachandran S and Zhang R: NF-YA underlies EZH2 upregulation and
is essential for proliferation of human epithelial ovarian cancer
cells. Mol Cancer Res. 11:360–369. 2013. View Article : Google Scholar : PubMed/NCBI
|
|
40
|
Zhang Y, Zhao FJ, Chen LL, Wang LQ, Nephew
KP, Wu YL and Zhang S: MiR-373 targeting of the Rab22a oncogene
suppresses tumor invasion and metastasis in ovarian cancer.
Oncotarget. 5:12291–12303. 2014. View Article : Google Scholar : PubMed/NCBI
|
|
41
|
Shen J, Ambrosone CB, DiCioccio RA, Odunsi
K, Lele SB and Zhao H: A functional polymorphism in the miR-146a
gene and age of familial breast/ovarian cancer diagnosis.
Carcinogenesis. 29:1963–1966. 2008. View Article : Google Scholar : PubMed/NCBI
|
|
42
|
Mullany LK, Liu Z, King ER, Wong KK and
Richards JS: Wild-type tumor repressor protein 53 (Trp53) promotes
ovarian cancer cell survival. Endocrinology. 153:1638–1648. 2012.
View Article : Google Scholar : PubMed/NCBI
|
|
43
|
Wong KK, Lu KH, Malpica A, Bodurka DC,
Shvartsman HS, Schmandt RE, Thornton AD, Deavers MT, Silva EG and
Gershenson DM: Significantly greater expression of ER PR, and ECAD
in advanced-stage low-grade ovarian serous carcinoma as revealed by
immunohistochemical analysis. Int J Gynecol Pathol. 26:404–409.
2007. View Article : Google Scholar : PubMed/NCBI
|
|
44
|
Wong KK, Izaguirre DI, Kwan SY, King ER,
Deavers MT, Sood AK, Mok SC and Gershenson DM: Poor survival with
wild-type TP53 ovarian cancer? Gynecol Oncol. 130:565–569. 2013.
View Article : Google Scholar : PubMed/NCBI
|
|
45
|
Storms RW, Trujillo AP, Springer JB, Shah
L, Colvin OM, Ludeman SM and Smith C: Isolation of primitive human
hematopoietic progenitors on the basis of aldehyde dehydrogenase
activity. Proc Natl Acad Sci USA. 96:pp. 9118–9123. 1999;
View Article : Google Scholar : PubMed/NCBI
|
|
46
|
Sun P, Sehouli J, Denkert C, Mustea A,
Könsgen D, Koch I, Wei L and Lichtenegger W: Expression of estrogen
receptor-related receptors, a subfamily of orphan nuclear
receptors, as new tumor biomarkers in ovarian cancer cells. J Mol
Med (Berl). 83:457–467. 2005. View Article : Google Scholar : PubMed/NCBI
|
|
47
|
Halon A, Materna V, Drag-Zalesinska M,
Nowak-Markwitz E, Gansukh T, Donizy P, Spaczynski M, Zabel M,
Dietel M, Lage H and Surowiak P: Estrogen receptor alpha expression
in ovarian cancer predicts longer overall survival. Pathol Oncol
Res. 17:511–518. 2011. View Article : Google Scholar : PubMed/NCBI
|
|
48
|
Liu Q, Chen Y, Pan JJ and Murakami T:
Expression of protocadherin-9 and protocadherin-17 in the nervous
system of the embryonic zebrafish. Gene Expr Patterns. 9:490–496.
2009. View Article : Google Scholar : PubMed/NCBI
|
|
49
|
Brasch J, Harrison OJ, Honig B and Shapiro
L: Thinking outside the cell: How cadherins drive adhesion. Trends
Cell Biol. 22:299–310. 2012. View Article : Google Scholar : PubMed/NCBI
|
|
50
|
Bendas G and Borsig L: Cancer cell
adhesion and metastasis: Selectins, integrins, and the inhibitory
potential of heparins. Int J Cell Biol. 2012:6767312012. View Article : Google Scholar : PubMed/NCBI
|
|
51
|
Asad M, Wong MK, Tan TZ, Choolani M, Low
J, Mori S, Virshup D, Thiery JP and Huang RY: FZD7 drives in vitro
aggressiveness in Stem-A subtype of ovarian cancer via regulation
of non-canonical Wnt/PCP pathway. Cell Death Dis. 5:e13462014.
View Article : Google Scholar : PubMed/NCBI
|
|
52
|
Taylor DD and Gercel-Taylor C: MicroRNA
signatures of tumor-derived exosomes as diagnostic biomarkers of
ovarian cancer. Gynecol Oncol. 110:13–21. 2008. View Article : Google Scholar : PubMed/NCBI
|
|
53
|
Li Y, Yao L, Liu F, Hong J, Chen L, Zhang
B and Zhang W: Characterization of microRNA expression in serous
ovarian carcinoma. Int J Mol Med. 34:491–498. 2014.PubMed/NCBI
|