Introduction
Ovarian cancer (OC) is one of the most common types
of malignant carcinoma and is associated with a high mortality rate
(1). Due to of the lack of an
effective early-stage biomarker for cancer screening and detection,
>70% of ovarian cancer cases are diagnosed at an advanced stage
with tumor metastasis to other organs; the 5-year survival rate for
patients with metastatic OC is <30% (2). Although multiple biomarkers have been
developed to categorize the molecular fingerprint of OC by
identifying recurring genetic defects, using the existing
biomarkers to achieve an accurate diagnosis of ovarian cancer stage
and assign a specific, optimized treatment regimen to each patient
remains an unsolved challenge (3).
Up to 74.7% of the human genome does not code for
proteins and instead gives rise to non-protein-coding RNAs (ncRNAs)
(4). Long non-coding RNAs (lncRNAs)
are ncRNAs longer than 200 nucleotides; they are RNA polymerase II
transcripts that lack an open reading frame (5). LncRNAs are the largest class of ncRNAs;
~15,931 lncRNA genes have been annotated in humans (6). Unlike the smaller non-coding microRNAs,
functions for the majority of lncRNAs have yet to be elucidated.
However, with improvements in transcriptome profile technology and
research, there is increasing evidence demonstrating that certain
lncRNAs serve important functions in cancer development (7). These lncRNAs may regulate gene
expression at the transcriptional, post-transcriptional and
epigenetic levels by interacting with DNA, RNA or protein
molecules, or by causing transcriptional interference (8). They serve functions in oncogenic and
tumor-suppressive pathways (9).
In the present study, the lncRNA expression
signatures in OC were profiled via the analysis of a cohort of
previously published OC gene expression profiles from the Gene
Expression Omnibus (GEO). The results may provide novel information
on lncRNA expression profiles.
Materials and methods
GEO OC gene expression data
OC expression data used in the present study were
obtained from the NCBI GEO database (http://www.ncbi.nlm.nih.gov/gds). Datasets used in
this study were selected using the following criteria: i) They were
datasets from patients with OC; ii) they used OC tumor tissue and
superficial scrapings from normal ovary tissue samples for
comparison; iii) they used the same platform (Human Genome U133
Plus 2.0 microarray, Affymetrix, Inc., Santa Clara, CA, USA); and
iv) they contained >3 samples. Based on these criteria, two
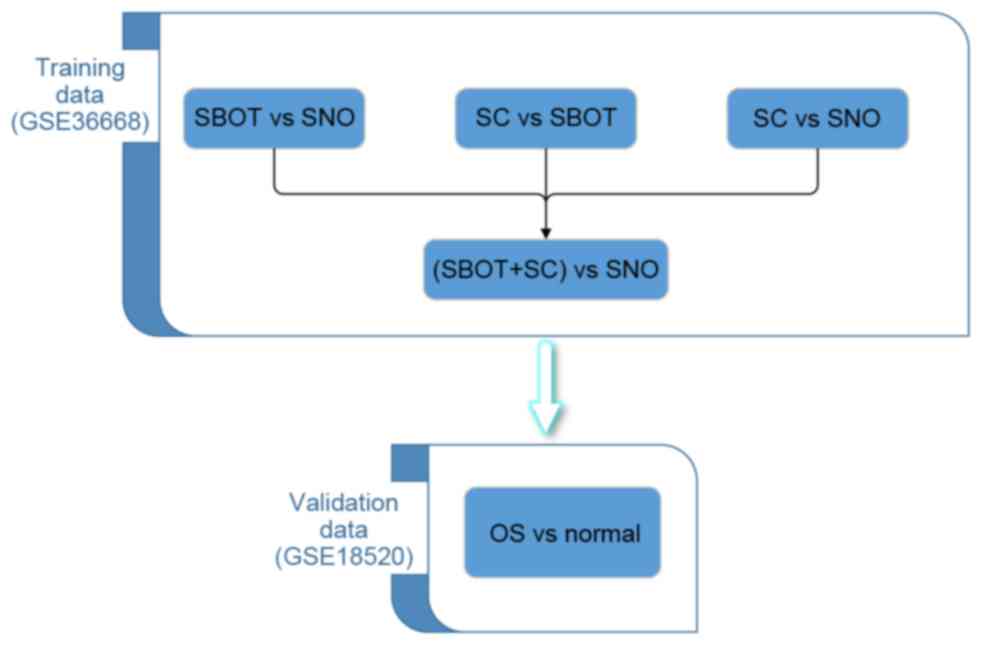
datasets were selected: GSE36668 (10) and GSE18520 (11), as described in Table I. In the present study, the
training-validation approach was adapted for screening potential
biomarkers, a standard strategy for microarray-based classification
analysis (12). GSE36668 was used as
the training set and contained four ovarian borderline carcinoma
(SBOC) samples, four serous ovarian carcinoma (SC) samples and four
superficial scraping from normal ovary (SNO) samples. GSE18520
contained 53 advanced-stage, high-grade primary ovarian carcinoma
specimens (OCS) and 10 normal ovarian surface epithelium brushings
(Normal). Dataset GSE18520 served as a validation set for the data
derived from GSE36668. The whole study design is presented in
Fig. 1.
 | Table I.Details of the two microarray datasets
used in the present study. |
Table I.
Details of the two microarray datasets
used in the present study.
| Dataset | Control samples | Tumor samples | Author, year | Platform | (Refs.) |
|---|
| GSE36668 | 4 | 8 | Elgaaen et al,
2012 | GPL570 | (10) |
| GSE18520 | 10 | 53 | Mok et al,
2009 | GPL570 | (11) |
Individual data processing
The raw CEL files of the datasets were normalized
and background adjusted using the robust multichip average method,
as this was previously demonstrated to be an effective method for
normalizing lncRNA profiling data (13). The normalized data were then analyzed
with linear model for microarray data (LIMMA), a modified t-test
incorporating the Benjamini-Hochberg multiple hypotheses correction
technique (14). These steps were
performed with R version 3.1.4 (15).
In the analysis of the training dataset GSE36668, SBOC data and SC
data were combined and compared with SNO data (Fig. 1). When analyzing data from the
GSE18520 validation set, OCS sample data were compared with normal
sample data. Adjusted P<0.01 combined with a ≥2-fold expression
level difference was defined as a significant difference between
probe sets.
Probe set re-annotation and the lncRNA
classification pipeline
As novel lncRNAs and their functions are identified
and studied every year, the annotation file downloaded from the
Affymetrix website is not completely accurate and may be obsolete
for screening target lncRNAs. Probe sets without annotation or
annotated as coding RNAs are likely to be newly identified lncRNAs,
and may potentially be crucial in various biological processes
(16). In order to avoid annotation
error and lower the false positive rate, an lncRNA classification
pipeline was developed to identify the lncRNAs represented on the
Affymetrix array. Initially, the sequences of all probe sets were
downloaded from the official Affymetrix website (http://www.affymetrix.com/Auth/analysis/downloads/data/HG-U133_Plus_2.probe_fasta.zip).
NCBI BLAST-2.2.30+ (17) was used to
perform an alignment search of all the probe sequences obtained
from the Affymetrix probe sequence file against the RefSeq
database. Then probe sets were filtered and re-annotated using the
BLAST output, with the following criteria: i) The probe should
perfectly hit a target gene (E-value, <2×10⁻⁶; query
coverage, 100%; identity, 100%); ii) any probe that perfectly hit
multiple targets was eliminated; and iii) the accession number of
the target gene should start with ‘NR_’, as NR indicates non-coding
RNA in the RefSeq database. This was then matched to the lncRNAs
probe set datasets. The probe set re-annotation and lncRNA
classification pipeline were performed using in-house Perl scripts
in Perl 5.18 (https://www.perl.org/).
Data analysis
To visually inspect the result of a ‘leave one
dataset out’ cross-validation, the differentially expressed lncRNAs
of GSE36668 and GSE18520 were used for a hierarchical clustering
analysis (HCA) in Cluster and TreeView (https://sourceforge.net/projects/jtreeview/files/)
(18) and ‘gplots’ packages in R.
Principal component analysis (PCA) was also performed using TM4
(19) and R 3.1.4 using the princomp
function; the ‘plot3d’ package in R was used to draw a
three-dimensional plot. The HCA grouped samples by their
similarities in gene expression profiles, whereas the PCA
summarized the most important variables in a dataset as principal
components, and classified the samples using as few variables as
possible (8). In HCA cluster
analysis, the euclidean distance method was used to cluster arrays
(http://CRAN.R-project.org/package=gplots).
Results
The present study included five cohorts of gene
expression data from two datasets, GSE36668 and GSE18520, as
described in Table I. Through a
training-validation approach, differentially expressed probe sets
from each dataset were obtained; the total number of these is
included in Table II. Subsequent to
re-annotating the probe sets and classifying lncRNAs,
differentially expressed lncRNAs were identified from the two
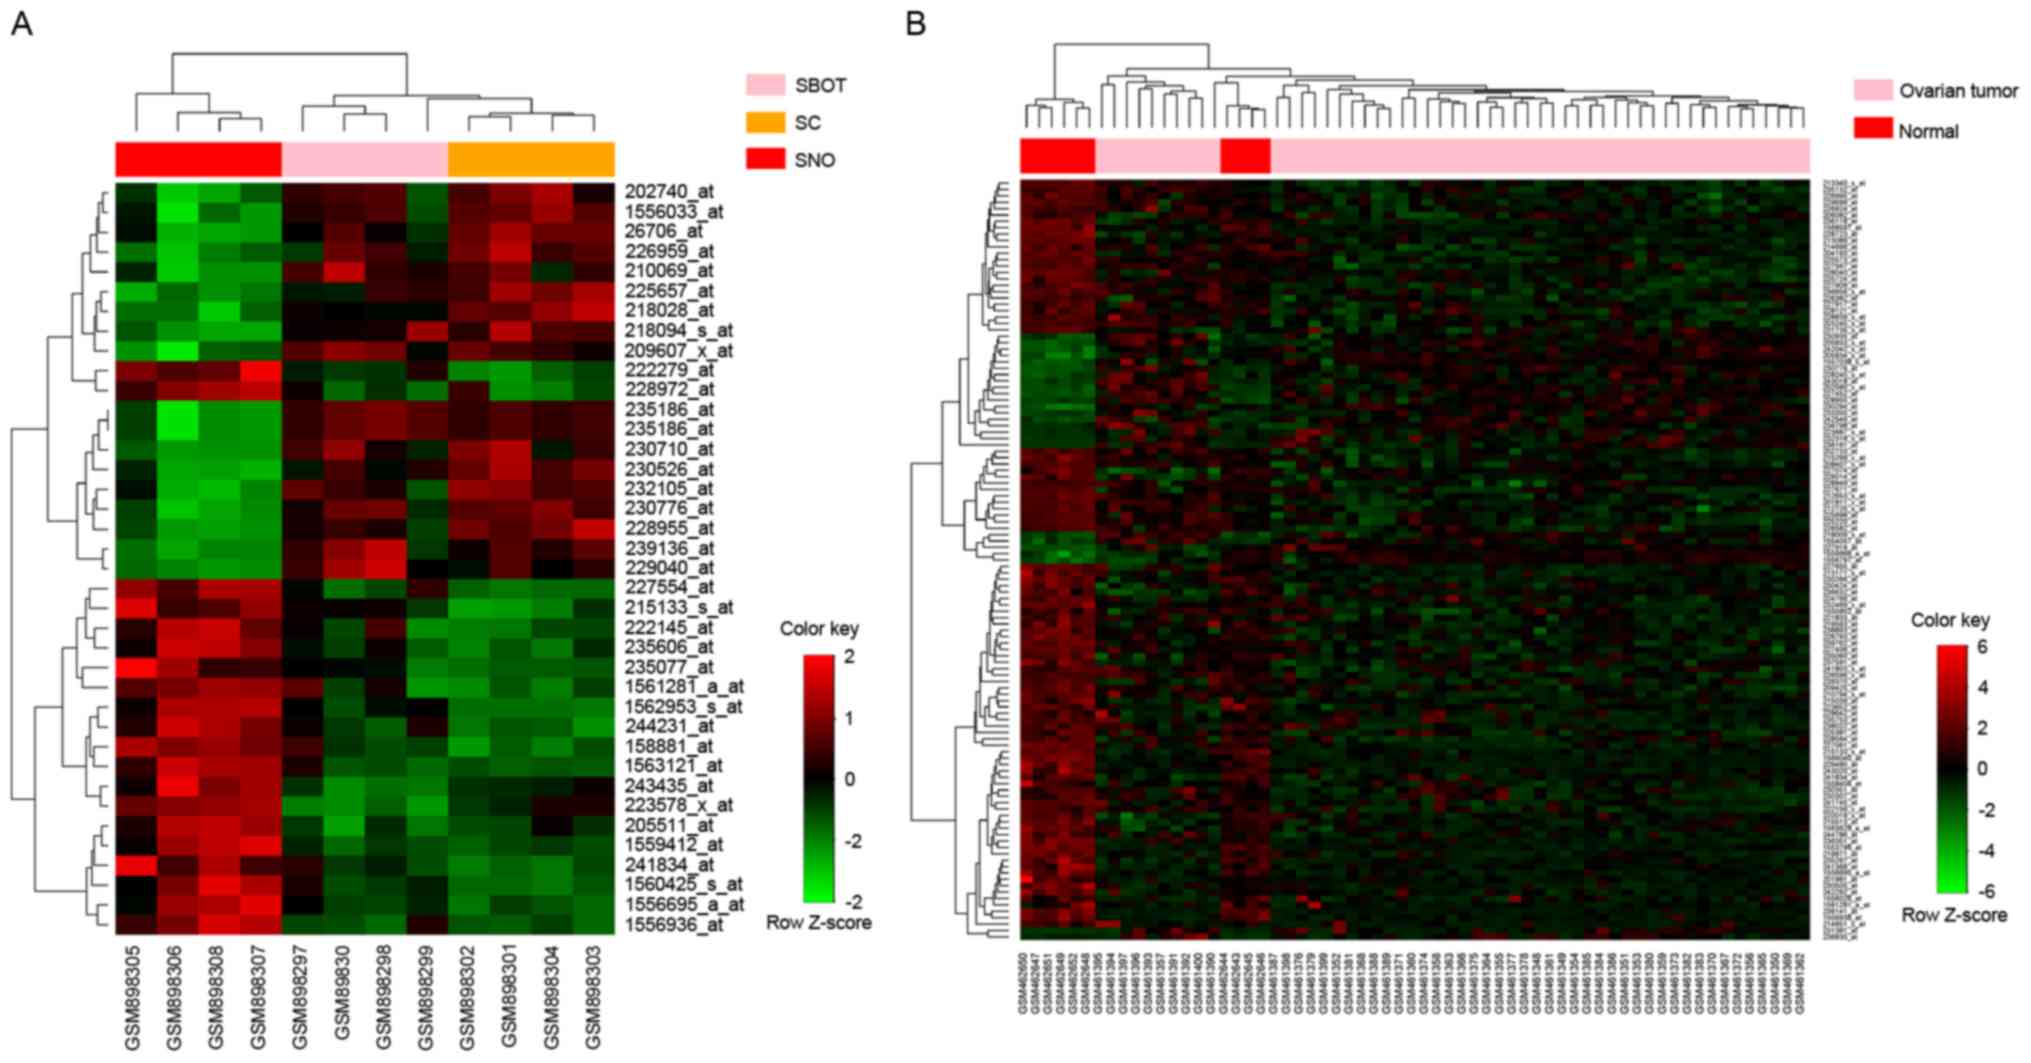
datasets, the totals of which are presented in Table III. HCA analysis of all samples in
the datasets revealed clear distinctions between OC tumor tissue
and normal tissue samples based on the expression of the identified
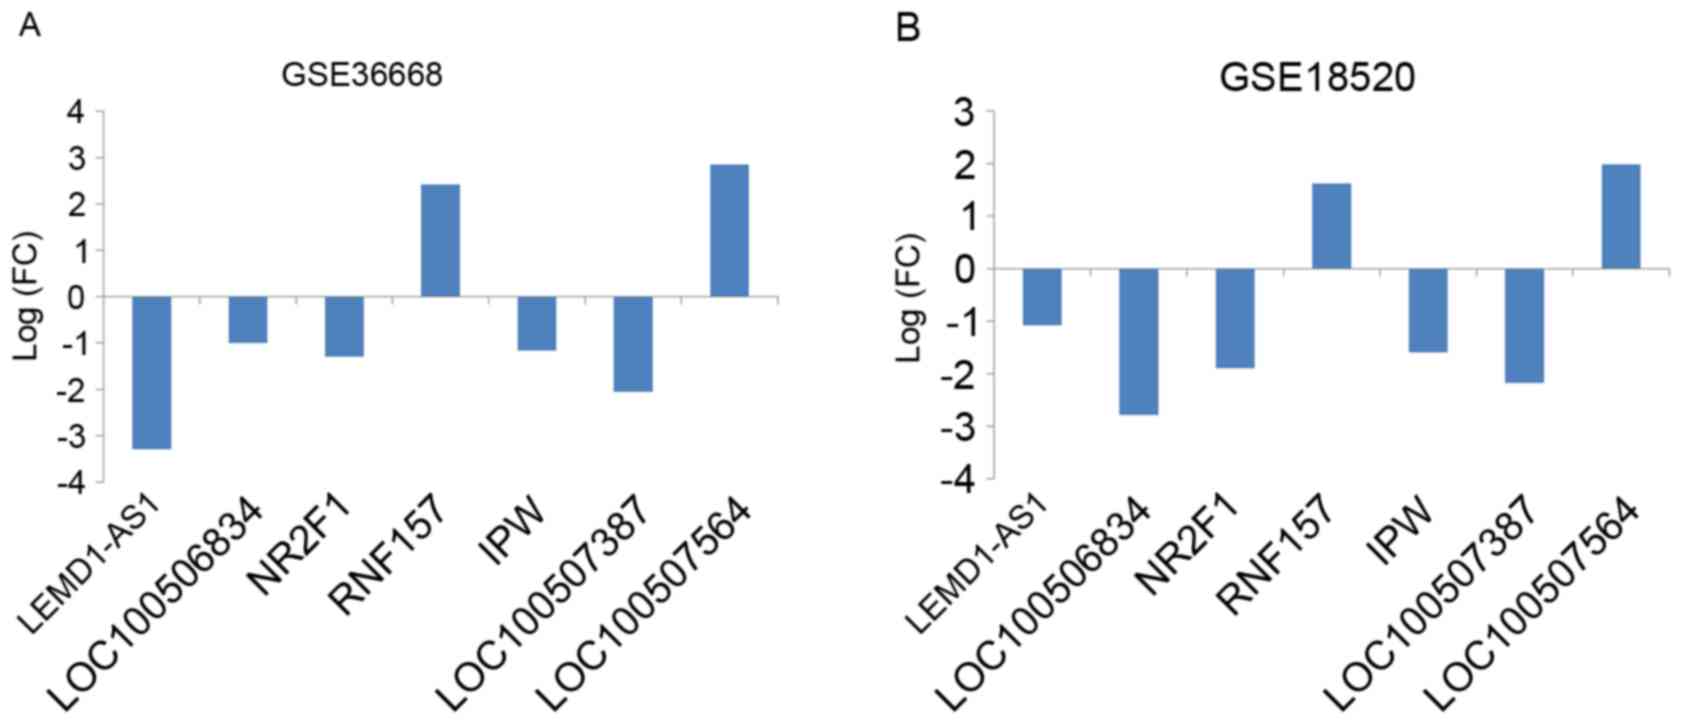
lncRNAs (Fig. 2). After aggregating
the groups of lncRNA signatures, seven lncRNAs were identified with
PCA, as described in Table IV. The
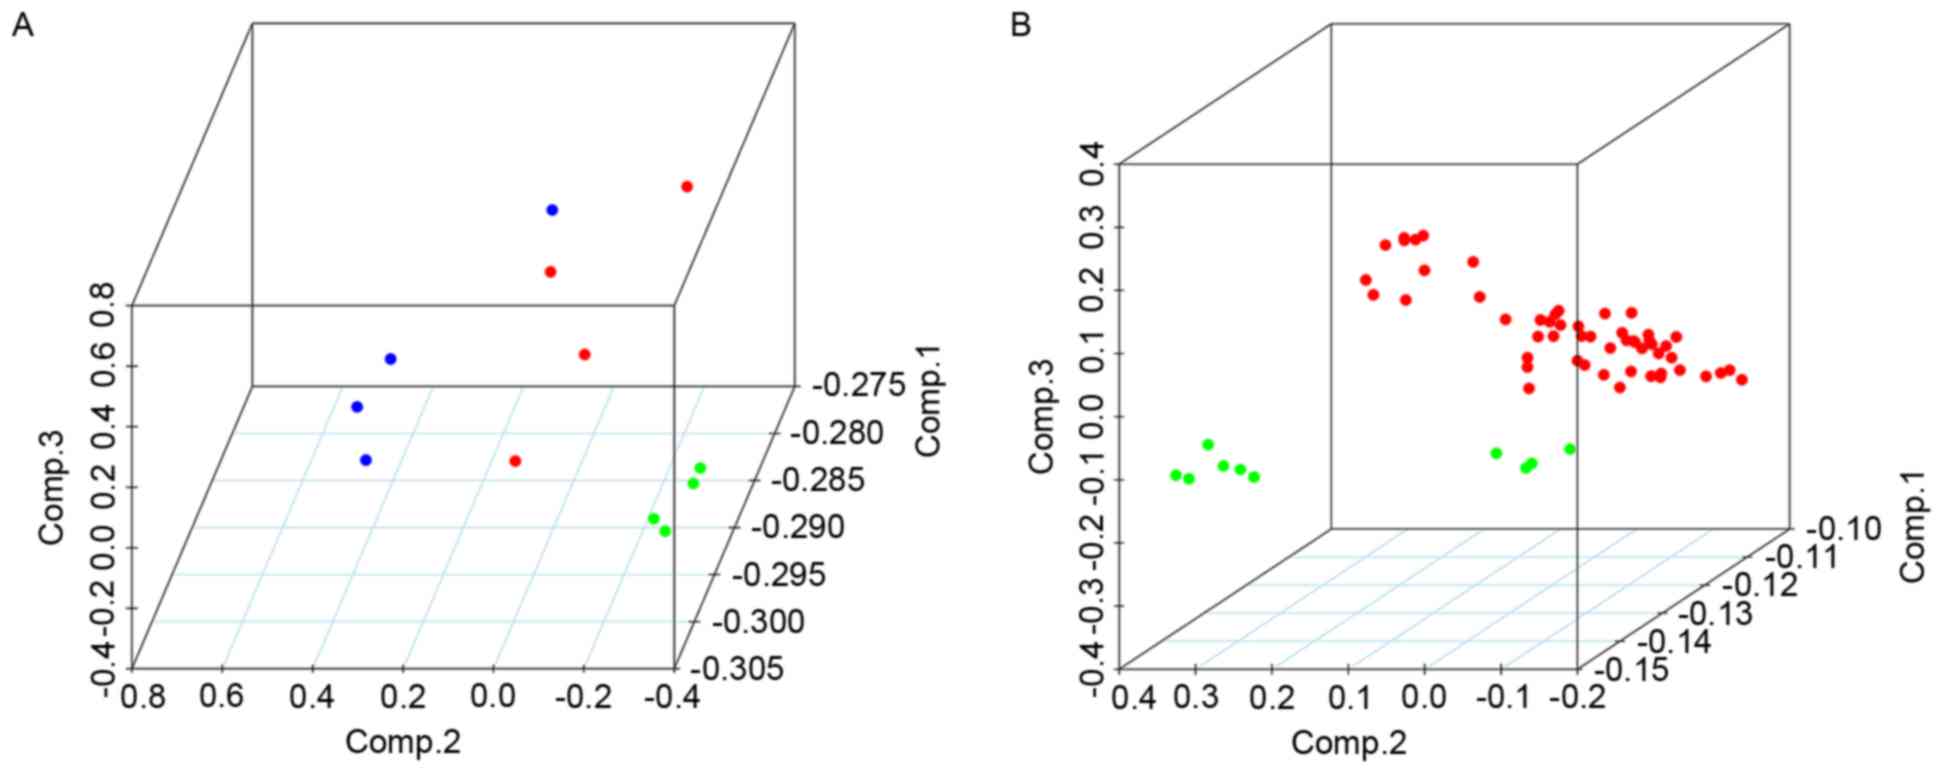
fold change of each of these seven lncRNAs is indicated in Fig. 3. Furthermore, the PCA results were
suitable for distinguishing OC from normal tissue samples; the PCA
results of all samples from the datasets indicated that the OC and
normal tissue samples could be distinguished by the combined
differential expression of the seven lncRNAs (Fig. 4). Thus, it was determined that the
lncRNA signatures identified in the training set were
representative.
| Table II.Numbers of all probe sets
differentially expressed in each microarray dataset. |
Table II.
Numbers of all probe sets
differentially expressed in each microarray dataset.
| Dataset | Upregulated probe
sets | Downregulated probe
sets | Total differential
probe sets |
|---|
| GSE36668 | 510 | 489 | 999 |
| GSE18520 | 1,073 | 4,750 | 5,823 |
| Table III.Number of all lncRNAs differentially
expressed in each dataset, following the re-annotation of existing
probe sets. |
Table III.
Number of all lncRNAs differentially
expressed in each dataset, following the re-annotation of existing
probe sets.
| Dataset | Upregulated probe
sets | Downregulated probe
sets | Total differential
probe sets |
|---|
| GSE36668 | 20 | 17 | 37 |
| GSE18520 | 94 | 25 | 119 |
| Table IV.lncRNAs of which the combined
differential expression was sufficient to distinguish cancerous and
normal tissue. |
Table IV.
lncRNAs of which the combined
differential expression was sufficient to distinguish cancerous and
normal tissue.
| lncRNAs | Chr | Description |
|---|
| LEMD1-AS1 | 1q32.1 | LEMD1 antisense RNA
1 |
| LOC100506834 | 7 | Uncharacterized
LOC100506834 |
| NR2F1 | 5q14 | NR2F1 antisense RNA
1, transcript variant 5 |
| RNF157 | 17q25.1 | RNF157 antisense RNA
1 |
| IPW | 15q11.2 | Imprinted in
Prader-Willi syndrome |
| LOC100507387 | 7 | Uncharacterized
LOC100507387 |
| LOC100507564 | 1 | Uncharacterized
LOC100507564 |
Discussion
Ovarian cancer is a great threat to female health
worldwide. Early detection of ovarian cancer at its localized stage
can increase the 5-year survival rate to ~90% (20). Hence, identifying novel targets that
could serve as biomarkers for early diagnosis and treatment of
ovarian cancer is urgently required. Previous studies investigating
effective early ovarian cancer diagnostic markers have revealed
that the development of ovarian cancer is associated with the
aberrant expression of specific lncRNAs, including GAS5 (21), SPRY4-IT1 (22), C17orf91 (23) and CCAT2 (24).
In the present study, a training-validation approach
and a probe set re-annotation and lncRNA classification pipeline
were used to identify seven lncRNAs that were differentially
expressed in OC tumor tissue from the two datasets. All the
identified lncRNAs have annotations in the NCBI RefSeq database,
meaning that the sequences of each lncRNA are completely known,
improving the ease of examining the function and downstream target
genes of each lncRNA. The identified lncRNAs may interact with
various genes to affect the gene expression profile of cells and
lead to oncogenesis. The identified lncRNAs may also be candidates
for novel ovarian cancer detection biomarkers. Further in
vivo and in vitro experiments are required to reveal the
function of these lncRNAs and their association with ovarian cancer
development.
As the Affymetrix Human Genome U133 Plus 2.0 array
has a large number of probe sets, lncRNA expression data can be
extracted with probe set re-annotation and the lncRNA
classification pipeline, as performed in the present study. This is
advantageous as the HG U133 Plus 2.0 array series is one of most
commonly used commercial microarrays in human cancer profiling;
prior to performing an lncRNA microarray, the information from
existing published expression profile data should, therefore, be
considered.
In conclusion, seven differentially expressed
lncRNAs in ovarian carcinoma have been identified in the present
study; their combined differential expression was sufficient to
distinguish normal and cancerous tissue. A novel method for mining
lncRNA data from pre-existing expression microarrays, instead of
using a specialized lncRNA microarray, has been established. This
method is comparatively low-cost and could potentially be applied
in a wide range of other research areas.
Acknowledgements
The present study was supported by the Science and
Technology Project of Shandong Province (grant no.
2014GGH218027).
References
|
1
|
Rooth C: Ovarian cancer: Risk factors,
treatment and management. Br J Nurs. 22 Suppl:23–30. 2013.
View Article : Google Scholar
|
|
2
|
Omura GA, Brady MF, Homesley HD, Yordan E,
Major FJ, Buchsbaum HJ and Park RC: Long-term follow-up and
prognostic factor analysis in advanced ovarian carcinoma: The
gynecologic oncology group experience. J Clin Oncol. 9:1138–1150.
1991. View Article : Google Scholar : PubMed/NCBI
|
|
3
|
Goetsch CM: Genetic tumor profiling and
genetically targeted cancer therapy. Semin Oncol Nurs. 27:34–44.
2011. View Article : Google Scholar : PubMed/NCBI
|
|
4
|
Djebali S, Davis CA, Merkel A, Dobin A,
Lassmann T, Mortazavi A, Tanzer A, Lagarde J, Lin W, Schlesinger F,
et al: Landscape of transcription in human cells. Nature.
489:101–108. 2012. View Article : Google Scholar : PubMed/NCBI
|
|
5
|
Kornienko AE, Guenzl PM, Barlow DP and
Pauler FM: Gene regulation by the act of long non-coding RNA
transcription. BMC Biol. 11:592013. View Article : Google Scholar : PubMed/NCBI
|
|
6
|
Derrien T, Johnson R, Bussotti G, Tanzer
A, Djebali S, Tilgner H, Guernec G, Martin D, Merkel A, Knowles DG,
et al: The GENCODE v7 catalog of human long noncoding RNAs:
Analysis of their gene structure, evolution, and expression. Genome
Res. 22:1775–1789. 2012. View Article : Google Scholar : PubMed/NCBI
|
|
7
|
Yang G, Lu X and Yuan L: LncRNA: A link
between RNA and cancer. Biochim Biophys Acta. 1839:1097–1109. 2014.
View Article : Google Scholar : PubMed/NCBI
|
|
8
|
Zhang X, Sun S, Pu JK, Tsang AC, Lee D,
Man VO, Lui WM, Wong ST and Leung GK: Long non-coding RNA
expression profiles predict clinical phenotypes in glioma.
Neurobiol Dis. 48:1–8. 2012. View Article : Google Scholar : PubMed/NCBI
|
|
9
|
Zhou Y, Zhong Y, Wang Y, Zhang X, Batista
DL, Gejman R, Ansell PJ, Zhao J, Weng C and Klibanski A: Activation
of p53 by MEG3 non-coding RNA. J Biol Chem. 282:24731–24742. 2007.
View Article : Google Scholar : PubMed/NCBI
|
|
10
|
Elgaaen BV, Olstad OK, Sandvik L, Odegaard
E, Sauer T, Staff AC and Gautvik KM: ZNF385B and VEGFA are strongly
differentially expressed in serous ovarian carcinomas and correlate
with survival. PLoS One. 7:e463172012. View Article : Google Scholar : PubMed/NCBI
|
|
11
|
Mok SC, Bonome T, Vathipadiekal V, Bell A,
Johnson ME, Wong KK, Park DC, Hao K, Yip DK, Donninger H, et al: A
gene signature predictive for outcome in advanced ovarian cancer
identifies a survival factor: Microfibril-associated glycoprotein
2. Cancer Cell. 16:521–532. 2009. View Article : Google Scholar : PubMed/NCBI
|
|
12
|
Michiels S, Koscielny S and Hill C:
Prediction of cancer outcome with microarrays: A multiple random
validation strategy. Lancet. 365:488–492. 2005. View Article : Google Scholar : PubMed/NCBI
|
|
13
|
Yu F, Jiang Q, Zhou Y, Yang Z, Yu X, Wang
H, Liu Z, Wang L, Fang W and Guo S: Abnormal expression of matrix
metalloproteinase-9 (MMP9) correlates with clinical course in
Chinese patients with endometrial cancer. Dis Markers. 32:321–327.
2012. View Article : Google Scholar : PubMed/NCBI
|
|
14
|
Shen X, Yue M, Meng F, Zhu J, Zhu X and
Jiang Y: Microarray analysis of differentially-expressed genes and
linker genes associated with the molecular mechanism of colorectal
cancer. Oncol Lett. 12:3250–3258. 2016.PubMed/NCBI
|
|
15
|
R Development Core Team, . R: A language
and environment for statistical computing. R Foundation for
Statistical Computing; Vienna, Austria: 2015
|
|
16
|
Zhi H, Ning S and Li X, Li Y, Wu W and Li
X: A novel reannotation strategy for dissecting DNA methylation
patterns of human long intergenic non-coding RNAs in cancers.
Nucleic Acids Res. 42:8258–8270. 2014. View Article : Google Scholar : PubMed/NCBI
|
|
17
|
Camacho C, Coulouris G, Avagyan V, Ma N,
Papadopoulos J, Bealer K and Madden TL: BLAST+: Architecture and
applications. BMC Bioinformatics. 10:4212009. View Article : Google Scholar : PubMed/NCBI
|
|
18
|
Han L and Zhu J: Using matrix of
thresholding partial correlation coefficients to infer regulatory
network. Biosystems. 91:158–165. 2008. View Article : Google Scholar : PubMed/NCBI
|
|
19
|
Saeed AI, Sharov V, White J, Li J, Liang
W, Bhagabati N, Braisted J, Klapa M, Currier T, Thiagarajan M, et
al: TM4: A free, open-source system for microarray data management
and analysis. Biotechniques. 34:374–378. 2003.PubMed/NCBI
|
|
20
|
Li K, Hüsing A, Fortner RT, Tjønneland A,
Hansen L, Dossus L, Chang-Claude J, Bergmann M, Steffen A, Bamia C,
et al: An epidemiologic risk prediction model for ovarian cancer in
Europe: The EPIC study. Br J Cancer. 112:1257–1265. 2015.
View Article : Google Scholar : PubMed/NCBI
|
|
21
|
Li J, Huang H, Li Y, Li L, Hou W and You
Z: Decreased expression of long non-coding RNA GAS5 promotes cell
proliferation, migration and invasion, and indicates a poor
prognosis in ovarian cancer. Oncol Rep. 36:3241–3250.
2016.PubMed/NCBI
|
|
22
|
Li H, Liu C, Lu Z, Chen L, Wang J, Li Y
and Ma H: Upregulation of the long non-coding RNA SPRY4-IT1
indicates a poor prognosis and promotes tumorigenesis in ovarian
cancer. Biomed Pharmacother. 88:529–534. 2017. View Article : Google Scholar : PubMed/NCBI
|
|
23
|
Li J, Yu H, Xi M and Lu X: Long noncoding
RNA C17orf91 is a potential prognostic marker and functions as an
oncogene in ovarian cancer. J Ovarian Res. 9:492016. View Article : Google Scholar : PubMed/NCBI
|
|
24
|
Huang S, Qing C, Huang Z and Zhu Y: The
long non-coding RNA CCAT2 is up-regulated in ovarian cancer and
associated with poor prognosis. Diagn Pathol. 11:492016. View Article : Google Scholar : PubMed/NCBI
|