Introduction
Breast cancer is characterized by a distinct
metastatic pattern involving the regional lymph nodes, bone marrow,
lungs and the liver (1). It is the
most common type of cancer diagnosed among women and the second
leading cause of cancer mortality among women following lung cancer
(2). A family history of breast
cancer and several other factors (including female sex, old age and
exposure to ionizing radiation) increase the risk of developing
breast cancer (3). In addition, 5–10%
of breast cancer cases are caused by inherited gene mutations
(4). Several gene markers have been
identified to predict responses to therapeutic regimens, such as
receptor tyrosine-protein kinase erbB-2 and Stearoyl-CoA
desaturase-1 (5–7). However, development remains necessary to
understanding the mechanisms of breast cancer, in order to
customize anticancer therapies and to identify altered pathways in
an individual with breast cancer.
Pathway analysis has become the first choice for
gaining insight into the underlying biology of genes and proteins,
as it reduces complexity and has increased explanatory power
(8). Existing pathway analysis
techniques are predominantly focused on discovering altered
pathways between normal and cancer groups and are not suitable for
identifying the pathway aberrance that may occur in an individual
sample (9). A simple way to identify
an individual's pathway aberrance is to compare normal and tumor
data from the same individual. However, matched normal data from
the same individual is often unavailable in clinical situations.
Therefore, the present study applied a new approach for the
personalized identification of altered pathways, making special use
of accumulated normal data in cases when a patient's matched normal
data were unavailable (10).
The present study identified altered pathways in
breast cancer based on the individualized pathway aberrance score
(iPAS) method which included data preprocessing, gene-level
statistics, pathway-level statistics and a significant test. The
altered pathways were validated by comparison with pathways based
on differentially expressed genes (DEGs), and by calculating the
percentage of changed pathways in breast cancer samples.
Materials and methods
Gene expression data
In the present study, the gene expression profile
with accession number E-GEOD-10780 (11) was recruited from the ArrayExpress
database (http://www.ebi.ac.uk/arrayexpress/). E-GEOD-10780,
which was presented on the A-AFFY-44-Affymetrix GeneChip Human
Genome U133 Plus 2.0 (Affymetrix, Inc., Santa Clara, CA, USA),
comprised of 143 normal control samples and 42 breast cancer
samples. The gene expression profile on probe level was converted
into gene symbol level. Subsequent to removing the duplicated
symbols, a total of 20,102 gene symbols were obtained for
additional analysis.
Pathway data
Information from gene sets representing biological
pathways was downloaded from the reactome pathway database
(http://www.reactome.org/) (12). Reactome is an online curated resource
for human pathway data and provides infrastructure for computation
across the biological reaction network (12). Pathways involving a small number of
genes are easily understood by researchers. Therefore, for the
present study pathways with a gene set of >100 were filtered
out. In addition, the present study also eliminated pathways that
had a null set with the gene expression profile E-GEOD-10780.
Finally, 1,013 pathways were identified, which consisted of 5,182
genes.
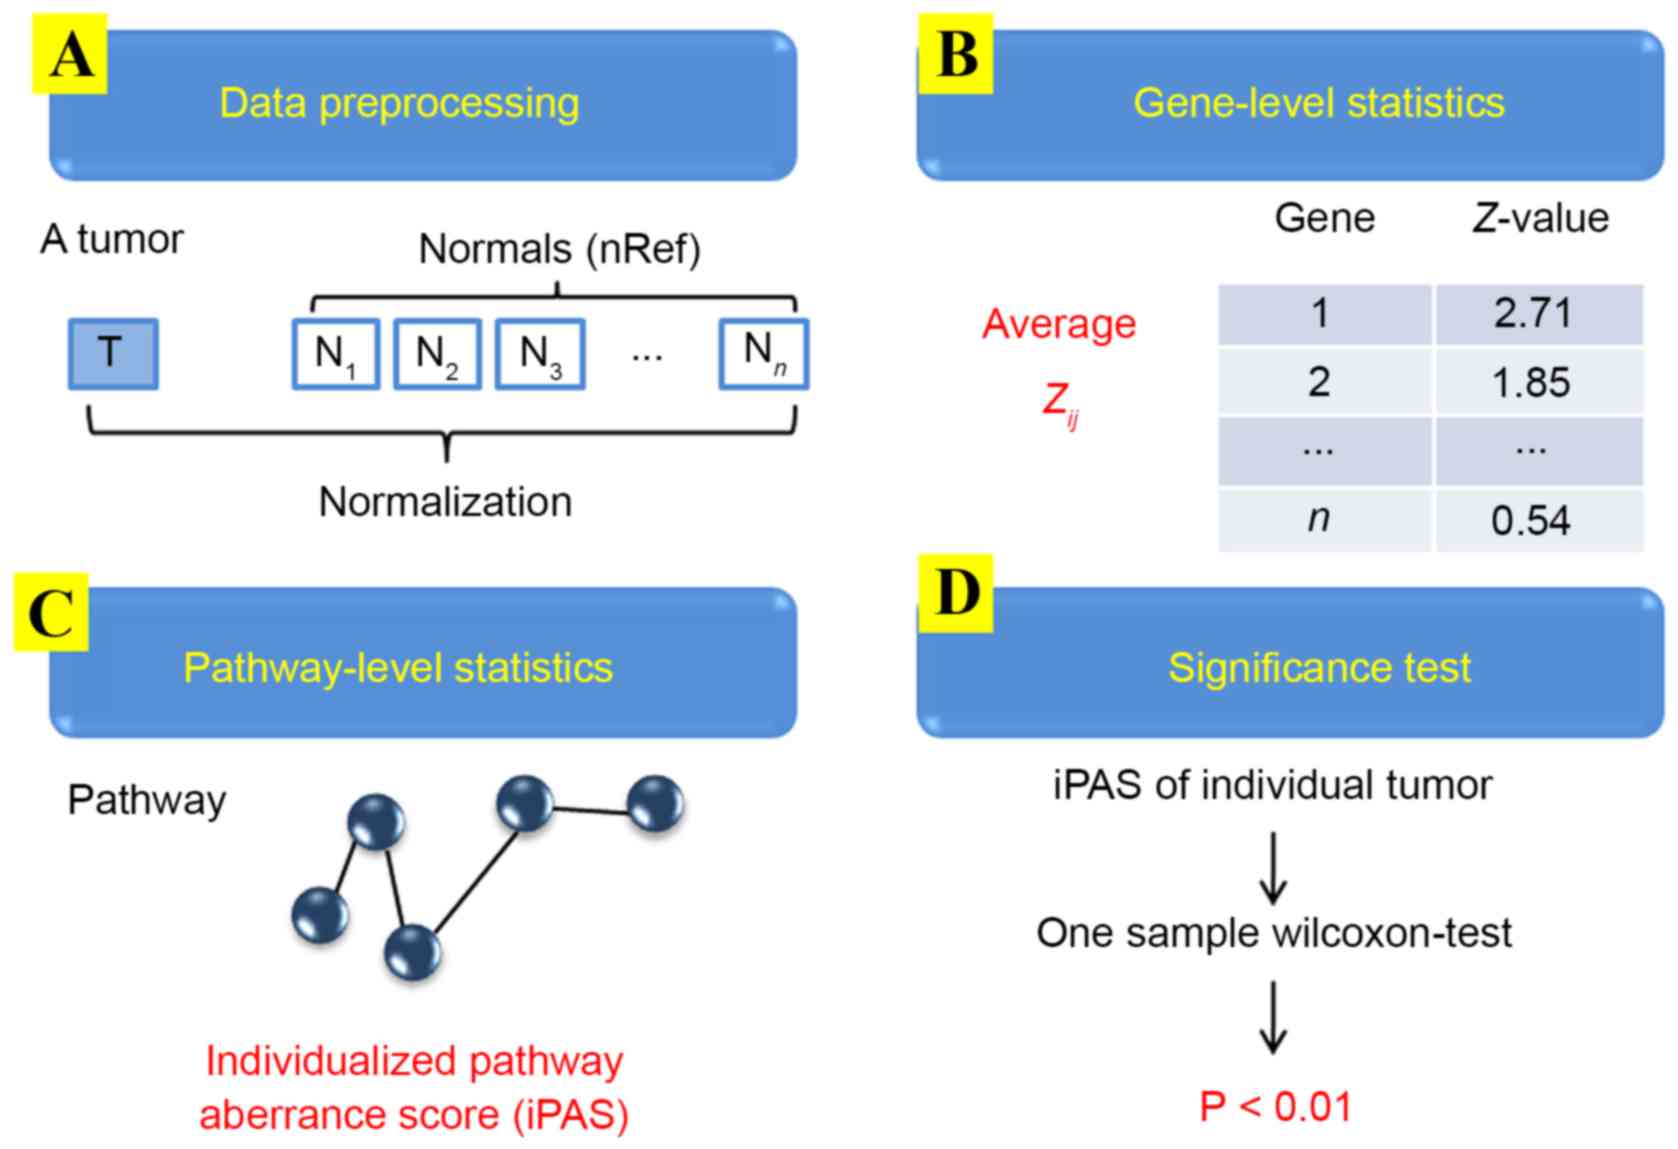
Individualized analysis for
pathways
To identify altered pathways in an individual breast
cancer sample, the iPAS method was employed (10), which includes 4 steps: Data
preprocessing (Fig. 1A); gene-level
statistics (Fig. 1B); pathway-level
statistics (Fig. 1C); and a
significant test (Fig. 1D).
Data pre-processing
Prior to analysis, a standard pre-treatment was
conducted to control the quality of the gene expression profiles.
For normal genes, background corrections and normalization were
carried out using the robust multi-array average (RMA) algorithm
and the quantile based algorithm to eliminate the influence of
nonspecific hybridization (13,14). The
Micro Array Suite 5.0 (MAS 5.0) algorithm was then applied to
revise perfect match and mismatch value (15), and median polish method was applied to
summarize the expression value (13).
All normal control samples were regarded as references (nRef) in
the present study. For individual breast cancer cases, the present
study performed uniformly standardized normalization following the
combination of the single tumor microarray with all nRef
samples.
Gene-level statistics
Standardizing the gene expression on the gene-level
via mean and standard deviation (SD) from datasets is often used in
microarray analysis. In the present study, the individual tumor
sample gene expression level was standardized based on the mean and
SD of the normal references. This formula was defined as:
Zij=Tij–mean(Nj)stdev(Nj)
Where mean (Nj) symbolized the mean
expression value of the genes of the nRef, stdev (Nj)
symbolized the SD of the normal, Tij symbolized the
expression value of i-th tumor gene and Zij symbolized
the standardized expression value of i-th tumor gene, where
the number of genes belonging to the gene was i.
Pathway-level statistics based on
average Z
The average Z method was selected to evaluate
iPAS by utilizing the nRef. A vector
Z=(zn) denoted the expression status of a
pathway, where zi symbolizes the standardized
expression value of the i-th gene and is derived from mean
and SD of the nRef. n was the number of genes belonging to
the pathway. The iPAS was calculated as following:
iPAS=∑jnZi
Significant measurement
A one sample Wilcoxon-test was conducted for normal
and tumor pathway statistics values to estimate the significance of
the pathways (16). All collected
normal samples for the nRef were sequentially compared with the
nRef to yield statistics of the null distribution. A P-value was
produced according to comparison between this null distribution and
a statistic from a single tumor case, and was adjusted by false
discovery rate (FDR). A pathway with P<0.01 was considered as
altered pathway compared with nRef.
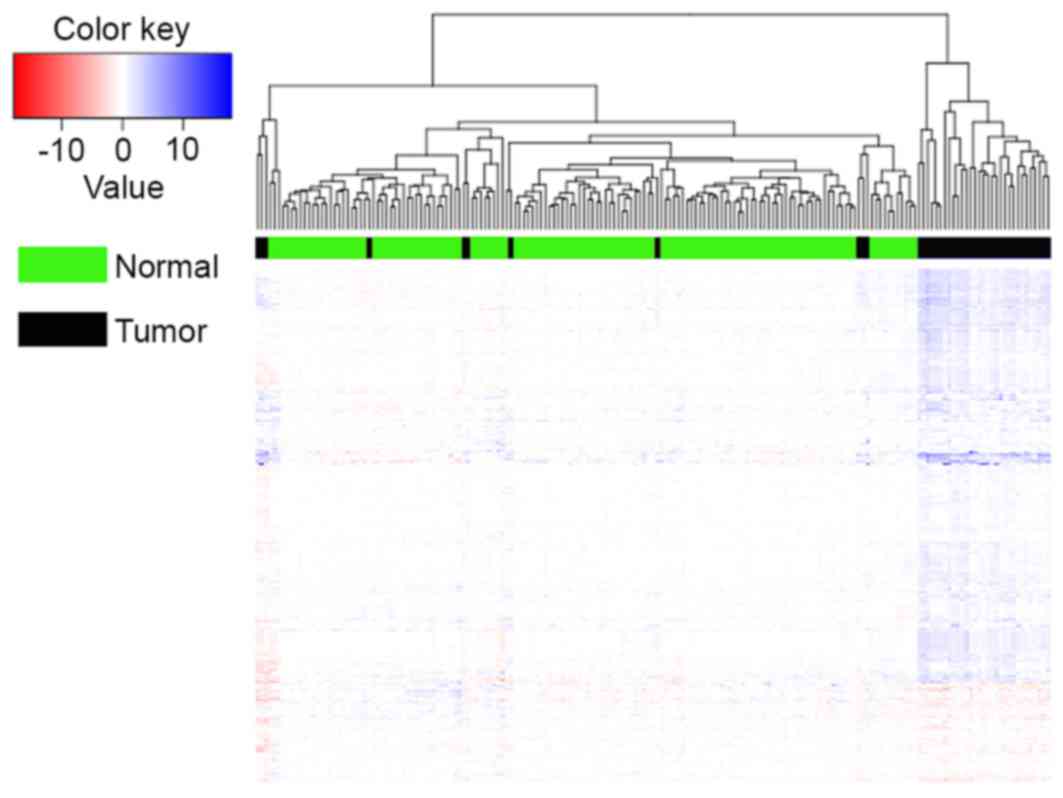
Hierarchical clustering analysis of
altered pathways
To assess the classification performance of altered
pathways, a hierarchical clustering analysis was applied across 42
tumor samples and 143 normal control samples using the Gene Cluster
3.0 (Human Genome Center, University of Tokyo, Tokyo, Japan)
program. The clustering algorithm was set to complete linkage
clustering using an uncentered correlation. Ideally, the samples
should be classified into 2 major clusters: Tumor cases and normal
controls. The present study tested the method by measuring the
percentage of test samples that could be correctly classified.
Accuracy is the fraction of correctly classified samples over all
samples (17).
Accuracy=TN+TPTN+TP+FN+FP
TP (true positive) represents the number of positive
samples correctly predicted as positive, TN (true negative)
represents the number of negative samples correctly predicted as
negative, FP (false positive) represents the number of negative
samples incorrectly predicted as positive and FN (false negative)
represents the number of positive samples incorrectly predicted as
negative.
Validation of the altered
pathways
The present study applied 2 methods to validate
altered pathways obtained from individualized analysis using the
nRef, one was comparing with the traditional approach according to
DEGs to identify pathways, and the other was by calculating the
percentage of each changed pathway in tumor samples.
DEGs based pathway analysis
The linear models for microarray data (Limma)
package (18) was utilized to explore
DEGs between the patients with breast cancer and the normal
controls. Only the genes with FDR adjusted P-values of <0.01 and
log fold change of >2 were classed as DEGs. The Kyoto
Encyclopedia of Genes and Genomes (KEGG) pathway enrichment
analysis for DEGs was conducted based on the Database for
Annotation, Visualization and Integrated Discovery (19), which implemented the expression
analysis systematic explorer test to selected pathways with the
criterion P<0.01 (20).
Pathway changed percent
To validate altered pathways in tumors which were
identified by iPAS method combined with nRef, the present study
counted the percentage change for each pathway in breast cancer
samples. Firstly, by taking the distribution character of each
pathway statistic value in normal and tumor samples, the empirical
P-value of each pathway in a tumor individual compared with nRef
was detected. The amount of P-values <0.01 were then
statistically counted in order to obtain the changed percentage for
each pathway in all breast cancer cases.
Statistical analysis
In the present study, the one sample Wilcoxon test
(using SPSS v.19.0; IBM SPSS, Armonk, NY, USA) was utilized to
estimate the significance of the pathways, of which P values also
were calculated. P<0.05 was considered to indicate a
statistically significant difference. However, to be confident in
the validity of these results, P<0.01 was the statistically
significant threshold in the current study.
Results
Identification of altered
pathways
In the present study, 143 normal control samples in
the gene expression profile E-GEOD-10780 were defined as nRef of 42
tumor samples. The present study performed quantile normalization
for tumor genes to evaluate their gene-level statistics. A total of
1,013 pathways were identified from the reactome pathway database.
The present study extracted gene-level statistic values of all
genes enriched in one pathway, and denoted the mean value to
pathway-level statistics of this pathway. With a threshold value of
P<0.01, a total of 688 altered pathways were explored for breast
cancer. The cluster analysis of using Average Z as the iPAS method
based on individual breast cancer and normal controls was also
shown in Fig. 2. As presented in
Fig. 2, TP=31, FP=11, TN=143, while
FN=0, thus the accuracy of classification equaled to 94.05%, which
indicated that the samples possessed good classification.
In addition, the top 5% of the 688 altered pathways
are shown in Table I. Polo-like
kinase (PLK) -mediated events, phosphorylation of proteins involved
in G1/S transition by active cyclin E/Cdk2 complexes,
G2/M DNA replication checkpoint, FGFR2b ligand binding
and activation and cyclin A/B1 associated events during
G2/M transition were the most significant pathways with
a P-value of 4.38E-18.
 | Table I.Top 5% of 688 altered pathways with
P<0.01 in breast cancer. |
Table I.
Top 5% of 688 altered pathways with
P<0.01 in breast cancer.
| Pathway | P-value |
|---|
| Polo-like kinase
mediated events | 4.38E-18 |
| Phosphorylation of
proteins involved in G1/S transition by active Cyclin E/Cdk2
complexes | 4.38E-18 |
| G2/M DNA
replication checkpoint | 4.38E-18 |
| FGFR2b ligand
binding and activation | 4.38E-18 |
| Cyclin A/B1
associated events during G2/M transition | 4.38E-18 |
| Deposition of new
CENPA-containing nucleosomes at the centromere | 1.27E-17 |
| Nucleosome
assembly | 1.27E-17 |
| Kinesins | 1.50E-17 |
| Removal of the flap
intermediate from the C-strand | 3.47E-17 |
|
G1/S-specific
transcription | 4.99E-17 |
| Phosphorylation of
emi1 | 4.99E-17 |
| Removal of the flap
intermediate | 8.93E-17 |
| Chromosome
maintenance | 8.93E-17 |
| G0 and early
G1 | 8.93E-17 |
| FGFR1b ligand
binding and activation | 1.02E-16 |
| Cyclin B2 mediated
events | 1.05E-16 |
| CHL1
interactions | 1.24E-16 |
| Phosphorylation of
the APC/C | 1.87E-16 |
| Meiotic
recombination | 1.87E-16 |
| RNA polymerase I
promoter opening | 2.06E-16 |
| Notch-HLH
transcription pathway | 2.33E-16 |
| Type I
hemidesmosome assembly | 3.41E-16 |
| E2F mediated
regulation of DNA replication | 3.41E-16 |
| Unwinding of
DNA | 3.41E-16 |
| Telomere
Maintenance | 4.00E-16 |
| Inactivation of
APC/C via direct inhibition of the APC/C complex | 4.00E-16 |
| Inhibition of the
proteolytic activity of APC/C required for the onset of anaphase by
mitotic spindle checkpoint components | 4.00E-16 |
| G2/M
checkpoints | 4.00E-16 |
| Mitotic spindle
checkpoint | 4.66E-16 |
| DNA strand
elongation | 4.66E-16 |
| Processive
synthesis on the lagging strand | 4.66E-16 |
| E2F-enabled
inhibition of pre-replication complex formation | 5.20E-16 |
| Telomere C-strand
(lagging strand) synthesis | 5.80E-16 |
| Activation of the
pre-replicative complex | 5.80E-16 |
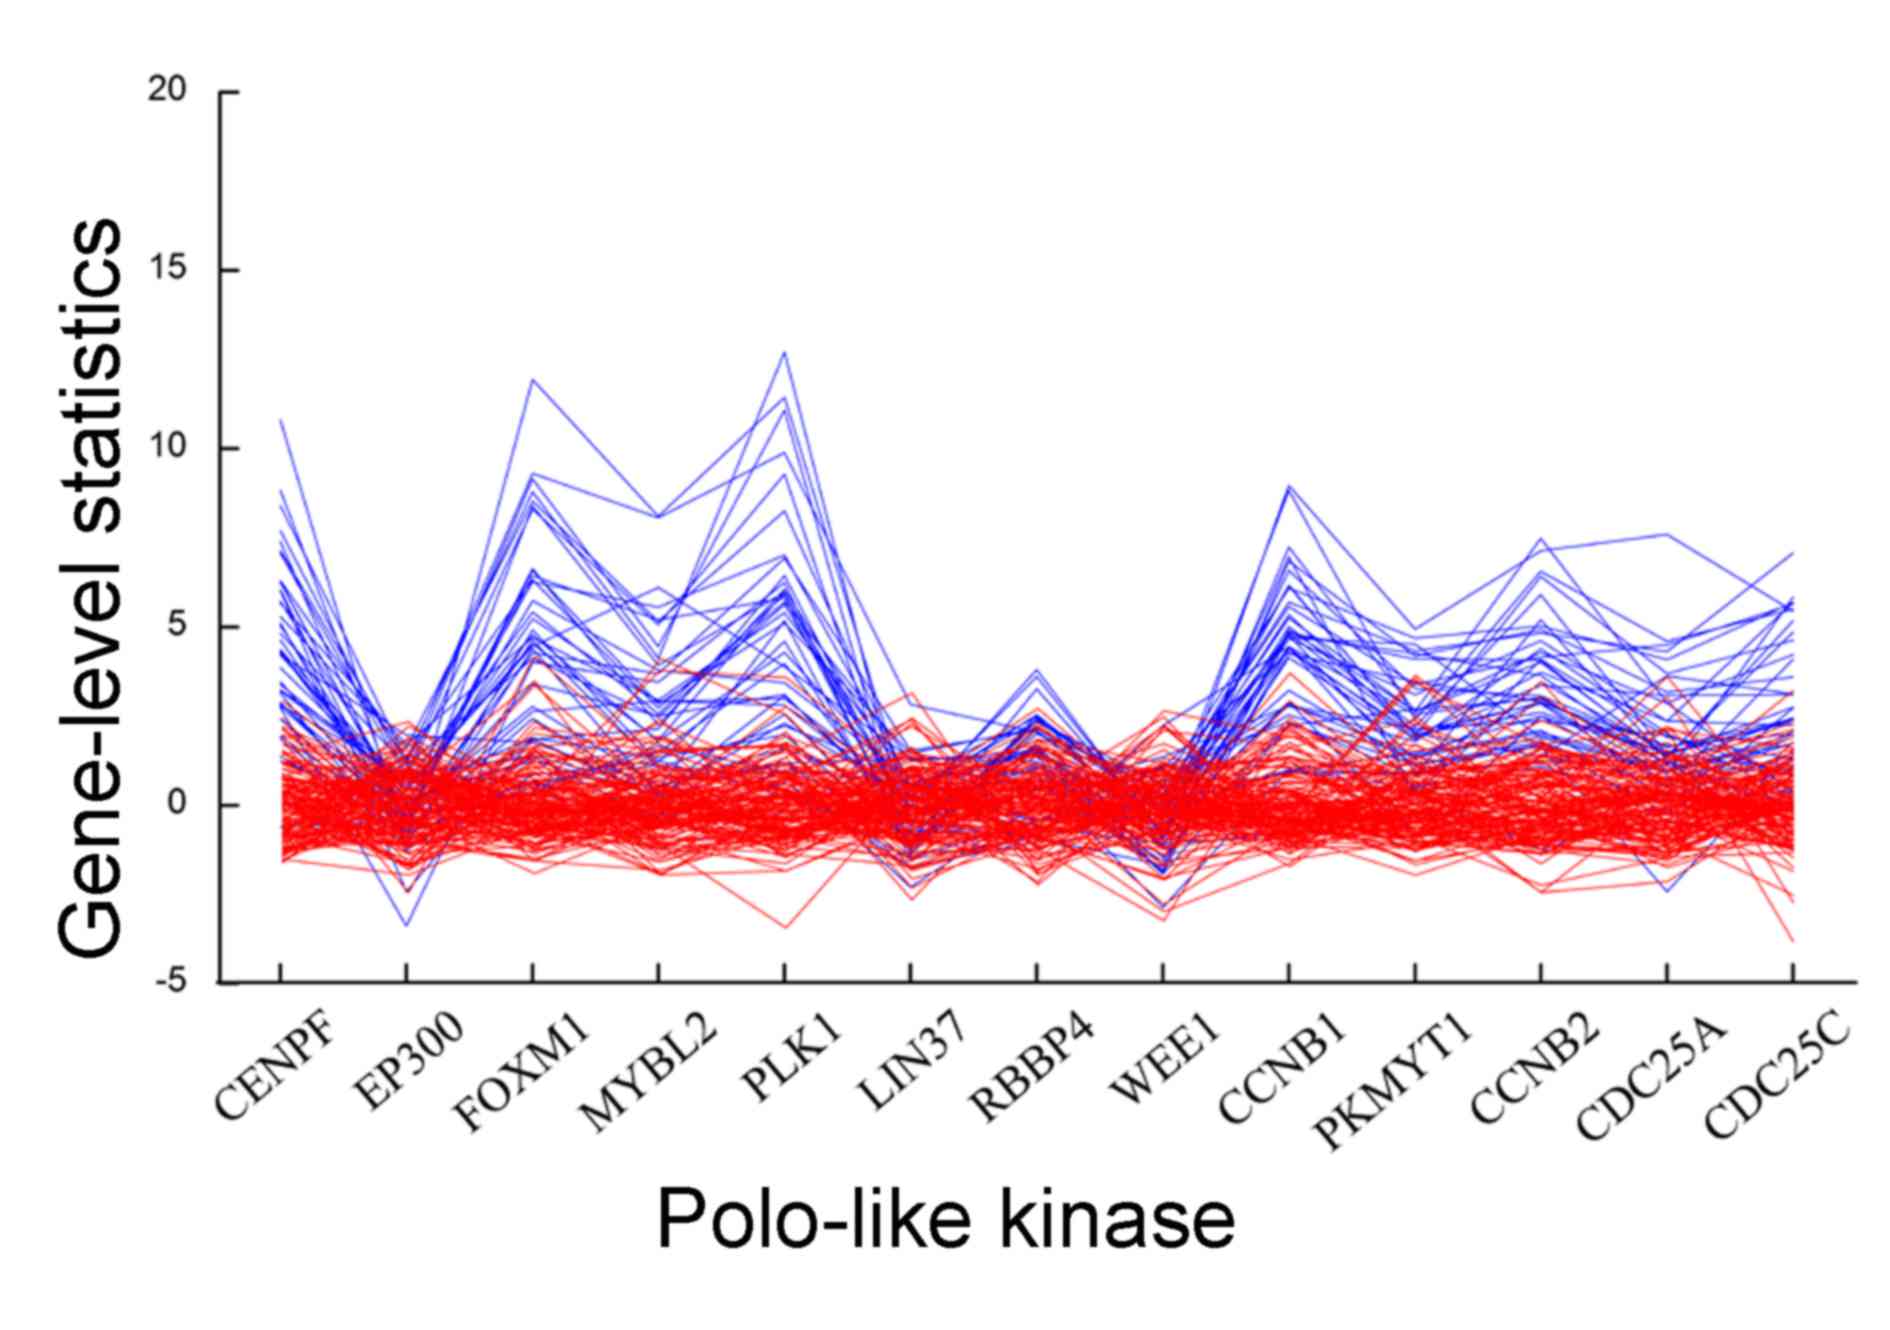
Gene compositions of altered
pathways
Pathways involve several genes, which work together
to perform one biological process or to regulate certain biological
functions. To additionally identify the functions and properties of
altered pathways, the present study investigated their gene
compositions at the gene expression level. The PLK-mediated events
pathway was comprised of 13 genes (centromere protein F,
CENPF; E1A binding protein p300, EP300; forkhead box
protein M1, FOXM1; MYB proto-oncogene like 2, MYBL2;
polo-like kinase 1, PLK1; lin-37 DREAM MuvB complex
component, LIN37; RB binding protein 4, chromatin remodeling
factor, RBBP4; WEE 1 G2 checkpoint kinase, WEE1;
cyclin B1, CCNB1; protein kinase, membrane associated
tyrosine/threonine 1, PKMYT1; cyclin B2, CCNB2; cell
division cycle 25A, CDC25A and cell division cycle 25C
CDC25C), and Fig. 3
illustrates expression patterns of genes in this pathway across
normal and breast cancer samples. The present study identified that
the gene-level statistic in tumors was disturbed relative to that
in normal samples, and in normal samples the gene-levels for the 13
genes were similar in general. Therefore, it may be inferred that
different gene-levels lead to the production of altered pathways in
breast cancer compared with nRef.
Comparison with pathways based on
DEGs
The present study identified a total of 324 DEGs
between breast cancer and normal controls with thresholds of
P<0.01 and log fold change of >2. Taking the intersection
with 5,182 genes contained in 1,013 pathways, only 155 common genes
were detected.
Results of the KEGG pathway enrichment analysis
showed that 324 DEGs were enriched in 9 significant pathways under
the condition of P<0.01 (Table
II). The most significant pathways were focal adhesion
(P=4.01E-05), ECM-receptor interaction (P=4.73E-05) and
cytokine-cytokine receptor interaction (P=2.90E-04). When
performing KEGG enrichment analysis for common genes, notably, the
155 common genes also enriched in the same 9 pathways, however the
properties were different, such as P-value, count and enriched
genes. The most significant term of common genes was the peroxisome
proliferator-activated receptor signaling pathway with P=3.44E-04.
In addition, cytokine-cytokine receptor interactions had the
largest count of 18, whilst the next was pathways in cancer with a
count of 14. Although the DEGs are not entirely included by 5,182
pathway genes, the 9 KEGG pathways were all involved in 688 altered
pathways, which indicates that the present method was used to
identify altered pathways.
| Table II.Kyoto encyclopedia of genes and
genomes pathways with P<0.01 based on DEGs and common genes. |
Table II.
Kyoto encyclopedia of genes and
genomes pathways with P<0.01 based on DEGs and common genes.
|
| P-value | Count |
|---|
|
|
|
|
|---|
| Pathway | DEGs | Common | DEGs | Common |
|---|
| Focal adhesion | 4.01E-05 | 5.39E-03 | 17 | 11 |
| Extracellular
matrix-receptor interaction | 4.37E-05 | 5.59E-03 | 11 | 7 |
| Cytokine-cytokine
receptor interaction | 2.90E-04 | 1.54E-03 | 18 | 14 |
| Peroxisome
proliferator-activated receptor signaling pathway | 1.68E-03 | 3.44E-04 | 8 | 8 |
| Pathways in
cancer | 3.53E-03 | 9.85E-03 | 18 | 14 |
| Adipocytokine
signaling pathway | 6.68E-03 | 9.41E-03 | 7 | 6 |
|
Aldosterone-regulated sodium
reabsorption | 7.39E-03 | 7.88E-03 | 5 | 5 |
| Chemokine signaling
pathway | 8.71E-03 | 9.51E-03 | 11 | 10 |
| Oocyte meiosis | 9.05E-03 | 5.31E-03 | 8 | 8 |
Validation of altered pathways based
on changed percent
The present study calculated percentage of changed
pathways among 42 breast cancer samples, and listed the 47 pathways
with changes in >80% tumor samples (Table III). The 47 pathways were part of
688 altered pathways. Kinesins (KIFs) and PLK mediated events were
changed in 39 individuals (92.86%), the next were chromosome
maintenance, meiotic recombination, deposition of new centromere
protein A-containing nucleosomes at the centromere, nucleosome
assembly and G2/M (DNA damage) DNA replication
checkpoint changed in 38 individuals (90.48%). If the changed
percentage was equal to 50%, a total of 310 terms were obtained,
which are also involved in 688 altered pathways. This may
contribute to validation of the present results.
| Table III.Altered pathways with a percentage
change >80%. |
Table III.
Altered pathways with a percentage
change >80%.
| Altered
pathway | Amount | Percent (%) |
|---|
| Kinesins | 39 | 92.86 |
| Polo-like kinase
mediated events | 39 | 92.86 |
| Chromosome
maintenance | 38 | 90.48 |
| Meiotic
recombination | 38 | 90.48 |
| Deposition of new
CENPA-containing nucleosomes at the centromere | 38 | 90.48 |
| Nucleosome
assembly | 38 | 90.48 |
| G2/M DNA
replication checkpoint | 38 | 90.48 |
| Telomere
maintenance | 37 | 88.10 |
| Golgi cisternae
pericentriolar stack reorganization | 37 | 88.10 |
| Nuclear factor-kB
activation through Fas-associated death domain and receptor
interacting protein 1 pathway mediated by caspase-8 and −10 | 37 | 88.10 |
| Phosphorylation of
proteins involved in G1/S transition by active Cyclin E/Cdk2
complexes | 37 | 88.10 |
| Meiosis | 36 | 85.71 |
| RNA polymerase I
promoter clearance | 36 | 85.71 |
| Amyloids | 36 | 85.71 |
| Packaging of
telomere ends | 36 | 85.71 |
| RNA polymerase I
promoter opening | 36 | 85.71 |
| Cyclin A/B1
associated events during G2/M transition | 36 | 85.71 |
| Leading strand
synthesis | 36 | 85.71 |
| Polymerase
switching | 36 | 85.71 |
| Polymerase
switching on the C-strand of the telomere | 36 | 85.71 |
| Phosphorylation of
emi1 | 36 | 85.71 |
| Meiotic
synapsis | 35 | 83.33 |
| RNA polymerase I
chain elongation | 35 | 83.33 |
| G2/M
checkpoints | 35 | 83.33 |
| Activation of ATR
in response to replication stress | 35 | 83.33 |
| DNA strand
elongation | 35 | 83.33 |
| Activation of the
pre-replicative complex | 35 | 83.33 |
| Extension of
telomeres | 35 | 83.33 |
| Telomere C-strand
(lagging strand) synthesis | 35 | 83.33 |
| Resolution of AP
sites via the multiple-nucleotide patch replacement pathway | 35 | 83.33 |
| Zinc
transporters | 35 | 83.33 |
| Repair synthesis
for gap-filling by DNA polymerase in TC-NER | 35 | 83.33 |
|
E2F-enabled inhibition of
pre-replication complex formation | 35 | 83.33 |
| ER quality control
compartment | 35 | 83.33 |
| Cyclin B2 mediated
events | 35 | 83.33 |
| Synthesis of
DNA | 34 | 80.95 |
| RNA polymerase I
transcription | 34 | 80.95 |
| Activation of APC/C
and APC/CCdc20 mediated degradation of mitotic
proteins | 34 | 80.95 |
| DNA damage
bypass | 34 | 80.95 |
| Translesion
synthesis by Y family DNA polymerases bypasses lesions on DNA
template | 34 | 80.95 |
| E2F
mediated regulation of DNA replication | 34 | 80.95 |
| G0 and early
G1 | 34 | 80.95 |
| Synthesis and
interconversion of nucleotide di- and triphosphates | 34 | 80.95 |
| G1/S-specific
transcription | 34 | 80.95 |
| Phosphorylation of
the APC/C | 34 | 80.95 |
| Removal of the flap
intermediate | 34 | 80.95 |
| Chk1/Chk2(Cds1)
mediated inactivation of cyclin B/Cdk1 complex | 34 | 80.95 |
The gene composition of PLK mediated events had been
analyzed (Fig. 3), and CCNB1 was the
common gene. Its gene-level statistic value across different
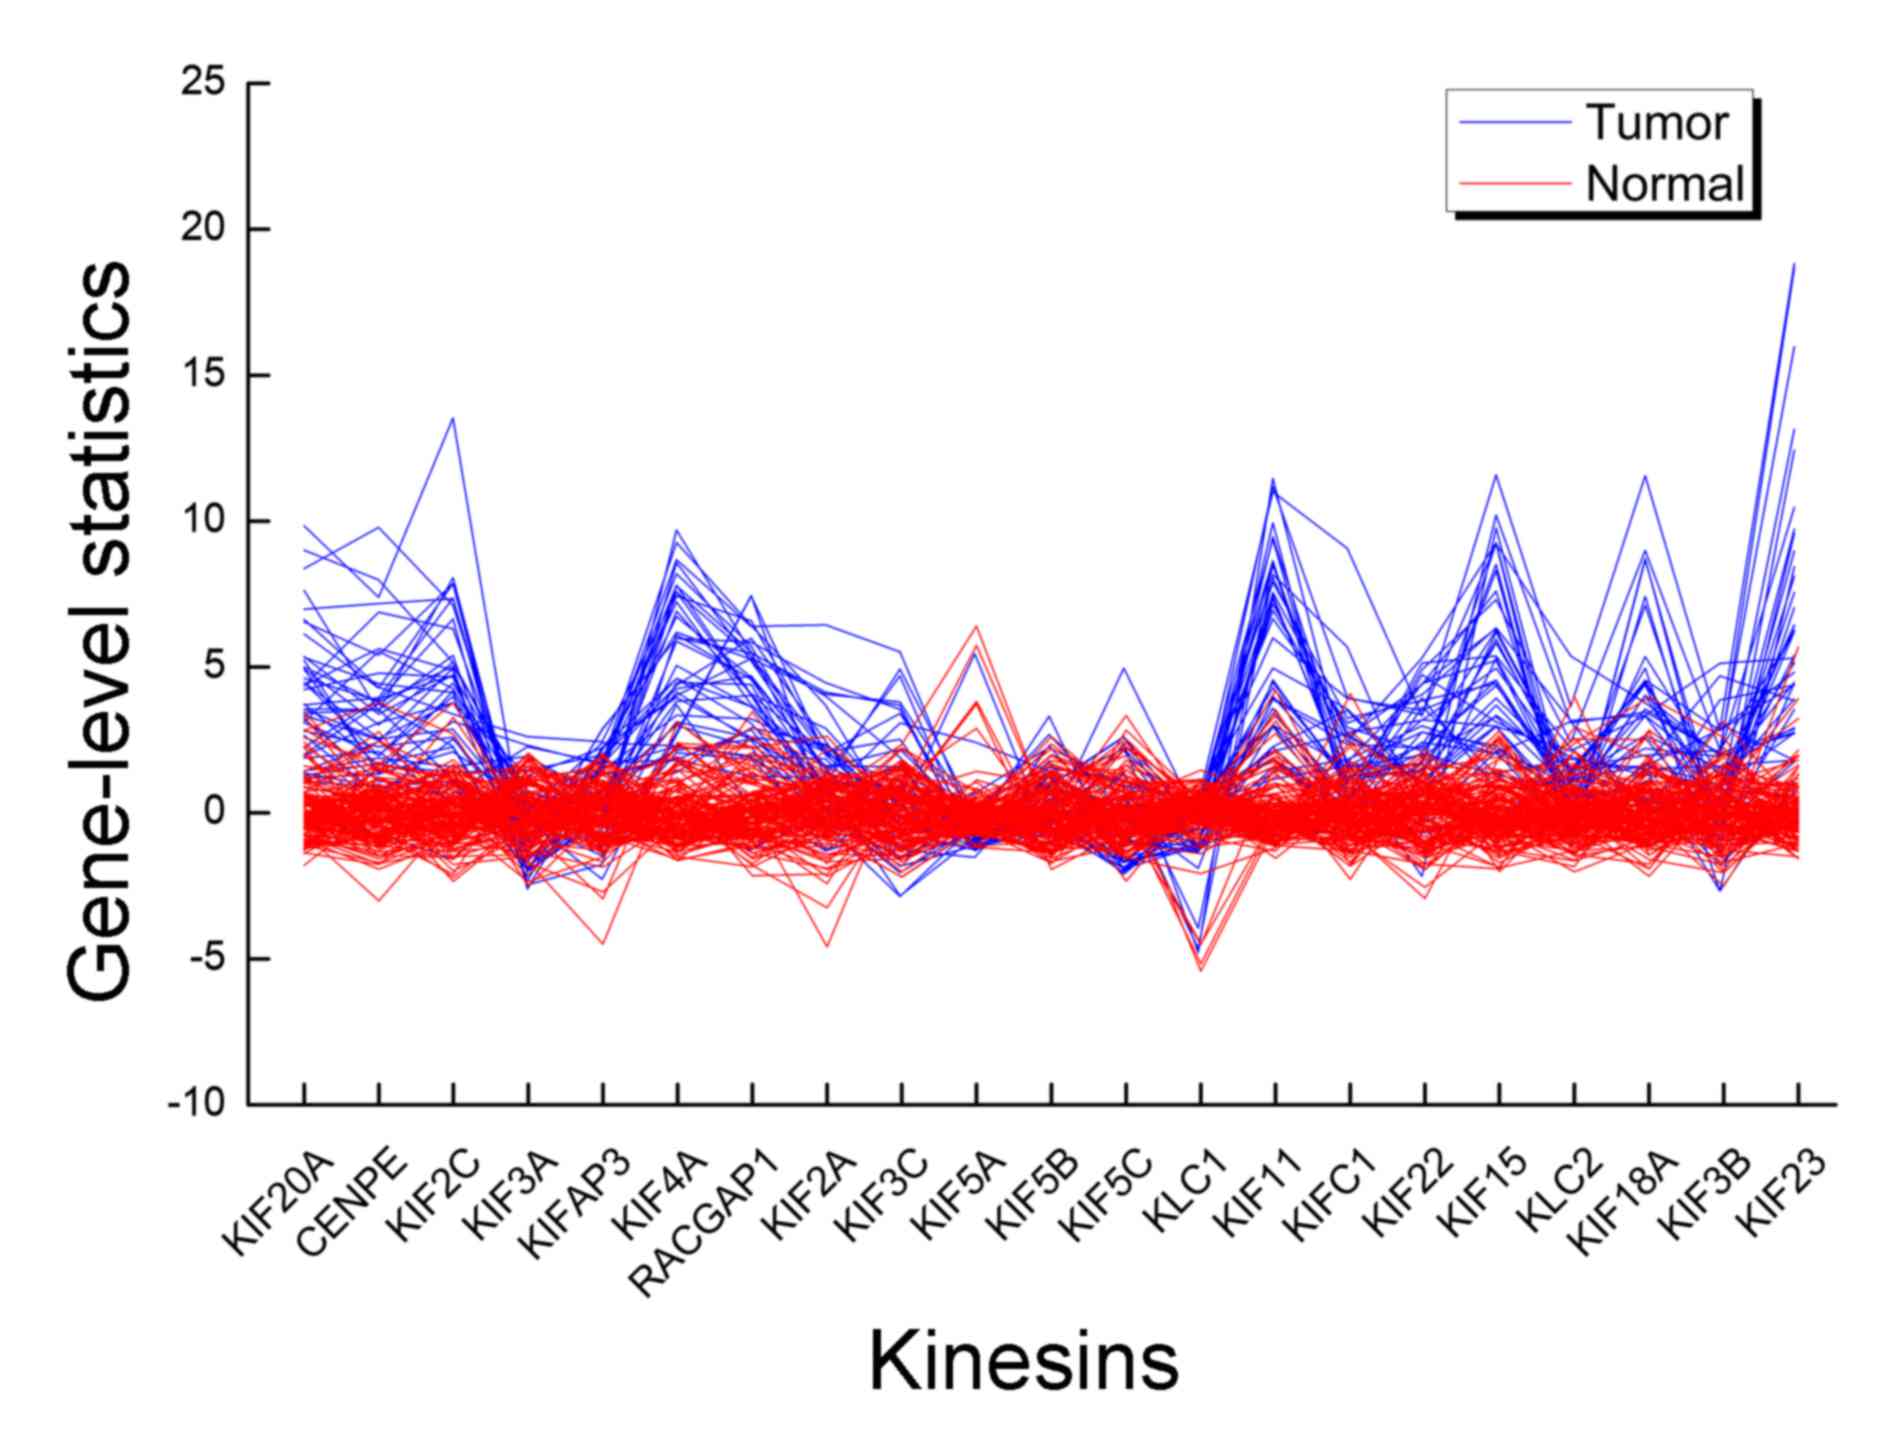
individual had clear differences. In KIFs, there were 21 genes,
KIF20A, centromere protein E (CENPE), KIF2C, KIF3A, KIFAP3, KIF4A,
rac GTPase activating protein 1 (RACGAP1), KIF2A, KIF3C, kinesin
light chain 1 (KLC1), KIF5A, kinesin light chain 2 (KLC2), KIF5B,
KIF5C, KIF11, KIFC1, KIF22, KIF15, KIF18A, KIF3B and KIF23, of
which KIF20A and KIF11 were common genes. The standardized gene
expression pattern for this pathway differed between tumor and
normal (Fig. 4). A number of the
genes deviated from the mean of the nRef and expression pattern of
a gene varied markedly between tumor and normal samples. For an
individual, different genes had their own gene-level
statistics.
Discussion
The present study identified altered pathways in
breast cancer using a new method (iPAS method combined with nRef),
and validated its feasibility based on the percentage of changed
pathways in breast cancer samples and comparison with KEGG
pathways. KEGG pathways and pathways with a changed percentage of
>50% were parts of the altered pathways, which indicated that
the iPAS method to identify altered pathways in breast cancer was
feasible. The present results indicated that a total of 688 altered
pathways were identified, such as KIF- and PLK-mediated events.
KIFs are a superfamily of microtubule-based motor
proteins that exhibit diverse functions in the intracellular
transportation of vesicles, organelles and chromosomes, the
regulation of microtubule dynamics (21), and of molecular motors engaged in key
cellular functions including cell division, mitosis and migration
(22,23). Previously, additional mitotic KIFs
have been validated as drug targets for cancer drug development
particularly for breast cancer, raising the possibility that the
range of KIF-based drug targets may expand in the future (24). De et al (25) demonstrated that the over expression of
KIF family member C3 (KIFC3), KIFC1, KIF1A, or
KIF5A to microtubules opposed the stabilizing effect of
docetaxel that prevented cytokinesis and led to apoptosis.
Similarly, the over expression of KIFC3, KIF5A, and
KIF12 were specific in mediating resistance to docetaxel and
not vincristine or doxorubicin. This overexpression of KIFC3,
KIF5A and KIF12 correlated with specific taxane
resistance in basal-like breast cancer; this ability was eliminated
by a mutation of the adenosine triphosphate (ATP)-binding domain of
a KIF (26). It had been identified
that ANCCA (ATPase family, AAA nuclear coregulator cancer
associated) is a key mediator of KIF family deregulation in breast
cancer and the crucial role of multiple KIFs in growth and survival
of the tumor cells (27).
Guerrero-Preston et al (28)
suggested that differential promoter methylation of KIF1A in
plasma was associated with breast cancer and DNA repair capacity. A
negative correlation was identified between KIF2A (KIF
family member 2A) expression levels in breast cancer and the
survival time of patients with breast cancer (29).
To additionally investigate functions of altered
pathways, gene composition based on gene-level statistics were
studied. A number of genes expressed deviated from the mean of the
nRef, and these fluctuations may cause an alteration between breast
cancer and normal controls. Among members of KIFs, KIF20A
(KIF family member 20A) and KIF11 (KIS family member 11)
were common genes between DEGs and pathway genes. For breast cancer
patients, FOXM1 regulated KIF20A expression to
modulate mitotic catastrophe caused by interferences in
paclitaxel-mediated cell death and senescence (30). KIF11 represented an attractive
anticancer target, and the inhibition of KIF11 caused
mitotic arrest and apoptosis of multiple cancers, for example,
breast cancer (31). Therefore, the
KIF members and KIFs pathway had significant effects on breast
cancer.
In the PLK mediated events pathway, PLK served a
dominant role. PLK family members are known to be functionally
involved in mitotic signaling, and in cytoskeletal reorganization
in normal and malignant cells (32,33). PLKs
are also a family of conserved serine/threonine kinases involved in
the regulation of cell cycle progression and in the activation of
cyclin-dependent kinase/cyclin complexes during the M-phase of the
cell cycle through G2 and mitosis (34). Previous studies reported that
PLK1 was a potential therapeutic option in combination with
conventional chemotherapy for the management of patients with
triple-negative breast cancer, and was overexpressed in tumors,
indicating its involvement in carcinogenesis (35–37). The
use of different PLK1 inhibitors has increased knowledge of
mitotic regulation and allowed the present study to assess their
ability to suppress tumor growth in vivo (38). The PLK2 and PLK3 acted
in concert with cyclin-dependent kinase 1-cyclin B1 and aurora
kinases to orchestrate a wide range of critical cell cycle events
(39). As for other members of PLKs,
there was evidence showing that PLK2 and PLK3 acted
as tumor suppressors through their functions in the p53 signaling
network, which guarded the cell against various stress signals
(40,41). It has been identified that there is a
significant association between elevated PLK1 and p53
mutation in women with breast cancer (42,43). It
has also been verified that PLK3 is a novel independent
prognostic marker in breast cancer, which alluded toward a role for
PLK overexpression in disease progression (44). Therefore, it could be inferred that
PLK mediated events correlate closely with breast cancer.
In conclusion, the iPAS method was suitable for
identifying altered pathways (such as KIF- and PLK-mediated
events), which may serve an important role in breast cancer
progression and are potentially novel predictive and prognostic
markers for breast cancer.
References
|
1
|
Müller A, Homey B, Soto H, Ge N, Catron D,
Buchanan ME, McClanahan T, Murphy E, Yuan W, Wagner SN, et al:
Involvement of chemokine receptors in breast cancer metastasis.
Nature. 410:50–56. 2001. View
Article : Google Scholar : PubMed/NCBI
|
|
2
|
DeSantis C, Ma J, Bryan L and Jemal A:
Breast cancer statistics, 2013. CA Cancer J Clin. 64:52–62. 2014.
View Article : Google Scholar : PubMed/NCBI
|
|
3
|
DeSantis C, Siegel R, Bandi P and Jemal A:
Breast cancer statistics, 2011. CA Cancer J Clin. 61:408–418. 2011.
View Article : Google Scholar
|
|
4
|
DiSipio T, Rye S, Newman B and Hayes S:
Incidence of unilateral arm lymphoedema after breast cancer: A
systematic review and meta-analysis. Lancet Oncol. 14:500–515.
2013. View Article : Google Scholar : PubMed/NCBI
|
|
5
|
Charif M, Lower EE, Kennedy D, Kumar H,
Khan S, Radhakrishnan N and Zhang X: Abstract P3-05-16: The effect
of HER-2/neu inhibition on prolonging clinical benefit with
fulvestrant treatment for metastatic estrogen receptor positive
breast cancer patients treated with trastuzumab. Cancer Res.
75:2015. View Article : Google Scholar
|
|
6
|
Mittendorf EA, Clifton GT, Holmes JP,
Clive KS, Patil R, Benavides LC, Gates JD, Sears AK, Stojadinovic
A, Ponniah S and Peoples GE: Clinical trial results of the
HER-2/neu (E75) vaccine to prevent breast cancer recurrence in
high-risk patients: From US Military Cancer Institute Clinical
Trials Group Study I-01 and I-02. Cancer. 118:2594–2602. 2012.
View Article : Google Scholar : PubMed/NCBI
|
|
7
|
Holder AM, Gonzalez-Angulo AM, Chen H,
Akcakanat A, Do KA, Symmans W Fraser, Pusztai L, Hortobagyi GN,
Mills GB and Meric-Bernstam F: Increased stearoyl-CoA desaturase 1
expression is associated with shorter survival in breast cancer
patients. Cancer Res. 137:319–327. 2013.
|
|
8
|
Glazko GV and Emmert-Streib F: Unite and
conquer: Univariate and multivariate approaches for finding
differentially expressed gene sets. Bioinformatics. 25:2348–2354.
2009. View Article : Google Scholar : PubMed/NCBI
|
|
9
|
Khatri P, Sirota M and Butte AJ: Ten years
of pathway analysis: Current approaches and outstanding challenges.
PLoS Comput Biol. 8:e10023752012. View Article : Google Scholar : PubMed/NCBI
|
|
10
|
Ahn T, Lee E, Huh N and Park T:
Personalized identification of altered pathways in cancer using
accumulated normal tissue data. Bioinformatics. 30:i422–i429. 2014.
View Article : Google Scholar : PubMed/NCBI
|
|
11
|
Chen DT, Nasir A, Culhane A, Venkataramu
C, Fulp W, Rubio R, Wang T, Agrawal D, McCarthy SM, Gruidl M, et
al: Proliferative genes dominate malignancy-risk gene signature in
histologically-normal breast tissue. Breast Cancer Res Treat.
119:335–346. 2010. View Article : Google Scholar : PubMed/NCBI
|
|
12
|
Croft D, O'Kelly G, Wu G, Haw R, Gillespie
M, Matthews L, Caudy M, Garapati P, Gopinath G, Jassal B, et al:
Reactome: A database of reactions, pathways and biological
processes. Nucleic Acids Res. 39(Database issue): D691–D697. 2011.
View Article : Google Scholar : PubMed/NCBI
|
|
13
|
Irizarry RA, Bolstad BM, Collin F, Cope
LM, Hobbs B and Speed TP: Summaries of Affymetrix GeneChip probe
level data. Nucleic Acids Res. 31:e152003. View Article : Google Scholar : PubMed/NCBI
|
|
14
|
Bolstad BM, Irizarry RA, Astrand M and
Speed TP: A comparison of normalization methods for high density
oligonucleotide array data based on variance and bias.
Bioinformatics. 19:185–193. 2003. View Article : Google Scholar : PubMed/NCBI
|
|
15
|
Bolstad B: Affy: Built-in Processing
Methods. 2013.
|
|
16
|
Gehan EA: A Generalized Wilcoxon test for
comparing arbitrarily singly-censored samples. Biometrika.
52:203–223. 1965. View
Article : Google Scholar : PubMed/NCBI
|
|
17
|
Mohammadi A, Saraee MH and Salehi M:
Identification of disease-causing genes using microarray data
mining and Gene Ontology. BMC Med Genomics. 4:122011. View Article : Google Scholar : PubMed/NCBI
|
|
18
|
Smyth GK: Linear models and empirical
bayes methods for assessing differential expression in microarray
experiments. Stat Appl Genet Mol Biol. 3:32004. View Article : Google Scholar
|
|
19
|
da W Huang, Sherman BT and Lempicki RA:
Systematic and integrative analysis of large gene lists using DAVID
bioinformatics resources. Nat Protoc. 4:44–57. 2008. View Article : Google Scholar
|
|
20
|
Wang X and Simon R: Microarray-based
cancer prediction using single genes. BMC Bioinformatics.
12:3912011. View Article : Google Scholar : PubMed/NCBI
|
|
21
|
Rath O and Kozielski F: Kinesins and
cancer. Nat Rev Cancer. 12:527–539. 2012. View Article : Google Scholar : PubMed/NCBI
|
|
22
|
Hirokawa N: Kinesin superfamily motor
proteins and intracellular transport. Nat Rev Mol Cell Biol.
10:682–696. 2009. View
Article : Google Scholar : PubMed/NCBI
|
|
23
|
Sharp DJ, Rogers GC and Scholey JM:
Microtubule motors in mitosis. Nature. 407:41–47. 2000. View Article : Google Scholar : PubMed/NCBI
|
|
24
|
Rath O and Kozielski F: Kinesins and
cancer. Nat Rev Cancer. 12:527–539. 2012. View Article : Google Scholar : PubMed/NCBI
|
|
25
|
De S, Cipriano R, Jackson MW and Stark GR:
Overexpression of kinesins mediates docetaxel resistance in breast
cancer cells. Cancer Res. 69:8035–8042. 2009. View Article : Google Scholar : PubMed/NCBI
|
|
26
|
Tan MH, De S, Bebek G, Orloff MS,
Wesolowski R, Downs-Kelly E, Budd GT, Stark GR and Eng C: Specific
kinesin expression profiles associated with taxane resistance in
basal-like breast cancer. Breast Cancer Res Treat. 131:849–858.
2012. View Article : Google Scholar : PubMed/NCBI
|
|
27
|
Zou JX, Duan Z, Wang J, Sokolov A, Xu J,
Chen CZ, Li JJ and Chen HW: Kinesin family deregulation coordinated
by bromodomain protein ANCCA and histone methyltransferase MLL for
breast cancer cell growth, survival, and tamoxifen resistance. Mol
Cancer Res. 12:539–549. 2014. View Article : Google Scholar : PubMed/NCBI
|
|
28
|
Guerrero-Preston R, Hadar T, Ostrow KL,
Soudry E, Echenique M, Ili-Gangas C, Pérez G, Perez J,
Brebi-Mieville P, Deschamps J, et al: Differential promoter
methylation of kinesin family member 1a in plasma is associated
with breast cancer and DNA repair capacity. Oncol Rep. 32:505–512.
2014.PubMed/NCBI
|
|
29
|
Wang J, Ma S, Ma R, Qu X, Liu W, Lv C,
Zhao S and Gong Y: KIF2A silencing inhibits the proliferation and
migration of breast cancer cells and correlates with unfavorable
prognosis in breast cancer. BMC Cancer. 14:4612014. View Article : Google Scholar : PubMed/NCBI
|
|
30
|
Khongkow P, Gomes A, Gong C, Man EP, Tsang
JW, Zhao F, Monteiro LJ, Coombes RC, Medema RH, Khoo US and Lam EW:
Paclitaxel targets FOXM1 to regulate KIF20A in mitotic catastrophe
and breast cancer paclitaxel resistance. Oncogene. 35:990–1002.
2016. View Article : Google Scholar : PubMed/NCBI
|
|
31
|
Valensin S, Ghiron C, Lamanna C, Kremer A,
Rossi M, Ferruzzi P, Nievo M and Bakker A: KIF11 inhibition for
glioblastoma treatment: Reason to hope or a struggle with the
brain? BMC Cancer. 9:1962009. View Article : Google Scholar : PubMed/NCBI
|
|
32
|
Sumara I, Vorlaufer E, Stukenberg PT, Kelm
O, Redemann N, Nigg EA and Peters JM: The dissociation of cohesin
from chromosomes in prophase is regulated by Polo-like kinase. Mol
Cell. 9:515–525. 2002. View Article : Google Scholar : PubMed/NCBI
|
|
33
|
Ha G, Kim H, Go H, Lee H, Seimiya H, Chung
DH and Lee CW: Tankyrase-1 function at telomeres and during mitosis
is regulated by Polo-like kinase-1-mediated phosphorylation. Cell
Death Differ. 19:321–332. 2012. View Article : Google Scholar : PubMed/NCBI
|
|
34
|
von Schubert C and Nigg EA: Polo-like
kinases. Current Biol. 23:R225–R227. 2013. View Article : Google Scholar
|
|
35
|
Spänkuch-Schmitt B, Bereiter-Hahn J,
Kaufmann M and Strebhardt K: Effect of RNA silencing of polo-like
kinase-1 (PLK1) on apoptosis and spindle formation in human cancer
cells. J Natl Cancer Inst. 94:1863–1877. 2002. View Article : Google Scholar : PubMed/NCBI
|
|
36
|
Maire V, Némati F, Richardson M,
Vincent-Salomon A, Tesson B, Rigaill G, Gravier E, Marty-Prouvost
B, De Koning L, Lang G, et al: Polo-like kinase 1: A potential
therapeutic option in combination with conventional chemotherapy
for the management of patients with triple-negative breast cancer.
Cancer Res. 3:813–823. 2013. View Article : Google Scholar
|
|
37
|
Wierer M, Verde G, Pisano P, Molina H,
Font-Mateu J, Di Croce L and Beato M: PLK1 signaling in breast
cancer cells cooperates with estrogen receptor-dependent gene
transcription. Cell Rep. 27:2021–2032. 2013. View Article : Google Scholar
|
|
38
|
Strebhardt K and Ullrich A: Targeting
polo-like kinase 1 for cancer therapy. Nat Rev Cancer. 6:321–330.
2006. View Article : Google Scholar : PubMed/NCBI
|
|
39
|
Strebhardt K: Multifaceted polo-like
kinases: Drug targets and antitargets for cancer therapy. Nat Rev
Drug Discov. 9:643–660. 2010. View Article : Google Scholar : PubMed/NCBI
|
|
40
|
Salvi M, Trashi E, Cozza G, Negro A,
Hanson PI and Pinna LA: Tools to discriminate between targets of
CK2 vs PLK2/PLK3 acidophilic kinases. Biotechniques.
53:2012.PubMed/NCBI
|
|
41
|
Salvi M, Trashi E, Cozza G, Franchin C,
Arrigoni G and Pinna L: Investigation on PLK2 and PLK3 substrate
recognition. Biochim Biophys Acta. 1824:1366–1373. 2012. View Article : Google Scholar : PubMed/NCBI
|
|
42
|
King SI, Purdie CA, Bray SE, Quinlan PR,
Jordan LB, Thompson AM and Meek DW: Immunohistochemical detection
of Polo-like kinase-1 (PLK1) in primary breast cancer is associated
with TP53 mutation and poor clinical outcom. Breast Cancer Res.
14:R402012. View Article : Google Scholar : PubMed/NCBI
|
|
43
|
Iyer RS, Nicol SM, Quinlan PR, Thompson
AM, Meek DW and Fuller-Pace FV: The RNA helicase/transcriptional
co-regulator, p68 (DDX5), stimulates expression of oncogenic
protein kinase, Polo-like kinase-1 (PLK1), and is associated with
elevated PLK1 levels in human breast cancers. Cell Cycle.
13:1413–1423. 2014. View Article : Google Scholar : PubMed/NCBI
|
|
44
|
Weichert W, Kristiansen G, Winzer KJ,
Schmidt M, Gekeler V, Noske A, Müller BM, Niesporek S, Dietel M and
Denkert C: Polo-like kinase isoforms in breast cancer: Expression
patterns and prognostic implications. Virchows Archiv. 446:442–450.
2005. View Article : Google Scholar : PubMed/NCBI
|