Introduction
Acute lymphoblastic leukemia (ALL) is the most
frequent hematologic malignancy in pediatric patients, and ALL
develops due to a combination of genetic susceptibility and
environmental exposure in fetal life and infancy (1). In the United States, the incidence rate
(age-adjusted) was reported to be 4.9 per 100,000 children from
2007 to 2011 (2). Despite
advancements in the management of pediatric ALL (B-cell and T-cell
ALL), that have occurred, the incidence of the disease has
exhibited an increasing trend (3).
Post-transplant relapse remains the primary causative factor for
treatment failure in 30% of patients with ALL (4). The disease relapse may be due to the
chemotherapy resistance of leukemic cells following the initial
treatment in the majority of these patients (5). Therefore, there is a requirement for
novel effective therapeutic methods for the treatment of ALL.
Gene expression microarrays have emerged as an
effective technique for identifying differentially expressed genes
(DEGs) in a comprehensive approach. Previously, by using higher
density oligonucleotide arrays, ~60% of the newly identified
subtypes of discriminating genes were recognized as novel markers
(6). Additionally, 54 genes were
identified with distinguished resistance from sensitive ALL samples
by comparing gene expression signatures of pediatric ALL tissue
samples with or without high minimal residual disease (MRD) load
(7). Additionally, a number of genes
(protein products) were identified with increased expression levels
(1.5–5.8 fold) in leukemic cells compared with control samples,
including cluster of differentiation (CD)58 and human DNAJ protein
(HDJ)-2 (8). These previous studies
demonstrated that a large cohort of DEGs may be involved in the
progression of ALL. Small molecule drugs have been identified as
potential inhibitors of ALL, including imatinib, an Abelson
tyrosine-protein kinase 1 inhibitor (9). Additionally, borrelidin was established
as a potent agent inhibiting the cell proliferation in ALL cell
lines via the induction of apoptosis and the regulation of G1
arrest (10). A previous study which
established the Gene Expression Omnibus (GEO) DataSet gene
expression array GSE42221 identified that the epigenetic and
transcriptional regulation of zinc finger protein
(ZNF)423 was associated with B-cell differentiation
in ALL (11,12). However, the study focused on the
causative role of the gene ZNF423 in ALL. Associated genes
and their potential interactions, as well as small molecule drugs,
were not considered in Harder et al (11).
Therefore, the current study re-analyzed the
published expression profiles (11)
and consequently identified DEGs in pediatric B-cell ALL.
Additionally, functional enrichment analysis of DEGs was performed
to investigate the dysregulated biological processes using the
altered DEGs in the progression of the disease. In addition, the
protein-protein interactions (PPIs) of the DEGs were screened and
small molecular drugs associated with DEGs were analyzed using a
number of bioinformatic methods. All these analyses were aimed to
provide effective and novel therapeutic methods for the management
of pediatric ALL.
Materials and methods
Data source
Gene expression data with the accession number of
GSE42221, which was deposited by Harder et al (11) in the public National Center for
Biotechnology Information GEO database, were downloaded. The
dataset consisted of 7 primary human B-precursor samples (ALL
samples) and 4 normal B-cell progenitor lymphoblast samples
(control samples). For paired expression analysis (pairs, n=4),
single primary leukemic cells and normal lymphoblasts were isolated
from the same patients with pediatric ALL. The platform was GPL96
(HG-U133A) using the Affymetrix Human Genome U133A Array
(Affymetrix Inc., Santa Clara, California, USA). The annotation of
the probes from Affymetrix, including all information of Affymetrix
ATH1 chip (25K array) was downloaded, as well as the primary
files.
Data preprocessing and differential
analysis
According to the annotation platform, a cohort of
22,283 probes was mapped to the corresponding genes. For each gene,
the average value of multiple probes corresponding to a single gene
was calculated to obtain gene expression value, which was then
transformed into log2 ratio (13).
Consequently, a total of 20,967 gene expression levels were
obtained. DEGs were screened for each sample using Linear Models
for Microarray Analysis (limma) package of R language (http://www.bioconductor.org/packages/release/bioc/html/limma.html)
(14), in which the Benjamini and
Hochberg method was applied for multiple testing correction
(15). False discovery rate <0.05
and |log fold change >1 were set as the threshold values for DEG
selection.
Clustering analysis of DEGs
Biclustering analysis of gene expression data
directly identified whether the DEGs that were screened had
specificity for the samples (16,17). In
the present study, pheatmap package of R language (http://cran.r-project.org/web/packages/pheatmap/index.html)
was used for biclustering analysis of DEGs on the basis of
Euclidean distance method (18).
Functional enrichment analysis of
DEGs
Database for annotation, visualization, and
integrated discovery (DAVID; http://david.abcc.ncifcrf.gov/) provided a set of
data-mining tools that systematically combined functionally
descriptive data with intuitive graphical displays (19). Therefore, DAVID tool was used for the
Gene Ontology (GO) functional enrichment analysis of upregulated
and downregulated DEGs, based on hypergeometric distribution
algorithm. P<0.05 was considered to indicate a statistically
significant difference.
Interaction analysis of DEGs
To investigate the association between DEGs at the
protein level, the Search Tool for the Retrieval of Interacting
Genes (String, version 9.1; http://string-db.org/) (20) was used to screen the PPIs with the
threshold of combined score >0.4.
Screening of small-molecule drugs
The upregulated and downregulated DEGs were mapped
onto the connectivity map (CMAP) database to obtain the
small-molecule drugs targeting the selected DEGs with the criterion
of correlation score >0.8 (21).
Thereafter, combined with the PPI information, an integrated
network between DEGs and small molecular drugs was constructed,
which was visualized using the Cytoscape software (version 3.2.1,
http://cytoscape.org/) (22).
Results
Screened DEGs between ALL samples and
control samples
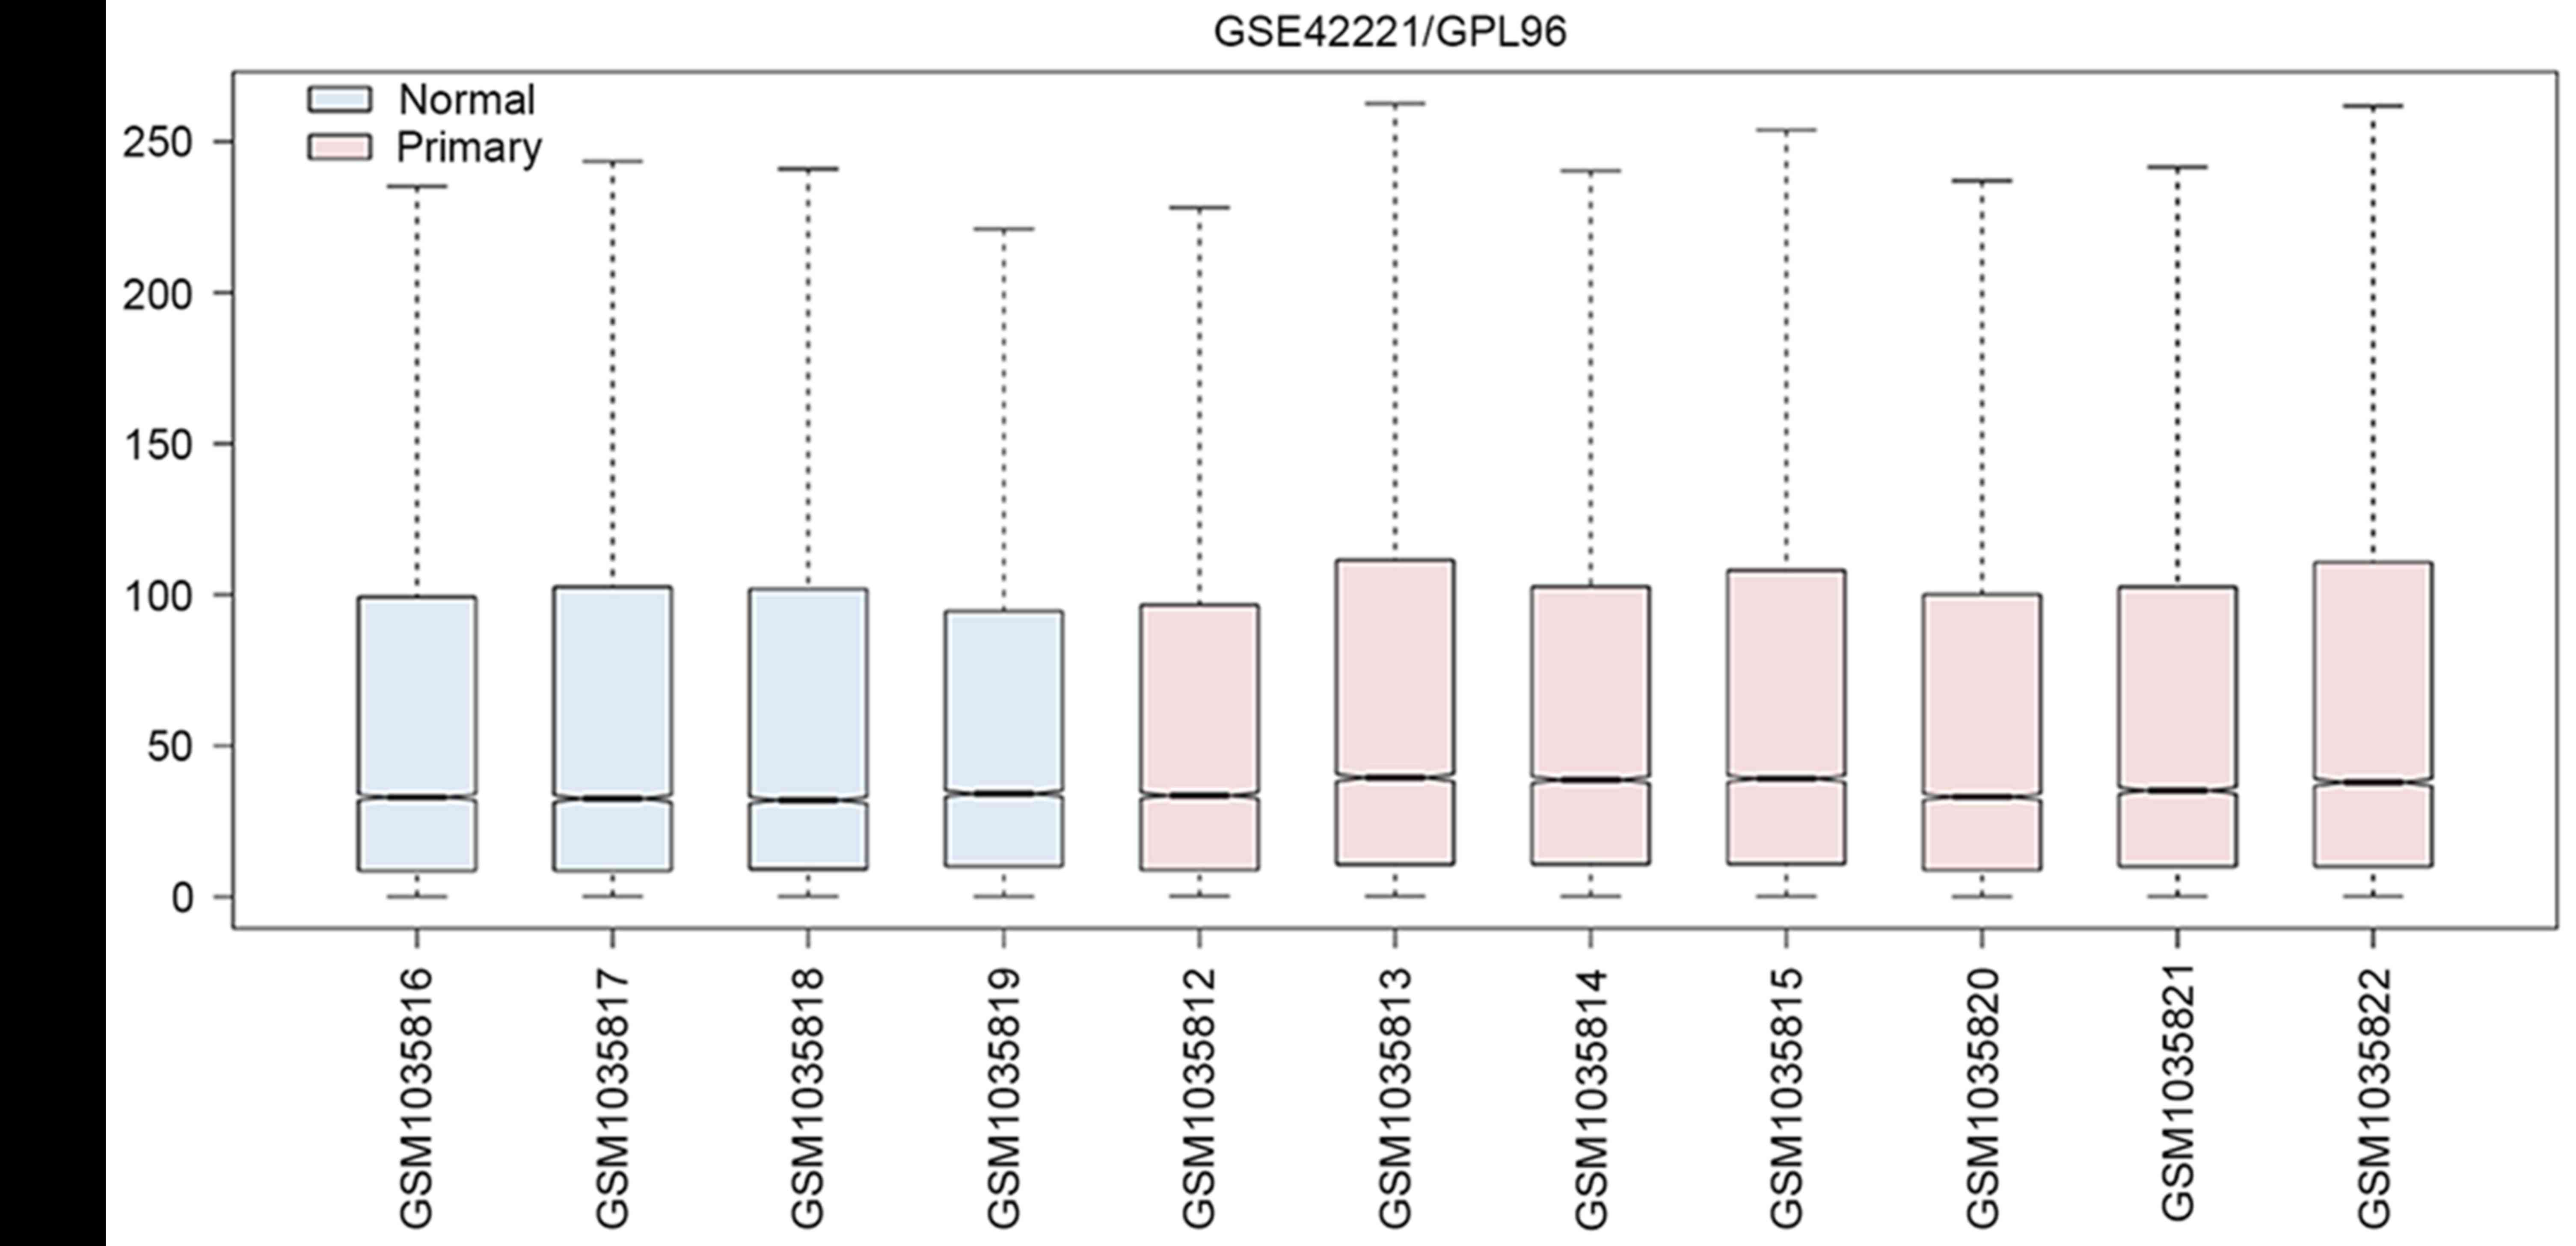
Following the preprocessing and normalization for
gene expression profile data, the medians of the ALL samples were
similar (Fig. 1), indicating the
validity of these results for the subsequent analysis. Based on the
aforementioned criteria, a set of 116 genes was identified as DEGs
consisting of 56 downregulated and 60 upregulated genes.
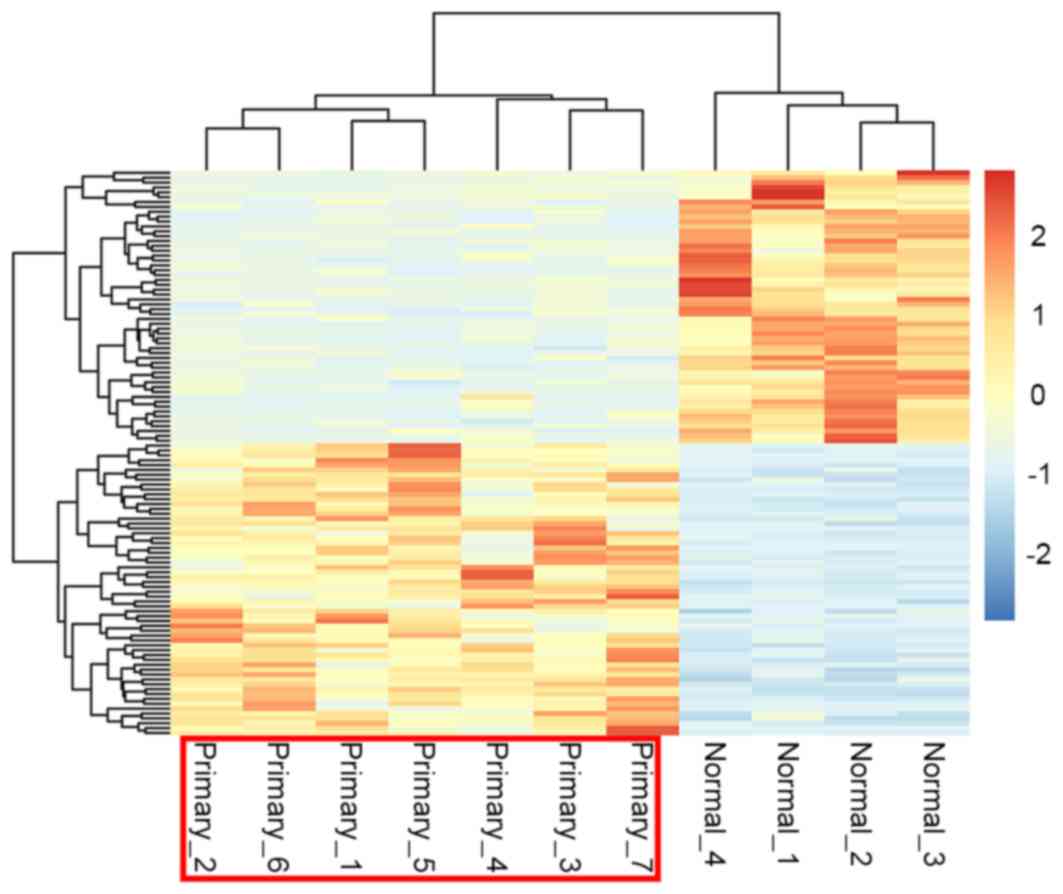
Clustering analysis of the DEGs
Using the pheatmap package of R language, the
cluster heat map of the DEG expression was presented in Fig. 2. By performing biclustering analysis,
it was identified that gene expression in pediatric ALL samples and
control samples were distinct from each other suggesting that the
DEGs that were selected were significant and reliable for
distinguishing diseased and control samples.
Altered functions of the DEGs
The upregulated and downregulated DEGs were imported
to the DAVID database to perform functional enrichment analysis.
Accordingly, upregulated DEGs were established to be significantly
enriched in GO functionality, including ‘mesenchymal cell
differentiation’, ‘mesenchymal cell’ and ‘mesenchymal development’
The upregulated DEGs included bone marrow morphogenetic protein 2
(BMP2), semaphoring 3F (SEMA3F) and ephrin B1
(EFNB1) (Table I). By
contrast, the downregulated DEGs were associated with the terms
‘cell cycle phase’, ‘cell cycle process’ and ‘cell cycle’. The
downregulated genes included marker of proliferation Ki-67
(MIK67), cyclin F (CCNF) and nucleolar and spindle
associated protein (NUSAP1) (Table II).
 | Table I.Significantly enriched Gene Ontology
terms of upregulated genes. |
Table I.
Significantly enriched Gene Ontology
terms of upregulated genes.
| Gene ontology
term | Count | P-value | Genes |
|---|
| 0048762~mesenchymal
cell differentiation | 3 |
1.35×10⁻² | BMP2, SEMA3F,
EFNB1 |
| 0014031~mesenchymal
cell development | 3 |
1.35×10⁻² | BMP2, SEMA3F,
EFNB1 |
| 0060485~mesenchyme
development | 3 |
1.40×10⁻² | BMP2, SEMA3F,
EFNB1 |
| 0045765~regulation
of angiogenesis | 3 |
2.02×10⁻² | HHEX, NPR1,
EPHB4 |
| 0000902~cell
morphogenesis | 5 |
3.46×10⁻² | BMP2, LST1,
EFNB1, L1CAM, POU4F1 |
| 0006469~negative
regulation of protein kinase activity | 3 |
3.67×10⁻² | SH3BP5, SPRY1,
DUSP6 |
| 0033673~negative
regulation of kinase activity | 3 |
3.90×10⁻² | SH3BP5, SPRY1,
DUSP6 |
| 0051348~negative
regulation of transferase activity | 3 |
4.38×10⁻² | SH3BP5, SPRY1,
DUSP6 |
| 0032989~cellular
component morphogenesis | 5 |
4.84×10⁻² | BMP2, LST1,
EFNB1, L1CAM, POU4F1 |
| Table II.Significantly enriched Gene Ontology
terms of downregulated genes. |
Table II.
Significantly enriched Gene Ontology
terms of downregulated genes.
| Gene ontology
term | Count | P-value | Genes |
|---|
| 0022403~cell cycle
phase | 17 |
1.31×10⁻¹⁰ | CCNF, MKI67,
CENPE, NUSAP1, CDC20 |
| 0022402~cell cycle
process | 18 |
1.06×10⁻⁹ | MKI67, CCNF,
NUSAP1, ESPL1, CENPE |
| 0007049~cell
cycle | 20 |
1.18×10⁻⁹ | MKI67, CCNF,
NUSAP1, CDC20, CENPE |
| 0000279~M
phase | 15 |
1.78×10⁻⁹ | KIF11, MKI67,
CCNF, NUSAP1, CDC20 |
| 0000280~nuclear
division | 13 |
5.26×10⁻⁹ | KIF11, CCNF,
NUSAP1, CENPE, CDC20 |
|
0007067~mitosis | 13 |
5.26×10⁻⁹ | KIF11, CCNF,
NUSAP1, CENPE, CDC20 |
| 0000087~M phase of
mitotic cell cycle | 13 |
6.51×10⁻⁹ | KIF11, CCNF,
NUSAP1, CENPE, CDC20 |
| 0048285~organelle
fission | 13 |
8.44×10⁻⁹ | KIF11, CCNF,
NUSAP1, CENPE, CDC20 |
| 0000278~mitotic
cell cycle | 15 |
8.72×10⁻⁹ | KIF11, CCNF,
NUSAP1, CDC20, CENPE |
| 0051301~cell
division | 13 |
1.63×10⁻⁷ | KIF11, CCNF,
NUSAP1, CENPE, CDC20 |
| 0007059~chromosome
segregation | 6 |
9.05×10⁻³ | SPC25, NUSAP1,
BIRC5, CENPE, ESPL1, PTTG1 |
| 0000226~microtubule
cytoskeleton organization | 7 |
1.16×10⁻² | SPC25, CAV1,
KIF11, NUSAP1, ESPL1, UBE2C, TACC3 |
| 0007051~spindle
organization | 5 |
2.05×10⁻² | SPC25, KIF11,
ESPL1, UBE2C, TACC3 |
|
0007017~microtubule-based process | 8 |
2.43×10⁻² | SPC25, CAV1,
KIF11, NUSAP1, CENPE, ESPL1, UBE2C, TACC3 |
Integrated network between
small-molecule drugs and targeted DEGs
Following the mapping of DEGs into the String
database, a subset of 169 PPIs were identified. In addition, the
upregulated and downregulated genes were mapped onto the CMAP
database to identify a list of small-molecule drugs that meet the
predefined criterion (Table III).
Quinostatin and carbimazole achieved high enrichment scores of
0.904 and −0.859, respectively. These findings suggest that theses
drugs were associated with ALL and may be potentially effective for
the treatment of pediatric ALL.
| Table III.Small molecular drugs significantly
associated with differentially expressed genes. |
Table III.
Small molecular drugs significantly
associated with differentially expressed genes.
| Cmap name | Enrichment
score | P-value |
|---|
| Carbimazole | −0.859 | 0.00561 |
| Nadolol | −0.854 | 0.00084 |
| Prestwick-691 | −0.845 | 0.00741 |
|
Trihexyphenidyl | −0.829 | 0.01002 |
| Pargyline |
0.833 | 0.00115 |
| Blebbistatin |
0.858 | 0.04094 |
| Quinostatin |
0.904 | 0.01889 |
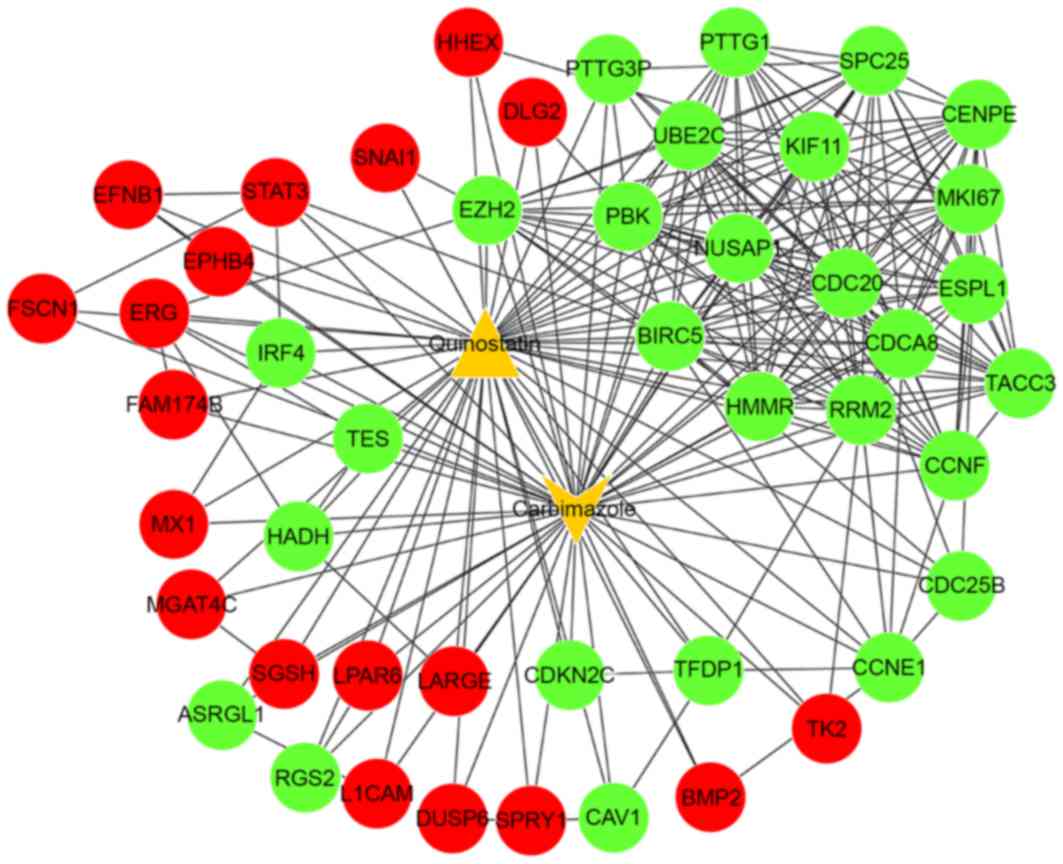
Combining the PPIs with the DEGs and small-molecule
drugs, an integrated network was constructed between associated
DEGs and the small-molecule drugs (carbimazole and quinostatin) and
associated DEGs (Fig. 3). In this
integrated network, the target genes of carbimazole and quinostatin
were predicted, including signal transducer and activator of
transcription 3 (STAT3), nucleolar and spindle associated
protein 1 (NUSAP1) and cell division cycle 20
(CDC20).
Discussion
In the present study, 116 DEGs were identified in
pediatric ALL based on gene expression profile data, including 56
downregulated and 60 upregulated genes. Functional enrichment
analysis demonstrated that upregulated DEGs, including BMP2,
SEMA3F and EFNB1, were significantly associated with
mesenchymal cell differentiation and development processes, whilst
downregulated DEGs, including MKI67, CCNF and
NUSAP1, were enriched for cell cycle processes.
In a previous study, mesenchymal cells were
demonstrated to regulate the response of ALL cells to asparaginase,
which is a major component of ALL therapy (23). Additionally, the differentially
methylated genes between the two leukemia subgroups
(CEBPAsil and normal CD34+ bone marrow
cells) were also associated with the GO term mesenchymal cell
development (24), suggesting that
mesenchymal cell differentiation and development may have important
roles in regulating ALL. BMP2 was reported to be associated
with the cardiac cushion epithelial-mesenchymal transition and the
initiation of chondrogenic lineage development of mesenchymal stem
cells (25,26). In T-cell ALL, BMP2 was
established to be an important regulator by acting upstream of the
NOTCH1 signaling pathway (27). The
SEMA3F encoded protein is primarily involved in signaling
transduction. It has also been demonstrated that SEMA3F is
expressed in T-cell ALL, and it also functions in T-cell ALL
(28). EFNB1 is another gene
expressed in pediatric T-cell ALL (29). Although T-cell and B-cell
leukomonocytes mature in the thymus and bone marrow, respectively,
immune responses are implicated in both T-cell and B-cell ALL
(30,31). Therefore, the regulation of these
genes in B-cell ALL may be similar with the gene regulation in
T-cell ALL. Considering that the 3 upregulated genes in ALL samples
were significantly enriched in the mesenchymal development process,
it may be inferred that these genes are involved in the mesenchymal
development process during pediatric B-cell ALL progression.
However, the downregulated genes, including
MKI67, NUSAP1 and CCNF, were significantly
associated with the cell cycle. Cell cycle (including G0/G1 arrest)
is a process, which is typically dysregulated in ALL, (32). ALL is a result of the clonal expansion
of hematopoietic progenitors that have undergone malignant
transformation at distinct stages of differentiation (33). The B-cell lineage ALL is derived from
B cell precursors. The Ikaros-mediated cell cycle was
determined as the endpoint in the tumor suppression pathway that
was modulated by the pre-B cell receptor (34). Aberrations of genes that are involved
in cell cycle control, including the cytokine receptor-like factor
2 gene, have been implicated in the progression and relapse of
B-cell ALL (35). The majority of
cell cycle genes were deregulated in the Bruton tyrosine kinase
(BTK)C481S mantle cell lymphoma (MCL)
cells, especially the expression of MKI67 was remarkably
decreased in the bone marrow at the point of relapse (36). A previous study demonstrated that
microRNA-519d is a tumor suppressor that targets MKI67 in
the hepatocellular carcinoma cell line (37), which may account for the
downregulation of MKI67. NUSAP1 is a protein that is key for
spindle movement (38). MRD is
considered to be an important predictor of relapse in ALL (39), and reduced expression of NUSAP1
was identified in patients with MRD (40), which is consistent with the finding of
downregulated NUSAP1 in the current study. CCNF
encodes a member of the cyclin family that serves important roles
in cell cycle transitions (41). The
downregulation of CCNF was also established in B-cell ALL
(42). NUSAP1 and CCNF
were associated with altered cell cycle in acute myeloid leukemia
(43), therefore providing further
evidence of the role of the two genes in cell cycle modulation.
These results collectively suggest that the 3 genes (MKI67,
NUSAP1 and CCNF) mediate cell cycle processes and may
have regulatory roles in the B-cell ALL progression.
The present study also identified a number of
important small molecule drugs, including quinostatin and
carbimazole. NOTCH1 is a member of the Notch family that has vital
roles in a number of cellular processes. The activation of NOTCH1
signaling promotes important functions in the pathogenesis of
T-cell ALL (44). NOTCH1 inhibits
cell apoptosis via the transcriptional suppressor, hairy and
enhancer of split 1 (HES1)-mediated repression downstream of NOTCH
signaling in T-cell ALL (45). The
small molecule perhexiline was identified as a HES1 modulator drug
with potent anti-leukemic effects (45). Notably based on the information in
CMAP, quinostatin was identified as another important small
molecule drug that may target HES1 with a high enrichment score
(0.983) (45), suggesting a potential
inhibitory role of quinostatin in ALL. Additionally, quinostatin
was reported to potently inhibit the mammalian target of rapamycin
signaling network by directly targeting lipid-kinase activity
(46). Combining these findings with
the results of the present study that quinostatin was associated
with DEGs (enrichment score, 0.904), quinostatin may be a potential
therapeutic drug for treating ALL. However, further experimental
validations are required to confirm this prediction.
Carbimazole has been widely used in the treatment of
ALL (47,48). In the present study, it was
demonstrated that quinostatin and carbimazole share a number of
common target genes, including STAT3, NUSAP1 and
CDC20. Excluding the aforementioned functions, STAT3
was revealed to mediate an oncogenic association with two
characterized transcription factors, Ets-related protein Tel1
(TEL) and Runt related transcription factor 1 (AML1),
in t(12;21) translocation, which has been reported to be the most
frequent chromosomal abnormality in pediatric leukemia (49). NUSAP is an important mitotic
regulator, and the activity of NUSAP is vital for a number
of cellular processes during mitosis (50). CDC20, as a mitotic
complex/cyclosome activator, directly interacts with
anaphase-promoting complex, which leads to the promotion of onset
of anaphase and mitotic exit via the ubiquitination of securin and
cyclin B1 (51,52). Taken together, it may be hypothesized
that the two small molecule drugs, particularly quinostatin, may be
an effective agent for the management of ALL, as it targets
STAT3, NUSAP1 and CDC20 genes. However,
further experiments are required to validate these targets.
Although the current study performed a comprehensive bioinformatics
analysis, it should be noted that the data were derived from a
previously published study with a small sample size, and the
present study did not consider the subgroups of ALL. All the
conclusions of the current study require further experimental
validation.
In conclusion, by using a bioinformatic methodology,
the current study identified that the dysregulated biological
processes (including mesenchymal cell differentiation and
development) that were mediated by the upregulated genes and the
cell cycle processes that were mediated by downregulated genes may
have significant roles in the pathogenesis and prognosis of
pediatric B-cell ALL. In addition, quinostatin may be a potent
novel agent for the management of pediatric B-cell ALL as it
targets a large number of DEGs, including STAT3,
NUSAP1 and CDC20. However, the results obtained in
the present study require further validation.
References
|
1
|
Krajinovic M, Lamothe S, Labuda D,
Lemieux-Blanchard E, Theoret Y, Moghrabi A and Sinnett D: Role of
MTHFR genetic polymorphisms in the susceptibility to childhood
acute lymphoblastic leukemia. Blood. 103:252–257. 2004. View Article : Google Scholar : PubMed/NCBI
|
|
2
|
Howlader N, Noone A, Krapcho M, et al:
SEER Cancer Statistics Review, 1975–2011. Bethesda, MD: National
Cancer Institute. Journal; 2014
|
|
3
|
Barrington-Trimis JL, Cockburn M, Metayer
C, Gauderman WJ, Wiemels J and McKean-Cowdin R: Rising rates of
acute lymphoblastic leukemia in Hispanic children: Trends in
incidence from 1992 to 2011. Blood. 125:3033–3034. 2015. View Article : Google Scholar : PubMed/NCBI
|
|
4
|
Martelli MF, Di Ianni M, Ruggeri L,
Falzetti F, Carotti A, Terenzi A, Pierini A, Massei MS, Amico L,
Urbani E, et al: HLA-haploidentical transplantation with regulatory
and conventional T-cell adoptive immunotherapy prevents acute
leukemia relapse. Blood. 124:638–644. 2014. View Article : Google Scholar : PubMed/NCBI
|
|
5
|
Coustan-Smith E, Song G, Clark C, Key L,
Liu P, Mehrpooya M, Stow P, Su X, Shurtleff S, Pui CH, et al: New
markers for minimal residual disease detection in acute
lymphoblastic leukemia. Blood. 117:6267–6276. 2011. View Article : Google Scholar : PubMed/NCBI
|
|
6
|
Ross ME, Zhou X, Song G, Shurtleff SA,
Girtman K, Williams WK, Liu HC, Mahfouz R, Raimondi SC, Lenny N, et
al: Classification of pediatric acute lymphoblastic leukemia by
gene expression profiling. Blood. 102:2951–2959. 2003. View Article : Google Scholar : PubMed/NCBI
|
|
7
|
Cario G, Stanulla M, Fine BM, Teuffel O,
Neuhoff NV, Schrauder A, Flohr T, Schäfer BW, Bartram CR, Welte K,
et al: Distinct gene expression profiles determine molecular
treatment response in childhood acute lymphoblastic leukemia.
Blood. 105:821–826. 2005. View Article : Google Scholar : PubMed/NCBI
|
|
8
|
Chen JS, Coustan-Smith E, Suzuki T, Neale
GA, Mihara K, Pui CH and Campana D: Identification of novel markers
for monitoring minimal residual disease in acute lymphoblastic
leukemia. Blood. 97:2115–2120. 2001. View Article : Google Scholar : PubMed/NCBI
|
|
9
|
Wei MC and Cleary ML: Novel methods and
approaches to acute lymphoblastic leukemia drug discovery. Expert
Opin Drug Discov. 9:1435–1446. 2014. View Article : Google Scholar : PubMed/NCBI
|
|
10
|
Habibi D, Ogloff N, Jalili RB, Yost A,
Weng AP, Ghahary A and Ong CJ: Borrelidin, a small molecule
nitrile-containing macrolide inhibitor of threonyl-tRNA synthetase,
is a potent inducer of apoptosis in acute lymphoblastic leukemia.
Invest New Drugs. 30:1361–1370. 2012. View Article : Google Scholar : PubMed/NCBI
|
|
11
|
Harder L, Eschenburg G, Zech A,
Kriebitzsch N, Otto B, Streichert T, Behlich AS, Dierck K, Klingler
B, Hansen A, et al: Aberrant ZNF423 impedes B cell differentiation
and is linked to adverse outcome of ETV6-RUNX1 negative B precursor
acute lymphoblastic leukemia. J Exp Med. 210:2289–2304. 2013.
View Article : Google Scholar : PubMed/NCBI
|
|
12
|
Harder L, Otto B and Horstmann MA:
Transcriptional dysregulation of the multifunctional zinc finger
factor 423 in acute lymphoblastic leukemia of childhood. Genomics
Data. 2:96–98. 2014. View Article : Google Scholar : PubMed/NCBI
|
|
13
|
Fujita A, Sato JR, Lde O Rodrigues,
Ferreira CE and Sogayar MC: Evaluating different methods of
microarray data normalization. BMC Bioinformatics. 7:4692006.
View Article : Google Scholar : PubMed/NCBI
|
|
14
|
Smyth GK: Limma: Linear models for
microarray dataBioinformatics and computational biology solutions
using R and Bioconductor. Springer; pp. 397–420. 2005, View Article : Google Scholar
|
|
15
|
Benjamini Y and Hochberg Y: Controlling
the false discovery rate: A practical and powerful approach to
multiple testing. J Royal Statistical Soc Series B
(Methodological). 57:289–300. 1995.
|
|
16
|
Szekely GJ and Rizzo ML: Hierarchical
clustering via joint between-within distances: Extending Ward's
minimum variance method. J Classification. 22:151–183. 2005.
View Article : Google Scholar
|
|
17
|
Press WH, Teukolsky SA, Vetterling WT and
Flannery BP: Hierarchical Clustering by Phylogenetic Trees. Section
16.4Numerical Recipes: The Art of Scientific Computing. 3rd.
Cambridge University Press; New York, NY: 2007
|
|
18
|
Deza MM and Deza E: Encyclopedia of
distances. Springer; Heidelberg: pp. 1–583. 2009, View Article : Google Scholar
|
|
19
|
Dennis G Jr, Sherman BT, Hosack DA, Yang
J, Gao W, Lane HC and Lempicki RA: DAVID: Database for annotation,
visualization, and integrated discovery. Genome Biol. 4:P32003.
View Article : Google Scholar : PubMed/NCBI
|
|
20
|
Szklarczyk D, Franceschini A, Kuhn M,
Simonovic M, Roth A, Minguez P, Doerks T, Stark M, Muller J, Bork
P, et al: The STRING database in 2011: Functional interaction
networks of proteins, globally integrated and scored. Nucleic Acids
Res. 39(Database issue): D561–D568. 2011. View Article : Google Scholar : PubMed/NCBI
|
|
21
|
Evan GI and Vousden KH: Proliferation,
cell cycle and apoptosis in cancer. Nature. 411:342–348. 2001.
View Article : Google Scholar : PubMed/NCBI
|
|
22
|
Kohl M, Wiese S and Warscheid B:
Cytoscape: Software for visualization and analysis of biological
networksData Mining in Proteomics. Springer; pp. 291–303. 2011
|
|
23
|
Iwamoto S, Mihara K, Downing JR, Pui CH
and Campana D: Mesenchymal cells regulate the response of acute
lymphoblastic leukemia cells to asparaginase. J Clin Invest.
117:1049–1057. 2007. View
Article : Google Scholar : PubMed/NCBI
|
|
24
|
Figueroa ME, Wouters BJ, Skrabanek L,
Glass J, Li Y, Erpelinck-Verschueren CA, Langerak AW, Löwenberg B,
Fazzari M, Greally JM, et al: Genome wide epigenetic analysis
delineates a biologically distinct immature acute leukemia with
myeloid/T-lymphoid features. Blood. 113:2795–27804. 2009.
View Article : Google Scholar : PubMed/NCBI
|
|
25
|
Ma L, Lu MF, Schwartz RJ and Martin JF:
Bmp2 is essential for cardiac cushion epithelial-mesenchymal
transition and myocardial patterning. Development. 132:5601–5611.
2005. View Article : Google Scholar : PubMed/NCBI
|
|
26
|
Schmitt B, Ringe J, Häupl T, Notter M,
Manz R, Burmester GR, Sittinger M and Kaps C: BMP2 initiates
chondrogenic lineage development of adult human mesenchymal stem
cells in high-density culture. Differentiation. 71:567–577. 2003.
View Article : Google Scholar : PubMed/NCBI
|
|
27
|
Chiaramonte R, Basile A, Tassi E,
Calzavara E, Cecchinato V, Rossi V, Biondi A and Comi P: A wide
role for NOTCH1 signaling in acute leukemia. Cancer Lett.
219:113–120. 2005. View Article : Google Scholar : PubMed/NCBI
|
|
28
|
Mendes-da-Cruz DA, Brignier AC, Asnafi V,
Baleydier F, Messias CV, Lepelletier Y, Bedjaoui N, Renand A,
Smaniotto S, Canioni D, et al: Semaphorin 3F and Neuropilin-2
control the migration of human T-cell precursors. PLoS One.
9:e1034052014. View Article : Google Scholar : PubMed/NCBI
|
|
29
|
Jiang G, Freywald T, Webster J, Kozan D,
Geyer R, DeCoteau J, Narendran A and Freywald A: In human leukemia
cells ephrin-B-induced invasive activity is supported by lck and is
associated with reassembling of lipid raft signaling complexes. Mol
Cancer Res. 6:291–305. 2008. View Article : Google Scholar : PubMed/NCBI
|
|
30
|
O'Brien MM, Lee-Kim Y, George TI, McClain
KL, Twist CJ and Jeng M: Precursor B-cell acute lymphoblastic
leukemia presenting with hemophagocytic lymphohistiocytosis.
Pediatr Blood Cancer. 50:381–383. 2008. View Article : Google Scholar : PubMed/NCBI
|
|
31
|
Medyouf H, Alcalde H, Berthier C,
Guillemin MC, dos Santos NR, Janin A, Decaudin D, de Thé H and
Ghysdael J: Targeting calcineurin activation as a therapeutic
strategy for T-cell acute lymphoblastic leukemia. Nat Med.
13:736–741. 2007. View
Article : Google Scholar : PubMed/NCBI
|
|
32
|
Weng AP, Ferrando AA, Lee W, Morris JP
III, Silverman LB, Sanchez-Irizarry C, Blacklow SC, Look AT and
Aster JC: Activating mutations of NOTCH1 in human T cell acute
lymphoblastic leukemia. Science. 306:269–271. 2004. View Article : Google Scholar : PubMed/NCBI
|
|
33
|
Barata JT, Cardoso AA, Nadler LM and
Boussiotis VA: Interleukin-7 promotes survival and cell cycle
progression of T-cell acute lymphoblastic leukemia cells by
down-regulating the cyclin-dependent kinase inhibitor p27(kip1).
Blood. 98:1524–1531. 2001. View Article : Google Scholar : PubMed/NCBI
|
|
34
|
Trageser D, Iacobucci I, Nahar R, Duy C,
von Levetzow G, Klemm L, Park E, Schuh W, Gruber T, Herzog S, et
al: Pre-B cell receptor-mediated cell cycle arrest in Philadelphia
chromosome-positive acute lymphoblastic leukemia requires IKAROS
function. J Exp Med. 206:1739–1753. 2009. View Article : Google Scholar : PubMed/NCBI
|
|
35
|
Russell LJ, Capasso M, Vater I, Akasaka T,
Bernard OA, Calasanz MJ, Chandrasekaran T, Chapiro E, Gesk S,
Griffiths M, et al: Deregulated expression of cytokine receptor
gene, CRLF2, is involved in lymphoid transformation in B-cell
precursor acute lymphoblastic leukemia. Blood. 114:2688–2698. 2009.
View Article : Google Scholar : PubMed/NCBI
|
|
36
|
Chiron D, Di Liberto M, Martin P, Huang X,
Sharman J, Blecua P, Mathew S, Vijay P, Eng K, Ali S, et al:
Cell-cycle reprogramming for PI3K inhibition overrides a
relapse-specific C481S BTK mutation revealed by longitudinal
functional genomics in mantle cell lymphoma. Cancer Discov.
4:1022–1035. 2014. View Article : Google Scholar : PubMed/NCBI
|
|
37
|
Hou YY, Cao WW, Li L, Li SP, Liu T, Wan
HY, Liu M, Li X and Tang H: MicroRNA-519d targets MKi67 and
suppresses cell growth in the hepatocellular carcinoma cell line
QGY-7703. Cancer Lett. 307:182–190. 2011. View Article : Google Scholar : PubMed/NCBI
|
|
38
|
Bosch A Vanden, Raemaekers T, Denayer S,
Torrekens S, Smets N, Moermans K, Dewerchin M, Carmeliet P and
Carmeliet G: NuSAP is essential for chromatin-induced spindle
formation during early embryogenesis. J Cell Sci. 123:3244–3255.
2010. View Article : Google Scholar : PubMed/NCBI
|
|
39
|
Borowitz MJ, Devidas M, Hunger SP, Bowman
WP, Carroll AJ, Carroll WL, Linda S, Martin PL, Pullen DJ,
Viswanatha D, et al: Clinical significance of minimal residual
disease in childhood acute lymphoblastic leukemia and its
relationship to other prognostic factors: A Children's Oncology
Group study. Blood. 111:5477–5485. 2008. View Article : Google Scholar : PubMed/NCBI
|
|
40
|
Campana D: Molecular determinants of
treatment response in acute lymphoblastic leukemia. Hematology Am
Soc Hematol Educ Program. 1–373. 2008.PubMed/NCBI
|
|
41
|
Tetzlaff MT, Bai C, Finegold M, Wilson J,
Harper JW, Mahon KA and Elledge SJ: Cyclin F disruption compromises
placental development and affects normal cell cycle execution. Mol
Cell Biol. 24:2487–2498. 2004. View Article : Google Scholar : PubMed/NCBI
|
|
42
|
Bhadri VA, Cowley MJ, Kaplan W, Trahair TN
and Lock RB: Evaluation of the NOD/SCID xenograft model for
glucocorticoid-regulated gene expression in childhood B-cell
precursor acute lymphoblastic leukemia. BMC Genomics. 12:5652011.
View Article : Google Scholar : PubMed/NCBI
|
|
43
|
Hatfield KJ, Reikvam H and Bruserud Ø:
Identification of a subset of patients with acute myeloid leukemia
characterized by long-term in vitro proliferation and altered cell
cycle regulation of the leukemic cells. Expert Opin Ther Targets.
18:1237–1251. 2014. View Article : Google Scholar : PubMed/NCBI
|
|
44
|
Paganin M and Ferrando A: Molecular
pathogenesis and targeted therapies for NOTCH1-induced T-cell acute
lymphoblastic leukemia. Blood Rev. 25:83–90. 2011. View Article : Google Scholar : PubMed/NCBI
|
|
45
|
Schnell SA, Ambesi-Impiombato A,
Sanchez-Martin M, Belver L, Xu L, Qin Y, Kageyama R and Ferrando
AA: Therapeutic targeting of HES1 transcriptional programs in
T-ALL. Blood. 125:2806–2814. 2015. View Article : Google Scholar : PubMed/NCBI
|
|
46
|
Yang J, Shamji A, Matchacheep S and
Schreiber SL: Identification of a small-molecule inhibitor of class
Ia PI3Ks with cell-based screening. Chem Biol. 14:371–377. 2007.
View Article : Google Scholar : PubMed/NCBI
|
|
47
|
Au W, Lie A, Kung A, Liang R, Hawkins B
and Kwong Y: Autoimmune thyroid dysfunction after hematopoietic
stem cell transplantation. Bone Marrow Transplant. 35:383–388.
2005. View Article : Google Scholar : PubMed/NCBI
|
|
48
|
Tatevossian R, Blair JC, Plowman PN,
Savage MO and Shankar AG: Thyrotoxicosis after matched unrelated
bone marrow transplantation. J Pediatr Hematol Oncol. 26:529–531.
2004. View Article : Google Scholar : PubMed/NCBI
|
|
49
|
Mangolini M, de Boer J,
Walf-Vorderwülbecke V, Pieters R, den Boer ML and Williams O: STAT3
mediates oncogenic addiction to TEL-AML1 in t(12; 21) acute
lymphoblastic leukemia. Blood. 122:542–549. 2013. View Article : Google Scholar : PubMed/NCBI
|
|
50
|
Iyer J, Moghe S, Furukawa M and Tsai MY:
What's Nu(SAP) in mitosis and cancer? Cell Signal. 23:991–998.
2011. View Article : Google Scholar : PubMed/NCBI
|
|
51
|
Tian W, Li B, Warrington R, Tomchick DR,
Yu H and Luo X: Structural analysis of human Cdc20 supports
multisite degron recognition by APC/C. Proc Natl Acad Sci USA.
109:pp. 18419–18424. 2012; View Article : Google Scholar : PubMed/NCBI
|
|
52
|
Battula VL, Chen Y, Mda G Cabreira, Ruvolo
V, Wang Z, Ma W, Konoplev S, Shpall E, Lyons K, Strunk D, et al:
Connective tissue growth factor regulates adipocyte differentiation
of mesenchymal stromal cells and facilitates leukemia bone marrow
engraftment. Blood. 122:357–366. 2013. View Article : Google Scholar : PubMed/NCBI
|