Introduction
Glioma is one of the most common primary central
nervous system malignant tumors. With relatively high mortality and
disability rate, glioma can seriously influence the living quality
of patients and cause them and their families heavy economic burden
(1,2).
Glioma patients account for ~50% of intracranial tumor patients.
Its pathogenesis involves various factors, including genetics,
ionizing radiation, biochemical circumstance and environmental
pollution and infection. But its exact pathogenetic molecular
mechanism remains unclear (3,4). Clinically, glioma is usually diagnosed
at the middle and advanced stages with poor prognosis. Therefore,
the exploration of imaging features of glioma is of important
significance for indications of tumor occurrence, development and
prediction of early prognosis.
Diffusion tensor imaging (DTI) mainly reflects the
corrosion and damage situation of white matter fiber bundles caused
by glioma, and its grade malignancy is associated with the
proliferation of tumor cells, and tumor angiogenesis to damage the
completeness and continuity of a fiber bundle. The present study
quantitatively measured the DTI index of 31 cases with glioma and
discuss the clinical application value of DTI technology in
establishing glioma grade.
Materials and methods
Sample selection
The DTI data of 31 patients that have a confirmed
diagnosis of glioma by operation and pathology from June, 2013 to
January, 2015 was analyzed retrospectively. The cohort included 15
males and 16 females aged 4–70 years and a median age of 43 years.
According to Classification and Grading Standard of WHO Central
Nervous System Tumors (2007) (2),
there are 14 cases of grade I and II glioma, namely low-grade
glioma (LGG) and there are 17 cases of grade III and IV, which
belong to high-grade glioma (HGG), among which there were 2 cases
of pilocytic astrocytoma (grade I), 3 cases of protoplasmic
astrocytoma (grade II), 4 cases of diffuse astrocytoma (grade II),
5 cases of oligoastrocytomas (grade II), 9 cases of anaplastic
astrocytoma (grade III), 3 cases of anaplastic oligoastrocytomas
(grade III), 3 cases of anaplastic ependymoma (grade III) and 2
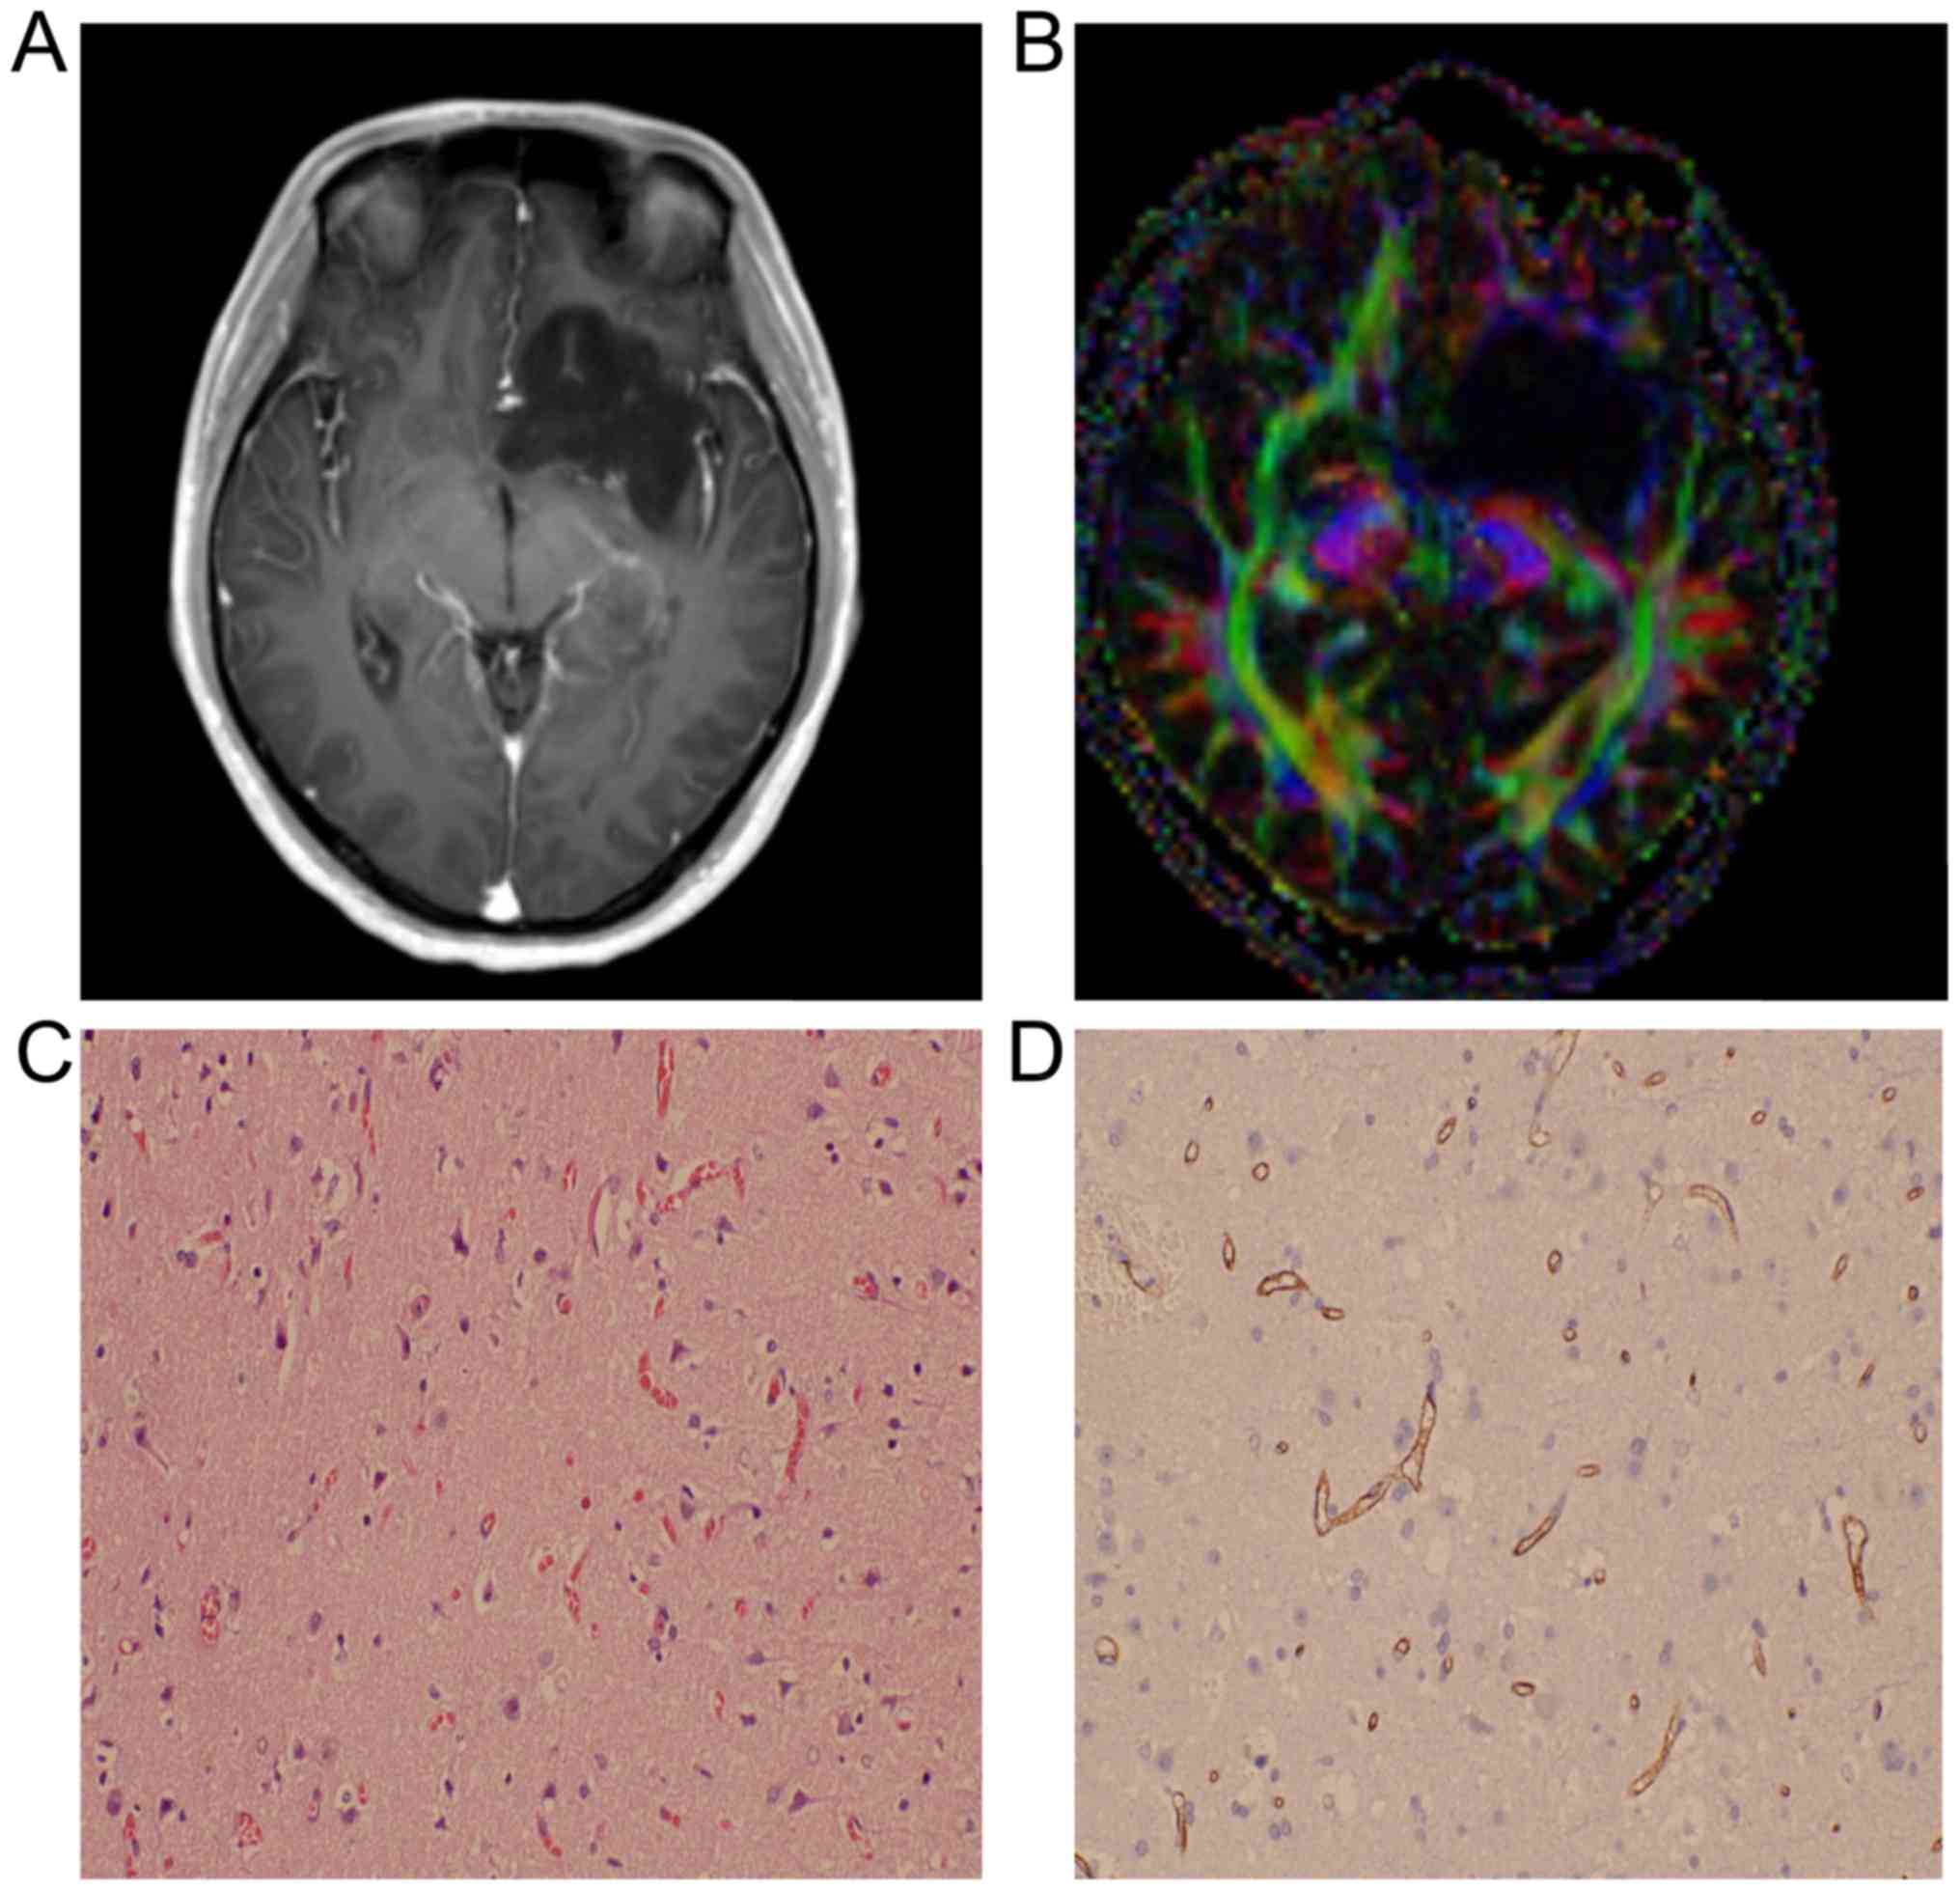
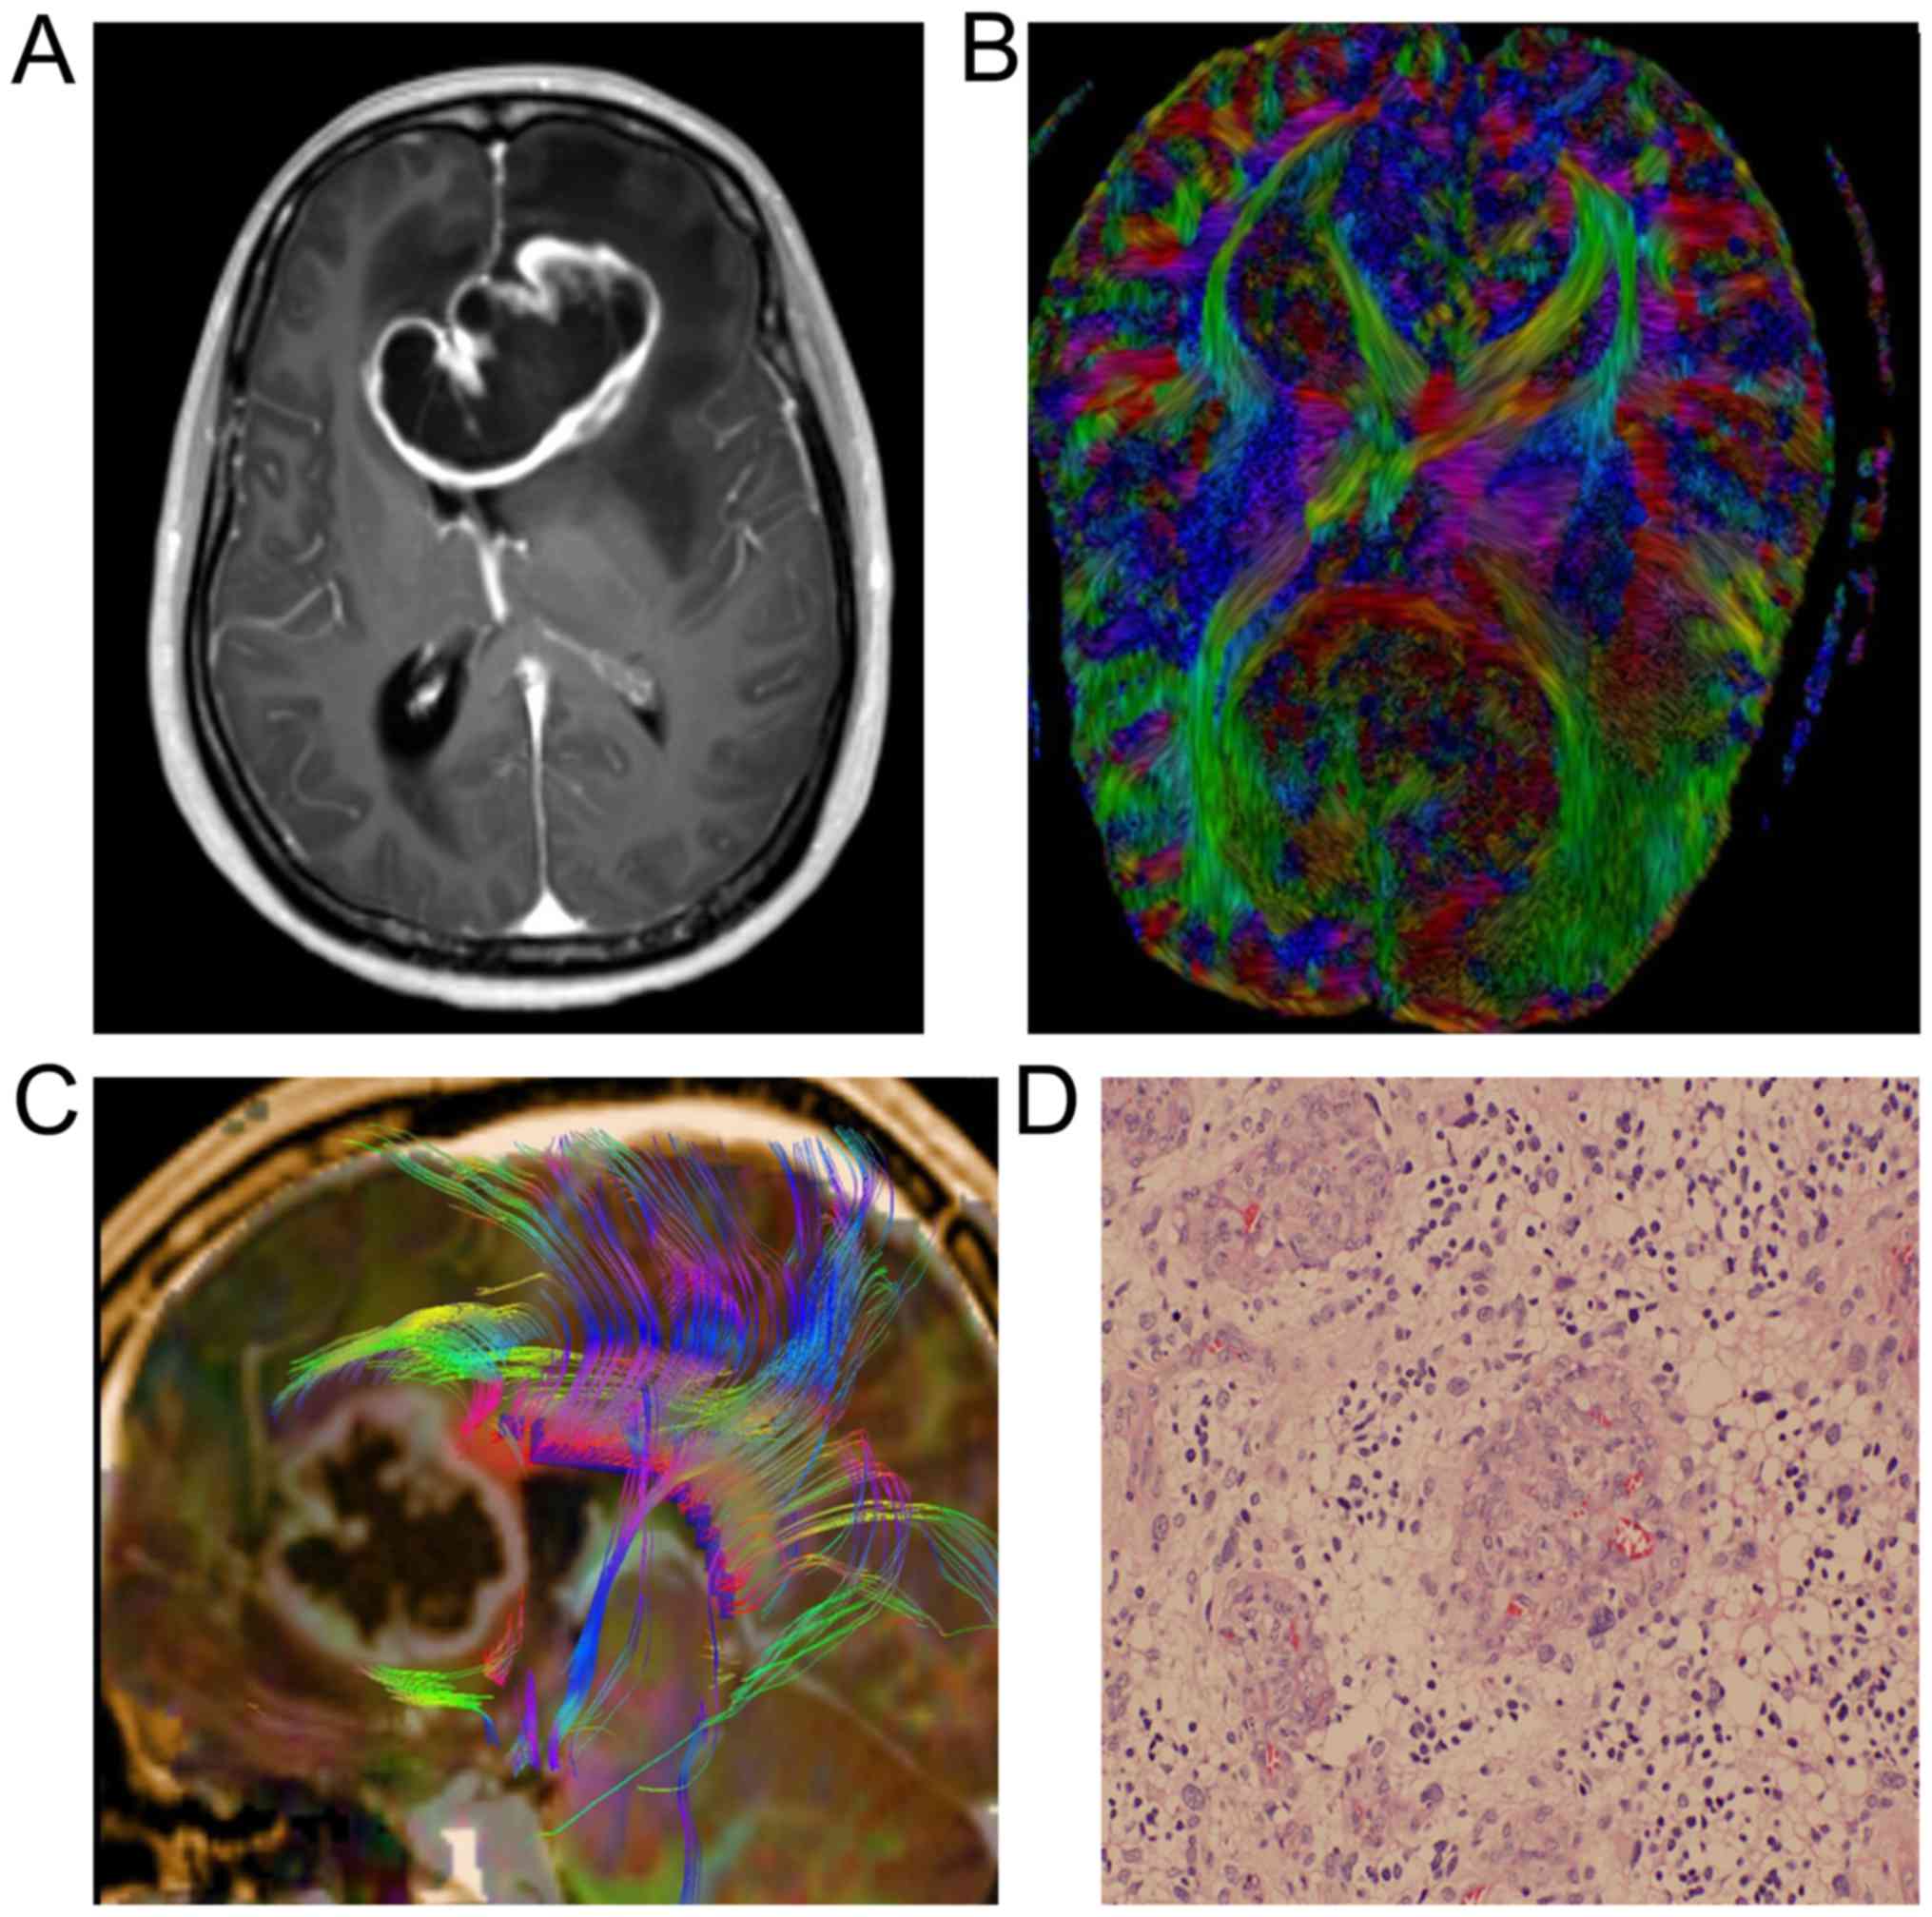
cases of glioblastoma (grade IV). The main clinical symptoms
include headache, dizziness, nausea, sickness, convulsion,
acroagnosis and movement disturbance. The general clinical
situations of the patient in the two groups is shown in Table I. Images of two cases with astrocytoma
or spongioblastoma are shown in Figs.
1 and 2.
 | Table I.General clinical situations of
patients. |
Table I.
General clinical situations of
patients.
| Grade of glioma | Total case no. | Detailed types of
glioma | Case no. |
|---|
| Low | 31 | Pilocytic
astrocytoma(grade I) | 2 (2/31) |
|
| 31 | Protoplasmic
astrocytoma (grade II) | 3 (3/31) |
|
| 31 | Diffuse astrocytoma
(grade II) | 4 (4/31) |
|
| 31 | Oligoastrocytomas
(grade II) | 5 (5/31) |
| High | 31 | Anaplastic
astrocytoma (grade III) | 9 (9/31) |
|
| 31 | Anaplastic
oligoastrocytomas (grade III) | 3 (3/31) |
|
| 31 | Anaplastic ependymoma
(grade III) | 3 (3/31) |
|
| 31 | Glioblastoma (grade
IV) | 2 (2/31) |
MR device and scan scheme
Skyra 3.0T superconductivity MR scanner was obtained
from Siemens (Munich, Germany), with scanning sequence including
conventional plain scan T1WI and T2WI, fluid-attenuated
inversion-recovery sequence (FLAIR), DTI and conventional enhanced
MRI scan.
The DTI sequence is as follows: Single-shot echo
planner imaging was applied, imaging FOV taking 220×220 cm, with TR
time of 5,400 msec, a total of 40 layers, with layer thickness of
3.0 mm, and interlamellar spacing of 0 mm. The phase encoding
direction was taken from front to back and a collection technique
GRAPPA was run to shorten the time of collecting signal, with 2
accelerated factors and resolution ratio of 128×128.
Multi-direction diffusion imaging scan was applied to exert
diffusion sensitive gradient in 30 directions, a 2 b value taken as
0 and 1,000 sec/mm2, respectively. The average time of
collecting signal was 12 times for b value of 0 sec/mm2
and the average time of collecting signal was twice for b value of
1,000 sec/mm2. The DWI, apparent dispersion coefficient
(ADC), index ADC and fractional anisotropy (FA) were processed
automatically after scanning and setting in the parameter tab
control.
A magnevist solution injection was used as contrast-
enhancing agent, with a dosage of 0.2 mmol/kg and injection rate of
2.0 ml/sec. After injection, normal saline of the same dosage was
injected. The patients of the present study did not develop an
allergic reaction to the contrast agent.
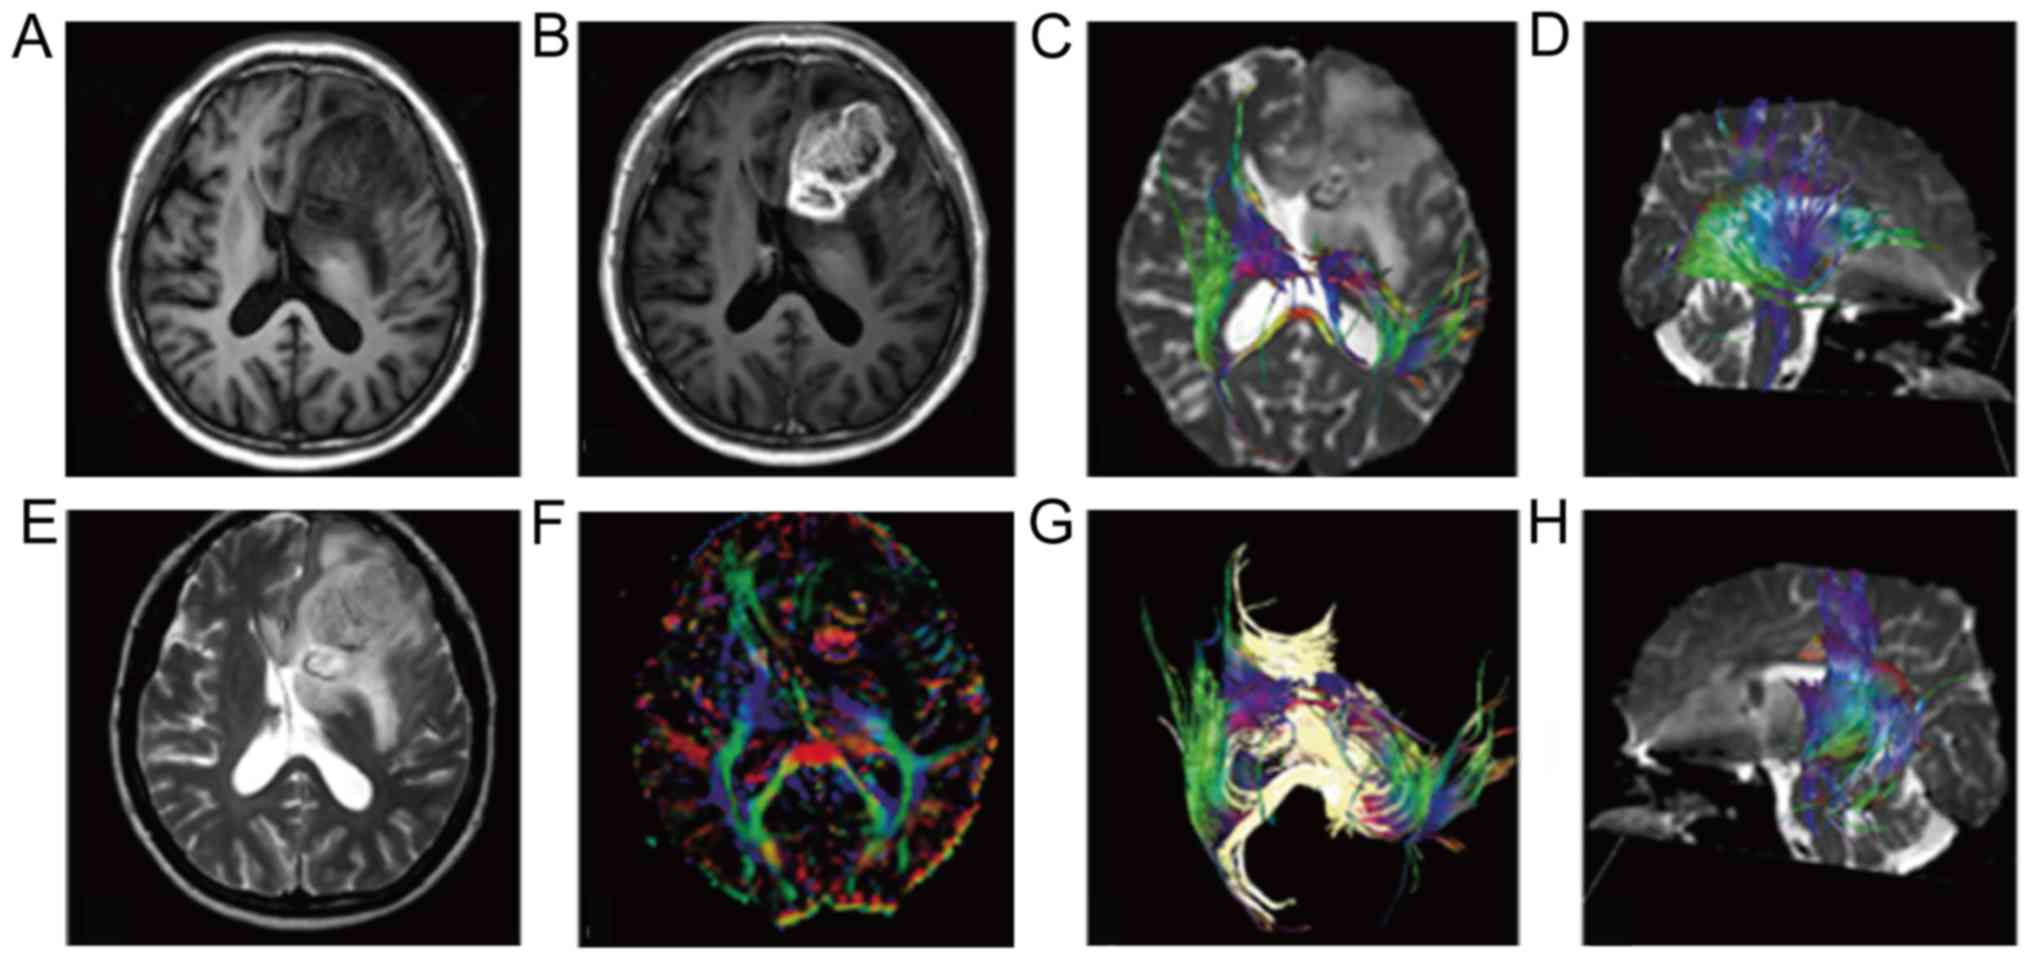
Image processing
The processing and analysis of the DTI image: The
original data of DTI from scan was transmitted to Siemens Syngo
MMWP workstation and processed by the software package Neuo 3D.
Combining directionally encoded color and FA image, 4 ROIs of 30
mm2 were drawn manually on the solid area of the tumor
cross section's largest layer. The selection of solid area was
referred to as T1, T2, FLAIR and DCE image of three directions,
with combination of multiple weighted imaging to observe, judge and
avoid edema area, measuring FA value and ADC, and tumor cysts,
necrosis and hemorrhage area were avoided when measurement was
conducted, the FA value of normal alba taken from the focus as a
reference value, and the ratio of lesion and normal alba as the FA
value. The ADC value was measured on the ADC image, and 4 ROIs
sized 30 mm2 were drawn manually on the solid area of
tumor with the largest cross section. The location selection of ROI
was brought into correspondence with that of the FA value
measurement, taking the average value of the observed value
(Fig. 3).
Statistical analysis
The statistical software SPSS 16.0 (SPSS, Inc.,
Chicago, IL, USA) was used for statistical analysis. The
Kolmogorov-Smirnov method was applied to conduct a normality test
for the value of FA and ADC, which met normal distribution. The
quantitative data are shown as the mean ± standard deviation and
comparison between groups utilized t-test or the χ2
test. The receiver operation characteristic (ROC) curve was used to
analyze the FA and ADC value, as well as diagnose the specificity
and sensitivity of the threshold value.
Results
Analysis of FA and ADC value of
different pathological patterns of glioma (mean ± standard
deviation)
Statistical analysis of the FA and ADC value of 31
glioma cases of different pathological patterns demonstrated that
there was no statistical difference among the patients with
different pathological patterns (P<0.05; Table II).
| Table II.Analysis of the FA and ADC value of
different pathological patterns of glioma (mean ± standard
deviation). |
Table II.
Analysis of the FA and ADC value of
different pathological patterns of glioma (mean ± standard
deviation).
| Tumor types | Case number | FA value | ADC
(10−3mm2/sec) |
|---|
| Pilocytic
astrocytoma(grade I) | 2 (2/31) | 106.4±12.8 | 1.04±0.51 |
| Protoplasmic
astrocytoma (grade II) | 3 (3/31) | 113.3±22.5 | 1.17±0.87 |
| Diffuse astrocytoma
(grade II) | 4 (4/31) | 119.2±18.9 | 1.21±0.42 |
| Oligoastrocytomas
(grade II) | 5 (5/31) | 118.7±21.6 | 1.09±0.55 |
| Anaplastic
astrocytoma (grade III) | 9 (9/31) | 121.3±18.5 | 1.23±0.77 |
| Anaplastic
oligoastrocytomas (grade III) | 3 (3/31) | 119.4±21.7 | 1.28±0.69 |
| Anaplastic ependymoma
(grade III) | 3 (3/31) | 125±18.6 | 1.32±0.51 |
| Glioblastoma (grade
IV) | 2 (2/31) | 131.2±20.7 | 1.42±0.87 |
| Pilocytic
astrocytoma(grade I) | – | 1.24 | 0.86 |
| Protoplasmic
astrocytoma (grade II) | – | >0.05 | >0.05 |
Analysis of FA and ADC value of
different pathological patterns of glioma
Furthermore, FA and ADC values of different grades
of glioma were statistically analyzed, and the results showed that
the average FA of LGG was higher than that of HGG group. Moreover,
the ADC of LGG was higher than that of HGG group; results were
statistically significant (Table
III).
| Table III.Analysis results of FA and ADC value
of different pathological patterns of glioma (mean ± standard
deviation). |
Table III.
Analysis results of FA and ADC value
of different pathological patterns of glioma (mean ± standard
deviation).
| Tumor grade | Case number | FA value | ADC value
(mm2/sec) |
|---|
| High-grade
glioma | 17 | 103.1±41.5 | (1.09±0.28)
10−3 |
| Low-grade glioma | 14 | 139.4±81.3 | (1.36±0.21)
10−3 |
| Statistical
value |
| t=−4.610 | t=−3.03 |
| P-value |
| <0.05 | <0.05 |
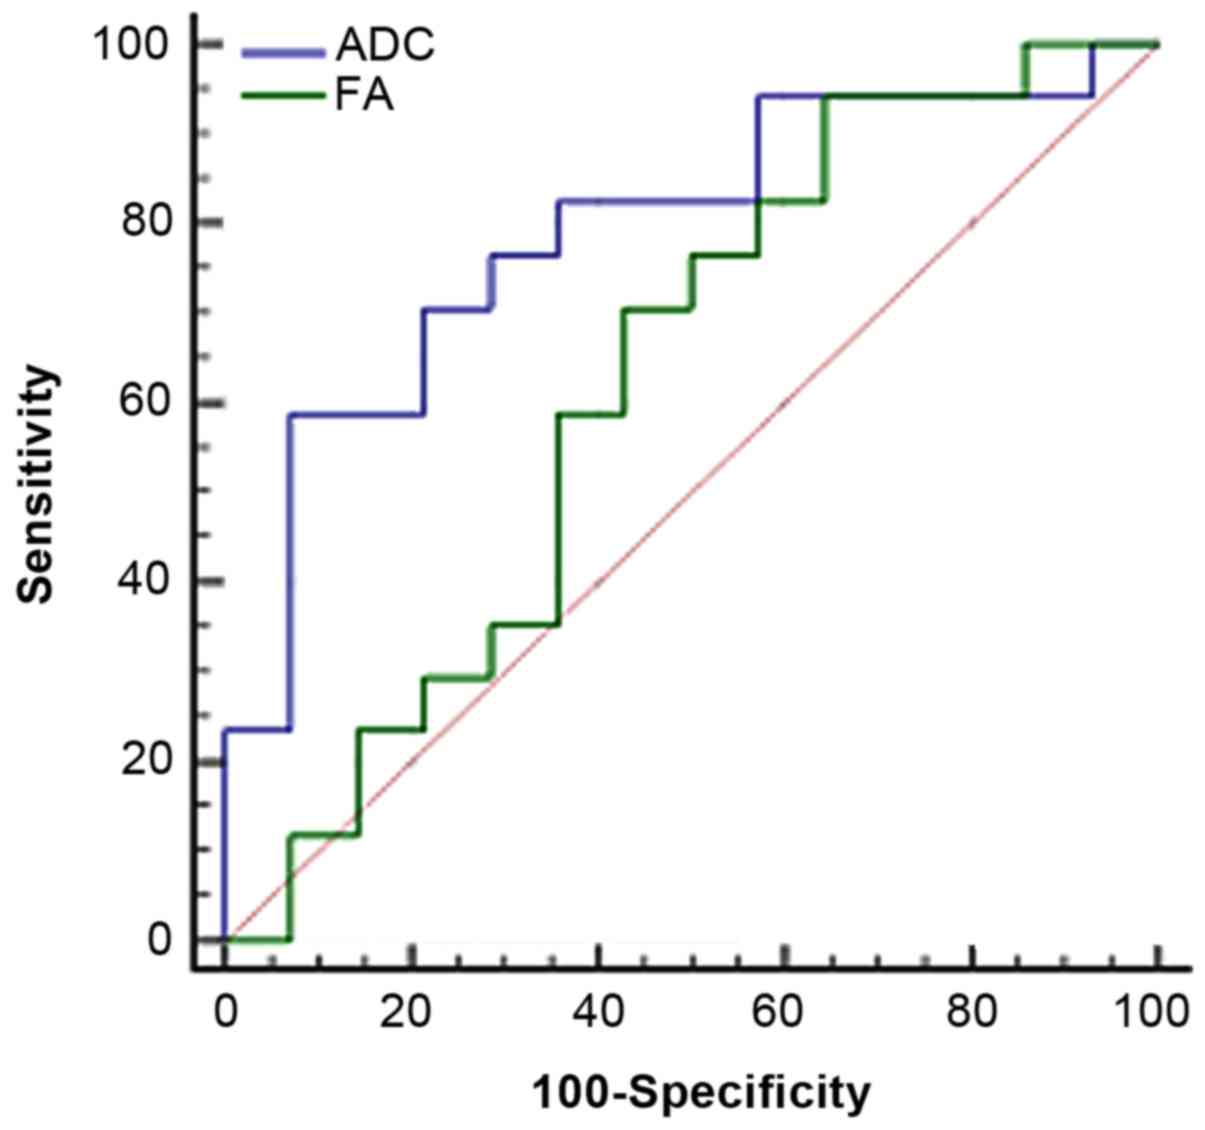
Results of the analysis of area under
ROC curve
The ADC/FA value in tumor ROI was taken as the
critical point to judge tumor grade and draw the ROC image
(Fig. 4); the area under the curve
was 0.79/0.62. As the diagnosis threshold value, the ADC/FA value
of 1.11×10⁻³ mm2/sec/178.9 was used to
distinguish between low- and high-grade tumors. Using this
threshold value, high-grade malignant tumors were diagnosed with
sensitivity of 58.8/94.1% and specificity of 92.9/35.7%. Compared
to FA, ADC has greater advantage in distinguishing tumor grade.
Analysis of sensitivity and
specificity of conventional and DTI combination scan
Analysis of HGG as the positive, sensitive,
specific, positive and negative predictive value of conventional
MRI and DTI combination scan was conducted. Our analysis
demonstrated that the sensitivity, specificity and accuracy of DTI
combination scan were higher than that of conventional scans;
differences were statistically significant (P<0.05; Tables IV and V).
| Table IV.Analysis of sensitivity and
specificity of conventional and DTI combination scan. |
Table IV.
Analysis of sensitivity and
specificity of conventional and DTI combination scan.
|
| Pathological
results |
|
|---|
|
|
|
|
|---|
| Groups | High-grade
glioma | Low-grade glioma | Total |
|---|
| Conventional MRI |
|
High-grade glioma | 13 | 2 | 15 |
| Low-grade
glioma | 4 | 12 | 16 |
|
Total | 17 | 14 | 31 |
| Conventional MRI
combined with DTI |
|
High-grade glioma | 17 | 0 | 17 |
| Low-grade
glioma | 0 | 14 | 14 |
|
Total | 17 | 14 | 31 |
| Table V.Comparison of accuracy, sensitivity,
specificity, positive and negative predictive value of different
detection methods (%). |
Table V.
Comparison of accuracy, sensitivity,
specificity, positive and negative predictive value of different
detection methods (%).
| Variables | Sensitivity (%) | Specificity (%) | Positive predictive
value (%) | Negative predictive
value (%) | Accuracy (%) |
|---|
| Conventional MRI | 76.1 | 86.2 | 81.1 | 0.75 | 81.3 |
| Conventional MRI
combined DTI | 100 | 100 | 55.0 | 45.0 | 100 |
| T-value | 1.27 | 1.88 | 1.49 | 1.57 | 2.17 |
| P-value | <0.05 | <0.05 | <0.05 | <0.05 | <0.05 |
Discussion
The guiding significance of the MR DTI index is as
follows: The subsidiarity that iconography can provide for tumor
grading is correspondingly indispensable due to the importance of
tumor grading for treatment and prognosis. DTI mainly reflects the
integrity of the nerve fiber anatomical structure which can assess
the microcosmic physiology and pathological state of white matter
fiber tracts using non-invasive techniques. Moreover, DTI
technology can also judge tumor cell density and evaluate the
ability of tumor cells to invade white matter degree
efficiently.
The change of ADC value in tumors is influenced by
tumor cell structure to a great extent (5). With the increasing ascendance of grade
malignancy and the density of tumor cell structure, the tumor form
becomes more complicated. Brownian movement of molecules is limited
even further, eventually leading to decline of the ADC value
directly. In the present study, the ADC value in HGG is lower than
that in LGG, which indicates that tumor cell structures will become
more complicated with an increase of grade malignancy, albeit
indirectly. In addition, HGG with high-grade malignancy can lead to
abnormal tumor blood vessel hyperplasia and the micro-structure
completeness of the tumor cell is broken, which results in free
water infiltration nerve fiber axon gap and a decline in the FA
value. Through the comparison of FA values, the present study found
that when compared to LGGs, the FA value of HGG is reduced
significantly, which reflects blood vessels in HGG mesenchyme
erodes or damage to nerve fiber bundle. This leads to free water
infiltration to nerve fiber axon gap and decline in the FA value,
which suggests that it indirectly leads to the spatial distribution
situation of tumor capillaries (5–7).
Previous research results indicate that the
difference between FA and ADC in high- and low-grade glioma was
statistically significant; our study corroborated the results that
both of them can distinguish different grades of the tumor
(4). However, in terms of the
comparison of diagnostic efficiency, the FA value of different
grades as the critical point to distinguish tumor grade had a curve
area of 0.62, which was lower than that of ADC; this suggests that
ADC has a better diagnostic efficiency. However, FA has a stronger
sensitivity and a lower specificity and ADC has lower sensitivity
and stronger specificity; the difference is attributed to the
individual theory behind these two parameters (8). FA mainly reflects anisotropy of the
internal structure of tumor, while ADC reflects a limited degree of
molecular diffusion into the tumor, which is a comprehensively
average effect, excluding anisotropy (9–11). Tumors
are heterogeneous, and therefore, there is coexistence of edema and
substance as well as coexistence of low- and high-grade. If we
evaluated the FA and ADC from two different starting points, there
would be a different analysis result (12–14).
The present study utilized the FA and ADC to
evaluate high- and low-grade of tumors, revealing that the two
indexes can distinguish between the grades of tumor. The
combination of these is more helpful in distinguishing the grade of
tumor and understanding the internal structure, which can also be
applied for a study with a larger sample size. We analyzed the
sensitivity, specificity, accuracy, positive predictive value and
negative predictive value of conventional MRI and DTI combination
and found that the sensitivity, specificity and accuracy of DTI
combination scan was higher than that of conventional MRI scan;
differences were statistically significant (P<0.05). We
speculated that DTI method was superior in the evaluation of blood
vessel corrosion and damage to the nerve fiber bundle, which
results in free water infiltration to nerve fiber axon gap.
Therefore, it has a favorable reminder for clinical diagnosis,
which is helpful for a pathologist to diagnose the glioma
grade.
A serious limitation of this study is that there was
a limited number of clinical cases, and therefore, there was a
possible existence of a bias in the evaluation of diagnostic
efficiency. In conclusion, conventional and DTI combination scan
can assess glioma with new vessel hyperplasia and the degree of
nerve fiber bundle damage more comprehensively, which can provide a
new method for the monitoring of tumor diagnosis, growth, transfer
and postoperative recurrence.
References
|
1
|
Inoue T, Ogasawara K, Beppu T, Ogawa A and
Kabasawa H: Diffusion tensor imaging for preoperative evaluation of
tumor grade in gliomas. Clin Neurol Neurosurg. 107:174–180. 2005.
View Article : Google Scholar : PubMed/NCBI
|
|
2
|
Rousseau A, Mokhtari K and Duyckaerts C:
The 2007 WHO classification of tumors of the central nervous system
- what has changed? Curr Opin Neurol. 21:720–727. 2008. View Article : Google Scholar : PubMed/NCBI
|
|
3
|
Field AS and Alexander AL: Diffusion
tensor imaging in cerebral tumor diagnosis and therapy. Top Magn
Reson Imaging. 15:315–324. 2004. View Article : Google Scholar : PubMed/NCBI
|
|
4
|
Nimsky C, Ganslandt O, Hastreiter P, Wang
R, Benner T, Sorensen AG and Fahlbusch R: Preoperative and
intraoperative diffusion tensor imaging-based fiber tracking in
glioma surgery. Neurosurgery. 61:178–185; discussion 186. 2007.
View Article : Google Scholar : PubMed/NCBI
|
|
5
|
Hadziahmetovic M, Shirai K and Chakravarti
A: Recent advancements in multimodality treatment of gliomas.
Future Oncol. 7:1169–1183. 2011. View Article : Google Scholar : PubMed/NCBI
|
|
6
|
Yao K, Wang H, Duan Z, Bian Y, Xia L, Ma Z
and Qi X: Mixed granular cell astrocytoma and fibrosarcoma of the
brain: A case report. Int J Clin Exp Pathol. 7:4473–4478.
2014.PubMed/NCBI
|
|
7
|
Leestma JE: Brain tumors. Am J Pathol.
100:239–316. 1980.PubMed/NCBI
|
|
8
|
Wang H, Li XT, Wu C, Wu ZW, Li YY, Yang
TQ, Chen GL, Xie XS, Huang YL, Du ZW, et al: miR-132 can inhibit
glioma cells invasion and migration by target MMP16 in vitro. Onco
Targets Ther. 8:3211–3218. 2015.PubMed/NCBI
|
|
9
|
Doblas S, He T, Saunders D, Pearson J,
Hoyle J, Smith N, Lerner M and Towner RA: Glioma morphology and
tumor-induced vascular alterations revealed in seven rodent glioma
models by in vivo magnetic resonance imaging and angiography. J
Magn Reson Imaging. 32:267–275. 2010. View Article : Google Scholar : PubMed/NCBI
|
|
10
|
Bokacheva L, Ackerstaff E, LeKaye HC,
Zakian K and Koutcher JA: High-field small animal magnetic
resonance oncology studies. Phys Med Biol. 59:R65–R127. 2014.
View Article : Google Scholar : PubMed/NCBI
|
|
11
|
Lohrke J, Frenzel T, Endrikat J, Alves FC,
Grist TM, Law M, Lee JM, Leiner T, Li KC, Nikolaou K, et al: 25
years of Contrast-Enhanced MRI: Developments, current challenges
and future perspectives. Adv Ther. 33:1–28. 2016. View Article : Google Scholar : PubMed/NCBI
|
|
12
|
Gutova M, Frank JA, D'Apuzzo M,
Khankaldyyan V, Gilchrist MM, Annala AJ, Metz MZ, Abramyants Y,
Herrmann KA, Ghoda LY, et al: Magnetic resonance imaging tracking
of ferumoxytol-labeled human neural stem cells: Studies leading to
clinical use. Stem Cells Transl Med. 2:766–775. 2013. View Article : Google Scholar : PubMed/NCBI
|
|
13
|
Kalpathy-Cramer J, Gerstner ER, Emblem KE,
Andronesi OC and Rosen B: Advanced magnetic resonance imaging of
the physical processes in human glioblastoma. Cancer Res.
74:4622–4637. 2014. View Article : Google Scholar : PubMed/NCBI
|
|
14
|
Zhou J, Tryggestad E, Wen Z, Lal B, Zhou
T, Grossman R, Wang S, Yan K, Fu DX, Ford E, et al: Differentiation
between glioma and radiation necrosis using molecular magnetic
resonance imaging of endogenous proteins and peptides. Nat Med.
17:130–134. 2011. View
Article : Google Scholar : PubMed/NCBI
|