Introduction
Ovarian cancer is the most common cause of mortality
from gynecological tumors in women worldwide (1). The 5-year survival rate for patients
with advanced ovarian cancer has been reported to be ~30% (2). The incidence of ovarian cancer in Asian
countries is considerably lower than that in developed countries,
but the difference is reducing (3).
In China, the estimated incidence of ovarian cancer during
1999–2010 was 7.91 per 100,000 people (4). Epithelial ovarian cancer accounts for
nearly 90% of all ovarian tumors (5).
The high mortality of epithelial ovarian cancer is attributed to
late-stage diagnosis in >70% of the patients (6). Constant damage and repair of ovarian
surface epithelial cells, use of gonadotropin-releasing hormone and
steroid hormones, inflammation, genetic factors, and environmental
factors have been previously shown to be associated with epithelial
ovarian cancer (7–9); however, the exact molecular mechanisms
of its occurrence and development remain to be fully
identified.
For more than half a century, the concept of gene
was limited to the messenger RNA (mRNA) coding region of the
genome. With progress in life science research in the post-genome
era, numerous studies have demonstrated the involvement of
non-coding RNAs (ncRNAs) at various levels in the cell, including
transcription, and post-transcriptional regulation of nuclear
internal and external signal communication (10). In addition, these RNAs have been
demonstrated to be closely associated with the pathological
processes of numerous serious diseases (11). Long ncRNAs (lncRNAs) are non-coding
RNAs >200 nt in length. Accumulating evidence indicates that
lncRNAs serve an important role in various biological processes
such as genomic imprinting, transcription activation and
inhibition, chromosome recombination, intranuclear transportation,
and organ development (12,13). Certain studies have indicated that
aberrant regulation of lncRNAs is associated with various types of
human cancer (14). Furthermore,
lncRNAs are often used as a potential biomarker in the diagnosis
and prognosis of tumors (15).
Although a few lncRNAs have been implicated in the progression of
epithelial ovarian cancer, the functions of the majority of lncRNAs
remain to be investigated.
Therefore, the present study used an lncRNA
microarray to identify lncRNAs that are differentially expressed
(DE) in epithelial ovarian cancer. The microarray results were
verified by reverse transcription-quantitative polymerase chain
reaction (RT-qPCR) for specific DE lncRNAs. The present data may
provide a molecular basis for understanding the pathogenesis of
epithelial ovarian cancer.
Materials and methods
Tissue collection
For tissue collection, five patients with epithelial
ovarian cancer were recruited between May and July 2014 at the
Department of Gynecology, Obstetrics and Gynecology Hospital
Affiliated to Nanjing Medical University (Nanjing, China). The
patients were pathologically confirmed as having epithelial ovarian
cancer. Epithelial ovarian cancer tissues and surrounding normal
tissues were collected following surgery, snap frozen in liquid
nitrogen, and stored at −80°C. Written informed consent was
obtained from all patients and the study was approved by the ethics
committee of Nanjing Medical University.
RNA extraction
Total RNA was extracted from five pairs of
epithelial ovarian cancer and adjacent normal tissues using TRIzol
reagent (Invitrogen; Thermo Fisher Scientific, Inc., Waltham, MA,
USA) according to the manufacturer's protocol, and quantified using
a NanoDrop ND-1000 spectrophotometer (NanoDrop; Thermo Fisher
Scientific, Inc., Wilmington, DE, USA). The RNA integrity of each
sample was assessed using standard denaturing gel electrophoresis,
as previously described (16).
Microarray and data analysis
Microarray analysis was performed by Kangchen
Biotech Co., Ltd. (Shanghai, China). Arraystar Human LncRNA
Microarray V3.0 (Arraystar Inc., Rockville, MD, USA) is designed
for the global profiling of human lncRNAs and protein-coding
transcripts. This software is capable of detecting ~30,586 lncRNAs
and 26,109 coding transcripts (17).
Briefly, mRNA was purified from total RNA upon removal of ribosomal
RNA using the mRNA-ONLY™ Eukaryotic mRNA Isolation kit (Epicentre,
Madison, WI, USA). Then, each sample was amplified and transcribed
into fluorescent complementary RNA (cRNA) along the entire length
of the transcripts without 3′-bias using the Quick Amp Labeling
kit, One-Color (Agilent Technologies, Inc., Santa Clara, CA, USA)
according to the manufacturer's protocol. The labeled cRNAs were
purified using the RNeasy Mini kit (Qiagen Inc., Valencia, CA,
USA). The concentration and specific activity of the labeled cRNAs
(pmol cyanine 3/µg cRNA) were measured by the NanoDrop ND-1000.
First, 1 µg of each labeled cRNA was fragmented by adding 5 µl of
10X blocking agent and 1 µl of 25X fragmentation buffer (both
Agilent Technologies, Inc.). The mixture was then heated at 60°C
for 30 min, and subsequently, 25 µl of 2X hybridization buffer (GE
Healthcare Life Sciences, Little Chalfont, UK) was added to dilute
the labeled cRNA. For microarray analysis, 50 µl of the
hybridization solution was dispensed into the gasket slide and
assembled to the lncRNA expression microarray slide. The slides
were incubated for 17 h at 65°C in a Microarray Hybridization Oven
(Agilent Technologies, Inc.). The hybridized arrays were washed
with Gene Expression Wash Buffer (Agilent Technologies, Inc.) and
scanned with using the G2505C Microarray Scanner System (Agilent
Technologies, Inc.). Feature Extraction software version 11.0.1.1
(Agilent Technologies, Inc.) was used to analyze the acquired array
images. Quantile normalization and subsequent data processing were
performed using the GeneSpring GX v12.1 software package (Agilent
Technologies, Inc.).
Gene ontology (GO) and pathway
analyses
GO and pathway analyses were used to determine the
roles of DE mRNAs in biological pathways or GO terms.
Differentially regulated mRNAs were uploaded into the Database for
Annotation, Visualization and Integrated Discovery (http://david.abcc.ncifcrf.gov/), which utilized
GO terms to identify the molecular function represented in the gene
profile. Pathway analysis was carried out based on the Kyoto
Encyclopedia of Genes and Genomes (KEGG) database (http://www.genome.ad.jp/kegg/).
RT-qPCR validation
Total RNA was reverse transcribed into complementary
DNA (cDNA) using the AMV Reverse Transcriptase (Promega
Corporation, Madison, WI, USA) according to the manufacturer's
protocol. RT-qPCR was performed using an Applied Biosystems 7300
Real-Time PCR Sequence Detection System (Thermo Fisher Scientific,
Inc.). RT-qPCR was conducted using 1 µl of cDNA, 12.5 µl of 2X SYBR
Green PCR Master Mix (Applied Biosystems; Thermo Fisher Scientific,
Inc.), 10.5 µl of diethyl pyrocarbonate-treated water, and 0.5 µl
of 10 µM forward and reverse primers, in a total volume of 25 µl.
The following specific primers were used for PCR: RP11-1C1.7
forward, 5′-CTCAGGCTTGGCTCAGACAC-3′ and reverse,
5′-GCAAACAGCCTTGGAGAAGC-3′; XLOC_003286 forward,
5′-AAGGGATCTGGTCTTCAACA-3′ and reverse, 5′-TTCCACCATGTAATGGGTCC-3′;
growth arrest specific 5 (GAS5) forward,
5′-TGAAGTCCTAAAGAGCAAGCC-3′ and reverse,
5′-ACCAGGAGCAGAACCATTAAG-3′; ZNF295-AS1 forward,
5′-CCCAGGAGGGAGGTGATACT-3′ and reverse, 5′-TGGGTAGCTTGTGAACCACC-3′;
protein tyrosine kinase 7 (PTK7) forward,
5′-GGAAGCCACACTTCACCTAGCAG-3′ and reverse,
5′-CTGCCACAGTGAGCTGGACATGG-3′; maternally expressed gene 3 (MEG3)
forward, 5′-GCTCTACTCCGTGGAAGCAC-3′ and reverse,
5′-CAAACCAGGAAGGAGACGAG-3′; AC079776.2, forward,
5′-GCCGATGGTAGAGAAGACCG-3′ and reverse, 5′-GGGGCTCAGAAGCCATCTTT-3′;
and ribosomal protein lateral stalk subunit P0 pseudogene 2
(RPLP0P2) forward, 5′-AAAAACGATCAACGAACCTT-3′ and reverse,
5′-AATCGTCTCTGCTTTTCTTG-3′. The PCR conditions were as follows:
Denaturation at 95°C for 10 min, followed by 40 cycles of
amplification and quantification at 95°C for 15 sec and 60°C for 1
min. GAPDH (forward, 5′-CCGGGAAACTGTGGCGTGATGG-3′ and reverse,
5′-AGGTGGAGGTATGGGTGTCGCTGTT-3′) was used as the internal control.
The experiments were performed in triplicate. The relative
fold-change was calculated using the 2−ΔΔCq method
(18).
Statistical analysis
The lncRNAs and mRNAs that exhibited significantly
different expression levels between the two groups were identified
through P-value/false discovery rate filtering. DE lncRNAs and
mRNAs were identified by fold-change filtering and Student's t
test. All data were expressed as means ± standard deviation.
Statistical analysis was performed using SPSS 10.0 (SPSS, Inc.,
Chicago, IL, USA). P<0.05 was considered to indicate a
statistically significant difference.
Results
DE lncRNAs and mRNAs
A total of 1221 lncRNAs were significantly DE
between the tumor and control groups (fold-change ≥2.0), among
which, 672 were upregulated and 549 were downregulated. Among the
DE mRNAs between the two groups, 525 were upregulated and 418 were
downregulated. Partial results for the DE lncRNAs and mRNAs are
listed in Tables I and II, respectively.
 | Table I.Screening of differentially expressed
lncRNAs (tumor vs. normal). |
Table I.
Screening of differentially expressed
lncRNAs (tumor vs. normal).
| Regulation | lncRNA | Fold-change | Chromosomal
localization | RNA length, bp |
|---|
| Up | RP5-857K21.3 | 91.6369032 | Chr1 | 437 |
| Up | uc001zjx.1 | 64.7598797 | Chr15 | 641 |
| Up | DQ573539 | 39.8247748 | Chr9 | 1,713 |
| Up | RP11-1C1.7 | 38.8887511 | Chr5 | 483 |
| Up | XLOC_004134 | 25.2266495 | Chr4 | 261 |
| Up | RP11-872J21.3 | 21.4447620 | Chr14 | 1,512 |
| Up | LOC338817 | 18.7987392 | Chr12 | 3,684 |
| Up | CDKN2B-AS1 | 15.7325039 | Chr9 | 1,067 |
| Up | HLA-DRB6 | 15.1244408 | Chr6 | 715 |
| Up | UCA1 | 12.9894370 | Chr19 | 1,413 |
| Up | BX004987.5 | 11.7750069 | Chr1 | 736 |
| Up | FOLH1B | 10.8238534 | Chr11 | 2,163 |
| Up | ZNF295-AS1 |
9.3852619 | Chr21 | 1,073 |
| Up | AK054990 |
9.1453539 | Chr2 | 2,070 |
| Up | AP001615.9 |
8.1669081 | Chr21 | 461 |
| Up | GAS5 |
7.8179616 | Chr1 | 822 |
| Up | LINC00152 |
7.0158480 | Chr2 | 455 |
| Up | XLOC_003286 |
6.5502125 | Chr3 | 409 |
| Up | DPY19L2P2 |
4.4375165 | Chr7 | 3,433 |
| Up | AL833634 |
2.2275523 | Chr11 | 1,885 |
| Down | CTD-2536I1.1 | 58.1029053 | Chr15 | 614 |
| Down | BC071789 | 46.6526362 | Chr3 | 2,730 |
| Down | RP11-548O1.3 | 41.2599738 | Chr3 | 483 |
| Down | MEG3 | 35.0543457 | Chr14 | 1,351 |
| Down | RP11-471J12.1 | 30.7697326 | Chr4 | 892 |
| Down | LEMD1-AS1 | 24.3438594 | Chr1 | 2,781 |
| Down | CLCN6 | 20.5708229 | Chr1 | 5,697 |
| Down | AL132709.5 | 19.7389918 | Chr14 | 644 |
| Down | XLOC_010463 | 17.3764962 | Chr13 | 9,590 |
| Down | CACNA1G-AS1 | 15.5318244 | Chr17 | 1,450 |
| Down | AC079776.2 | 12.6763061 | Chr2 | 400 |
| Down | RP11-998D10.2 | 10.6026574 | Chr14 | 548 |
| Down | LOC253044 |
7.5169687 | Chr15 | 1,735 |
| Down | PVT1 |
4.8097586 | Chr8 | 654 |
| Down | AX747026 |
4.3736710 | Chr1 | 2,133 |
| Down | OPA1-AS1 |
3.4889195 | Chr3 | 513 |
| Down | PTK7 |
3.1639252 | Chr6 | 4,040 |
| Down | RP11-799B12.4 |
2.5604262 | Chr18 | 735 |
| Down | RPLP0P2 |
2.4997850 | Chr11 | 573 |
| Down | HOTAIR |
2.1863176 | Chr12 | 2,370 |
| Table II.Screening of differentially expressed
mRNAs (tumor vs. normal). |
Table II.
Screening of differentially expressed
mRNAs (tumor vs. normal).
| Regulation | mRNA | Fold-change | Chromosomal
localization | RNA length, bp |
|---|
| Up | GAL | 112.8379148 | Chr11 | 778 |
| Up | LAMC2 |
94.8845376 | Chr1 | 5,623 |
| Up | CCNA1 |
80.0032110 | Chr13 | 1,841 |
| Up | MUC1 |
62.3494142 | Chr1 | 878 |
| Up | WDR69 |
54.5549954 | Chr2 | 1,669 |
| Up | ENKUR |
47.3980040 | Chr10 | 3,382 |
| Up | STOML3 |
32.8593469 | Chr13 | 1,936 |
| Up | KIAA0101 |
27.1783242 | Chr15 | 1,345 |
| Up | CCNB2 |
20.5538621 | Chr15 | 1,566 |
| Up | SLC1A3 |
18.5310330 | Chr5 | 3,670 |
| Up | SAA2 |
16.4134886 | Chr11 | 594 |
| Up | FGF18 |
14.3701010 | Chr5 | 1,999 |
| Up | UBE2C |
12.9501868 | Chr20 | 520 |
| Up | NAA16 |
9.5211755 | Chr13 | 1,833 |
| Up | KCNIP4 |
7.5399784 | Chr4 | 2,371 |
| Up | SLITRK6 |
6.5738521 | Chr13 | 4,199 |
| Up | CEP44 |
4.4520673 | Chr4 | 3,290 |
| Up | C20orf201 |
3.2842057 | Chr20 | 868 |
| Up | DHCR7 |
2.3597491 | Chr11 | 2,665 |
| Up | RNLS |
2.0603828 | Chr10 | 2,420 |
| Down | ITM2A | 110.4209953 | ChrX | 1,719 |
| Down | ZBTB16 |
82.7721198 | Chr11 | 2,417 |
| Down | CPXM1 |
80.2367909 | Chr20 | 2,409 |
| Down | GATA4 |
69.2038646 | Chr8 | 3,419 |
| Down | APOD |
54.0064083 | Chr3 | 1,130 |
| Down | DCN |
48.0233786 | Chr12 | 1,336 |
| Down | GNG11 |
37.6068614 | Chr7 | 964 |
| Down | DHRS2 |
32.5328881 | Chr14 | 1,709 |
| Down | ACADL |
28.4221424 | Chr2 | 2,565 |
| Down | LCE1C |
24.4961395 | Chr1 | 695 |
| Down | MATN2 |
18.1700061 | Chr8 | 4065 |
| Down | LCE2C |
16.5275274 | Chr1 | 614 |
| Down | PPP1R14A |
10.4409979 | Chr19 | 782 |
| Down | OSR2 |
8.4374819 | Chr8 | 1,907 |
| Down | AKT3 |
6.6042407 | Chr1 | 7,091 |
| Down | IL28RA |
5.1905507 | Chr1 | 4,432 |
| Down | PIK3IP1 |
3.6901547 | Chr22 | 2,478 |
| Down | SULF1 |
3.4824364 | Chr8 | 5,716 |
| Down | DCAF4L2 |
2.8399696 | Chr8 | 3,339 |
| Down | MARK3 |
2.6464566 | Chr14 | 3,519 |
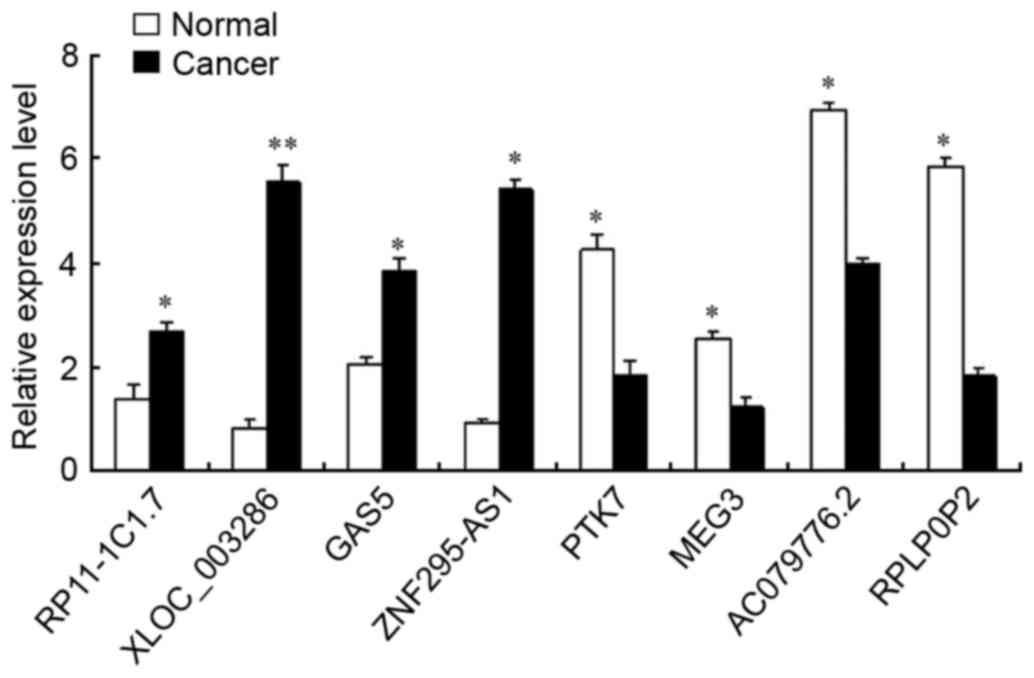
Validation of de lncRNAs
The results of the microarray analysis were
confirmed by RT-qPCR of eight randomly selected lncRNAs. GAPDH was
used as a normalization control. Of these randomly selected
lncRNAs, four (RP11-1C1.7, XLOC_003286, GAS5 and ZNF295-AS1) were
upregulated and the other four (PTK7, MEG3, AC079776.2 and RPLP0P2)
were downregulated in epithelial ovarian cancer samples compared
with their expression levels in adjacent normal tissues of the same
individual. As the results of RT-qPCR and microarray analyses are
consistent (Fig. 1), these data can
be used with confidence in further research.
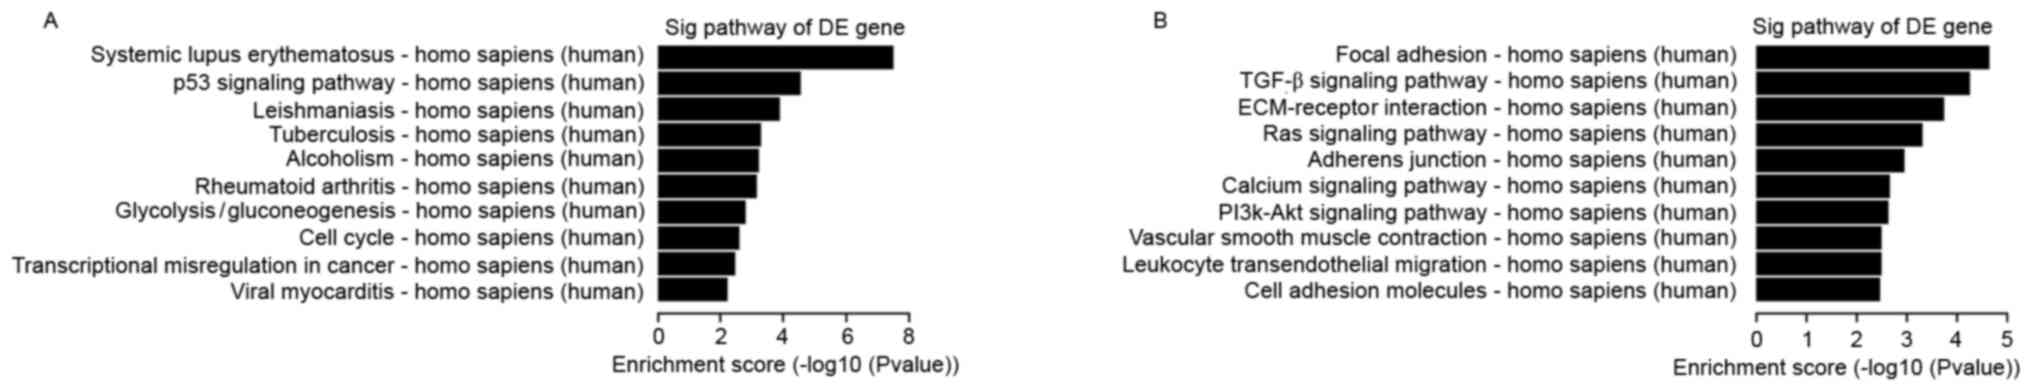
Pathway analysis
Pathway analysis is a functional method of mapping
genes to KEGG pathways (19). Based
on the KEGG database (http://www.genome.jp/kegg), KEGG pathway analysis was
employed for DE mRNAs. Each P-value denoted the significance of the
corresponding pathway, while the EASE Score, Fisher's P-value or
hypergeometric P-value denoted the significance of the pathway
correlated to the conditions. A low P-value indicated a marked
significance of the pathway (P-value cut-off, 0.05). The bar plots
in Fig. 2 show the top 10 enrichment
scores [-log10 (P-value)] of the significant enrichment pathway.
Fig. 2 presents the results of the
KEGG pathway analysis for the upregulated and downregulated
mRNAs.
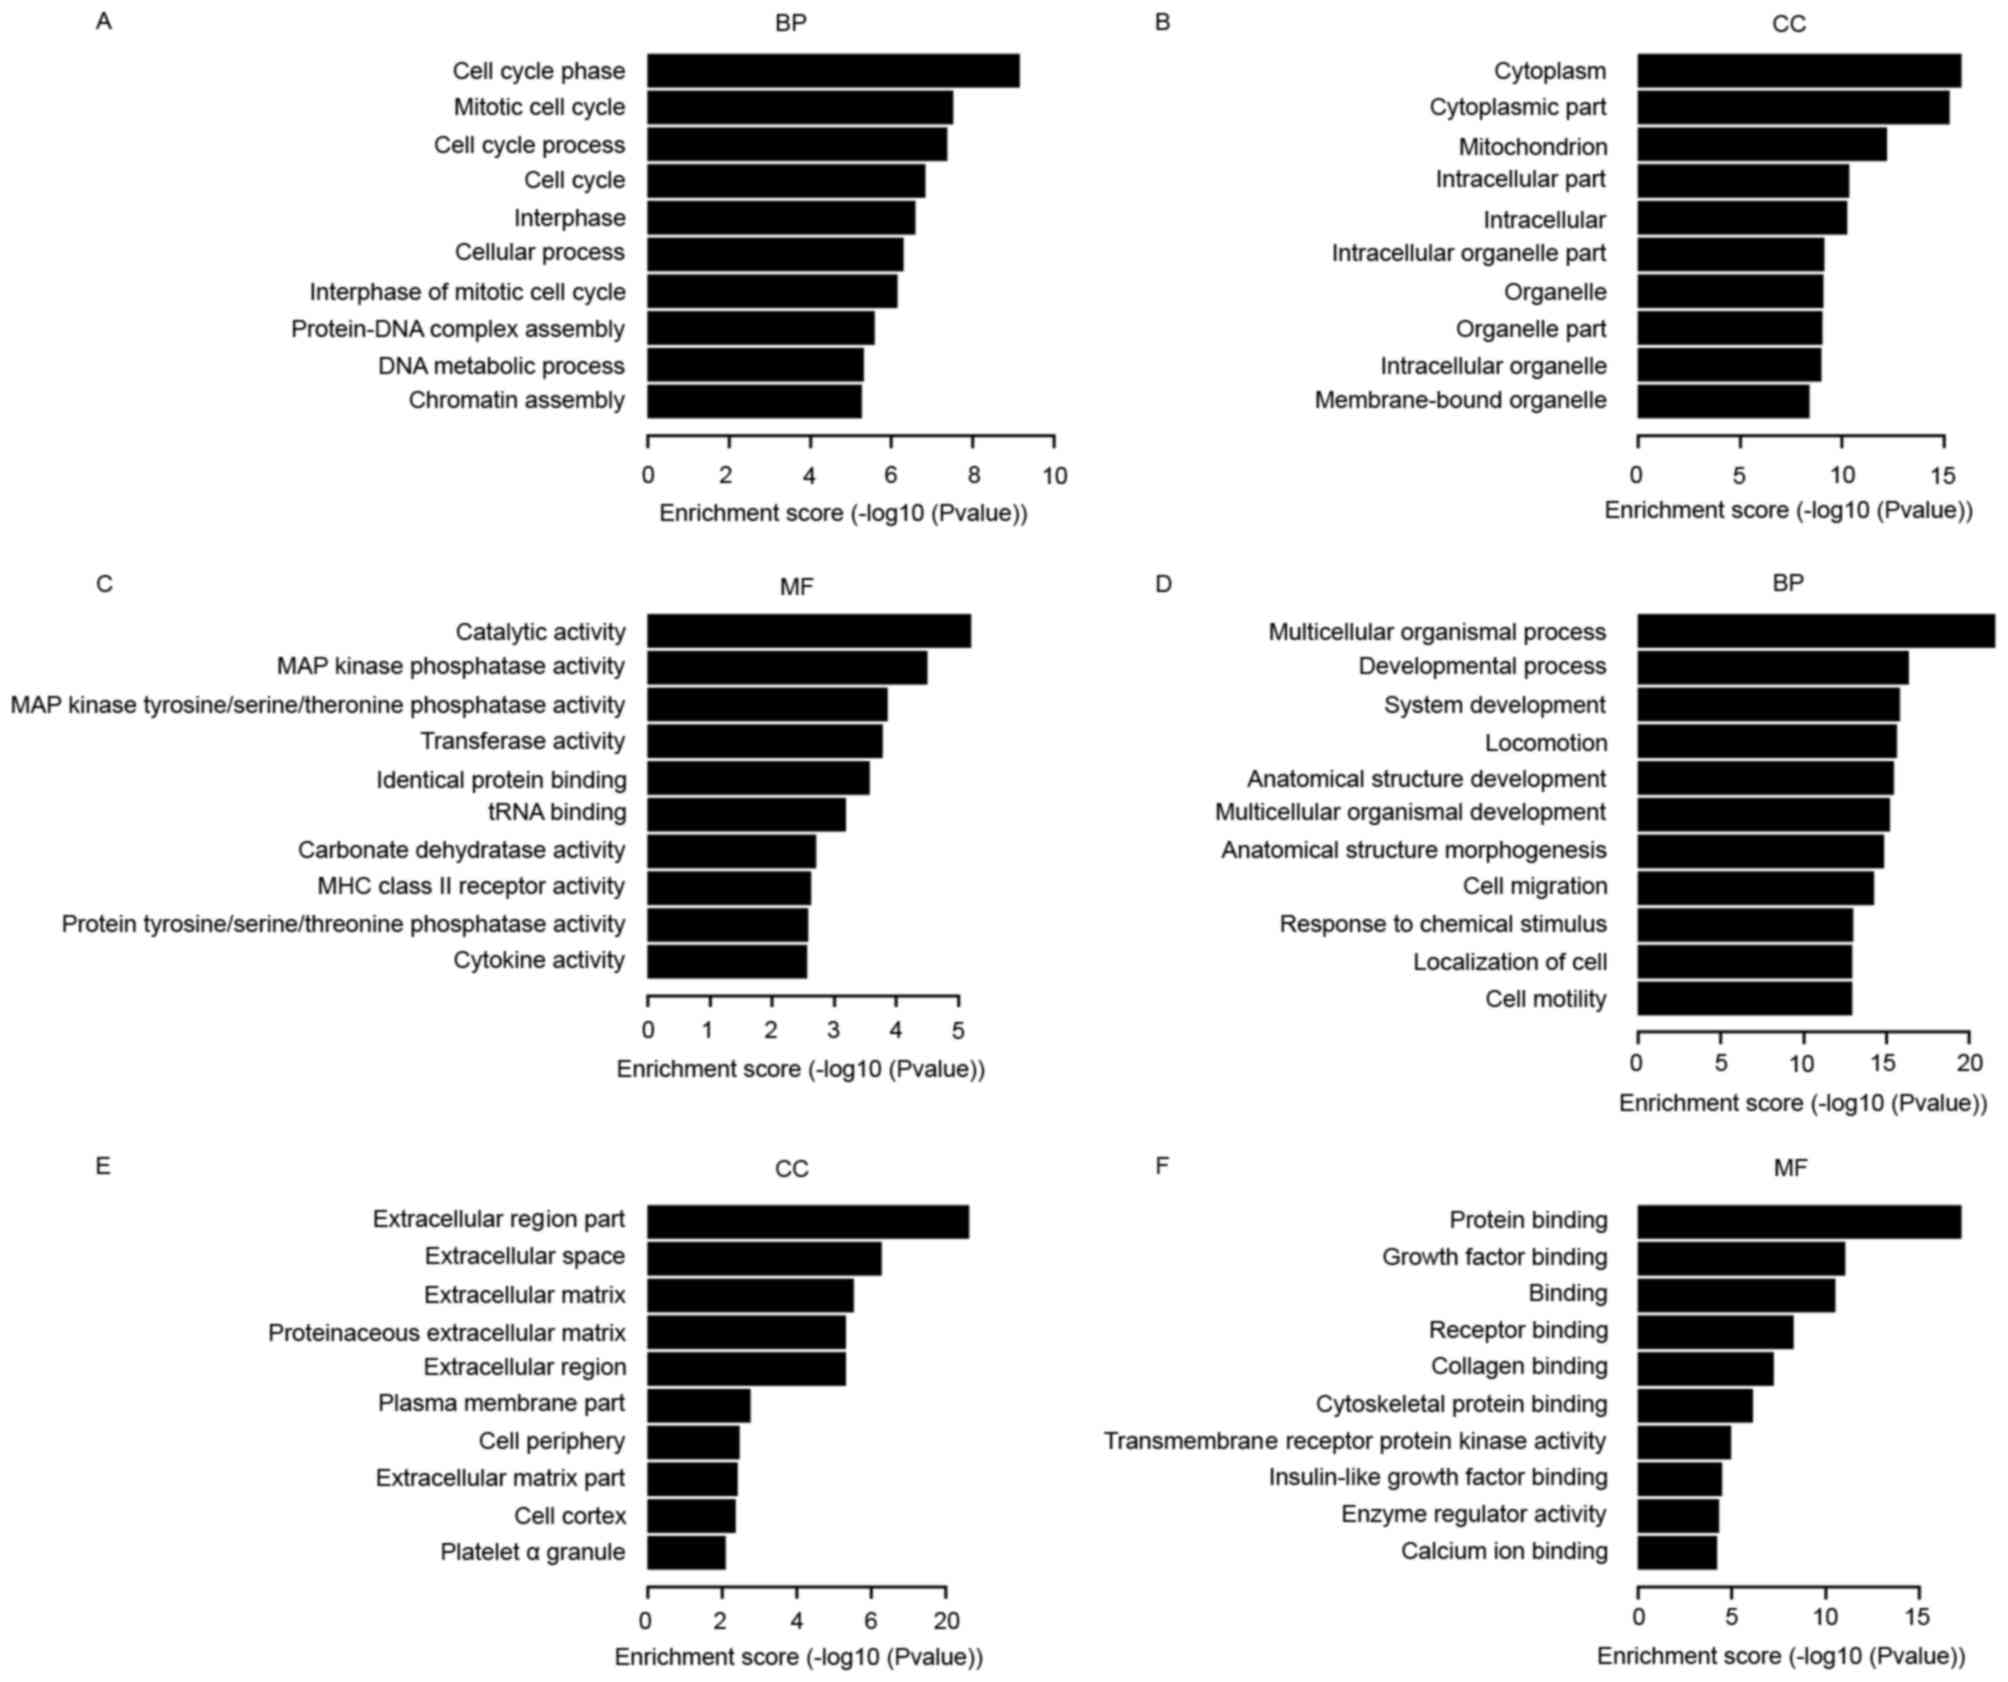
GO analysis
The GO project provides a controlled vocabulary to
describe gene and gene product attributes in any organism
(http://www.geneontology.org). The
ontology covers three domains: Biological processes, cellular
components and molecular function. Fisher's exact test is used to
determine if there are any more overlaps between the DE gene list
and the GO annotation list than what is expected by chance. The
P-value denotes the significance of enrichment of GO terms in the
DE genes. The lower the P-value, the more significant is the GO
term (P≤0.05 is recommended) (20).
The bar plots in Fig. 3 show the 10
most significant enrichment terms with the most number of DE
genes.
Discussion
As increasing research has focused on the function
of lncRNAs in epithelial ovarian cancer, an increasing number of
lncRNAs have been identified. For example, Gao et al
demonstrated that the lncRNA human ovarian cancer-specific
transcript 2 promotes tumor cell migration, invasion and
proliferation in epithelial ovarian cancer by modulating microRNA
let-7b availability (21). lncRNA H19
expression was inhibited by histone H1.3, which contributes to the
suppression of epithelial ovarian carcinogenesis (22). However, the genome-wide expression and
the biological functional significance of lncRNAs in epithelial
ovarian cancer remain unknown.
In the present study, microarray analysis was used
to compare lncRNA expression in epithelial ovarian cancer cells and
adjacent normal tissues, and 1221 DE lncRNAs (672 upregulated and
549 downregulated) were identified. These results were further
confirmed via RT-qPCR for eight randomly selected lncRNAs.
A previous study has reported that Hox transcript
antisense intergenic RNA (HOTAIR) is a 2.2-kb lncRNA located at the
HOXC locus (23). It has been
reported that suppression of HOTAIR expression in highly metastatic
epithelial ovarian cancer cell lines significantly reduced cell
invasion, and the HOTAIR expression levels were highly positively
correlated with the International Federation of Gynecology and
Obstetrics stage (24). The MEG3 gene
is located in chromosome 14q32 (25),
and is expressed in numerous normal tissues, but its expression
level has been reported by various previous studies to be either
downregulated or absent in a variety of tumor tissues, including
ovarian cancer cells and epithelial ovarian cancer tissues
(26–28). In the present study, HOTAIR was
upregulated and MEG3 was downregulated in epithelial ovarian cancer
vs. normal tissues. These results confirmed that HOTAIR and MEG3
serve a critical role in the occurrence, development and invasion
of epithelial ovarian cancer.
GAS5 is encoded at chromosome 1q25, and was
originally isolated from NIH-3T3 cells by subtractive hybridization
(29). Several recent studies have
shown that GAS5 is an lncRNA that functions as a tumor suppressor.
For example, Cao et al noticed that patients with cervical
cancer with reduced expression of GAS5 have significantly poorer
overall survival than those with higher GAS5 expression (30). Shi et al reported that GAS5
expression was downregulated in non-small cell lung cancer tissues
compared with that in noncancerous tissues, and was highly
associated with tumor size and tumor-node-metastasis stage
(31). However, in the present study,
it was observed that the expression of GAS5 was upregulated in
epithelial ovarian cancer compared with that in adjacent healthy
tissues. The majority of scholars agree that glucocorticoids serve
an important role in the regulation of ovarian epithelial function,
and they are closely associated with the occurrence and development
of ovarian cancer (32,33). In another study, glucocorticoids were
demonstrated to significantly inhibit the proliferation of human
ovarian cancer cells (34).
Therefore, it can be hypothesized that, as a glucocorticoid
receptor response element (GRE) analogue, GAS5 may be able to
inhibit glucocorticoid production by competing with GRE to
associate with the DNA-binding domain of the glucocorticoid
receptor (35).
To understand the function of the targets of DE
lncRNAs, GO terms and KEGG pathway annotation were applied in the
present study to the target gene pool. The GO analysis revealed
that the DE genes were associated with mitogen-activated protein
kinase phosphatase activity, major histocompatibility complex class
II receptor activity and DNA metabolic processes, which is
consistent with previous research (36–38).
Previous studies have demonstrated that signaling pathways,
including the Ras, p53 and transforming growth factor-β signaling
pathways, serve a critical role in the regulation of
pathophysiological processes in ovarian cancer (39–41). In
addition to these signaling pathways, the present study also
demonstrated that focal adhesion, extracellular matrix-receptor
interaction, cell adhesion molecules, cell cycle, transcriptional
misregulation in cancer and other signaling pathways were involved
in the pathogenesis of epithelial ovarian cancer.
In summary, the present study identified lncRNAs
that were aberrantly expressed in epithelial ovarian cancer
compared with their expression in matched normal tissue. Further
studies are required to reveal the possible biological functions
and mechanism of these lncRNAs.
Acknowledgements
The present study was supported by the Science and
Technology Development Foundation of Nanjing Medical University
(grant no. 2014NJMUZD050). The authors thank Kangchen Biotech Co.,
Ltd. (Shanghai, China) for their technical assistance.
References
|
1
|
Jemal A, Bray F, Center MM, Ferlay J, Ward
E and Forman D: Global cancer statistics. CA Cancer J Clin.
61:69–90. 2011. View Article : Google Scholar : PubMed/NCBI
|
|
2
|
Lowe KA, Chia VM, Taylor A, O'Malley C,
Kelsh M, Mohamed M, Mowat FS and Goff B: An international
assessment of ovarian cancer incidence and mortality. Gynecol
Oncol. 130:107–114. 2013. View Article : Google Scholar : PubMed/NCBI
|
|
3
|
Chiang YC, Chen CA, Chiang CJ, Hsu TH, Lin
MC, You SL, Cheng WF and Lai MS: Trends in incidence and survival
outcome of epithelial ovarian cancer: 30-year national
population-based registry in Taiwan. J Gynecol Oncol. 24:342–351.
2013. View Article : Google Scholar : PubMed/NCBI
|
|
4
|
Wang B, Liu SZ, Zheng RS, Zhang F, Chen WQ
and Sun XB: Time Trends of Ovarian Cancer Incidence in China. Asian
Pac J Cancer Prev. 15:191–193. 2014. View Article : Google Scholar : PubMed/NCBI
|
|
5
|
Lawrie TA, Bryant A, Cameron A, Gray E and
Morrison J: Pegylated liposomal doxorubicin for relapsed epithelial
ovarian cancer. Cochrane Database Syst Rev: CD006910. 2013.
View Article : Google Scholar
|
|
6
|
Gadducci A, Cosio S, Zola P, Landoni F,
Maggino T and Sartori E: Surveillance procedures for patients
treated for epithelial ovarian cancer: A review of the literature.
Int J Gynecol Cancer. 17:21–31. 2007. View Article : Google Scholar : PubMed/NCBI
|
|
7
|
Adams SV, Quraishi SM, Shafer MM,
Passarelli MN, Freney EP, Chlebowski RT, Luo J, Meliker JR, Mu L,
Neuhouser ML and Newcomb PA: Dietary cadmium exposure and risk of
breast, endometrial and ovarian cancer in the Women's Health
Initiative. Environ Health Perspect. 122:594–600. 2014.PubMed/NCBI
|
|
8
|
Schock H, Surcel HM, Zeleniuch-Jacquotte
A, Grankvist K, Lakso HÅ, Fortner RT, Kaaks R, Pukkala E, Lehtinen
M, Toniolo P and Lundin E: Early pregnancy sex steroids and
maternal risk of epithelial ovarian cancer. Endocr Relat Cancer.
21:831–844. 2014. View Article : Google Scholar : PubMed/NCBI
|
|
9
|
Haruta S, Furukawa N, Yoshizawa Y, Tsunemi
T, Nagai A, Kawaguchi R, Tanase Y, Yoshida S and Kobayashi H:
Molecular genetics and epidemiology of epithelial ovarian cancer.
Oncol Rep. 26:1347–1356. 2011.PubMed/NCBI
|
|
10
|
Costa FF: Non-coding RNAs, epigenetics and
complexity. Gene. 410:9–17. 2008. View Article : Google Scholar : PubMed/NCBI
|
|
11
|
Taft RJ, Pang KC, Mercer TR, Dinger M and
Mattick JS: Non-coding RNAs: Regulators of disease. J Pathol.
220:126–139. 2010. View Article : Google Scholar : PubMed/NCBI
|
|
12
|
Hung T and Chang HY: Long noncoding RNA in
genome regulation: Prospects and mechanisms. RNA Biol. 7:582–585.
2010. View Article : Google Scholar : PubMed/NCBI
|
|
13
|
Bonasio R and Shiekhattar R: Regulation of
transcription by long noncoding RNAs. Annu Rev Genet. 48:433–455.
2014. View Article : Google Scholar : PubMed/NCBI
|
|
14
|
Haemmerle M and Gutschner T: Long
non-coding RNAs in cancer and development: Where do we go from
here? Int J Mol Sci. 16:1395–1405. 2015. View Article : Google Scholar : PubMed/NCBI
|
|
15
|
Kunej T, Obsteter J, Pogacar Z, Horvat S
and Calin GA: The decalog of long non-coding RNA involvement in
cancer diagnosis and monitoring. Crit Rev Clin Lab Sci. 51:344–357.
2014. View Article : Google Scholar : PubMed/NCBI
|
|
16
|
Zuo C, Wang Z, Lu H, Dai Z, Liu X and Cui
L: Expression profiling of lncRNAs in C3H10T1/2 mesenchymal stem
cells undergoing early osteoblast differentiation. Mol Med Rep.
8:463–467. 2013.PubMed/NCBI
|
|
17
|
Li J, Long W, Li Q, Zhou Q, Wang Y, Wang
H, Zhou B and Li J: Distinct expression profiles of lncRNAs between
regressive and mature scars. Cell Physiol Biochem. 35:663–675.
2015. View Article : Google Scholar : PubMed/NCBI
|
|
18
|
Livak KJ and Schmittgen TD: Analysis of
relative gene expression data using real-time quantitative PCR and
the 2(−Delta Delta C(T)) Method. Methods. 25:402–408. 2001.
View Article : Google Scholar : PubMed/NCBI
|
|
19
|
Kanehisa M: Molecular network analysis of
diseases and drugs in KEGG. Methods Mol Biol. 939:263–275. 2013.
View Article : Google Scholar : PubMed/NCBI
|
|
20
|
Gu S, Li G, Zhang X, Yan J, Gao J, An X,
Liu Y and Su P: Aberrant expression of long noncoding RNAs in
chronic thromboembolic pulmonary hypertension. Mol Med Rep.
11:2631–2643. 2015.PubMed/NCBI
|
|
21
|
Gao Y, Meng H, Liu S, Hu J, Zhang Y, Jiao
T, Liu Y, Ou J, Wang D, Yao L, et al: LncRNA-HOST2 regulates cell
biological behaviors in epithelial ovarian cancer through a
mechanism involving microRNA let-7b. Hum Mol Genet. 24:841–852.
2015. View Article : Google Scholar : PubMed/NCBI
|
|
22
|
Medrzycki M, Zhang Y, Zhang W, Cao K, Pan
C, Lailler N, McDonald JF, Bouhassira EE and Fan Y: Histone h1.3
suppresses h19 noncoding RNA expression and cell growth of ovarian
cancer cells. Cancer Res. 74:6463–6473. 2014. View Article : Google Scholar : PubMed/NCBI
|
|
23
|
Rinn JL, Kertesz M, Wang JK, Squazzo SL,
Xu X, Brugmann SA, Goodnough LH, Helms JA, Farnham PJ, Segal E and
Chang HY: Functional demarcation of active and silent chromatin
domains in human HOX loci by noncoding RNAs. Cell. 129:1311–1323.
2007. View Article : Google Scholar : PubMed/NCBI
|
|
24
|
Qiu JJ, Lin YY, Ye LC, Ding JX, Feng WW,
Jin HY, Zhang Y, Li Q and Hua KQ: Overexpression of long non-coding
RNA HOTAIR predicts poor patient prognosis and promotes tumor
metastasis in epithelial ovarian cancer. Gynecol Oncol.
134:121–128. 2014. View Article : Google Scholar : PubMed/NCBI
|
|
25
|
Miyoshi N, Wagatsuma H, Wakana S,
Shiroishi T, Nomura M, Aisaka K, Kohda T, Surani MA, Kaneko-Ishino
T and Ishino F: Identification of an imprinted gene, Meg3/Gtl2 and
its human homologue MEG3, first mapped on mouse distal chromosome
12 and human chromosome 14q. Genes Cells. 5:211–220. 2000.
View Article : Google Scholar : PubMed/NCBI
|
|
26
|
Zhang X, Zhou Y, Mehta KR, Danila DC,
Scolavino S, Johnson SR and Klibanski A: A pituitary-derived MEG3
isoform functions as a growth suppressor in tumor cells. J Clin
Endocrinol Metab. 88:5119–5126. 2003. View Article : Google Scholar : PubMed/NCBI
|
|
27
|
Huarte M, Guttman M, Feldser D, Garber M,
Koziol MJ, Kenzelmann-Broz D, Khalil AM, Zuk O, Amit I, Rabani M,
et al: A large intergenic noncoding RNA induced by p53 mediates
global gene repression in the p53 response. Cell. 142:409–419.
2010. View Article : Google Scholar : PubMed/NCBI
|
|
28
|
Sheng X and Li J, Yang L, Chen Z, Zhao Q,
Tan L, Zhou Y and Li J: Promoter hypermethylation influences the
suppressive role of maternally expressed 3, a long non-coding RNA,
in the development of epithelial ovarian cancer. Oncol Rep.
32:277–285. 2014.PubMed/NCBI
|
|
29
|
Schneider C, King RM and Philipson L:
Genes specifically expressed at growth arrest of mammalian cells.
Cell. 54:787–793. 1988. View Article : Google Scholar : PubMed/NCBI
|
|
30
|
Cao S, Liu W, Li F, Zhao W and Qin C:
Decreased expression of lncRNA GAS5 predicts a poor prognosis in
cervical cancer. Int J Clin Exp Pathol. 7:6776–6783.
2014.PubMed/NCBI
|
|
31
|
Shi X, Sun M, Liu H, Yao Y, Kong R, Chen F
and Song Y: A critical role for the long non-coding RNA GAS5 in
proliferation and apoptosis in non-small-cell lung cancer. Mol
Carcinog. 54:E1–E12. 2015. View
Article : Google Scholar : PubMed/NCBI
|
|
32
|
Melhem A, Yamada SD, Fleming GF, Delgado
B, Brickley DR, Wu W, Kocherginsky M and Conzen SD: Administration
of glucocorticoids to ovarian cancer patients is associated with
expression of the anti-apoptotic genes SGK1 and MKP1/DUSP1 in
ovarian tissues. Clin Cancer Res. 15:3196–3204. 2009. View Article : Google Scholar : PubMed/NCBI
|
|
33
|
Dickinson RE, Fegan KS, Ren X, Hillier SG
and Duncan WC: Glucocorticoid regulation of SLIT/ROBO tumour
suppressor genes in the ovarian surface epithelium and ovarian
cancer cells. PLoS One. 6:e277922011. View Article : Google Scholar : PubMed/NCBI
|
|
34
|
Xu MJ, Fang GE, Liu YJ and Song LN:
Effects of glucocorticoid on proliferation, differentiation and
glucocorticoid receptor expression in human ovarian carcinoma cell
line 3AO. Acta Pharmacol Sin. 23:819–823. 2002.PubMed/NCBI
|
|
35
|
Kino T, Hurt DE, Ichijo T, Nader N and
Chrousos GP: Noncoding RNA gas5 is a growth arrest- and
starvation-associated repressor of the glucocorticoid receptor. Sci
Signal. 3:ra82010. View Article : Google Scholar : PubMed/NCBI
|
|
36
|
Beauchamp MC, Yasmeen A, Knafo A and
Gotlieb WH: Targeting insulin and insulin-like growth factor
pathways in epithelial ovarian cancer. J Oncol. 2010:2570582010.
View Article : Google Scholar : PubMed/NCBI
|
|
37
|
Dadmarz RD, Ordoubadi A, Mixon A, Thompson
CO, Barracchini KC, Hijazi YM, Steller MA, Rosenberg SA and
Schwartzentruber DJ: Tumor-infiltrating lymphocytes from human
ovarian cancer patients recognize autologous tumor in an MHC class
II-restricted fashion. Cancer J Sci Am. 2:263–272. 1996.PubMed/NCBI
|
|
38
|
Beesley J, Jordan SJ, Spurdle AB, Song H,
Ramus SJ, Kjaer SK, Hogdall E, DiCioccio RA, McGuire V, Whittemore
AS, et al: Association between single-nucleotide polymorphisms in
hormone metabolism and DNA repair genes and epithelial ovarian
cancer: results from two Australian studies and an additional
validation set. Cancer Epidemiol Biomarkers Prev. 16:2557–2565.
2007. View Article : Google Scholar : PubMed/NCBI
|
|
39
|
Mei FC, Young TW, Liu J and Cheng X:
RAS-mediated epigenetic inactivation of OPCML in oncogenic
transformation of human ovarian surface epithelial cells. FASEB J.
20:497–499. 2006.PubMed/NCBI
|
|
40
|
Li J, Zhang Y, Gao Y, Cui Y, Liu H, Li M
and Tian Y: Downregulation of HNF1 homeobox B is associated with
drug resistance in ovarian cancer. Oncol Rep. 32:979–988.
2014.PubMed/NCBI
|
|
41
|
Ji M, Shi H, Xie Y, Zhao Z, Li S, Chang C,
Cheng X and Li Y: Ubiquitin specific protease 22 promotes cell
proliferation and tumor growth of epithelial ovarian cancer through
synergy with transforming growth factor β1. Oncol Rep. 33:133–140.
2015.PubMed/NCBI
|