Introduction
According to the American Cancer Society, colorectal
cancer (CRC) is currently the third most malignant cancer in the
United States among males and females (1). In the EU, CRC is the second most common
cause of cancer-associated mortality in males, following lung
cancer, and the third most frequent cause of cancer-associated
mortality in females, following breast and lung cancer (2). In Japan, the number of patients with CRC
has doubled in the past 20 years to become the second-leading cause
of cancer-associated mortality (3).
CRC is a heterogeneous disease that occurs via a
complex series of molecular events; a number of genes have
previously been demonstrated to have a role in the development of
the healthy mucosa of the large intestine into a benign tumor,
which then transforms into an invasive cancer (4).
Previous comprehensive studies of >13,000 genes
have identified 69 genes that are associated with the pathogenesis
of CRC (4), and detailed analysis has
revealed that an average of 9 mutant genes are involved in each
case of CRC (5). Early CRC detection
and the monitoring of patient prognosis are crucial to improve the
survival rates of patients with CRC. However, the specimens and
array analysis methods reported in previous studies have been
problematic for the early diagnosis and monitoring of prognosis,
and are not yet suitable for clinical use (4–6).
The development of microarray technology has
facilitated the high-throughput analysis of numerous gene
expression patterns (5,6). CRC-specific gene expression profiles
have been identified in mRNA (5,7–10). Furthermore, the analysis of non-coding
RNA, including microRNA (miRNA) and antisense RNA, which cannot
serve as templates for direct protein synthesis, has revealed
associations between non-coding RNAs and the occurrence of certain
types of cancer (11–13). Our previous studies demonstrated the
potential involvement of antisense RNA expression profiles in the
development of CRC and hepatic cancer by examining the expression
patterns of specific RNAs in cancerous and healthy tissues
(14,15).
Blood samples are ideal for detection of certain
types of cancer (12,13) and the monitoring of prognosis;
therefore, the present study evaluated RNA expression levels in the
blood cells of patients, in order to determine their effectiveness
in distinguishing cancerous states and healthy states. The current
study identified that certain antisense RNA species in blood cells
cluster separately in patients with CRC and healthy volunteers, and
revealed that one of these RNA species may serve as a biomarker for
prognosis.
Materials and methods
Patients and blood samples
Blood samples were collected from 6 healthy
volunteers and from 28 patients with CRC who underwent surgical
resection between April 2006 and March 2009 at Tsukuba University
Hospital (Tsukuba, Japan). Blood sampling was periodically
conducted up until 12 weeks after surgical resection. None of the
patients had received radiotherapy or chemotherapy prior to
surgery. The primary clinical characteristics for each patient with
CRC involved in the current study are presented in Table I. Informed consent was obtained from
all patients for the collection of blood samples and the ethics
committee of Tsukuba University Hospital approved the study
protocol.
 | Table I.Clinical characteristics of patients
with colorectal cancer evaluated using microarray analysis
(n=28). |
Table I.
Clinical characteristics of patients
with colorectal cancer evaluated using microarray analysis
(n=28).
| Variable | Value |
|---|
| Gender, n |
|
| Male | 21 |
|
Female | 7 |
| Median
age (range), years | 60 (37–86) |
| Tumor location,
n |
|
|
Colon | 14 |
|
Rectum | 14 |
| AJCC stage, n |
|
| I | 9 |
| II | 9 |
| III | 6 |
| IV | 4 |
| Other samples, n |
|
| 1 week
post-surgery samples | 4 |
| 3 months
post-surgery samples | 8 |
|
Volunteers (non-cancer
patients) | 6 |
Total RNA extraction from blood
cells
Blood samples were collected from the patients using
PAXgene Vacutainer tubes (BD Biosciences, Franklin Lakes, NJ, USA)
and subjected to RNA isolation and extraction using a PAXgene Blood
RNA Isolation kit (Qiagen, Inc., Valencia, CA, USA), following the
manufacturer's instructions. The quantity of total RNA obtained was
determined using a NanoDrop Spectrophotometer (NanoDrop
Technologies; Thermo Fisher Scientific, Inc., Waltham, MA, USA)
according to the 280/260 nm absorbance ratio, and RNA integrity was
evaluated using an RNA 6000 Nano LabChip kit (Agilent Technologies,
Inc., Santa Clara, CA, USA) and an Agilent 2100 Bioanalyzer
(Agilent Technologies, Inc.).
Microarray analysis
Cyanine 3 (Cy3)-labeled cDNA was synthesized from 10
µg total RNA extracted from the blood samples using a LabelStar
Array kit (Qiagen, Inc.) with Cy3-dUTP (GE Healthcare Bio-Sciences,
Pittsburgh, PA, USA) and random nonamer primers. The labeled cDNA
was hybridized with probe sequences on an Agilent 44 Kx4 human
sense and antisense custom microarray slide (Agilent Technologies,
Inc.) (16) in a hybridization
solution prepared with an In Situ Hybridization Plus kit
(Agilent Technologies, Inc.), according to the manufacturer's
instructions. The Cy3 fluorescence signals were imaged using an
Agilent C DNA microarray scanner (Agilent Technologies, Inc.) and
processed using the Feature Extraction version 8.1 software
(Agilent Technologies, Inc.).
Statistical analysis
The microarray data were processed using the
GeneSpring GX version 12 software (Agilent Technologies, Inc.) to
perform the log transformations and the normalization of all values
to the 75th percentile of the respective microarray, followed by
normalization to the respective median expression level for all
samples. Additionally, the normalized gene expression data were
filtered on flags following the protocol of the manufacturer
GeneSpring GX (http://www.chem.agilent.com/cag/bsp/products/gsgx/manuals/GeneSpring-manual.pdf).
Only those genes classified as flag-present or flag-marginal in
>70% of all the array samples, were allowed to pass the filter.
The expression profiles of the RNA samples were analysed, using
GeneSpring GX version 12 software, with unpaired t-tests, with
Benjamini-Hochberg false discovery rate correction (17) for unequal variances, as described in
the results section. P<0.05 was considered to indicate a
statistically significant difference.
Two-dimensional hierarchical clustering based on
Euclidean distance measures was performed using Ward's method
(18). The data were visualized using
heat maps and dendrograms, as described previously (14). Sample trees were drawn horizontally
and gene trees were drawn vertically. Principal component analysis
(PCA) was used to identify and characterize trends in multigene
expression profiles.
Results
RNA quality
The quality of the RNAs obtained from the blood
samples of the healthy volunteers and patients with CRC were
initially examined using a NanoDrop Spectrophotometer at an
absorbance ratio of 280/260 nm, revealing that the ratios were
between 1.8 and 2.0. These results indicated that the total RNAs
prepared were usable for labeling with Cy3-dUTP and subsequent
microarray analysis. The integrity of the RNAs was then examined
using an Agilent 2100 Bioanalyzer, revealing that the Rin values of
the RNA samples ranged from 5.9 to 9.2. As the random priming
method was utilized for the synthesis of Cy3-labeled cDNAs from the
RNA samples, the lower Rin values were considered not to affect the
quality of the cDNAs for analysis.
Microarray analysis
Cy3-labeled cDNAs were synthesized from the
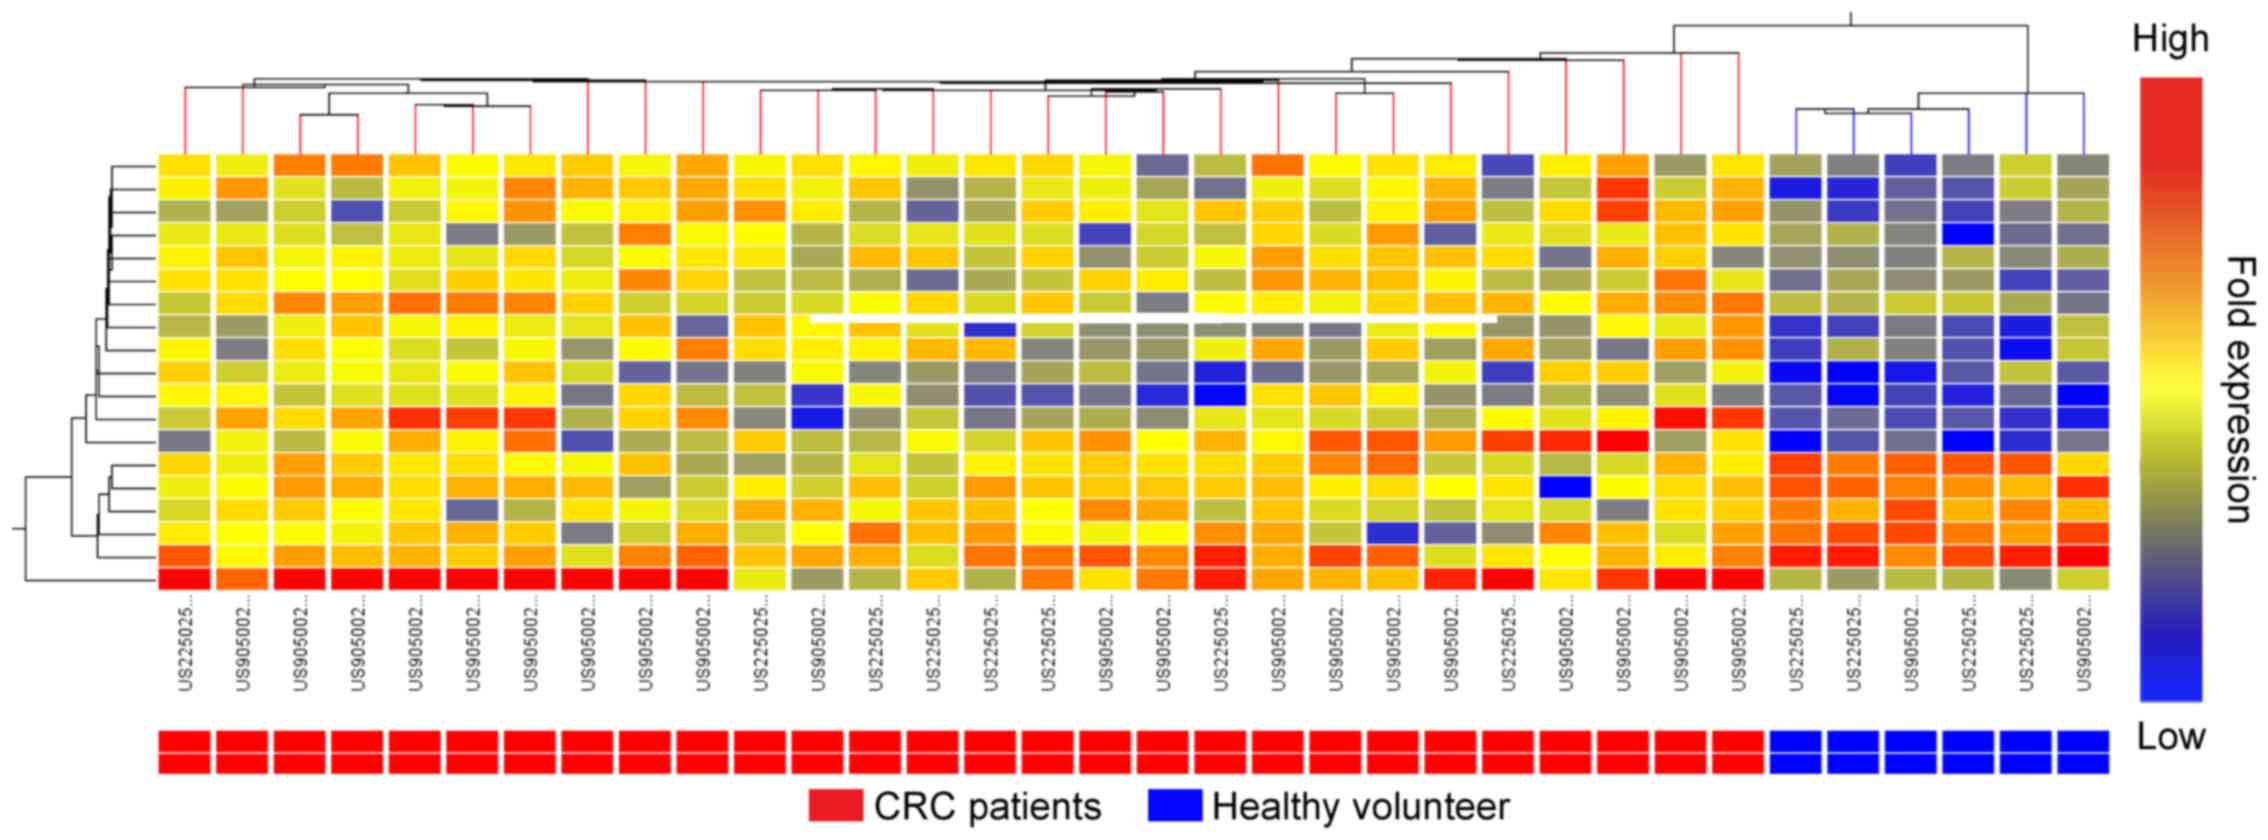
extracted RNA and subjected to microarray analysis. A total of 40
transcripts were identified as differentially expressed with a
magnitude of >2-fold (P<0.05) between the CRC blood cells and
non-cancerous blood cells; of these transcripts, 20 were sense
sequences and 20 were antisense sequences (Table II). According to the cluster
analysis, CRC and non-cancerous blood samples were revealed to form
separate clusters for the antisense transcripts, but not to form
separate clusters for the sense transcripts (Fig. 1; the clustering data for the sense
transcripts are not presented).
| Table II.Top 20 antisense transcripts
differentially regulated between blood cells from patients with
colorectal cancer and healthy volunteers. |
Table II.
Top 20 antisense transcripts
differentially regulated between blood cells from patients with
colorectal cancer and healthy volunteers.
| Accession number | Gene symbol | Gene name | Fold-change |
|---|
| NM_012080 | HDHD1 | Haloacid
dehalogenase-like hydrolase domain-containing 1 | 5.68 |
| NM_005824 | LRRC17 | Leucine-rich repeat
containing 17 | 4.38 |
| XR_016125 | LOC642337 | Similar to
hCG1648021 | 3.40 |
| NM_016630 | SPG21 | Spastic paraplegia
21 | 2.71 |
| XM_001132492 | LOC732276 | Hypothetical protein
LOC732276 | 2.54 |
| NM_175611 | GRIK1 | Glutamate receptor,
ionotropic, kainate 1 | 2.54 |
| NM_003290 | TPM4 | Tropomyosin 4 | 2.40 |
| NM_006516 | SLC2A1 | Solute carrier family
2, member 1 | 2.39 |
| NM_015317 | PUM2 | Pumilio homolog
2 | 2.36 |
| NM_024494 | WNT2B | Wingless-type MMTV
integration site family, member 2B | −2.35 |
| NM_025140 | CCDC92 | Coiled-coil
domain-containing 92 | 2.31 |
| NM_001037738 | NPM1 | Nucleophosmin 1 | 2.31 |
| NM_024860 | SETD6 | SET domain-containing
6 | 2.27 |
| NM_020179 | SMCO4 | Homo sapiens
chromosome 11 open reading frame 75 (C11orf75) | 2.25 |
| XR_016982 | LOC645280 | Hypothetical
LOC645280 | 2.21 |
| NM_025225 | PNPLA3 | Homo sapiens
patatin-like phospholipase domain-containing 3 | 2.20 |
| NM_021975 | RELA | Homo sapiens v-rel
avian reticuloendotheliosis viral oncogene homolog A | 2.03 |
| XM_926307 | LOC642927 | Similar to COLlagen
family member (col-36) | 2.02 |
| NM_172249 | CSF2RA | Homo sapiens colony
stimulating factor 2 receptor, alpha, low-affinity | 2.02 |
| NM_005206 | CPK | Homo sapiens v-crk
avian sarcoma virus CT10 oncogene homolog | 2.00 |
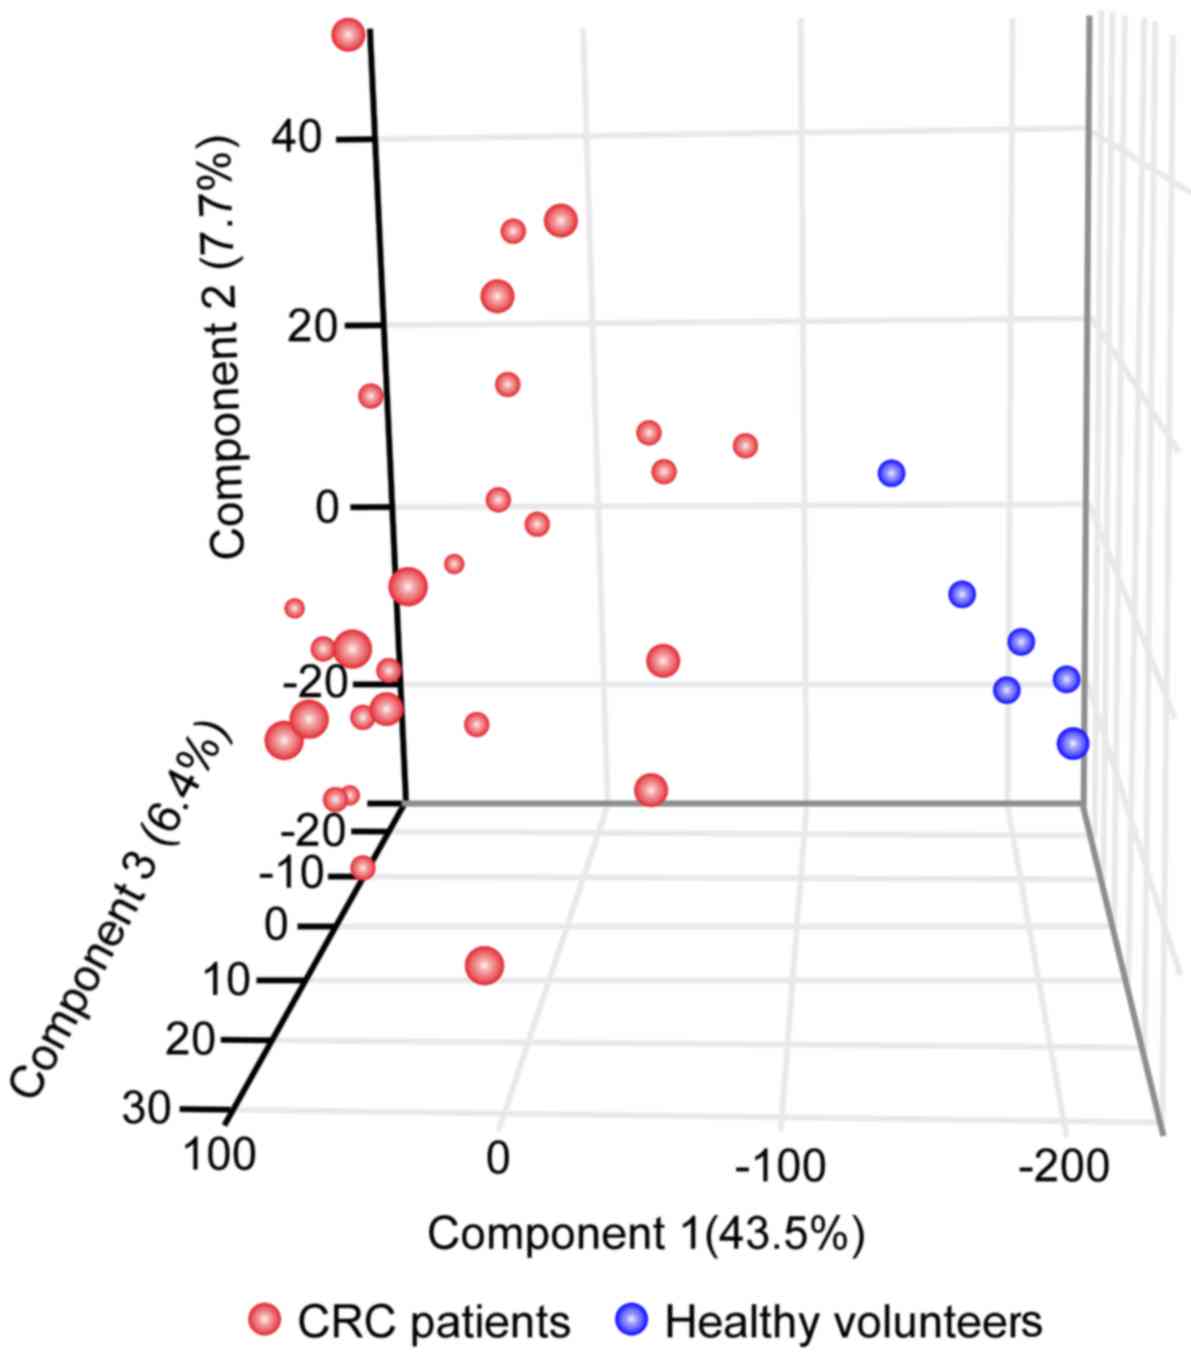
PCA for 28 patients with CRC using 20
antisense transcripts
As presented in Fig.
2, PCA analysis revealed that the CRC and non-cancerous blood
samples were well separated with the first principal component; its
contribution rate was ~43.5%. The contribution rates of the second
and third principal components were calculated to be ~7.7% and
~6.4%, respectively. These results indicate that the CRC and
non-cancerous blood samples were effectively separated with only
the first component.
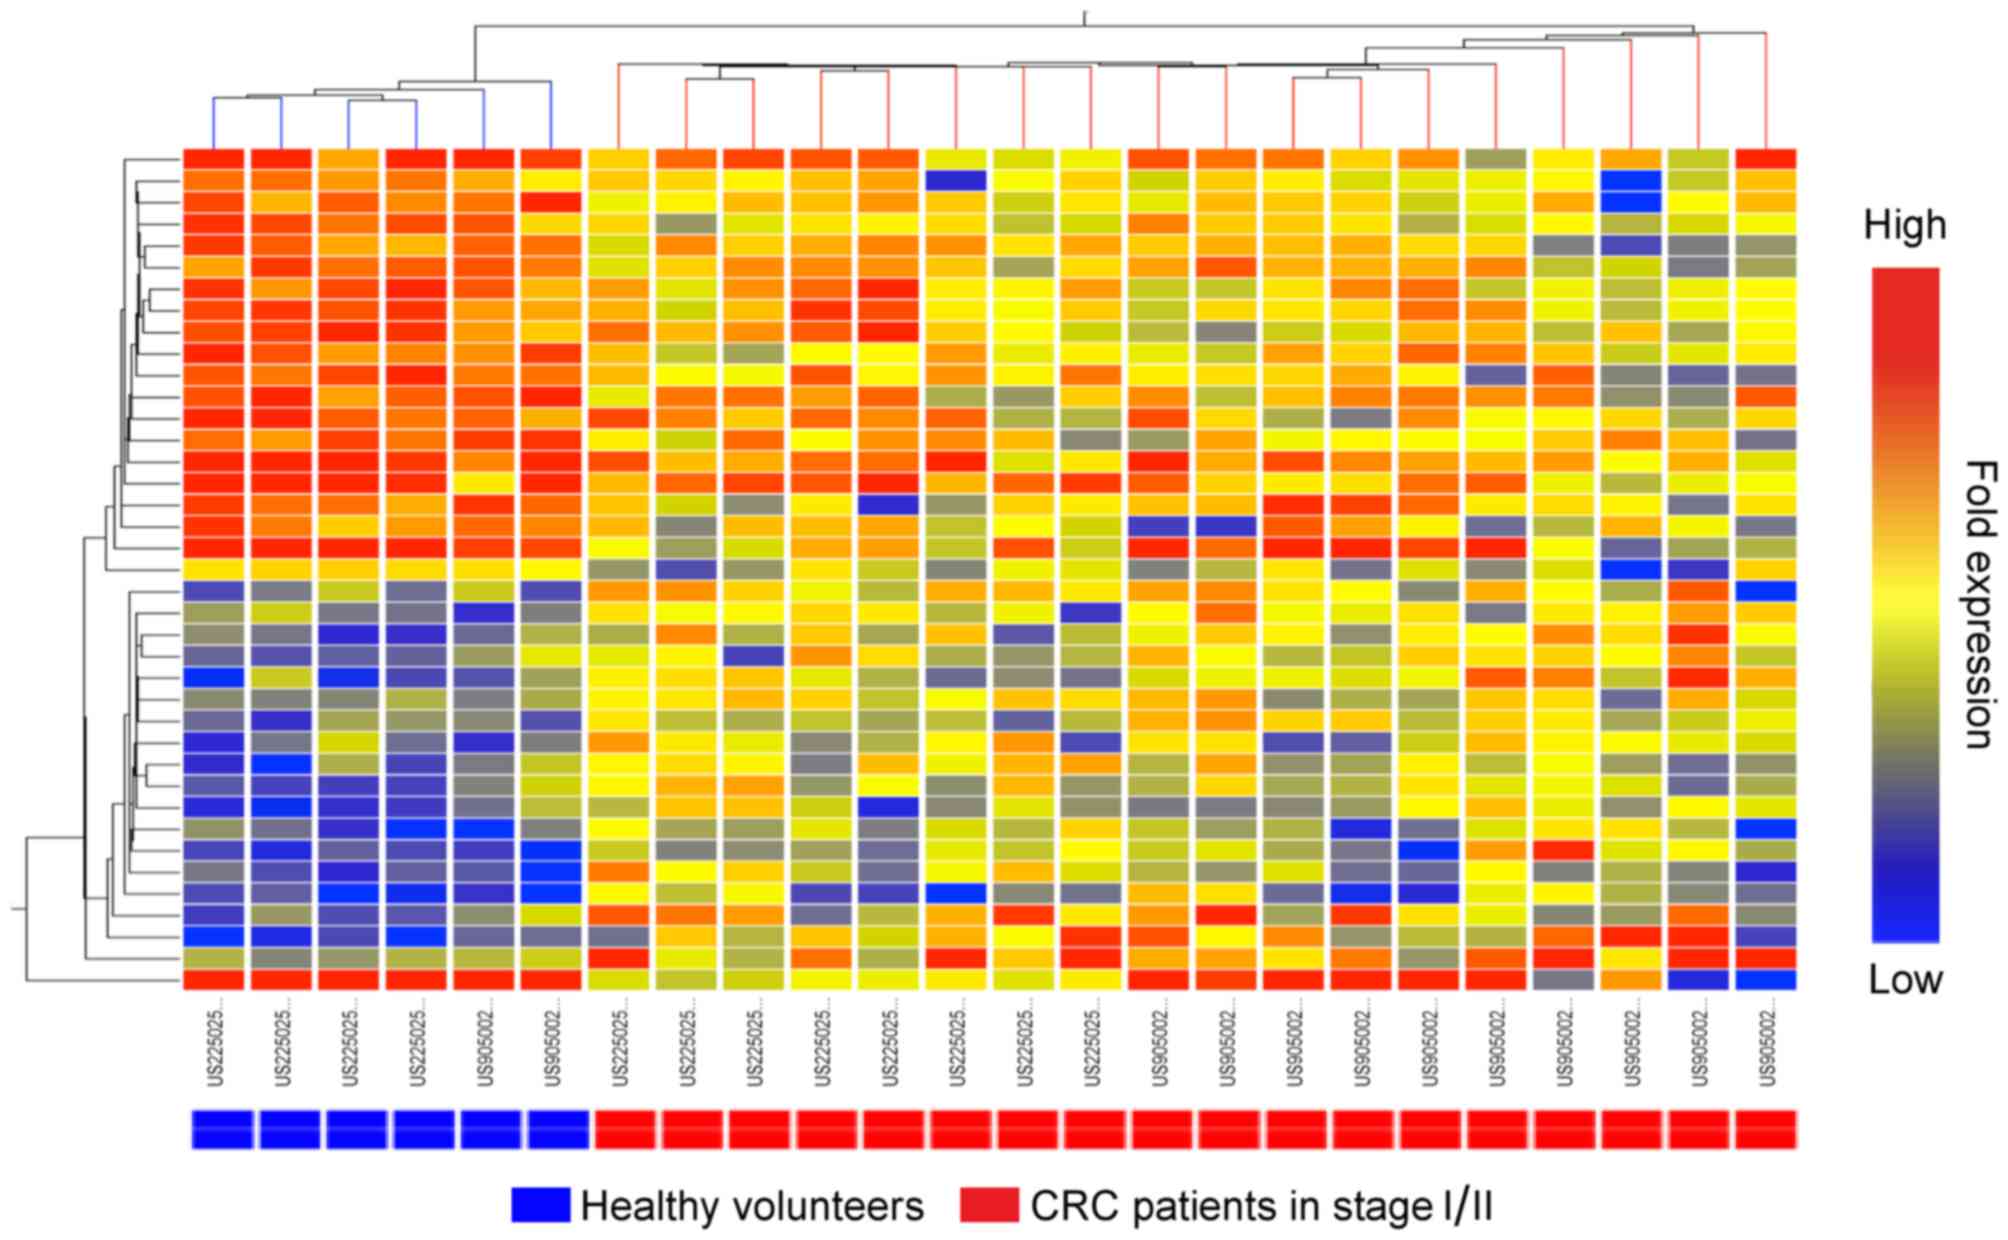
Hierarchical cluster analysis of
patients with stage I or II CRC
The results of the microarray with RNA samples from
patients with stage I and II CRC and controls revealed a total of
72 transcripts that were significantly differentially expressed
with a magnitude of >2-fold (P<0.01) between the blood cells
of healthy volunteers and of patients with CRC. A total of 33
transcripts were sense sequences and 39 were antisense sequences
(Table III). When the blood samples
from patients with stage I or II CRC and healthy volunteers were
subjected to cluster analysis for the aforementioned sense and
antisense transcripts, the patients were observed to form
respective clusters only with antisense transcripts (Fig. 3; the clustering data for the sense
transcripts are not presented).
| Table III.Top 39 antisense transcripts
differentially regulated between blood cells from patients with
stage I/II colorectal cancer and healthy volunteers. |
Table III.
Top 39 antisense transcripts
differentially regulated between blood cells from patients with
stage I/II colorectal cancer and healthy volunteers.
| Accession
number | Gene symbol | Gene name | Fold-change |
|---|
|
XM_001132487.1ea | LOC732271 | Hypothetical
protein LOC732271 | 6.24 |
| NM_005824.1ea | LRRC17 | Leucine-rich
repeat-containing 17 | 4.50 |
| NM_012080.3ea | HDHD1 | Haloacid
dehalogenase-like hydrolase domain-containing 1 | 3.57 |
| NM_024422.2ia | DSC2 | Desmocollin 2 | 2.94 |
| NM_174913.1ia | NOP9 | NOP9 nucleolar
protein | 2.92 |
| NM_016630.3ia | SPG21 | Spastic paraplegia
21 | 2.71 |
| NM_024494.1ia | WNT2B | Wingless-type MMTV
integration site family, member 2B | 2.61 |
| NM_175611.2ea | GRIK1 | Glutamate receptor,
ionotropic, kainate 1 | 2.54 |
| NM_014578.2ia | RHOD | Ras homolog family
member D | 2.54 |
| NM_006296.3ia | VRK2 | Vaccinia-related
kinase 2 | 2.47 |
| NM_139284.1ia | LGI4 | Leucine-rich repeat
LGI family | 2.44 |
| NM_001315.1ia | MAPK14 | Mitogen-activated
protein kinase 14 | 2.40 |
| XR_016125.1ea | LOC642337 | Similar to
hCG1648021 | 2.39 |
| NM_005618.2ia | DLL1 | Felta-like 1
(Drosophila) | 2.37 |
|
XM_001132492.1ea | LOC732276 | Hypothetical
protein LOC732276 | 2.36 |
| NM_025225.2ia | PNPLA3 | Patatin-like
phospholipase domain-containing 3 | 2.31 |
| NM_171846.1ea | LACTB | Lactamase, β | 2.31 |
| NR_002162.1ea | ATP5EP2 | Synthase, H+
transporting, mitochondrial F1 complex, epsilon subunit pseudogene
2 | 2.29 |
|
XM_001125928.1ea | LOC283804 | Similar to
testicular metalloprotease-like, disintegrin-like, Cysteine-rich
protein Iva | 2.25 |
|
XM_001129971.1ea | LOC729333 | Hypothetical
protein LOC729333 | 2.23 |
| NM_212554.2ia | METTL10 |
Methyltransferase-like 10 | 2.22 |
| NM_006516.1ia | SLC2A1 | Solute carrier
family 2, member 1 | 2.20 |
| NM_015317.1ia | PUM2 | Pumilio homolog
2 | 2.18 |
| XM_293121.4ea | C20orf66 | Chromosome 20 open
reading frame 66 | 2.15 |
| NM_003290.1ia | TPM4 | Tropomyosin 4 | 2.12 |
| XR_016982.1ea | LOC645280 | Hypothetical
LOC645280 | 2.12 |
| XR_018204.1ea | LOC647757 | Similar to
tetratricopeptide repeat protein 4 (TPR repeat protein 4) | 2.09 |
| NM_006708.1ia | GLO1 | Glyoxalase I | 2.08 |
| NM_020179.1ia | SMCO4 | Single-pass
membrane protein with coiled-coil domains 4 | 2.06 |
|
NM_001010898.1ia | SLC6A17 | Solute carrier
family 6 (neutral amino acid transporter), member 17 | 2.06 |
| NM_004423.3ia | DVL3 | Dishevelled segment
polarity protein 3 | 2.05 |
| NM_001093.2ia | ACACB | Acetyl-CoA
carboxylase β | 2.04 |
| NM_005751.3ia | AKAP9 | A kinase (PRKA)
anchor protein 9 | 2.04 |
| NM_025140.1ia | CCDC92 | Coiled-coil
domain-containing 92 | 2.04 |
| NM_017440.2ia | MDM1 | Mdm1 nuclear
protein homolog (mouse) | 2.04 |
| NM_000637.2ia | GSR | Glutathione
reductase | 2.03 |
| NM_080588.1ia | PTPN7 | Protein tyrosine
phosphatase, non-receptor type 7 | 2.02 |
| NM_024860.1ia | SETD6 | SET
domain-containing 6 | 2.01 |
| NM_005206.3ia | CRK | V-crk avian sarcoma
virus CT10 oncogene homolog | 2.01 |
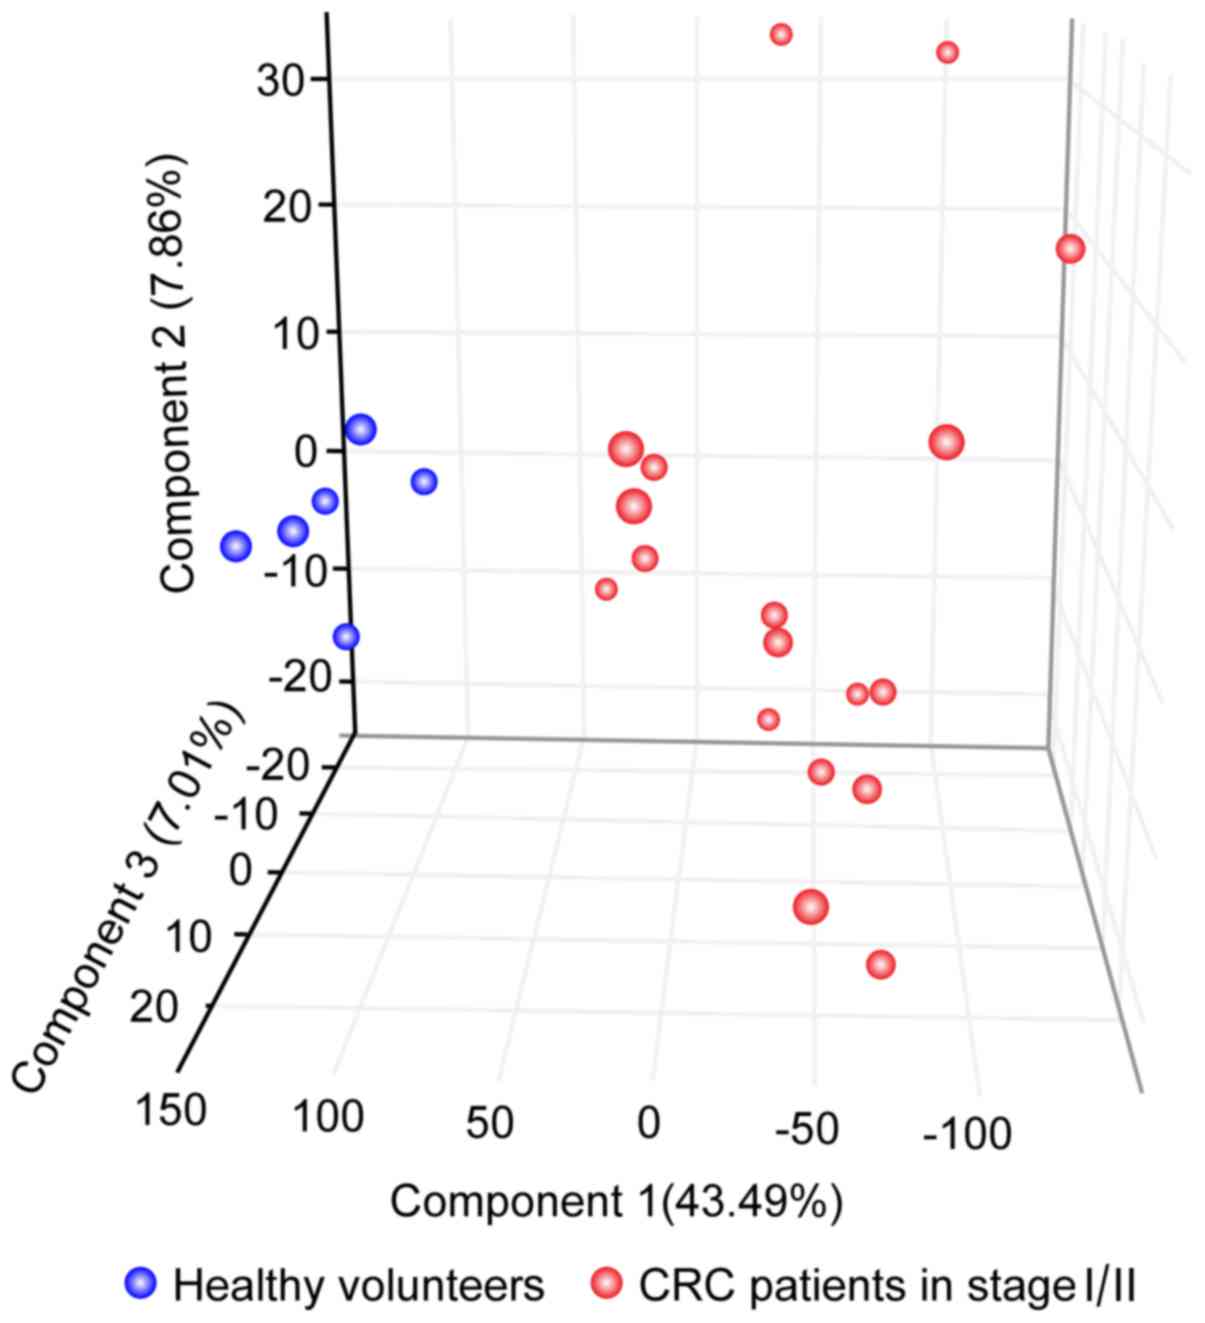
PCA with stage I or II CRC using 39
antisense transcripts
The 39 antisense transcripts were further examined
using PCA analysis. As presented in Fig.
4, CRC and non-cancerous RNA samples were revealed to be well
separated with regard to the first principal component; its
contribution rate was ~43.5%. The contribution rates of the second
and third principal components were calculated to be ~7.9% and
~7.0%, respectively. These results indicate that the patients with
stage I or II CRC were effectively separated from healthy
volunteers with the first component.
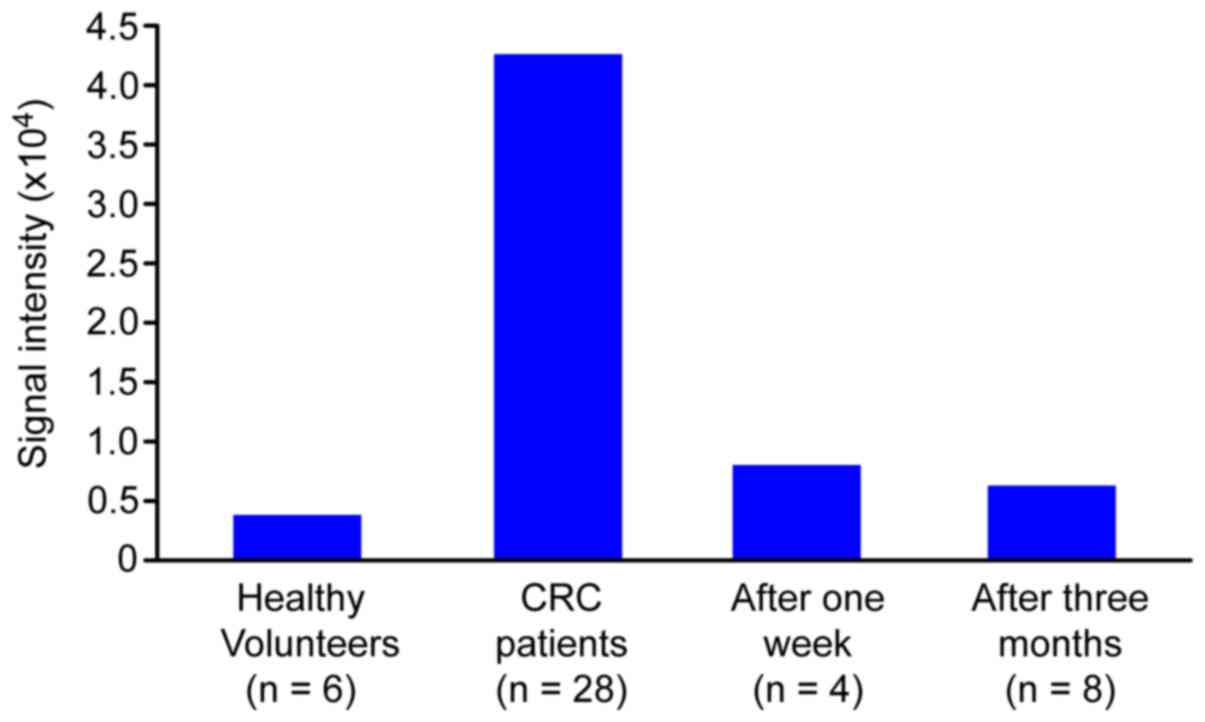
Comparison of HDHD1 antisense
transcript expression levels
The antisense transcript of haloacid
dehalogenase-like hydrolase 1 domain-containing (HDHD1), which was
the highest and third highest differentially expressed transcript
in the earlier analyses (Tables II
and III, respectively), was
selected for evaluation at various time points following the
surgical resection of tumor tissues from patients with CRC. The
expression levels of the HDHD1 antisense transcript at 1 week and
at 3 months post-surgery were decreased approximately to the
expression levels observed in healthy volunteers (Fig. 5). The results suggest that certain
antisense transcripts, including HDHD1, may serve as potential
biomarkers of CRC diagnosis and prognosis.
Discussion
Previous studies have identified the potential
involvement of antisense RNA expression in the development of
colorectal and hepatic cancers by examining RNA expression patterns
in cancerous and healthy tissues (14,15).
However, the functions and underlying mechanisms of antisense
transcripts in colorectal and hepatic cancers have yet to be
elucidated. The present study examined the association between the
expression levels of certain RNA transcripts in blood cells and the
occurrence of CRC, and the subsequent changes in the transcript
amount following the removal of cancerous tissues in patients. The
examinations revealed that antisense transcripts of up to 39 genes
demonstrated a clear association between their expression levels in
blood cells and the occurrence of CRC; following tumor resection in
patients with CRC, the expression levels of the HDHD1 antisense
transcript were decreased to approximately the levels observed in
healthy volunteers, suggesting that these antisense transcripts are
involved in the generation and maintenance of CRC. Furthermore, the
antisense transcripts may serve as diagnostic markers for CRC
occurrence, and certain antisense transcripts, including HDHD1, may
be potential prognostic markers for CRC.
The early detection of CRC significantly improves
patient prognosis and is essential in reducing CRC-associated
mortality (19) Patients with CRC
often present with an advanced stage disease and concomitant poor
prognosis (1). The best known serum
biomarkers, carcinoembryonic antigen (CEA) and carbohydrate antigen
19-9 (CA19-9), are not recommended for clinical screening due to
limited specificity and sensitivity (20). A number of circulating proteins have
previously been indicated to be diagnostically useful; however,
none of these proteins has individually demonstrated sufficient
sensitivity or specificity to be used in clinical practice
(20).
In our previous study, the expression levels of
certain antisense transcripts in CRC tissues were revealed to
significantly differ from their corresponding normal tissues
(14), indicating that those specific
antisense transcripts may be involved in the generation and
maintenance of CRC tumor tissues. The antisense transcripts in CRC
tissues are distinct from those identified in the present study of
patients with CRC. Further studies are required to determine the
functional association between the antisense transcripts revealed
in our previous study and those in the present study.
Previous studies have indicated that certain
antisense transcripts are involved in mRNA stabilization (21), the suppression of mRNA synthesis
(22,23), miRNA functions (24) and the promotion of protein synthesis
(25). Therefore, antisense
transcripts have various functions, each of which may be specific
to the respective antisense transcript species. Although the
functions of non-coding RNA, antisense RNA and miRNA in
tumorigenesis require further study, it is possible that the
various antisense transcripts demonstrated in the present study may
serve as potential biomarkers for CRC diagnosis and prognosis. In
the future, the mechanisms underlying the differences in expression
levels of the antisense transcripts should be investigated
extensively to understand their involvement in CRC generation.
Acknowledgements
This study was supported in part by the Ministry of
Education, Culture, Sports, Science and Technology of Japan.
References
|
1
|
Jemal A, Siegel R, Xu J and Ward E: Cancer
Statistics, 2010. CA Cancer J Clin. 60:277–300. 2010. View Article : Google Scholar : PubMed/NCBI
|
|
2
|
Malvezzi M, Bertuccio P, Levi F, La
Vecchia C and Negri E: European cancer mortality predictions for
the year 2014. Ann Oncol. 25:1650–1656. 2014. View Article : Google Scholar : PubMed/NCBI
|
|
3
|
Tsukuma H, Ajiki W and Oshima A: Cancer
incidence in Japan. Gan To Kagaku Ryoho. 31:840–846. 2004.(In
Japanese). PubMed/NCBI
|
|
4
|
Koehler A, Bataille F, Schmid C, Ruemmele
P, Waldeck A, Blaszyk H, Hartmann A, Hofstaedter F and Dietmaier W:
Gene expression profiling of colorectal cancer and metastases
divides tumours according to their clinicopathological stage. J
Pathol. 204:65–74. 2004. View Article : Google Scholar : PubMed/NCBI
|
|
5
|
Croner RS, Foertsch T, Brueckl WM,
Guenther K, Siebenhaar R, Stremmel C, Matzel KE, Papadopoulos T,
Kirchner T, Behrens J, et al: Common denominator genes that
distinguish colorectal carcinoma from normal mucosa. Int J
Colorectal Dis. 20:353–362. 2005. View Article : Google Scholar : PubMed/NCBI
|
|
6
|
Raetz EA and Moos PJ: Impact of microarray
technology in clinical oncology. Cancer Invest. 22:312–320. 2004.
View Article : Google Scholar : PubMed/NCBI
|
|
7
|
Ohmachi T, Tanaka F, Mimori K, Inoue H,
Yanaga K and Mori M: Clinical significance of TROP2 expression in
colorectal cancer. Clin Cancer Res. 12:3057–3063. 2006. View Article : Google Scholar : PubMed/NCBI
|
|
8
|
Bertucci F, Salas S, Eysteries S, Nasser
V, Finetti P, Ginestier C, Charafe-Jauffret E, Loriod B, Bachelart
L, Montfort J, et al: Gene expression profiling of colon cancer by
DNA microarrays and correlation with histoclinical parameters.
Oncogene. 23:1377–1391. 2004. View Article : Google Scholar : PubMed/NCBI
|
|
9
|
Bianchini M, Levy E, Zucchini C, Pinski V,
Macagno C, De Sanctis P, Valvassori L, Carinci P and Mordoh J:
Comparative study of gene expression by cDNA microarray in human
colorectal cancer tissues and normal mucosa. Int J Oncol. 29:83–94.
2006.PubMed/NCBI
|
|
10
|
Birkenkamp-Demtroder K, Christensen LL,
Olesen SH, Frederiksen CM, Laiho P, Aaltonen LA, Laurberg S,
Sørensen FB, Hagemann R and ØRntoft TF: Gene expression in
colorectal cancer. Cancer Res. 62:4352–4363. 2002.PubMed/NCBI
|
|
11
|
Lawlor KG, Telang NT, Osborne MP,
Schaapveld RQ, Cho KR, Vogelstein B and Narayanan R: Antisense RNA
to the putative tumor suppressor gene ‘deleted in colorectal
cancer’ transforms fibroblasts. Ann N Y Acad Sci. 660:283–285.
1992. View Article : Google Scholar : PubMed/NCBI
|
|
12
|
Chen X, Ba Y, Ma L, Cai X, Yin Y, Wang K,
Guo J, Zhang Y, Chen J, Guo X, et al: Characterization of microRNAs
in serum: A novel class of biomarkers for diagnosis of cancer and
other diseases. Cell Res. 18:997–1006. 2008. View Article : Google Scholar : PubMed/NCBI
|
|
13
|
Grigoriadis A, Oliver GR, Tanney A,
Kendrick H, Smalley MJ, Jat P and Neville AM: Identification of
differentially expressed sense and antisense transcript pairs in
breast epithelial tissues. BMC Genomics. 10:3242009. View Article : Google Scholar : PubMed/NCBI
|
|
14
|
Kohno K, Chiba M, Murata S, Pak S, Nagai
K, Yamamoto M, Yanagisawa K, Kobayashi A, Yasue H and Ohkohchi N:
Identification of natural antisense transcripts involved in human
colorectal cancer development. Int J Oncol. 37:1425–1432.
2010.PubMed/NCBI
|
|
15
|
Nagai K, Kohno K, Chiba M, Pak S, Murata
S, Fukunaga K, Kobayashi A, Yasue H and Ohkohchi N: Differential
expression profiles of sense and antisense transcripts between
HCV-associated hepatocellular carcinoma and corresponding
non-cancerous liver tissue. Int J Oncol. 40:1813–1820.
2012.PubMed/NCBI
|
|
16
|
Chiba M, Kimura M and Asari S: Exosomes
secreted from human colorectal cancer cell lines contain mRNAs,
microRNAs and natural antisense RNAs, that can transfer into the
human hepatoma HepG2 and lung cancer A549 cell lines. Oncol Rep.
28:1551–1558. 2012.PubMed/NCBI
|
|
17
|
Benjamini Y and Hochberg Y: Controling the
false discovery rate: A pratical and powerful approach to multiple
testing. J R Statist Soc. 57:289–300. 1995.
|
|
18
|
Ward JH Jr: Hierarchical grouping to
optimize an objective function. J Am Stat Assoc. 58:236–244. 1963.
View Article : Google Scholar
|
|
19
|
Etzioni R, Urban N, Ramsey S, McIntosh M,
Schwartz S, Reid B, Radich J, Anderson G and Hartwell L: The case
for early detection. Nat Rev Cancer. 3:243–252. 2003. View Article : Google Scholar : PubMed/NCBI
|
|
20
|
Hundt S, Haug U and Brenner H: Blood
markers for early detection of colorectal cancer: A systematic
review. Cancer Epidemiol Biomarkers Prev. 16:1935–1953. 2007.
View Article : Google Scholar : PubMed/NCBI
|
|
21
|
Yoshigai E, Hara T, Araki Y, Tanaka Y,
Oishi M, Tokuhara K, Kaibori M, Okumura T, Kwon AH and Nishizawa M:
Natural antisense transcript-targeted regulation of inducible
nitric oxide synthase mRNA levels. Nitric Oxide. 30:9–16. 2013.
View Article : Google Scholar : PubMed/NCBI
|
|
22
|
Robb GB, Carson AR, Tai SC, Fish JE, Singh
S, Yamada T, Scherer SW, Nakabayashi K and Marsden PA:
Post-transcriptional regulation of endothelial nitric-oxide
synthase by an overlapping antisense mRNA transcript. J Biol Chem.
279:37982–37996. 2004. View Article : Google Scholar : PubMed/NCBI
|
|
23
|
Camblong J, Iglesias N, Fickentscher C,
Dieppois G and Stutz F: Antisense RNA stabilization induces
transcriptional gene silencing via histone deacetylation in S.
Cerevisiae. Cell. 131:706–717. 2007. View Article : Google Scholar : PubMed/NCBI
|
|
24
|
Faghihi MA, Zhang M, Huang J, Modarresi F,
Van der Brug MP, Nalls MA, Cookson MR, St-Laurent G III and
Wahlestedt C: Evidence for natural antisense transcript-mediated
inhibition of microRNA function. Genome Biol. 11:R562010.
View Article : Google Scholar : PubMed/NCBI
|
|
25
|
Carrieri C, Cimatti L, Biagioli M, Beugnet
A, Zucchelli S, Fedele S, Pesce E, Ferrer I, Collavin L, Santoro C,
et al: Long non-coding antisense RNA controls Uchl1 translation
through an embedded SINEB2 repeat. Nature. 491:454–457. 2012.
View Article : Google Scholar : PubMed/NCBI
|