Introduction
Thyroid carcinoma is the most common endocrine
neoplasm, of which papillary thyroid carcinoma (PTC) is the most
common pathological type, accounting for 80% of thyroid carcinomas
(1,2).
Cervical lymph node metastasis is a typical clinical feature of PTC
and is a risk factor for increased recurrence rates and decreased
survival rates (3,4). Therefore, the identification of
potential biomarkers that may be used to assess the prognosis and
treatment of PTC is required.
Chemokines and their receptors serve critical roles
in the development and progression of tumors (5), particularly in promoting cell migration
(6). Previous studies have
demonstrated that C-X-C chemokine receptor type 7 (CXCR7)
expression serves a role in tumor cell proliferation, angiogenesis,
invasion and metastasis (7–10). A previous study from our laboratory
demonstrated that CXCR7 was overexpressed in PTC tissue compared
with peritumoral non-malignant tissue and benign thyroid lesion
tissue, and the expression of CXCR7 was positively associated with
cervical lymph node metastasis (11).
Furthermore, knockdown of CXCR7 in PTC cells has been demonstrated
to suppress cell proliferation and invasion, and promote apoptosis
(12), which suggests that CXCR7 is
involved in the regulation of PTC progression.
In a previous study, to reveal the molecular
mechanisms underlying CXCR7-mediated regulation of PTC progression,
a gene microarray analysis was performed to detect changes in gene
expression between PTC cells and PTC cells transfected with CXCR7.
The results demonstrated that CXCR7 promotes the growth and
metastasis of PTC via the activation of the phosphoinositide
3-kinase (PI3K)/RAC-α serine/threonine-protein kinase (AKT)/nuclear
factor-κB (NF-κB) signaling pathway and regulation of the
expression of effector molecules, including fibronectin 1 (FN1),
collagen-α-1(I) chain precursor, collagen-α-1(IV) chain precursor,
platelet-derived growth factor receptor β, stromelysin-3 precursor
and membrane type 1 matrix metalloproteinase 1 (13).
The aim of the present study was to investigate the
molecular mechanisms underlying CXCR7-regulated PTC progression and
to identify novel biomarkers for PTC. To achieve this, isobaric tag
for relative and absolute quantification (iTRAQ)-coupled
two-dimensional liquid chromatography-tandem mass spectrometry (2D
LC-MS/MS) was used to detect alterations in protein expression
profiles between GLAG-66 and GLAG-66 cells transfected with CXCR7
cDNA (GLAG-66-CXCR7).
Materials and methods
Cell lines and culture conditions
The human PTC cell line GLAG-66 was purchased from
the European Collection of Authenticated Cell Cultures (Salisbury,
UK). A GLAG-66-CXCR7 cell line (GLAG-66 cells stably transfected
with CXCR7 cDNA) was constructed in a previous study (10). Cell lines were cultured in Dulbecco's
modified Eagle's medium: Ham's F12: MCDB105 supplemented with 10%
fetal bovine serum (FBS) and 2 mmol/l glutamine (all from
Sigma-Aldrich; Merck KGaA, Darmstadt, Germany), as described
previously (14), at 37°C with 5%
CO2.
Cell lysis, protein isolation,
digestion and labeling with iTRAQ reagents
Experimental group cells (GLAG-66-CXCR7-1) and the
control cells (GLAG-66-1) were collected and lysed with 300 µl cell
radioimmunoprecipitation lysis solution with 1% protease inhibitor
(both from Beyotime Institute of Biotechnology, Haimen, China)
containing 8 M urea on ice with regular vortex-mixing for 30 min.
The mixture was centrifuged at 15,000 × g for 1 h at 4°C, the
supernatant was removed and a Bradford Protein Assay reagent kit
(Beyotime Institute of Biotechnology) was used to quantify the
total protein. A 100 µg amount of each sample was precipitated with
4X sample volume of ice-cold acetone at −20°C for ~3 h and
centrifuged at 20,000 × g for 20 min at 4°C, carefully decanting
the supernatant. Subsequently, according to the iTRAQ protocol
(Applied Biosystems; Thermo Fisher Scientific, Inc., Waltham, MA,
USA), as described previously (15),
the protein was dissolved and denatured, and cysteine residues were
blocked. Each sample was then digested with 20 µl 0.25 µg/µl
sequencing grade modified trypsin solution (Promega Corporation,
Madison, WI, USA) at 37°C for 12 h and labeled with the iTRAQ tags
as follows: GLAG-66-CXCR7-1, iTRAQ 114 (114); GLAG-66-CXCR7-2,
iTRAQ 115 (115); GLAG-66-1, iTRAQ 116 (116); and GLAG-66-2, iTRAQ
117 (117), then incubated at room temperature for 2 h and
vacuum-dried. The experiments were repeated in duplicate.
iTRAQ-coupled 2D LC-MS/MS
analysis
The proteome analysis was performed by the Beijing
Proteome Research Center (Beijing, China). In brief, the mixed
iTRAQ labeled sample was centrifuged at 13,800 × g for 10 min and
the supernatant was eluted with 50% buffer B (98% acetonitrile,
1.9% H2O and 0.1% formic acid) at a flow rate of 0.4
ml/min for 10 min, then with 100% buffer A (1.9% acetonitrile, 98%
H2O and 0.1% formic acid) at a flow rate of 0.4 ml/min
for 15 min. The mixture was then separated on a C18
reverse-phase pre-column (5 µm, 150 Å, 4.6×250 mm; Agela
Technologies, Wilmington, DE, USA) at a flow rate of 1 ml/min. The
gradient elution started at 5% buffer B and was followed by an
increase from 5 to 18% in buffer B for 17 min, from 18 to 32%
buffer B for 26 min, 32 to 95% buffer B for 28 min and finally to
5% buffer B for 40 min. The fractions were collected at 1-min
intervals. All 40 fractions were centrifuge-dried at 12,000 × g at
4°C for 15 min. Finally, the sample was resuspended with buffer A,
centrifuged at 12,000 × g for 10 min. MS/MS analysis data was
acquired from m/z 350 to 1250 with ≤2 precursors
selected for MS/MS from m/z 100 to 1500 using dynamic
exclusion.
Western blot analysis
Protein was extracted from cells according to the
aforementioned protein extraction protocol. Protein concentrations
were determined using a Bradford Protein Assay reagent kit
(Beyotime Institute of Biotechnology, Nanjing, China). Total
protein samples (80 µg/lane) were separated using 10% SDS-PAGE and
then transferred onto polyvinylidene fluoride membranes. Following
blocking with 5% non-fat dry milk for 2 h, membranes were incubated
with primary antibodies overnight at 4°C. The membranes were
incubated for 2 h at room temperature with secondary antibodies.
Antibodies used in the present study included the following: rabbit
polyclonal anti-FN1 (dilution, 1:400; cat no. BA1771), anti-basigin
precursor (BSG; dilution, 1:500; cat no. PB0239) (both from Boster
Biological Technology, Pleasanton, CA, USA), rabbit polyclonal
anti-periplakin (PPL; dilution, 1:5,000; cat no. 72422), mouse
polyclonal anti-AHNAK nucleoprotein 2 (AHNAK2; dilution, 1:1,000;
cat no. ab70053) (both from Abcam, Cambridge, UK), rabbit
polyclonal anti-transgelin-2 (TAGLN2; dilution, 1:1,000; cat no.
10234-2-AP), β-catenin (dilution, 1:5,000; cat no. 51067-2-AP),
anti-serpin family B member 5 (SERPINB5; dilution, 1:5,000; cat no.
11,722-1-AP) and GAPDH (dilution, 1:10,000; cat no. 10,494-1-AP)
(all from ProteinTech Group, Inc., Chicago, IL, USA), and goat
anti-rabbit and goat anti-mouse immunoglobulin G (dilution,
1:2,000; cat nos. TA130015 and TA130001; OriGene Technologies,
Inc., Beijing, China) as secondary antibodies. Binding was detected
using BeyoECL Plus kit (Beyotime Institute of Biotechnology). The
ratio between the integrated optical density of interest proteins
and GAPDH of the same sample was calculated as the relative content
of protein detected using ImageJ 1.48v (National Institutes of
Health, Bethesda, MD, USA). All experiments were performed three
times.
Gene Ontology (GO) analysis
To analyze the functions of the differentially
expressed proteins, GO analysis was performed. The GOfact
(http://lidong.ncpsb.org/gofact/cgi/gofact2009.cgi)
strategy was used to evaluate the biological processes, molecular
functions and cell components associated with each differentially
expressed protein.
Statistical analysis
For iTRAQ, raw data processing, protein
identification, protein quantification, and statistical analyses
were performed with ProteinPilot™ Software Beta (version 4.2;
SCIEX, Framingham, MA, USA). Protein quantification ratios were
log10-transformed. Unpaired Student's t-test was applied
to analyze differences in GO and western blot analysis data using
SPSS software (version 19.0; IBM Corp., Armonk, NY, USA). All data
are expressed as the mean ± standard deviation. P<0.05 was
considered to indicate a statistically significant difference.
Results
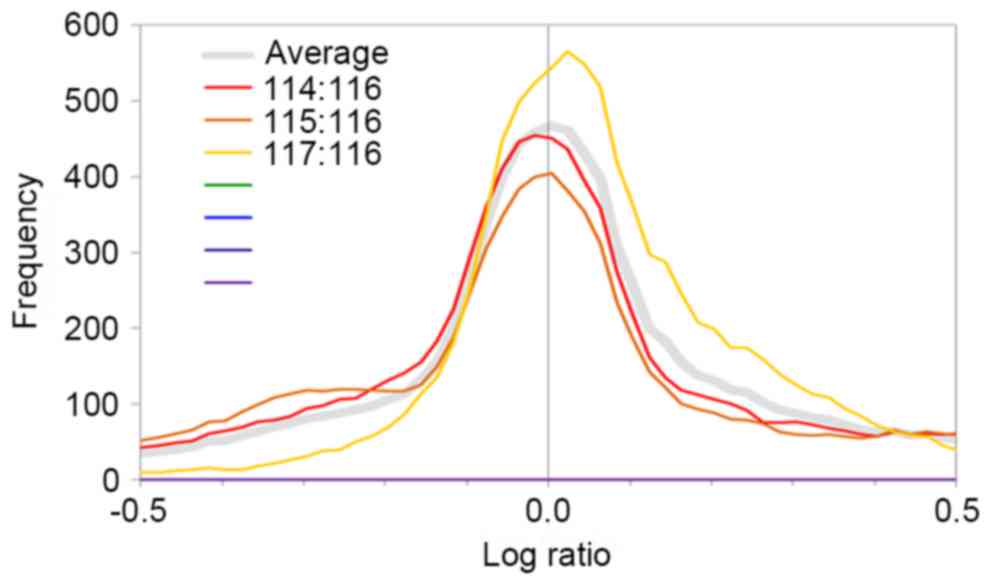
Protein quantification ratio
distribution trend
Quantification ratios among the protein sample
groups (114:116, 115:116 and 117:116) were
log10-transformed in order to create a distribution
diagram of protein quantification ratios (Fig. 1). The log10-transformed
protein quantification ratios were represented by fold change, and
log ratios ≥0.3 or ≤-0.3 represented a 2-fold change in
expression.
Proteome analysis by iTRAQ-coupled 2D
LC-MS/MS
A total of 24,673 peptides and 2983 proteins were
identified by iTRAQ-coupled 2D LC-MS/MS (false discovery rate,
<1%). Standard selection criteria to identify differentially
expressed proteins were as follows: log ratio of ≥0.3 and P<0.05
for 114:116 and 115:116 ratios (meaning the protein was
differentially expressed proteins between GLAG-66 and GLAG-66-CXCR7
cells; log ratios ≥0.3 represented upregulated proteins and log
ratios ≤-0.3 represented downregulated proteins) in addition to a
log ratio <0.3 and P≥0.05 for 117:116 (meaning the expression
was not significantly altered between the control samples). A total
of 130 proteins were revealed to be differentially expressed. Among
them, 87 and 43 proteins were significantly upregulated and
downregulated, respectively. The top 10 differentially expressed
proteins are listed in Table I.
Proteins selected for further verification and analysis included
FN1, TAGLN2, BSG, PPL, AHNAK2, β-catenin and SERPINB5, as they were
significantly differentially expressed, and are associated with
tumor development (16–22).
 | Table I.Top upregulated and downregulated
proteins from analysis of isobaric tag for relative and absolute
quantification-coupled two-dimensional liquid chromatography-tandem
mass spectrometry data. |
Table I.
Top upregulated and downregulated
proteins from analysis of isobaric tag for relative and absolute
quantification-coupled two-dimensional liquid chromatography-tandem
mass spectrometry data.
| Genes | Description | Log ratio
(O/N)a |
P-valueb
(differentially expressed) | Regulation |
|---|
| FN1 | Fibronectin 1 | 1.442 |
1.02×10⁻⁴ | Up |
| ALB | Serum albumin
preproprotein | 1.414 |
6.55×10⁻³ | Up |
| TAGLN2 | Transgelin-2 | 1.398 |
2.02×10⁻⁵ | Up |
| XRCC5 | X-ray repair
cross-complementing protein 5 | 1.372 |
4.40×10⁻⁹ | Up |
| HIST3H2BB | Histone H2B type
3-B | 1.368 |
3.38×10⁻² | Up |
| BSG | Basigin isoform
2 | 1.360 |
1.16×10⁻² | Up |
| CAST | Calpastatin isoform
f | 1.358 |
2.25×10⁻² | Up |
| PPL | Periplakin | 1.342 |
2.64×10⁻⁹ | Up |
| TG | Thyroglobulin
precursor | 1.278 |
1.30×10⁻¹⁰ | Up |
| AHNAK2 | AHNAK nucleoprotein
2 | 1.272 |
4.02×10⁻³ | Up |
| SARDH | Sarcosine
dehydrogenase, mitochondrial precursor | −0.824 |
7.31×10⁻³ | Down |
| ABCB1 | Multidrug
resistance protein 1 | −0.708 |
2.92×10⁻⁴ | Down |
| ENO3 | β-enolase isoform
1 | −0.696 |
6.54×10⁻⁴ | Down |
| RPL10 | 60S ribosomal
protein L10 | −0.668 |
8.42×10⁻⁴ | Down |
| CTNNB1 | Catenin
β−1 | −0.654 |
1.50×10⁻⁴ | Down |
| SERPINB5 | Serpin family B
member 5 | −0.632 |
1.41×10⁻² | Down |
| SDHA | Succinate
dehydrogenase | −0.614 |
1.16×10⁻² | Down |
| PPM1G | Protein phosphatase
1G | −0.614 |
3.54×10⁻³ | Down |
| ALDH2 | Aldehyde
dehydrogenase, mitochondrial isoform 1 precursor | −0.612 |
4.66×10⁻⁴ | Down |
| UBE2L3 |
Ubiquitin-conjugating enzyme E2 L3 isoform
4 | −0.612 |
7.93×10⁻³ | Down |
Gene Ontology (GO) enrichment
analysis
To analyze function distribution in the
differentially expressed proteins, a GO enrichment analysis was
performed. GO enrichment analysis revealed that the differentially
expressed proteins were primarily enriched in a number of
biological processes, including metabolism-associated processes,
cellular component organization, transport, cellular development
processes and immune response. In molecular function, the
differentially expressed proteins were significantly enriched in
protein binding, nucleotide binding and ion binding. In cell
component organization, the majority of the identified proteins
were involved in intracellular part, as illustrated in Table II.
| Table II.Top gene ontology enrichment analysis
terms. |
Table II.
Top gene ontology enrichment analysis
terms.
| Function
category | k/Ka (%) |
P-valueb |
|---|
| Biological
process |
|
|
| Primary
metabolic process | 43.30 |
4.20×10⁻⁴ |
|
Cellular metabolic
process | 40.00 |
1.90×10⁻⁴ |
|
Macromolecule metabolic
process | 34.80 |
2.00×10⁻⁵ |
|
Cellular component
organization | 32.60 |
3.70×10⁻³³ |
|
Transport | 21.10 |
1.60×10⁻² |
|
Cellular developmental
process | 20.00 |
1.40×10⁻²² |
|
Anatomical structure
morphogenesis | 17.80 |
5.20×10⁻³² |
|
Response to stress | 17.40 |
2.00×10⁻⁹ |
|
Catabolic process | 14.30 |
4.20×10⁻³ |
| Immune
response | 13.70 |
2.50×10⁻²⁵ |
| Molecular
function |
|
|
| Protein
binding | 46.20 |
1.40×10⁻³¹ |
|
Nucleotide binding | 26.70 |
3.00×10⁻⁹ |
| Ion
binding | 18.90 |
4.90×10⁻³ |
|
Transferase activity | 7.10 |
8.50×10⁻⁸ |
|
Transporter activity | 5.00 |
2.00×10⁻³ |
| Signal
transducer activity | 4.40 |
3.00×10⁻¹⁰ |
| Lipid
binding | 4.40 |
8.70×10⁻³ |
|
Carbohydrate binding | 3.70 |
2.20×10⁻⁴ |
|
Transmembrane transporter
activity | 3.70 |
3.20×10⁻³ |
|
Transcription regulator
activity | 1.50 |
2.50×10⁻¹¹ |
| Cell component |
|
|
|
Intracellular part | 80.40 |
8.00×10⁻²⁷ |
|
Intracellular organelle | 58.90 |
2.30×10⁻¹⁰ |
|
Membrane-bounded
organelle | 54.50 |
2.80×10⁻¹¹ |
|
Membrane | 48.40 |
4.00×10⁻¹³ |
|
Intracellular organelle
part | 41.90 |
2.10×10⁻¹⁵ |
| Protein
complex | 34.20 |
1.30×10−38 |
|
Non-membrane-bounded
organelle | 20.90 |
1.30×10⁻⁵ |
| Cell
projection | 14.00 |
4.80×10⁻³¹ |
|
Vesicle | 8.50 |
3.90×10⁻¹⁵ |
|
Intracellular | 8.10 |
9.90×10⁻⁷ |
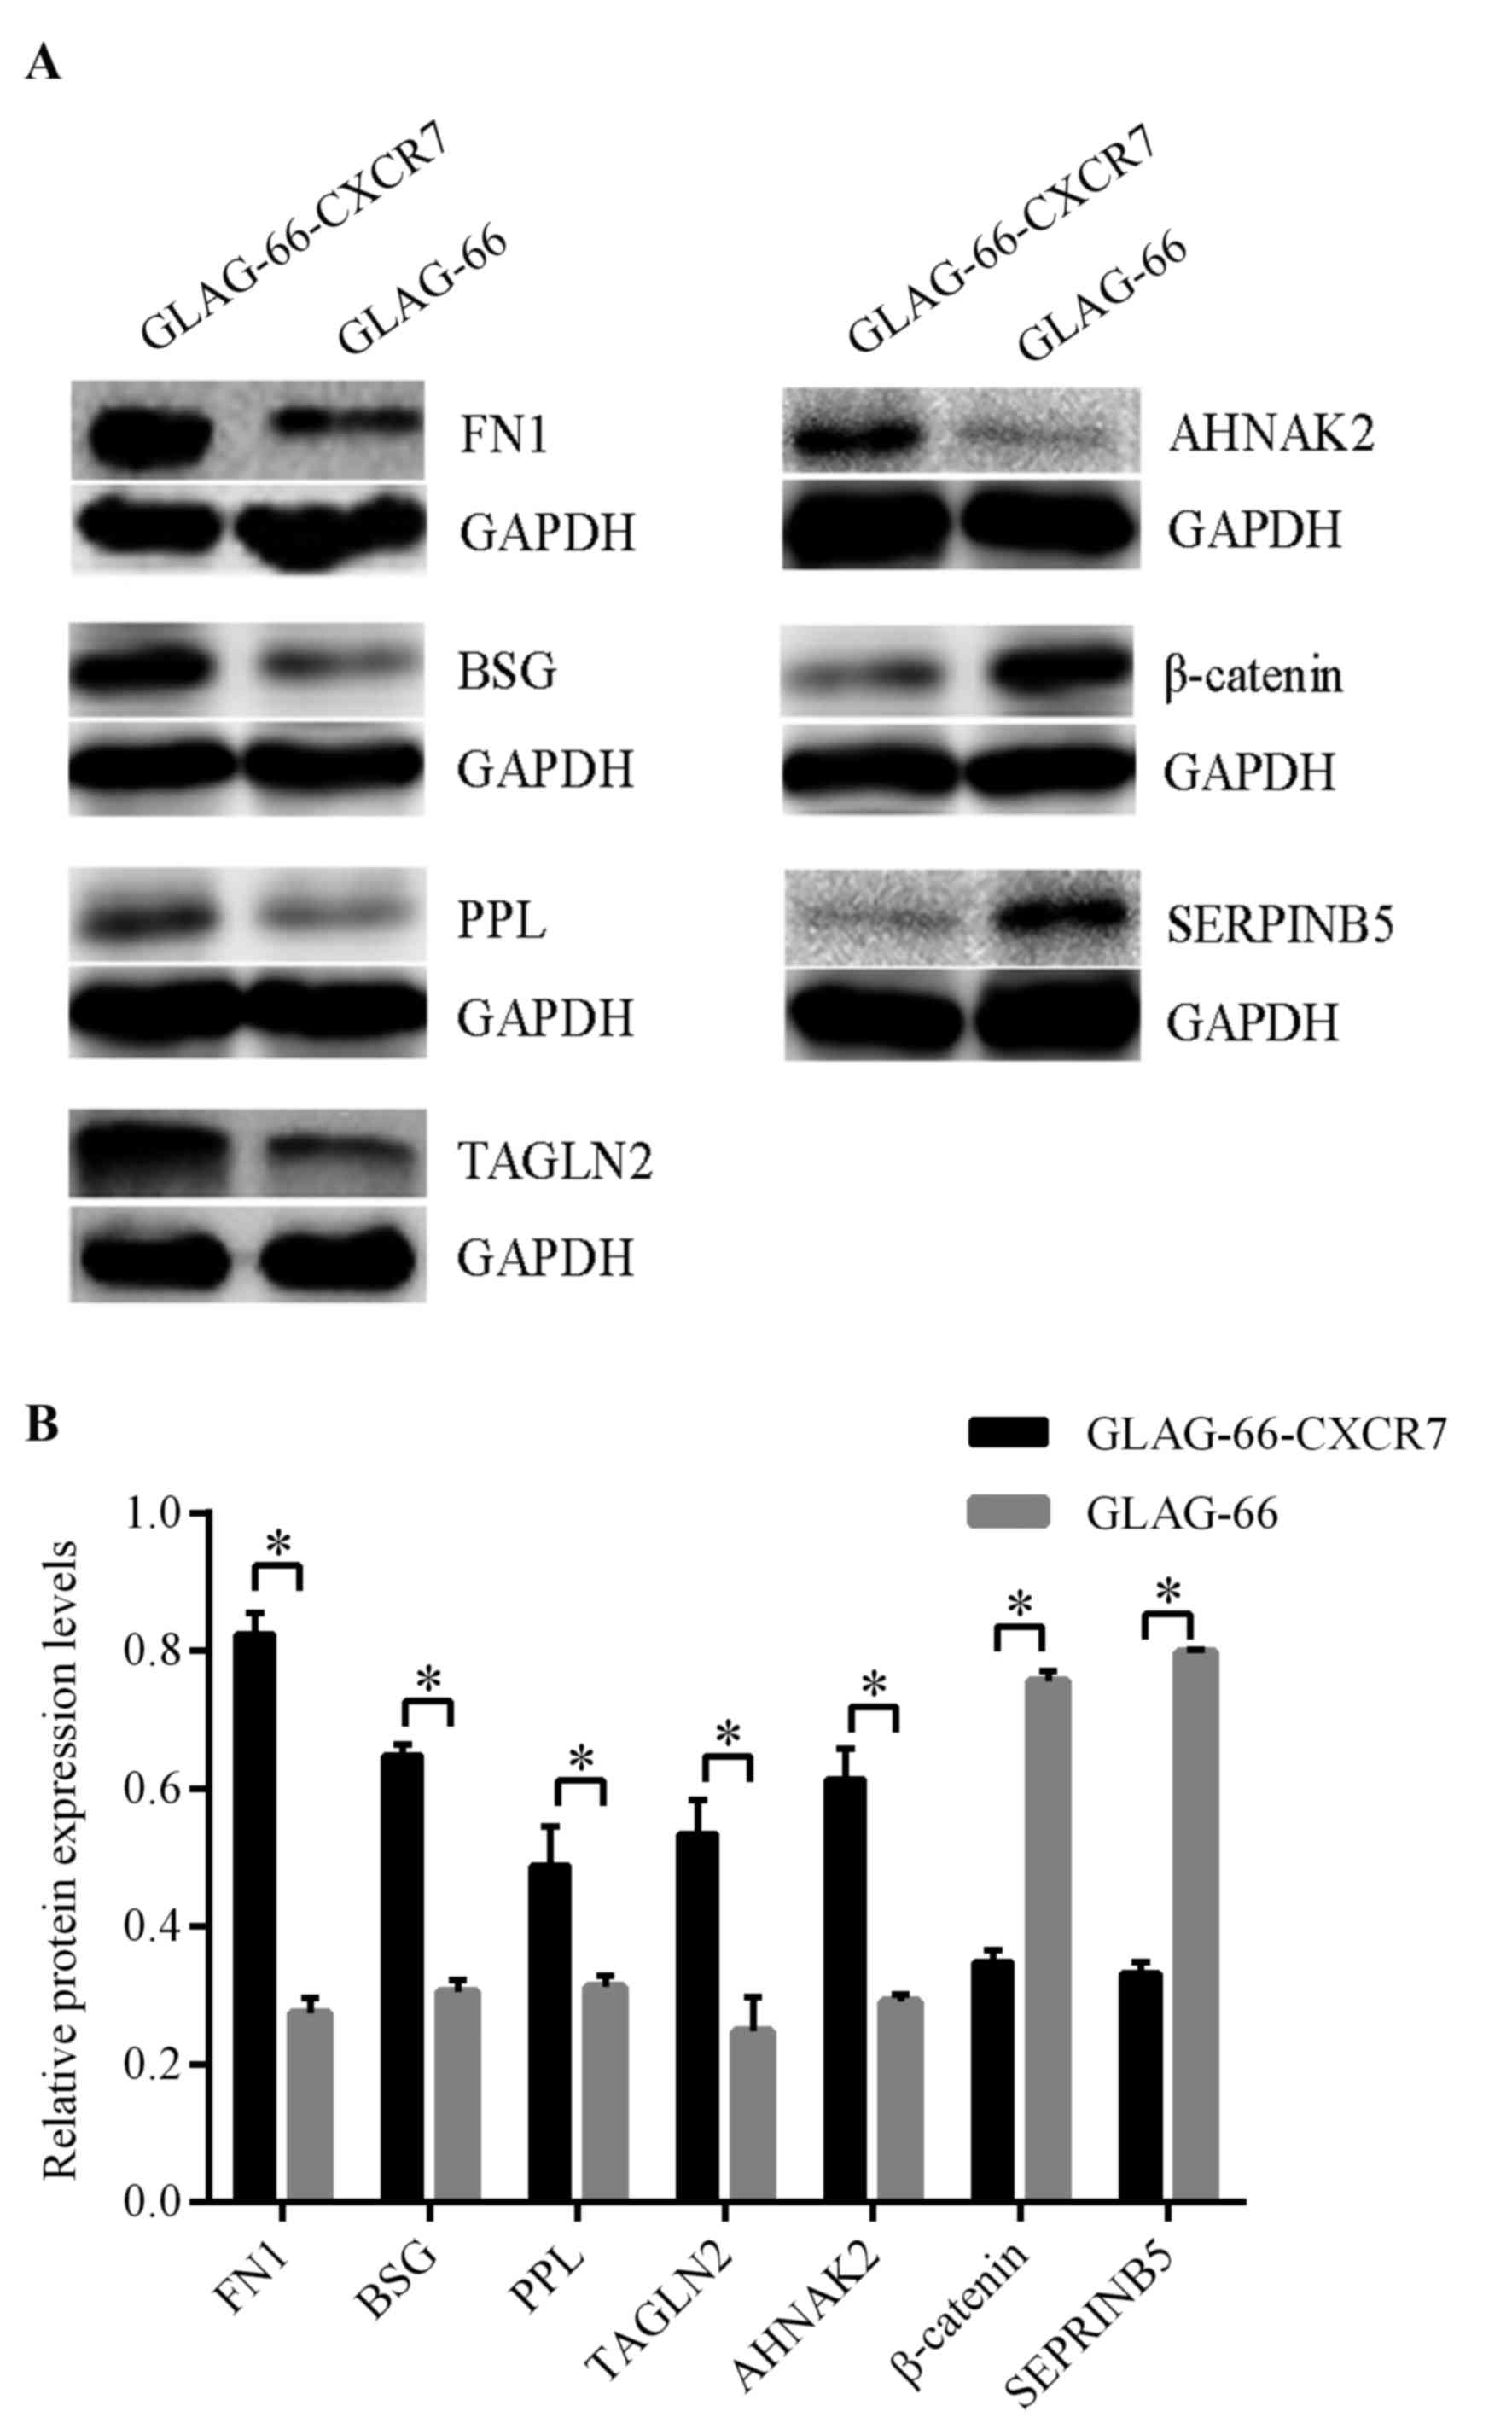
Verification of differentially
expressed proteins
To confirm the differences in protein profile
expression between control GLAG-66 and GLAG-66-CXCR7 cells, the
upregulated proteins FN1, BSG, PPL, TAGLN2 and AHNAK2, and the
downregulated proteins β-catenin and SERPINB5, were selected for
further verification. Western blot analysis demonstrated that
protein expression levels of FN1, BSG, PPL, TAGLN2 and AHNAK2 were
significantly elevated in GLAG-66-CXCR7 cells compared with GLAG-66
cells, whereas β-catenin and SERPINB5 were significantly
downregulated (P<0.05; Fig. 2 and
Table III), which was consistent
with the proteome data.
| Table III.Protein expression of differentially
expression proteins in GLAG-66 cells and GLAG-66-CXCR7 cells. |
Table III.
Protein expression of differentially
expression proteins in GLAG-66 cells and GLAG-66-CXCR7 cells.
| Gene | Protein expression
(mean ± standard deviation) | P-value |
|---|
| FN1 |
| <0.001 |
|
GLAG-66 | 0.824±0.031 |
|
|
GLAG-66-CXCR7 | 0.274±0.022 |
|
| BSG |
| 0.024 |
|
GLAG-66 | 0.648±0.016 |
|
|
GLAG-66-CXCR7 | 0.305±0.018 |
|
| PPL |
| <0.001 |
|
GLAG-66 | 0.489±0.056 |
|
|
GLAG-66-CXCR7 | 0.312±0.017 |
|
| TAGLN2 |
| 0.002 |
|
GLAG-66 | 0.534±0.050 |
|
|
GLAG-66-CXCR7 | 0.248±0.050 |
|
| AHNAK2 |
| 0.001 |
|
GLAG-66 | 0.614±0.045 |
|
|
GLAG-66-CXCR7 | 0.291±0.010 |
|
| β-catenin |
| <0.001 |
|
GLAG-66 | 0.349±0.018 |
|
|
GLAG-66-CXCR7 | 0.756±0.015 |
|
| SERPINB5 |
| <0.001 |
|
GLAG-66 | 0.333±0.015 |
|
|
GLAG-66-CXCR7 | 0.798±0.003 |
|
Discussion
Previous studies from our group demonstrated that
overexpression of CXCR7 in PTC tissue was positively associated
with lymph node metastasis, whereas knockdown of CXCR7 in PTC cells
suppressed cell proliferation and invasion, and promoted apoptosis
(11,12). Furthermore, gene expression profile
analysis demonstrated that CXCR7 activates the PI3K/AKT/NF-κB
signaling pathway and regulates the expression of effector
molecules, thereby regulating PTC progression (13). To further evaluate the molecular
mechanisms underlying CXCR7-regulated PTC growth and metastasis, in
addition to screening potential biomarkers, iTRAQ-coupled 2D
LC-MS/MS was performed to detect protein expression profile
alterations between the GLAG-66 and GLAG-66-CXCR7 cell lines. A
total of 130 differentially expressed proteins were identified,
among which 87 were upregulated and 43 were downregulated.
In the present study, GO enrichment analysis
revealed that the differentially expressed proteins were primarily
involved in primary metabolic processes, cellular metabolic
processes, macromolecule metabolic processes, cellular component
organization, transport, cellular developmental processes,
biological processes and protein-binding molecular function. The GO
enrichment analysis of cell component revealed that the
differentially expressed proteins were primarily intracellular.
Certain differentially expressed proteins possessed known
functions, including FN1, BSG, PPL, SERPINB5 and β-catenin. FN1 is
a glycoprotein distributed on the cell surface and in the
extracellular matrix, and is involved in endothelium cell invasion,
migration and angiogenic processes (15). These processes involve the activation
of focal adhesion kinase and the PI3K/AKT/NF-κB signaling pathway
(15,23). Previous studies have reported that FN1
is overexpressed in PTC and may serve as a biomarker for PTC
diagnosis and treatment (24,25). BSG is a transmembrane protein that is
overexpressed in a number of malignant tumor cells, and promotes
tumor invasion and metastasis by activating the PI3K/AKT signaling
pathway (17,26–29).
Previous studies have reported that BSG promotes extra-tumor
invasion and lymph metastasis in differentiated thyroid carcinoma
(DTC) and is associated with poor prognosis (30,31). PPL,
a constituent of desmosomes involved in endothelial cell structure
stabilization and considered as a localization signal of AKT,
promotes cell growth and survival by binding AKT directly (18). PPL knockdown appeared to decrease the
phospho-AKT expression (32,33). Tonoike et al (34) demonstrated that PPL knockdown
suppresses cell proliferation, migration and invasion through the
PI3K/AKT signaling pathway in pharyngeal cancer cells. In the
present study, CXCR7 overexpression upregulated the expression of
FN1, BSG and PPL, which suggested that CXCR7 may regulate growth
and metastasis of PTC via the activation of the PI3K/AKT signaling
pathway.
In addition, the results of the present study
demonstrated that SERPINB5, a tumor suppressor that belongs to the
serpin family, is downregulated following CXCR7 overexpression.
SERPINB5 is a tumor protein p53 (p53)-dependent protein that
inhibits tumor angiogenesis by interacting with the p53 signaling
pathway (21,35). A number of studies have suggested that
SERPINB5 inhibits the migration, invasion, metastasis and
angiogenesis of tumor cells (22–37).
Boltze et al (38) and Shams
et al (39) demonstrated that
SERPINB5 is associated with vessel invasion and lymph metastasis in
PTC, therefore SERPINB5 can inhibit PTC invasion and metastasis.
The results of the present study suggest that CXCR7 promotes PTC
growth and metastasis by inhibiting SERPINB5.
The processes of tumor invasion and metastasis
include adhesion, degradation and movement (40). The absence of adhesion may induce the
degradation of cellular junctions, which is associated with tumor
cell invasion and metastasis (41,42).
Cellular adhesion comprises cell-cell and cell-matrix contacts,
which are distributed in a number of types of tissue, and serve
roles in maintaining the integrity of tissues and cells. Adherens
junctions are formed by classic cadherins, including epithelial
cadherin and neuronal cadherin, which associate with α-/β-catenin,
plakoglobin, adherens junction protein p120 and vinculin, and
anchor actin microfilaments (43).
Calcium-dependent cadherin/catenin/actin cytoskeleton protein
complexes serve a vital role in cell morphology maintenance, cell
motility and adhesion, cytoskeleton remodeling and regulation of
signal transduction (20,44). β-catenin is a multifunctional protein
that mediates cell adhesion and signal transduction, and is a
component of epithelial cell-cell junctions. However, decreased
β-catenin expression and its dysregulation are associated with the
initiation of cancer cell invasion and metastasis (20). In the present study, CXCR7
downregulated the expression of β-catenin, which suggests that
CXCR7 overexpression may result in the degradation of cellular
junctions and the subsequent decrease in cell adhesion, which may
eventually lead to the invasion and metastasis of PTC cells.
In addition, the results of the present study
identified certain differently expressed proteins with unclear
biological functions, including TAGLN2 and AHNAK2. TAGLN2 is a
member of the calponin family of actin-binding proteins and is
upregulated in lung cancer, colorectal cancer, and head and neck
squamous cell carcinoma (16,45,46).
Knockdown of TAGLN2 has been reported to inhibit tumor cell
invasion and promote apoptosis (47,48).
Notably, it has been reported that the overexpression of TAGLN2 is
associated with lymph node metastasis, distant metastasis and
tumor-node-metastasis stage in colorectal cancer (47). AHNAK2 is a 600 kDa protein that is
expressed in the majority of muscle cells and has a similar
function to AHNAK1: It regulates the contraction coupling of
myocardial cells through its PSD-95/Discs-large/ZO-1 structural
domain (49,50). In addition, AHNAK2 is a constituent of
costameres in skeletal muscle and may link the extracellular matrix
with the cytoskeleton (19,51). Previous studies have identified that
PPL and AHNAK1 affect the formation of the ezrin, PPL, periaxin and
desmoyokin skeletal protein complex (52). Therefore PPL, AHNAK2, β-catenin and
TAGLN2 are associated with cellular adhesion junctions;
overexpression of CXCR7 may lead to dysregulation of these proteins
and subsequently degrade cellular junctions, inducing invasion and
metastasis of PTC.
In conclusion, the results of the present study
provide a possible mechanism for the regulation of PTC invasion and
metastasis by CXCR7. Proteomic analysis using iTRAQ-coupled 2D
LC-MS/MS identified 130 differentially expressed proteins between
GLAG-66 and GLAG-66-CXCR7 cells, including a number of proteins
associated with cellular junctions. CXCR7 overexpression may result
in the degradation of cellular junctions and therefore promote cell
invasion and metastasis. In addition, AHNAK2 and TAGLN2 were
identified as potential novel biomarkers for PTC. However, further
studies on these proteins are required to demonstrate their
function and mechanism in PTC generation and development.
Acknowledgements
The present study was supported by the National
Natural Science Foundation of China (grant no. 81072182) and the
Natural Science Foundation of Liaoning Province (grant no.
2013021100; China).
References
|
1
|
Rahib L, Smith BD, Aizenberg R, Rosenzweig
AB, Fleshman JM and Matrisian LM: Projecting cancer incidence and
deaths to 2030: The unexpected burden of thyroid, liver, and
pancreas cancers in the United States. Cancer Res. 74:2913–2921.
2014. View Article : Google Scholar : PubMed/NCBI
|
|
2
|
Morris LG, Tuttle RM and Davies L:
Changing trends in the incidence of thyroid cancer in the united
states. JAMA Otolaryngol Head Neck Surg. 142:709–711. 2016.
View Article : Google Scholar : PubMed/NCBI
|
|
3
|
Podnos YD, Smith D, Wagman LD and
Ellenhorn JD: The implication of lymph node metastasis on survival
in patients with well-differentiated thyroid cancer. Am Surg.
71:731–734. 2005.PubMed/NCBI
|
|
4
|
Zaydfudim V, Feurer ID, Griffin MR and
Phay JE: The impact of lymph node involvement on survival in
patients with papillary and follicular thyroid carcinoma. Surgery.
144:1070–1078. 2008. View Article : Google Scholar : PubMed/NCBI
|
|
5
|
Vandercappellen J, Van Damme J and Struyf
S: The role of CXC chemokines and their receptors in cancer. Cancer
Lett. 267:226–244. 2008. View Article : Google Scholar : PubMed/NCBI
|
|
6
|
Ben-Baruch A: Organ selectivity in
metastasis: Regulation by chemokines and their receptors. Clin Exp
Metastasis. 25:345–356. 2008. View Article : Google Scholar : PubMed/NCBI
|
|
7
|
Sun X, Cheng G, Hao M, Zheng J, Zhou X,
Zhang J, Taichman RS, Pienta KJ and Wang J: CXCL12/CXCR4/CXCR7
chemokine axis and cancer progression. Cancer Metastasis Rev.
29:709–722. 2010. View Article : Google Scholar : PubMed/NCBI
|
|
8
|
Hao M, Zheng J, Hou K and Wang J, Chen X,
Lu X, Bo J, Xu C, Shen K and Wang J: Role of chemokine receptor
CXCR7 in bladder cancer progression. Biochem Pharmacol. 84:204–214.
2012. View Article : Google Scholar : PubMed/NCBI
|
|
9
|
Zheng K, Li HY, Su XL, Wang XY, Tian T, Li
F and Ren GS: Chemokine receptor CXCR7 regulates the invasion,
angiogenesis and tumor growth of human hepatocellular carcinoma
cells. J Exp Clin Cancer Res. 29:312010. View Article : Google Scholar : PubMed/NCBI
|
|
10
|
Singh RK and Lokeshwar BL: The
IL-8-regulated chemokine receptor CXCR7 stimulates EGFR signaling
to promote prostate cancer growth. Cancer Res. 71:3268–3277. 2011.
View Article : Google Scholar : PubMed/NCBI
|
|
11
|
Liu Z, Sun DX, Teng XY, Xu WX, Meng XP and
Wang BS: Expression of stromal cell derived factor 1 and CXCR7 in
papillary thyroid carcinoma. Endocr Pathol. 23:247–253. 2012.
View Article : Google Scholar : PubMed/NCBI
|
|
12
|
Liu Z, Yang L, Teng X, Zhang H and Guan H:
The involvement of CXCR7 in modulating the progression of papillary
thyroid carcinoma. J Surg Res. 191:379–388. 2014. View Article : Google Scholar : PubMed/NCBI
|
|
13
|
Zhang H, Teng X and Liu Z, Zhang L and Liu
Z: Gene expression profile analyze the molecular mechanism of CXCR7
regulating papillary thyroid carcinoma growth and metastasis. J Exp
Clin Cancer Res. 34:162015. View Article : Google Scholar : PubMed/NCBI
|
|
14
|
Wyllie FS, Lemoine NR, Barton CM, Dawson
T, Bond J and Wynford-Thomas D: Direct growth stimulation of normal
human epithelial cells by mutant p53. Mol Carcinog. 7:83–88. 1993.
View Article : Google Scholar : PubMed/NCBI
|
|
15
|
Ross PL, Huang YN, Marchese JN, Williamson
B, Parker K, Hattan S, Khainovski N, Pillai S, Dey S, Daniels S, et
al: Multiplexed protein quantitation in Saccharomyces cerevisiae
using amine-reactive isobaric tagging reagents. Mol Cell
Proteomics. 3:1154–1169. 2004. View Article : Google Scholar : PubMed/NCBI
|
|
16
|
Paik JY, Ko BH, Jung KH and Lee KH:
Fibronectin stimulates endothelial cell 18F-FDG uptake through
focal adhesion kinase-mediated phosphatidylinositol 3-kinase/Akt
signaling. J Nucl Med. 50:618–624. 2009. View Article : Google Scholar : PubMed/NCBI
|
|
17
|
Xu XC, Zhang YH, Zhang WB, Li T, Gao H and
Wang YH: MicroRNA-133a functions as a tumor suppressor in gastric
cancer. J Biol Regul Homeost Agents. 28:615–624. 2014.PubMed/NCBI
|
|
18
|
Fei F, Li X, Xu L, Li D, Zhang Z, Guo X,
Yang H, Chen Z and Xing J: CD147-CD98hc complex contributes to poor
prognosis of nonsmall cell lung cancer patients through promoting
cell proliferation Via the PI3K/Akt signaling pathway. Ann Surg
Oncol. 21:4359–4368. 2014. View Article : Google Scholar : PubMed/NCBI
|
|
19
|
Suzuki A, Horiuchi A, Ashida T, Miyamoto
T, Kashima H, Nikaido T, Konishi I and Shiozawa T: Cyclin A2
confers cisplatin resistance to endometrial carcinoma cells via
up-regulation of an Akt-binding protein, periplakin. J Cell Mol
Med. 14:2305–2317. 2010. View Article : Google Scholar : PubMed/NCBI
|
|
20
|
de Morrée A, Droog M, Grand Moursel L,
Bisschop IJ, Impagliazzo A, Frants RR, Klooster R and van der
Maarel SM: Self-regulated alternative splicing at the AHNAK locus.
FASEB J. 26:93–103. 2012. View Article : Google Scholar : PubMed/NCBI
|
|
21
|
Takayama T, Shiozaki H, Shibamoto S, Oka
H, Kimura Y, Tamura S, Inoue M, Monden T, Ito F and Monden M:
Beta-catenin expression in human cancers. Am J Pathol. 148:39–46.
1996.PubMed/NCBI
|
|
22
|
Zou Z, Anisowicz A, Hendrix MJ, Thor A,
Neveu M, Sheng S, Rafidi K, Seftor E and Sager R: Maspin, a serpin
with tumor-suppressing activity in human mammary epithelial cells.
Science. 263:526–529. 1994. View Article : Google Scholar : PubMed/NCBI
|
|
23
|
Wang YH, Dong YY, Wang WM, Xie XY, Wang
ZM, Chen RX, Chen J, Gao DM, Cui JF and Ren ZG: Vascular
endothelial cells facilitated HCC invasion and metastasis through
the Akt and NF-κB pathways induced by paracrine cytokines. J Exp
Clin Cancer Res. 32:512013. View Article : Google Scholar : PubMed/NCBI
|
|
24
|
Prasad ML, Huang Y, Pellegata NS, de la
Chapelle A and Kloos RT: Hashimoto's thyroiditis with papillary
thyroid carcinoma (PTC)-like nuclear alterations express molecular
markers of PTC. Histopathology. 45:39–46. 2004. View Article : Google Scholar : PubMed/NCBI
|
|
25
|
Huang Y, Prasad M, Lemon WJ, Hampel H,
Wright FA, Kornacker K, LiVolsi V, Frankel W, Kloos RT, Eng C, et
al: Gene expression in papillary thyroid carcinoma reveals highly
consistent profiles. Proc Natl Acad Sci USA. 98:15044–15049. 2001.
View Article : Google Scholar : PubMed/NCBI
|
|
26
|
Zhang Q, Zhou J, Ku XM, Chen XG, Zhang L,
Xu J, Chen GS, Li Q, Qian F, Tian R, et al: Expression of CD147 as
a significantly unfavorable prognostic factor in hepatocellular
carcinoma. Eur J Cancer Prev. 16:196–202. 2007. View Article : Google Scholar : PubMed/NCBI
|
|
27
|
Wu J, Hao ZW, Zhao YX, Yang XM, Tang H,
Zhang X, Song F, Sun XX, Wang B, Nan G, et al: Full-length soluble
CD147 promotes MMP-2 expression and is a potential serological
marker in detection of hepatocellular carcinoma. J Transl Med.
12:1902014. View Article : Google Scholar : PubMed/NCBI
|
|
28
|
Wang L, Wu G, Yu L, Yuan J, Fang F, Zhai
Z, Wang F and Wang H: Inhibition of CD147 expression reduces tumor
cell invasion in human prostate cancer cell line via RNA
interference. Cancer Biol Ther. 5:608–614. 2006. View Article : Google Scholar : PubMed/NCBI
|
|
29
|
Fang F and Wang L, Zhang S, Fang Q, Hao F,
Sun Y, Zhao L, Chen S, Liao H and Wang L: CD147 modulates autophagy
through the PI3K/Akt/mTOR pathway in human prostate cancer PC-3
cells. Oncol Lett. 9:1439–1443. 2015.PubMed/NCBI
|
|
30
|
Tan H, Ye K, Wang Z and Tang H: CD147
expression as a significant prognostic factor in differentiated
thyroid carcinoma. Transl Res. 152:143–149. 2008. View Article : Google Scholar : PubMed/NCBI
|
|
31
|
Huang P, Chang S, Jiang X, Su J, Dong C,
Liu X, Yuan Z, Zhang Z and Liao H: RNA interference targeting CD147
inhibits the proliferation, invasiveness, and metastatic activity
of thyroid carcinoma cells by down-regulating glycolysis. Int J
Clin Exp Pathol. 8:309–318. 2015.PubMed/NCBI
|
|
32
|
van den Heuvel AP, de Vries-Smits AM, van
Weeren PC, Dijkers PF, de Bruyn KM, Riedl JA and Burgering BM:
Binding of protein kinase B to the plakin family member periplakin.
J Cell Sci. 115:3957–3966. 2002. View Article : Google Scholar : PubMed/NCBI
|
|
33
|
Suzuki A, Horiuchi A, Ashida T, Miyamoto
T, Kashima H, Nikaido T, Konishi I and Shiozawa T: Cyclin A2
confers cisplatin resistance to endometrial carcinoma cells via
up-regulation of an Akt-binding protein, periplakin. J Cell Mol
Med. 14:2305–2317. 2010. View Article : Google Scholar : PubMed/NCBI
|
|
34
|
Tonoike Y, Matsushita K, Tomonaga T,
Katada K, Tanaka N, Shimada H, Nakatani Y, Okamoto Y and Nomura F:
Adhesion molecule periplakin is involved in cellular movement and
attachment in pharyngeal squamous cancer cells. BMC Cell Biol.
12:412011. View Article : Google Scholar : PubMed/NCBI
|
|
35
|
Zhang M, Volpert O, Shi YH and Bouck N:
Maspin is an angiogenesis inhibitor. Nat Med. 6:196–199. 2000.
View Article : Google Scholar : PubMed/NCBI
|
|
36
|
Sheng S, Carey J, Seftor EA, Dias L,
Hendrix MJ and Sager R: Maspin acts at the cell membrane to inhibit
invasion and motility of mammary and prostatic cancer cells. Proc
Natl Acad Sci USA. 93:11669–11674. 1996. View Article : Google Scholar : PubMed/NCBI
|
|
37
|
Cher ML, Biliran HR Jr, Bhagat S, Meng Y,
Che M, Lockett J, Abrams J, Fridman R, Zachareas M and Sheng S:
Maspin expression inhibits osteolysis, tumor growth, and
angiogenesis in a model of prostate cancer bone metastasis. Proc
Natl Acad Sci USA. 100:7847–7852. 2003. View Article : Google Scholar : PubMed/NCBI
|
|
38
|
Boltze C, Schneider-Stock R, Meyer F,
Peters B, Quednow C, Hoang-Vu C and Roessner A: Maspin in thyroid
cancer: Its relationship with p53 and clinical outcome. Oncol Rep.
10:1783–1787. 2003.PubMed/NCBI
|
|
39
|
Shams TM, Samaka RM and Shams ME: Maspin
protein expression: A special feature of papillary thyroid
carcinoma. J Egypt Natl Canc Inst. 18:274–280. 2006.PubMed/NCBI
|
|
40
|
Liotta LA and Stetler-Stevenson WG: Tumor
invasion and metastasis: An imbalance of positive and negative
regulation. Cancer Res. 51:(18 Suppl). 5054s–5059s. 1991.PubMed/NCBI
|
|
41
|
Kleinberg L, Holth A, Fridman E, Schwartz
I, Shih IeM and Davidson B: The diagnostic role of claudins in
serous effusions. Am J Clin Pathol. 127:928–937. 2007. View Article : Google Scholar : PubMed/NCBI
|
|
42
|
Ohtani S, Terashima M, Satoh J, Soeta N,
Saze Z, Kashimura S, Ohsuka F, Hoshino Y, Kogure M and Gotoh M:
Expression of tight-junction-associated proteins in human gastric
cancer: Downregulation of claudin-4 correlates with tumor
aggressiveness and survival. Gastric Cancer. 12:43–51. 2009.
View Article : Google Scholar : PubMed/NCBI
|
|
43
|
Huber O, Bierkamp C and Kemler R:
Cadherins and catenins in development. Curr Opin Cell Biol.
8:685–691. 1996. View Article : Google Scholar : PubMed/NCBI
|
|
44
|
Miller JR and Moon RT: Signal transduction
through beta-catenin and specification of cell fate during
embryogenesis. Genes Dev. 10:2527–2539. 1996. View Article : Google Scholar : PubMed/NCBI
|
|
45
|
Rho JH, Roehrl MH and Wang JY: Tissue
proteomics reveals differential and compartment-specific expression
of the homologs transgelin and transgelin-2 in lung adenocarcinoma
and its stroma. J Proteome Res. 8:5610–5618. 2009. View Article : Google Scholar : PubMed/NCBI
|
|
46
|
Zhang Y, Ye Y, Shen D, Jiang K, Zhang H,
Sun W, Zhang J, Xu F, Cui Z and Wang S: Identification of
transgelin-2 as a biomarker of colorectal cancer by laser capture
microdissection and quantitative proteome analysis. Cancer Sci.
101:523–529. 2010. View Article : Google Scholar : PubMed/NCBI
|
|
47
|
Nohata N, Sone Y, Hanazawa T, Fuse M,
Kikkawa N, Yoshino H, Chiyomaru T, Kawakami K, Enokida H, Nakagawa
M, et al: miR-1 as a tumor suppressive microRNA targeting TAGLN2 in
head and neck squamous cell carcinoma. Oncotarget. 2:29–42. 2011.
View Article : Google Scholar : PubMed/NCBI
|
|
48
|
Li AY, Yang Q and Yang K: miR-133a
mediates the hypoxia-induced apoptosis by inhibiting TAGLN2
expression in cardiac myocytes. Mol Cell Biochem. 400:173–181.
2015. View Article : Google Scholar : PubMed/NCBI
|
|
49
|
Shtivelman E, Cohen FE and Bishop JM: A
human gene (AHNAK) encoding an unusually large protein with a
1.2-microns polyionic rod structure. Proc Natl Acad Sci USA.
89:5472–5476. 1992. View Article : Google Scholar : PubMed/NCBI
|
|
50
|
Komuro A, Masuda Y, Kobayashi K, Babbitt
R, Gunel M, Flavell RA and Marchesi VT: The AHNAKs are a class of
giant propeller-like proteins that associate with calcium channel
proteins of cardiomyocytes and other cells. Proc Natl Acad Sci USA.
101:4053–4058. 2004. View Article : Google Scholar : PubMed/NCBI
|
|
51
|
Marg A, Haase H, Neumann T, Kouno M and
Morano I: AHNAK1 and AHNAK2 are costameric proteins: AHNAK1 affects
transverse skeletal muscle fiber stiffness. Biochem Biophys Res
Commun. 401:143–158. 2010. View Article : Google Scholar : PubMed/NCBI
|
|
52
|
Straub BK, Boda J, Kuhn C, Schnoelzer M,
Korf U, Kempf T, Spring H, Hatzfeld M and Franke WW: A novel
cell-cell junction system: The cortex adherens mosaic of lens fiber
cells. J Cell Sci. 116:4985–4995. 2003. View Article : Google Scholar : PubMed/NCBI
|