Introduction
Leukemia is one of the 10 leading causes of
cancer-associated mortality in China; in 2011 there were 27,907
mortalities in men and 19,708 mortalities in women from leukemia
(1). The four types of Leukemia are
acute lymphocytic leukemia, chronic lymphocytic leukemia, acute
myeloid leukemia (AML) and chronic myeloid leukemia. AML accounts
for ~80% of cases of acute leukemia in adults (2).
AML is a highly heterogeneous leukemia associated
with excessive progenitor cell proliferation and a differentiation
block for cell-cycle arrest. AML is often caused by karyotypic
abnormalities, including chromosomal translocations, deletions and
inversions (3,4). Etiological factors driving AML
development remain unclear, but lifestyle and environmental
exposures, including obesity and smoking, are reported to be
associated with the disease (5).
The French-American-British (FAB) and World Health
Organization (WHO) systems are the two main AML classification
systems. The FAB system classifies AML into subtypes M0-M7
according to the cell type from which AML develops and the degree
of maturation of the cells (6).
According to the 2008 WHO Classification, AML are classified into
six subgroups: AML with recurring genetic abnormalities, AML with
myelodysplasia-related changes, therapy-related myeloid neoplasms,
not otherwise specified AML, myeloid proliferations related to down
syndrome and blastic plasmacytic dendritic cell neoplasms, with
diagnosis performed according to morphology, cytochemistry,
immunophenotype, genetics and clinical features (7).
Karyotypic abnormalities and genetic mutations are
associated with AML progression and prognosis. Translocation of
chromosomes 15 and 17 [t(15;17)], t(8;21) or inversion of
chromosome 16 is predictive of a relatively good prognosis
(8), whereas deletion of chromosome
7, deletion of 5q or >3 chromosomal abnormalities is predictive
of a poor prognosis in AML patients (9,10).
Fms-like tyrosine kinase 3-internal duplication (FLT3-ITD)
and nucleophosmin (NPM1) are the two most commonly mutated
genes in AML patients. Mutations to NPM1 occur in 50% of AML
patients, whereas mutations to FLT3-ITD occur in 30%.
FLT3-ITD, KIT proto-oncogene receptor tyrosine kinase and
brain and acute leukemia, cytoplasmic gene mutations have a
negative impact on AML prognosis (11,12), while
NPM1 and CCAAT/enhancer binding protein-α have a positive
impact on prognosis (12–14).
At present, the pathogenic mechanism of AML is
unclear. Acute promyelocytic leukemia (APL) is an M3 subtype of AML
according to the FAB classification system. Overexpression of
microRNA (miRNA/miR)-125a decreases APL NB4 cell proliferation, the
inhibition of cell cycle progression and the promotion of cell
apoptosis by targeting the ErbB pathway in APL (15). miR-150 expression induces the myeloid
differentiation of human acute leukemia cells and normal
hematopoietic progenitors. In AML patient samples and cell lines,
miR-150 expression is low or absent, which contributes to the
blocking of myeloid differentiation in acute leukemia cells
(16).
The aim of the present study was to identify
featured target genes of significantly differentially expressed
miRNAs in AML by comparing AML samples with healthy ones, and
analyzing the correlation of miRNA-target genes. Candidate target
genes identified by these approaches may provide the groundwork for
the elucidation of the mechanism of AML. However, further
investigation of the potential function of these genes in the
treatment of AML is required.
Materials and methods
Transcriptomics datasets
In the Gene Expression Omnibus (GEO; http://ncbi.nlm.nih.gov/geo/) (17), only the studies comparing AML and
healthy blood were assessed. A total of 6 studies were assessed in
which the global profile of gene expression was measured in AML
patients' blood samples, with accession numbers GSE48558, GSE35008,
GSE35010, GSE24395, GSE17054 and GSE51908. The details of studies,
including the platform, number of cases, controls, year and author,
were extracted and assessed.
Data processing and identification of
differentially expressed miRNAs and mRNAs
Raw expression datasets were downloaded from the GEO
and the raw datasets were preprocessed by log2
transformation and Z-score normalization. Limma, which is a linear
model for microarray data analysis, was utilized to analyze the
differentially expressed miRNAs and mRNAs between the AML and
healthy control samples (18). A
false discovery rate (FDR) of <0.05 was set as the threshold of
differentially expressed miRNAs and mRNAs.
miRNA target gene prediction
Targets genes for differentially expressed miRNAs
were predicted via miRTarBase (http://mirtarbase.mbc.nctu.edu.tw/). Over 50,000
miRNA-target interactions in the miRTarBase database have been
validated by experiments such as reporter assays, western blotting
or microarray experiments with overexpression or knockdown of
miRNAs (19,20).
Construction of regulatory miRNA-mRNA
networks
The miRNA-mRNA interaction network of differentially
expressed miRNA and mRNA was visualized using Cytoscape (http://cytoscape.org) (21). This software presents the regulation
between miRNA and mRNA as two-dimensional network with nodes and
edges, which represent miRNA-target gene associations.
Functional enrichment analysis of the
differentially expressed target genes
To obtain the functions of differentially expressed
targeted genes, Gene Ontology (GO) terms (22) and Kyoto Encyclopedia of Genes and
Genomes (KEGG) (23) pathways were
enriched using GOEAST (http://omicslab.genetics.ac.cn/GOEAST) (24) and GeneCodis (http://genecodis.cnb.csic.es/analysis), respectively
(25). P<0.01 and FDR <0.05
were set as the thresholds of significance for GO terms and KEGG
pathway analysis.
Reverse transcription-quantitative
polymerase chain reaction (RT-qPCR)
The blood samples were collected from 3 males with
AML treated in Qilu Hospital of Shandong University (Shandong,
China) in 2015, with a mean age of 45.6 years. In addition, 3
normal blood samples were also included with corresponding gender
and age. Total RNA of fresh blood samples were extracted by TRIzol
reagent (Invitrogen; Thermo Fisher Scientific, Inc., Waltham, MA,
USA) according to the manufacturer's instructions. Use of these
samples was approved by the Ethics Committee of Qilu Hospital of
Shandong University (Jinan, China). The SuperScript III Reverse
Transcription kit (Invitrogen; Thermo Fisher Scientific, Inc.) was
used to synthesize the cDNA according to the manufacturer's
instructions. RT-qPCR was performed using Power SYBR Green PCR
Master mix (Applied Biosystems; Thermo Fisher Scientific, Inc.) on
the Applied Biosystems 7500 (Applied Biosystems; Thermo Fisher
Scientific, Inc.). The RT-qPCR cycling conditions were 1 cycle of
95°C for 10 min, followed by 45 cycles of 95°C for 15 sec and 60°C
for 60 sec. The miRcute miRNA First-Strand cDNA kit (Tiangen
Biotech Co., Ltd., Bejing, China) and the miRcute miRNA qPCR
Detection kit (Tiangen Biotech Co., Ltd.) were used for miRNA
expression level detection. The RT-qPCR cycling conditions for
miRNA were 1 cycle of 94°C for 2 min, followed by 45 cycles of 94°C
for 20 sec and 60°C for 34 sec. U6 small nuclear RNA and β-actin
was used as internal controls for miRNA and mRNA detection,
respectively. The relative expression of target genes was
calculated using the 2−ΔΔCq method (26). At least three independent experiments
were performed. The PCR primers used were as follows: hsa-miR-155
forward, 5′-TAATGCTAATCGTGATAGGGGT-3′ and reverse,
GTGCAGGGTCCGAGGT; hsa-miR-192 forward, 5′-TGACCTATGAATTGACAGCC-3′
and reverse, GTGCAGGGTCCGAGGT; frizzled class receptor 3
(FZD3) forward, 5′-TCTCCTCTTAGCTGGCATTATATCC-3′ and reverse,
5′-GCAGCGTTCTTGTATCCACGTT-3′; and Annexin A2 (ANXA2)
forward, 5′-AGAATCATGGTCTCCCGCAGTG-3′ and reverse,
5′-TCCACCACACAGGTACAGCAGC-3′.
Statistical analysis
RT-qPCR experimental data was expressed as the mean
± standard deviation. Statistical significance was evaluated using
an unpaired Student's t-test. P<0.05 was considered to indicate
a statistically significant difference.
Results
Differentially expressed miRNAs and
mRNAs in AML
A total of 5 mRNA and 1 miRNA expression profiles
datasets, including 137 AML and 84 healthy samples were downloaded
from the GEO, normalized and processed (Table I) (27–31).
Differentially expressed genes between AML and normal samples,
including 86 miRNAs and 468 mRNAs, were screened with a threshold
of FDR<0.05. Of the 86 miRNAs, 47 were upregulated and 39 were
downregulated in AML samples compared with the normal samples; of
the 468 mRNAs, 401 were upregulated and genes 67 were
downregulated. The top 10 upregulated and downregulated miRNAs are
shown in Table II (the full list of
differentially expressed miRNAs and mRNAs is not shown).
 | Table I.Characteristics of mRNA and miRNA
expression profiling of the acute myeloid leukemia. |
Table I.
Characteristics of mRNA and miRNA
expression profiling of the acute myeloid leukemia.
| A, mRNA expression
profiling |
|---|
|
|---|
| Author, year | Gene expression
omnibus ID | Platform | Samples, H:P | (Refs.) |
|---|
| Civin et al,
2013 | GSE48558 | GPL6244
[HuGene-1_0-st] Affymetrix Human Gene 1.0 ST Array [transcript
(gene) version] | 49:18 | (27) |
| Barreyro et
al, 2012 | GSE35008 | GPL6244
[HuGene-1_0-st] Affymetrix Human Gene 1.0 ST Array | 16:12 | (28) |
| Barreyro et
al, 2012 | GSE35010 | GPL6244
[HuGene-1_0-st] Affymetrix Human Gene 1.0 ST Array | 16:15 | (28) |
| Kikushige et
al, 2010 | GSE24395 | GPL6106 Sentrix
Human-6 v2 Expression BeadChip | 5:12 | (29) |
| Majeti R et
al, 2009 | GSE17054 | GPL570
[HG-U133_Plus_2] Affymetrix Human Genome U133 Plus 2.0 Array | 4:9 | (30) |
|
| B, miRNA expression
profiling |
|
| Author, year | Gene expression
omnibus ID | Platform | Samples, H:P | (Refs.) |
|
| Tan YS et
al, 2013 | GSE51908 | GPL8786 [miRNA-1_0]
Affymetrix miRNA Array | 47:18 | (31) |
| Table II.Significantly differentially
expressed miRNAs (top 10). |
Table II.
Significantly differentially
expressed miRNAs (top 10).
| miRNA | P-value | Log
(fold-change) |
|---|
| Upregulated
miRNAs |
|
|
|
hsa-miR-432 |
9.93×10⁻¹² |
1.66 |
|
hsa-miR-126 |
7.44×10⁻¹⁰ |
1.57 |
|
hsa-miR-10a |
4.35×10⁻⁸ |
1.55 |
|
hsa-miR-130a |
3.39×10⁻¹¹ |
1.54 |
|
hsa-miR-34a |
2.05×10⁻¹⁴ |
1.43 |
|
hsa-miR-181d |
2.32×10⁻¹³ | 1.3 |
|
hsa-miR-181a* |
6.65×10⁻¹⁰ | 1.3 |
|
hsa-miR-551b* |
3.27×10⁻⁸ |
1.17 |
|
hsa-miR-501-5p |
1.17×10⁻⁸ |
1.08 |
|
hsa-miR-125b |
6.04×10⁻⁵ |
1.06 |
| Downregulated
miRNAs |
|
|
|
hsa-miR-192 |
6.74×10⁻⁷ |
−1.12 |
|
hsa-miR-29b-1* |
2.75×10⁻⁸ | −1.1 |
|
hsa-miR-194 |
1.66×10⁻⁵ | −1.1 |
|
hsa-miR-31 |
2.98×10⁻³ |
−1.05 |
|
hsa-miR-26b |
6.59×10⁻⁸ |
−0.971 |
|
hsa-miR-628-3p |
6.31×10⁻⁴ |
−0.755 |
|
hsa-miR-30e |
2.84×10⁻⁴ |
−0.715 |
|
hsa-miR-29b |
1.53×10⁻⁴ |
−0.664 |
|
hsa-miR-200c |
3.06×10⁻⁵ |
−0.635 |
|
hsa-miR-21 |
3.96×10⁻³ |
−0.605 |
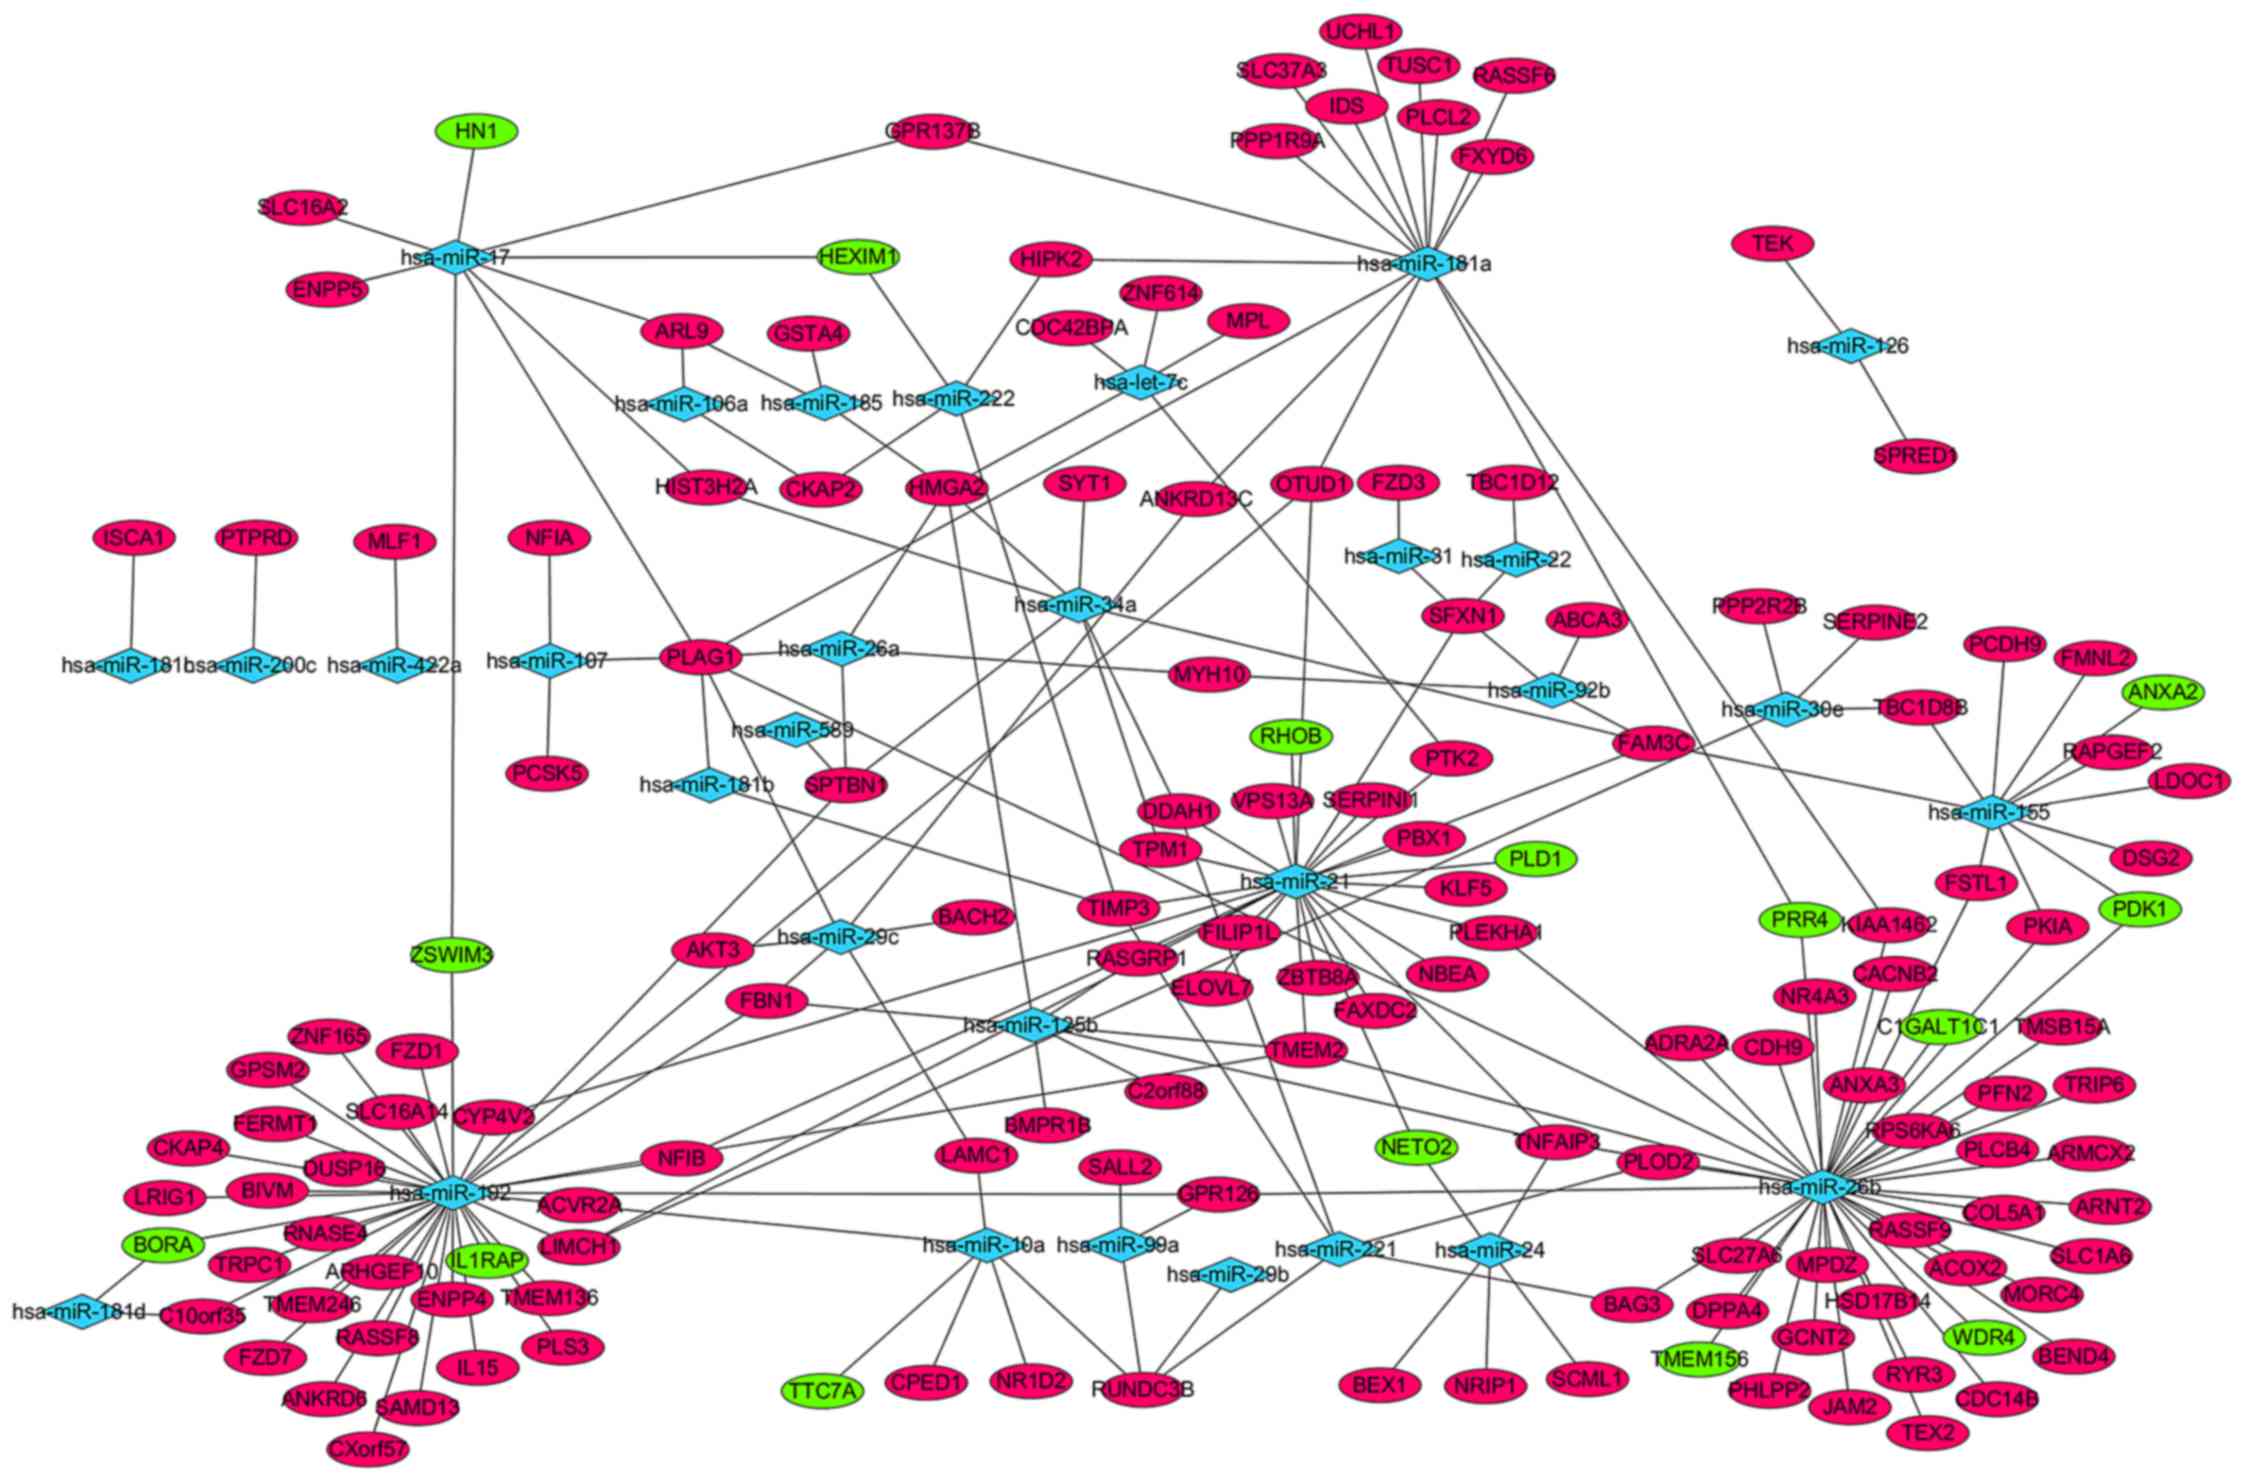
Construction of miRNA-mRNA regulatory
networks
The miRTarBase database was used to predict the
target genes of the 47 upregulated and 39 downregulated miRNAs in
AML; 223 miRNA-target gene pairs, including 31 differentially
expressed miRNAs and 153 target genes, were visualized using
Cytoscape software (Fig. 1). A total
of 55 differentially expressed miRNAs, including hsa-miR-29b-1* and
hsa-miR-194, were not displayed in the network, as the 55
differentially expressed miRNAs were not available in miRTarBase
database (data not shown). hsa-miR-26b, hsa-miR-192, hsa-miR-21,
hsa-miR-181a and hsa-miR-155 regulated 43, 25, 26, 15 and 11
targets, respectively, and displayed the highest connectivity.
Pleomorphic adenoma gene 1 (PLAG1), high-mobility group
AT-hook 2, RUN-domain-containing 3B, transmembrane protein 2, TNF-α
induced protein 3 and family with sequence similarity 3 member C,
which were regulated by 7, 5, 4, 4, 4 and 4 miRNAs, respectively,
were the mRNAs with the highest connectivity (Fig. 1).
Functional analysis of miRNA target
genes
GO classification and KEGG pathway analyses were
used to obtain the biological functions of miRNA target genes,
including biological process, cellular component, molecular
function and signaling pathway. The threshold of GO classification
was set as P<0.01. Negative regulation of blood coagulation
(GO:0030195, P=1.83×10⁻²⁴), negative regulation of
hemostasis (GO:1900047, P=1.83×10⁻²⁴) and negative
regulation of coagulation (GO:0050819, P=2.65×10⁻²³)
were the most significantly enriched target genes of biological
processes; sarcolemma (GO:0042383, P=1.85×10⁻²⁹),
Schmidt-Lanterman incisure (GO:0043220, P=1.80×10⁻²⁵)
and myelin sheath adaxonal region (GO:0035749,
P=5.91×10⁻²⁵) were the most significantly enriched
target genes of the cellular component; and phospholipase inhibitor
activity (GO:0004859, P=1.14×10−44), lipase inhibitor
activity (GO:0055102, P=3.76×10−43) and
calcium-dependent phospholipid binding (GO:0005544,
P=5.77×10−41) were the most significantly enriched
target genes of the molecular function (Table III).
| Table III.GO annotation of differentially
expressed microRNA target genes in acute myeloid leukemia samples
(top 15). |
Table III.
GO annotation of differentially
expressed microRNA target genes in acute myeloid leukemia samples
(top 15).
| GO ID | GO Term | Count | P-value |
|---|
| Biological
process |
|
|
|
|
GO:0030195 | Negative regulation
of blood coagulation | 21 |
1.83×10⁻²⁴ |
|
GO:1900047 | Negative regulation
of hemostasis | 21 |
1.83×10⁻²⁴ |
|
GO:0050819 | Negative regulation
of coagulation | 21 |
2.65×10⁻²³ |
|
GO:0042730 | Fibrinolysis | 17 |
1.90×10⁻²² |
|
GO:0040023 | Establishment of
nucleus localization | 16 |
2.55×10⁻²² |
|
GO:0051961 | Negative regulation
of nervous system development | 14 |
2.70×10⁻²² |
|
GO:0051964 | Negative regulation
of synapse assembly | 14 |
2.70×10⁻²² |
|
GO:0030198 | Extracellular
matrix organization | 35 |
6.31×10⁻²¹ |
|
GO:0043062 | Extracellular
structure organization | 35 |
6.58×10⁻²¹ |
|
GO:0051241 | Negative regulation
of multicellular organismal process | 40 |
2.08×10⁻²⁰ |
|
GO:0001525 | Angiogenesis | 35 |
2.86×10⁻²⁰ |
|
GO:0060252 | Positive regulation
of glial cell proliferation | 15 |
3.64×10⁻²⁰ |
|
GO:0030320 | Cellular monovalent
inorganic anion homeostasis | 14 |
3.68×10⁻²⁰ |
|
GO:0030644 | Cellular chloride
ion homeostasis | 14 |
3.68×10⁻²⁰ |
|
GO:0055064 | Chloride ion
homeostasis | 14 |
3.68×10⁻²⁰ |
| Cellular
component |
|
|
|
|
GO:0042383 | Sarcolemma | 33 |
1.85×10⁻²⁹ |
|
GO:0043220 | Schmidt-Lanterman
incisure | 18 |
1.80×10⁻²⁵ |
|
GO:0035749 | Myelin sheath
adaxonal region | 17 |
5.91×10⁻²⁵ |
|
GO:0043218 | Compact myelin | 18 |
2.95×10⁻²³ |
|
GO:0005925 | Focal adhesion | 30 |
1.69×10⁻²¹ |
|
GO:0005924 | Cell-substrate
adherens junction | 30 |
3.04×10⁻²¹ |
|
GO:0030055 | Cell-substrate
junction | 30 |
1.30×10⁻²⁰ |
|
GO:0070161 | Anchoring
junction | 32 |
1.09×10⁻¹⁷ |
|
GO:0005912 | Adherens
junction | 31 |
1.73×10⁻¹⁷ |
|
GO:0043209 | Myelin sheath | 18 |
2.16×10⁻¹⁵ |
|
GO:0019897 | Extrinsic to plasma
membrane | 18 |
2.01×10⁻¹³ |
|
GO:0019898 | Extrinsic to
membrane | 18 |
4.02×10⁻¹⁰ |
|
GO:0030054 | Cell junction | 40 |
1.61×10−09 |
|
GO:0014704 | Intercalated
disc | 14 |
2.10×10−09 |
|
GO:0044291 | Cell-cell contact
zone | 14 |
3.13×10−09 |
| Molecular
function |
|
|
|
|
GO:0004859 | Phospholipase
inhibitor activity | 29 |
1.14×10−44 |
|
GO:0055102 | Lipase inhibitor
activity | 29 |
3.76×10−43 |
|
GO:0005544 | Calcium-dependent
phospholipid binding | 35 |
5.77×10−41 |
|
GO:0030234 | Enzyme regulator
activity | 79 |
1.58×10⁻²³ |
|
GO:0004857 | Enzyme inhibitor
activity | 43 |
1.15×10⁻²² |
|
GO:0005509 | Calcium ion
binding | 65 |
2.23×10⁻²⁰ |
|
GO:0005546 |
Phosphatidylinositol-4,5-bisphosphate
binding | 18 |
2.28×10⁻²⁰ |
|
GO:0005543 | Phospholipid
binding | 53 |
7.37×10⁻¹⁹ |
|
GO:1901981 |
Phosphatidylinositol phosphate
binding | 19 |
2.81×10⁻¹⁷ |
|
GO:0008289 | Lipid binding | 56 |
1.54×10⁻¹⁵ |
|
GO:0043548 |
Phosphatidylinositol 3-kinase binding | 14 |
6.81×10⁻¹⁴ |
|
GO:0008092 | Cytoskeletal
protein binding | 51 |
1.35×10⁻¹³ |
|
GO:0017137 | Rab GTPase
binding | 17 |
1.55×10⁻¹³ |
|
GO:0004713 | Protein tyrosine
kinase activity | 25 |
1.43×10⁻¹² |
|
GO:0035091 |
Phosphatidylinositol binding | 22 |
2.75×10⁻¹¹ |
In total, 148 of the 153 differentially expressed
miRNA target genes were enriched in the KEGG database. The Wnt
signaling pathway (FDR=8.70×10⁻⁴), melanogenesis
(FDR=8.70×10⁻⁴) and pathways in cancer
(FDR=1.60×10⁻³) were the most significantly enriched
pathways in KEGG analysis, with the criteria of FDR<0.05
(Table IV).
| Table IV.KEGG pathway enrichment analysis of
differentially expressed microRNA target genes in acute myeloid
leukemia (top 15). |
Table IV.
KEGG pathway enrichment analysis of
differentially expressed microRNA target genes in acute myeloid
leukemia (top 15).
| KEGG ID | KEGG term | Count | FDR | Genes |
|---|
| hsa04310 | Wnt signaling
pathway | 4 |
8.70×10⁻⁴ | FZD7,
PLCB4, FZD1, FZD3 |
| hsa04916 | Melanogenesis | 4 |
8.70×10⁻⁴ | FZD7,
PLCB4, FZD1, FZD3 |
| hsa05200 | Pathways in
cancer | 8 |
1.60×10⁻³ | FZD7,
AKT3, FZD1, LAMC1, FZD3, PTK2,
ARNT2, PLD1 |
| hsa05146 | Amoebiasis | 4 |
2.65×10⁻³ | PLCB4,
LAMC1, PTK2, COL5A1 |
| hsa05222 | Small cell lung
cancer | 3 |
2.90×10⁻³ | AKT3,
LAMC1, PTK2 |
| hsa04010 | MAPK signaling
pathway | 6 |
3.04×10⁻³ | DUSP16,
RASGRP1, RPS6KA6, RAPGEF2, AKT3,
CACNB2 |
| hsa05217 | Basal cell
carcinoma | 3 |
3.59×10⁻³ | FZD7,
FZD1, FZD3 |
| hsa04724 | Glutamatergic
synapse | 4 |
4.75×10⁻³ | SLC1A6,
PLCB4, TRPC1, PLD1 |
| hsa04530 | Tight junction | 4 |
5.01×10⁻³ | JAM2,
MYH10, AKT3, MPDZ |
| hsa04630 | Jak-STAT signaling
pathway | 4 |
8.08×10⁻³ | IL15,
AKT3, MPL, SPRED1 |
| hsa04060 | Cytokine-cytokine
receptor interaction | 5 |
9.00×10⁻³ | IL15,
BMPR1B, MPL, IL1RAP, ACVR2A |
| hsa04660 | T-cell receptor
signaling pathway | 3 |
1.57×10⁻² | RASGRP1,
AKT3, PDK1 |
| hsa04510 | Focal adhesion | 4 |
1.61×10⁻² | AKT3,
LAMC1, PTK2, COL5A1 |
| hsa04722 | Neurotrophin
signaling pathway | 3 |
2.02×10⁻² | RPS6KA6,
AKT3, PDK1 |
| hsa05145 | Toxoplasmosis | 3 |
2.12×10⁻² | AKT3,
LAMC1, PDK1 |
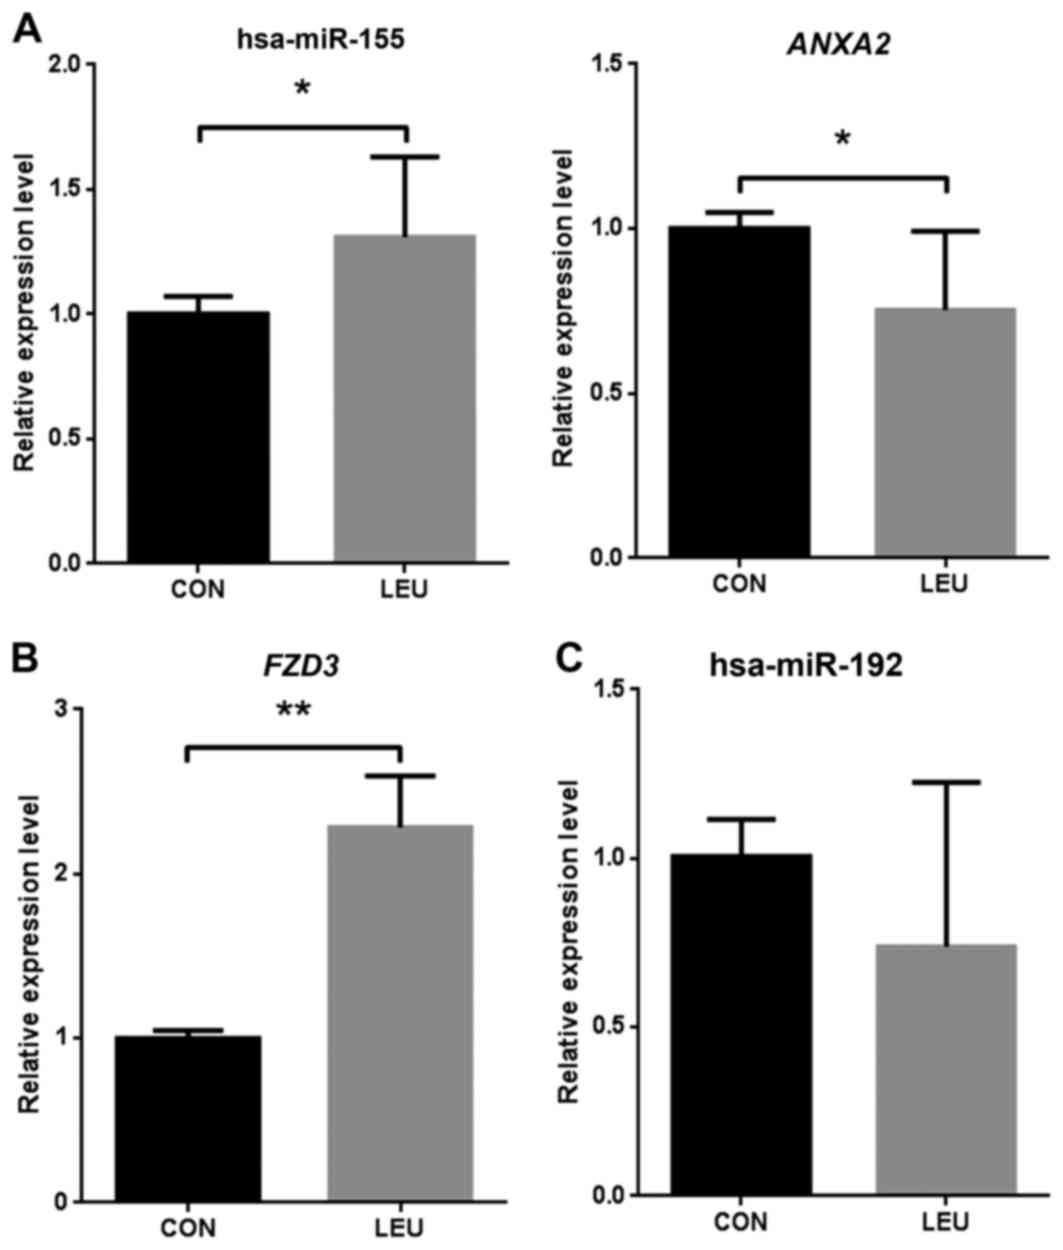
RT-qPCR validation of differentially
expressed miRNAs and target genes
To validate the microarray analysis data, the levels
of significant differentially expressed miRNA and target genes were
quantified by RT-qPCR in three AML blood samples and three normal
blood samples. hsa-miR-155 was significantly (P<0.05)
upregulated in AML compared with that in the normal samples, and
the target gene ANXA2 was significantly downregulated in AML
(Fig. 2A). FZD3 was
significantly upregulated in the three AML samples compared with
the normal samples (P<0.01; Fig.
2B). The present study identified hsa-miR-192 as a
downregulated miRNA in AML, although the expression level was not
found to be significantly different in AML by RT-qPCR validation
(Fig. 2C).
Discussion
In the present study, hsa-miR-155 was one of the
five miRNAs with the highest connectivity with target genes,
targeting 11 differentially expressed mRNAs (Fig. 1), and was significantly upregulated in
AML. In the present study, ANXA2 was predicted as a putative
target gene of hsa-miR-155. RT-qPCR validated that hsa-miR-155 was
significantly upregulated and ANXA2 was significantly
downregulated in AML (Fig. 2A), which
is in accordance with the bioinformatics analysis. The fact that
hsa-miR-155 was upregulated in AML was consistent with the results
of a previous study (32). Mounting
evidence identifies hsa-miR-155 as having an oncogenic role,
generating AML; overexpression of hsa-miR-155 causes
myeloproliferation with cell cell-cycle arrest (33,34). High
expression of hsa-miR-155 is associated with a poor outcome in AML
patients, which has been observed in numerous AML patients via
sequencing studies and miRNA expression analyses (35–37).
Additionally, hsa-miR-155 is reported to contribute to the
metastasis of various solid tumors, including colorectal carcinoma
(38), oral squamous cell carcinoma
(39) and renal cell carcinoma
(40). ANXA2 is a target gene
of hsa-miR-155 and its downregulation is associated with a poor AML
patient prognosis, based on gene expression profile analysis
(41). hsa-miR-155 upregulation and
ANXA2 downregulation may be potential biomarkers for the
clinical evaluation of AML prognosis.
Through KEGG analysis, FZD3 was found to be
enriched in four signaling pathways, including the Wnt signaling
pathway, melanogenesis, pathways in cancer and basal cell
carcinoma. The Wnt signaling pathway was the most significantly
enriched pathway in AML (Table IV).
Higher expression of FZD3 was detected in three AML patients
compared with that in the normal control, as determined by RT-qPCR
(Fig. 2B), which was consistent with
the bioinformatics analysis. FZD3 is a member of the
frizzled gene family, which also includes FZD1 and
FZD7, and functions as a receptor for the canonical
Wnt/β-catenin signaling pathway. Overactivation of the Wnt
signaling pathway contributes to tumorigenesis (42,43).
According to the present study, the Wnt signaling pathway was
essential for AML progression and oncogenicity. CXXC finger protein
5, which is frequently deleted in AML, inhibits the Wnt pathway and
leukemic cell proliferation (44).
Activation of the Wnt/β-catenin pathway mediates transformation of
AML progenitor cells and results in impaired myelomonocytic
differentiation (45,46). The FZD3/Wnt signaling pathway may
therefore be important in AML pathogenesis.
In the present study, hsa-miR-192 was the most
significantly downregulated miRNA and regulated 25 target genes in
AML (Fig. 1). miR-192 downregulation
is associated with cell cycle progression, cell growth, apoptosis
and proliferation of solid tumors (47,48).
Overexpression of miR-192 induces apoptotic death in bladder cancer
cells, increases the proportion of cells in the G0/G1 phase and
decreases the proportion of cells in the S phase compared with a
control (47). Curcumin is a
traditional Chinese medicine extracted from turmeric that inhibits
non-small cell lung cancer cell (NSCLC) cell proliferation and
induces NSCLC cell apoptosis through the upregulation of miR-192-5p
and the suppression of the phosphoinositide-3 kinase/protein kinase
B signaling pathway (47,48). In the present study, hsa-miR-192 was
downregulated in AML (Fig. 2C),
suggesting that it may also serve a key role in AML cell apoptosis
and proliferation.
PLAG1 was targeted by 7 miRNAs, meaning it
had the highest connectivity of the mRNAs in the miRNA-mRNA network
(Fig. 1). The PLAG family consists of
3 members (PLAG1, PLAGL1 and PLAGL2), each with a highly conserved
zinc finger structure that allows them to function as transcription
factors to recognize DNA and/or RNA (49). PLAG1 serves an oncogenic role in AML,
cooperating with CBF-SMMHC to induce AML tumorigenesis (50). The results of the present study
revealed that PLAG1 was upregulated in AML.
In summary, a miRNA-mRNA regulatory network was
constructed based on differentially expressed miRNAs and target
genes in AML. In this network, a number of miRNAs and target genes
that may play important roles in AML, such as hsa-miR-155,
hsa-miR192, ANXA2, FZD3 and PLAG1, were identified. These results
indicated that the Wnt signaling pathway, melanogenesis and
pathways in cancer may be involved in the pathogenesis of AML. An
miRNA-target gene regulatory network was constructed in AML using
bioinformatic tools. A number of miRNAs and mRNAs that are
potentially important for AML tumorigenesis were identified.
However, the mechanism behind the associations between miRNA, mRNA
and miRNA-mRNA involved in AML progression and development requires
further investigation.
Acknowledgements
The present study was supported by a grant from the
Program of Jining Science and Technology Development Plan (grant
no, 2015-57-102).
References
|
1
|
Chen W, Zheng R, Zeng H and Zhang S: The
updated incidences and mortalities of major cancers in China, 2011.
Chin J Cancer. 34:507. 2015. View Article : Google Scholar
|
|
2
|
Cripe LD: Adult acute leukemia. Curr Probl
Cancer. 21:1–64. 1997. View Article : Google Scholar : PubMed/NCBI
|
|
3
|
Marcucci G, Haferlach T and Döhner H:
Molecular genetics of adult acute myeloid leukemia: Prognostic and
therapeutic implications. J Clin Oncol. 29:475–486. 2011.
View Article : Google Scholar : PubMed/NCBI
|
|
4
|
Deguchi K and Gilliland DG: Cooperativity
between mutations in tyrosine kinases and in hematopoietic
transcription factors in AML. Leukemia. 16:740–744. 2002.
View Article : Google Scholar : PubMed/NCBI
|
|
5
|
Finn L, Sproat L, Heckman MG, Jiang L,
Diehl NN, Ketterling R, Tibes R, Valdez R and Foran J: Epidemiology
of adult acute myeloid leukemia: Impact of exposures on clinical
phenotypes and outcomes after therapy. Cancer Epidemiol.
39:1084–1092. 2015. View Article : Google Scholar : PubMed/NCBI
|
|
6
|
Bennett JM, Catovsky D, Daniel MT,
Flandrin G, Galton DA, Gralnick HR and Sultan C: Proposals for the
classification of the acute leukaemias. French-American-British
(FAB) co-operative group. Br J Haematol. 33:451–458. 1976.
View Article : Google Scholar : PubMed/NCBI
|
|
7
|
Vardiman JW, Thiele J, Arber DA, Brunning
RD, Borowitz MJ, Porwit A, Harris NL, Le Beau MM,
Hellström-Lindberg E, Tefferi A and Bloomfield CD: The 2008
revision of the World Health Organization (WHO) classification of
myeloid neoplasms and acute leukemia: Rationale and important
changes. Blood. 114:937–951. 2009. View Article : Google Scholar : PubMed/NCBI
|
|
8
|
Marcucci G, Mrózek K, Ruppert AS, Maharry
K, Kolitz JE, Moore JO, Mayer RJ, Pettenati MJ, Powell BL, Edwards
CG, et al: Prognostic factors and outcome of core binding factor
acute myeloid leukemia patients with t(8;21) differ from those of
patients with inv(16): A Cancer and Leukemia Group B study. J Clin
Oncol. 23:5705–5717. 2005. View Article : Google Scholar : PubMed/NCBI
|
|
9
|
Stone RM: Prognostic factors in AML in
relation to (ab)normal karyotype. Best Pract Res Clin Haematol.
22:523–528. 2009. View Article : Google Scholar : PubMed/NCBI
|
|
10
|
Schanz J and Haase D: Cytogenetic features
in myelodysplastic syndromes. 2014.
|
|
11
|
Care RS, Valk PJM, Goodeve AC, Abu-Duhier
FM, Geertsma-Kleinekoort WM, Wilson GA, Gari MA, Peake IR,
Löwenberg B and Reilly JT: Incidence and prognosis of c-KIT and
FLT3 mutations in core binding factor (CBF) acute myeloid
leukaemias. Br J Haematol. 121:775–777. 2003. View Article : Google Scholar : PubMed/NCBI
|
|
12
|
Langer C, Radmacher MD, Ruppert AS,
Whitman SP, Paschka P, Mrózek K, Baldus CD, Vukosavljevic T, Liu
CG, Ross ME, et al: High BAALC expression associates with other
molecular prognostic markers, poor outcome, and a distinct
gene-expression signature in cytogenetically normal patients
younger than 60 years with acute myeloid leukemia: A Cancer and
Leukemia Group B (CALGB) study. Blood. 111:5371–5379. 2008.
View Article : Google Scholar : PubMed/NCBI
|
|
13
|
Preudhomme C, Sagot C, Boissel N, Cayuela
JM, Tigaud I, de Botton S, Thomas X, Raffoux E, Lamandin C,
Castaigne S, et al: Favorable prognostic significance of CEBPA
mutations in patients with de novo acute myeloid leukemia: A study
from the acute leukemia French association (ALFA). Blood.
100:2717–2723. 2002. View Article : Google Scholar : PubMed/NCBI
|
|
14
|
Döhner K, Tobis K, Ulrich R, Fröhling S,
Benner A, Schlenk RF and Döhner H: Prognostic significance of
partial tandem duplications of the MLL gene in adult patients 16 to
60 years old with acute myeloid leukemia and normal cytogenetics: A
study of the acute myeloid leukemia study group Ulm. J Clin Oncol.
20:3254–3261. 2002. View Article : Google Scholar : PubMed/NCBI
|
|
15
|
Ufkin ML, Peterson S, Yang X, Driscoll H,
Duarte C and Sathyanarayana P: miR-125a regulates cell cycle,
proliferation, and apoptosis by targeting the ErbB pathway in acute
myeloid leukemia. Leuk Res. 38:402–410. 2014. View Article : Google Scholar : PubMed/NCBI
|
|
16
|
Morris VA, Zhang A, Yang T, Stirewalt DL,
Ramamurthy R, Meshinchi S and Oehler VG: MicroRNA-150 expression
induces myeloid differentiation of human acute leukemia cells and
normal hematopoietic progenitors. PLoS One. 8:e758152013.
View Article : Google Scholar : PubMed/NCBI
|
|
17
|
Edgar R, Domrachev M and Lash AE: Gene
expression omnibus: NCBI gene expression and hybridization array
data repository. Nucleic Acids Res. 30:207–210. 2002. View Article : Google Scholar : PubMed/NCBI
|
|
18
|
Diboun I, Wernisch L, Orengo CA and
Koltzenburg M: Microarray analysis after RNA amplification can
detect pronounced differences in gene expression using limma. BMC
Genomics. 7:2522006. View Article : Google Scholar : PubMed/NCBI
|
|
19
|
Hsu SD, Lin FM, Wu WY, Liang C, Huang WC,
Chan WL, Tsai WT, Chen GZ, Lee CJ, Chiu CM, et al: miRTarBase: A
database curates experimentally validated microRNA-target
interactions. Nucleic Acids Res. 39:(Database Issue). D163–D169.
2011. View Article : Google Scholar : PubMed/NCBI
|
|
20
|
Hsu SD, Tseng YT, Shrestha S, Lin YL,
Khaleel A, Chou CH, Chu CF, Huang HY, Lin CM, Ho SY, et al:
miRTarBase update 2014: An information resource for experimentally
validated miRNA-target interactions. Nucleic Acids Res.
42:(Database Issue). D78–D85. 2014. View Article : Google Scholar : PubMed/NCBI
|
|
21
|
Shannon P, Markiel A, Ozier O, Baliga NS,
Wang JT, Ramage D, Amin N, Schwikowski B and Ideker T: Cytoscape: A
software environment for integrated models of biomolecular
interaction networks. Genome Res. 13:2498–2504. 2003. View Article : Google Scholar : PubMed/NCBI
|
|
22
|
Cheng L, Lin H, Hu Y, Wang J and Yang Z:
Gene function prediction based on the Gene Ontology hierarchical
structure. PLoS One. 9:e1071872014. View Article : Google Scholar : PubMed/NCBI
|
|
23
|
Kanehisa M, Sato Y, Kawashima M, Furumichi
M and Tanabe M: KEGG as a reference resource for gene and protein
annotation. Nucleic Acids Res. 44:D457–D462. 2016. View Article : Google Scholar : PubMed/NCBI
|
|
24
|
Zheng Q and Wang XJ: GOEAST: A web-based
software toolkit for Gene Ontology enrichment analysis. Nucleic
Acids Res. 36:W358–W363. 2008. View Article : Google Scholar : PubMed/NCBI
|
|
25
|
Carmona-Saez P, Chagoyen M, Tirado F,
Carazo JM and Pascual-Montano A: GENECODIS: A web-based tool for
finding significant concurrent annotations in gene lists. Genome
Biol. 8:R32007. View Article : Google Scholar : PubMed/NCBI
|
|
26
|
Livak KJ and Schmittgen TD: Analysis of
relative gene expression data using real-time quantitative PCR and
the 2(−Delta Delta C(T)) method. Methods. 25:402–408. 2001.
View Article : Google Scholar : PubMed/NCBI
|
|
27
|
Cramer-Morales K, Nieborowska-Skorska M,
Scheibner K, Padget M, Irvine DA, Sliwinski T, Haas K, Lee J, Geng
H, Roy D, et al: Personalized synthetic lethality induced by
targeting RAD52 in leukemias identified by gene mutation and
expression profile. Blood. 122:1293–1304. 2013. View Article : Google Scholar : PubMed/NCBI
|
|
28
|
Barreyro L, Will B, Bartholdy B, Zhou L,
Todorova TI, Stanley RF, Ben-Neriah S, Montagna C, Parekh S,
Pellagatti A, et al: Overexpression of IL-1 receptor accessory
protein in stem and progenitor cells and outcome correlation in AML
and MDS. Blood. 120:1290–1298. 2012. View Article : Google Scholar : PubMed/NCBI
|
|
29
|
Kikushige Y, Shima T, Takayanagi S, Urata
S, Miyamoto T, Iwasaki H, Takenaka K, Teshima T, Tanaka T, Inagaki
Y and Akashi K: TIM-3 is a promising target to selectively kill
acute myeloid leukemia stem cells. Cell Stem Cell. 7:708–717. 2010.
View Article : Google Scholar : PubMed/NCBI
|
|
30
|
Majeti R, Becker MW, Tian Q, Lee TL, Yan
X, Liu R, Chiang JH, Hood L, Clarke MF and Weissman IL:
Dysregulated gene expression networks in human acute myelogenous
leukemia stem cells. Proc Natl Acad Sci USA. 106:3396–3401. 2009.
View Article : Google Scholar : PubMed/NCBI
|
|
31
|
Tan YS, Kim M, Kingsbury TJ, Civin CI and
Cheng WC: Regulation of RAB5C is important for the growth
inhibitory effects of MiR-509 in human precursor-B acute
lymphoblastic leukemia. PLoS One. 9:e1117772014. View Article : Google Scholar : PubMed/NCBI
|
|
32
|
Havelange V, Stauffer N, Heaphy CC,
Volinia S, Andreeff M, Marcucci G, Croce CM and Garzon R:
Functional implications of microRNAs in acute myeloid leukemia by
integrating microRNA and messenger RNA expression profiling.
Cancer. 117:4696–4706. 2011. View Article : Google Scholar : PubMed/NCBI
|
|
33
|
Forrest AR, Kanamori-Katayama M, Tomaru Y,
Lassmann T, Ninomiya N, Takahashi Y, de Hoon MJ, Kubosaki A, Kaiho
A, Suzuki M, et al: Induction of microRNAs, mir-155, mir-222,
mir-424 and mir-503, promotes monocytic differentiation through
combinatorial regulation. Leukemia. 24:460–466. 2010. View Article : Google Scholar : PubMed/NCBI
|
|
34
|
O'Connell RM, Rao DS, Chaudhuri AA, Boldin
MP, Taganov KD, Nicoll J, Paquette RL and Baltimore D: Sustained
expression of microRNA-155 in hematopoietic stem cells causes a
myeloproliferative disorder. J Exp Med. 205:585–594. 2008.
View Article : Google Scholar : PubMed/NCBI
|
|
35
|
Marcucci G, Maharry KS, Metzeler KH,
Volinia S, Wu YZ, Mrózek K, Nicolet D, Kohlschmidt J, Whitman SP,
Mendler JH, et al: Clinical role of microRNAs in cytogenetically
normal acute myeloid leukemia: miR-155 upregulation independently
identifies high-risk patients. J Clin Oncol. 31:2086–2093. 2013.
View Article : Google Scholar : PubMed/NCBI
|
|
36
|
Chuang MK, Chiu YC, Chou WC, Hou HA,
Chuang EY and Tien HF: A 3-microRNA scoring system for
prognostication in de novo acute myeloid leukemia patients.
Leukemia. 29:1051–1059. 2015. View Article : Google Scholar : PubMed/NCBI
|
|
37
|
Zhi F, Cao X, Xie X, Wang B, Dong W, Gu W,
Ling Y, Wang R, Yang Y and Liu Y: Identification of circulating
microRNAs as potential biomarkers for detecting acute myeloid
leukemia. PLoS One. 8:e567182013. View Article : Google Scholar : PubMed/NCBI
|
|
38
|
Qu YL, Wang HF, Sun ZQ, Tang Y, Han XN, Yu
XB and Liu K: Up-regulated miR-155-5p promotes cell proliferation,
invasion and metastasis in colorectal carcinoma. Int J Clin Exp
Pathol. 8:6988–6994. 2015.PubMed/NCBI
|
|
39
|
Baba O, Hasegawa S, Nagai H, Uchida F,
Yamatoji M, Kanno NI, Yamagata K, Sakai S, Yanagawa T and Bukawa H:
MicroRNA-155-5p is associated with oral squamous cell carcinoma
metastasis and poor prognosis. J Oral Pathol Med. 45:248–255. 2016.
View Article : Google Scholar : PubMed/NCBI
|
|
40
|
Merhautova J, Hezova R, Poprach A,
Kovarikova A, Radova L, Svoboda M, Vyzula R, Demlova R and Slaby O:
miR-155 and miR-484 are associated with time to progression in
metastatic renal cell carcinoma treated with sunitinib. Biomed Res
Int. 2015:9419802015. View Article : Google Scholar : PubMed/NCBI
|
|
41
|
Park MH, Cho SA, Yoo KH, Yang MH, Ahn JY,
Lee HS, Lee KE, Mun YC, Cho DH, Seong CM and Park JH: Gene
expression profile related to prognosis of acute myeloid leukemia.
Oncol Rep. 18:1395–1402. 2007.PubMed/NCBI
|
|
42
|
Conacci-Sorrell M, Zhurinsky J and
Ben-Ze'ev A: The cadherin-catenin adhesion system in signaling and
cancer. J Clin Invest. 109:987–991. 2002. View Article : Google Scholar : PubMed/NCBI
|
|
43
|
Giles RH, van Es JH and Clevers H: Caught
up in a Wnt storm: Wnt signaling in cancer. Biochim Biophys Acta.
1653:1–24. 2003.PubMed/NCBI
|
|
44
|
Kühnl A, Valk PJ, Sanders MA, Ivey A,
Hills RK, Mills KI, Gale RE, Kaiser MF, Dillon R, Joannides M, et
al: Downregulation of the Wnt inhibitor CXXC5 predicts a better
prognosis in acute myeloid leukemia. Blood. 125:2985–2994. 2015.
View Article : Google Scholar : PubMed/NCBI
|
|
45
|
Wang Y, Krivtsov AV, Sinha AU, North TE,
Goessling W, Feng Z, Zon LI and Armstrong SA: The Wnt/beta-catenin
pathway is required for the development of leukemia stem cells in
AML. Science. 327:1650–1653. 2010. View Article : Google Scholar : PubMed/NCBI
|
|
46
|
Simon M, Grandage VL, Linch DC and Khwaja
A: Constitutive activation of the Wnt/beta-catenin signalling
pathway in acute myeloid leukaemia. Oncogene. 24:2410–2420. 2005.
View Article : Google Scholar : PubMed/NCBI
|
|
47
|
Ye M and Zhang J and Zhang J, Miao Q, Yao
L and Zhang J: Curcumin promotes apoptosis by activating the
p53-miR-192-5p/215-XIAP pathway in non-small cell lung cancer.
Cancer Lett. 357:196–205. 2015. View Article : Google Scholar : PubMed/NCBI
|
|
48
|
Jin H, Qiao F, Wang Y, Xu Y and Shang Y:
Curcumin inhibits cell proliferation and induces apoptosis of human
non-small cell lung cancer cells through the upregulation of
miR-192-5p and suppression of PI3K/Akt signaling pathway. Oncol
Rep. 34:2782–2789. 2015. View Article : Google Scholar : PubMed/NCBI
|
|
49
|
Kas K, Voz ML, Hensen K, Meyen E and Van
de Ven WJ: Transcriptional activation capacity of the novel PLAG
family of zinc finger proteins. J Biol Chem. 273:23026–23032. 1998.
View Article : Google Scholar : PubMed/NCBI
|
|
50
|
Landrette SF, Kuo YH, Hensen K, van
Waalwijk van Doorn-Khosrovani Barjesteh S, Perrat PN, Van de Ven
WJ, Delwel R and Castilla LH: Plag1 and Plagl2 are oncogenes that
induce acute myeloid leukemia in cooperation with Cbfb-MYH11.
Blood. 105:2900–2907. 2005. View Article : Google Scholar : PubMed/NCBI
|