Introduction
Stomach carcinoma (SC) was the third leading cause
of cancer-associated mortality in men and the fifth in women
worldwide in 2012 (1). The incidence
rate of SC in men is approximately twice as high as that in women.
In general, incidence rates of SC are high in Eastern Asia
(particularly in Korea, Mongolia, Japan and China) and low in
Africa (1). In China, SC is the
second and third most commonly diagnosed cancer in men and women,
respectively, and is the second leading cause of cancer-associated
mortality in men and women, ranking below only lung and bronchial
cancer (2).
Stomach adenocarcinoma (STAD) accounts for >95%
of all SC cases. Due to the atypical symptoms of the disease in its
early stages, >80% of patients are clinically diagnosed at
advanced stages, which is associated with a poor outcome (3). The 5-year survival rate for those
diagnosed in the early stages of STAD is >90%, whereas for those
diagnosed at an advanced stage, it is typically <5% (3,4).
To date, the major etiological factors of STAD have
been reported as environmental factors and familial inheritance
(5,6).
Environmental factors include tobacco and alcohol consumption, and
Helicobacter pylori (H. pylori) infection. H.
pylori infection has been identified as the most pronounced
risk factor for STAD; 90% of new cases of non-cardia STAD worldwide
are attributed to chronic H. pylori infection, with a hazard
ratio of 5.9 (7).
Familial inheritance of host factors is another
reported risk factor for STAD, although it contributes to <10%
of STAD cases (7). Mutations of
stromelysin-1, Ras homolog family member A, DNA polymerase β and
Notch 1 are associated with STAD tumorigenesis (8–11).
The molecular mechanisms of STAD development are
unclear. Increasing evidence indicates that microRNAs (miRNAs or
miRs) may contribute to the tumorigenesis and development of STAD.
For example, the inhibited or unchanged expression of miR-486-5p
compared with adjacent non-tumor tissues was previously identified
to indicate a poor prognosis for patients with STAD (12); miR-15a and miR-16-1 suppress cell
proliferation, monolayer colony formation, invasion and migration
via targeting Yes-associated protein 1 in STAD (13); miR-200b-3p is associated with brain
metastasis of STAD (14); and miR-107
is upregulated in gastric cancer, and the single nucleotide
polymorphism rs2296616 in the promoter of miR-107 is associated
with the increased survival of patients with STAD and a decreased
STAD susceptibility (15).
In the present study, bioinformatics and univariate
Cox regression analyses were applied to identify the miRNAs
associated with the overall survival (OS) time of STAD patients,
aiming to provide valuable information on potential biomarkers for
the diagnosis, prognosis and therapy of STAD.
Materials and methods
Patients and samples
The data from a total of 443 patients with STAD were
retrieved from The Cancer Genome Atlas (TCGA) data portal on the
16th of November 2015 (16). The
exclusion criteria for patients were as follows: i) Patients had
other history of malignancy; and ii) patients had incomplete
follow-up records, with data on survival time unavailable. Overall,
423 patients with STAD were included in the study. The clinical
records of the 423 patients, the corresponding level 3 raw data of
miRNA and mRNA expression from tumors, and the normal control
tissue data from the Illumina HiSeq_miRNAseq platform, were
downloaded from the TCGA data portal. Clinical information included
age, sex, ethnicity, tumor grade, history of other malignancy,
survival status and follow-up data.
Identification of differentially
expressed (DE) mRNAs and DEmiRNAs in STAD
mRNA expression data was available for 415 of the
423 patients with STAD and 35 of the control datasets. miRNA
expression data was available for 400 of the 423 patients with STAD
and 46 of the control datasets. mRNAs or miRNAs expressed in
<20% of the patients were excluded from the expression dataset.
The significance of the difference in the expression of mRNAs and
miRNAs between STAD and normal controls was analyzed by the DESeq2
package in R version 3.2.1 (17). The
threshold for DEmRNAs and DEmiRNAs was set at a false discovery
rate (FDR) <0.001 and |log2 fold change| >1.5.
Pearson correlation coefficient (PCC)
analysis between DEmRNAs and DEmiRNAs
In order to analyze the correlation between DEmRNAs
and DEmiRNAs, PCCs (18) were
calculated for each miRNA-mRNA interaction with a negative
correlation through the cor.test function of R. PCC <-0.3 and
P<0.05 were set as the thresholds for significant interactions
between DEmiRNAs and DEmRNAs.
Target prediction for DEmiRNAs
To obtain the target genes for miRNAs, the DEmiRNAs
were queried in the miRanda database (microRNA.org)
of experimentally confirmed interactions between target genes and
miRNAs. miRNA-target gene pairs obtained from PCC analysis in the
present study and from the miRanda search were overlapped, and
interactions that were not included in the aforementioned lists
were screened.
Analysis of DEmiRNAs associated with
survival time of STAD
The association between miRNA expression level and
OS was performed using univariate Cox regression, with a threshold
of P<0.01. A hazard ratio (HR) >1 indicates miRNAs negatively
associated with survival in patients with STAD (i.e., higher
expression=shorter OS time), whereas a HR <1 indicates miRNAs
positively associated with survival in patients with STAD (i.e.,
higher expression=longer OS time).
miRNA-mRNA regulatory network
DEmiRNAs associated with STAD survival and the
associated target genes were used to construct an miRNA-mRNA
regulatory network with Cytoscape version 3.1.0 software (19).
Function and pathways enrichment of
target genes of miRNAs
The underlying functions and pathways of the target
genes of miRNAs were predicted by Gene Ontology (GO) and Kyoto
Encyclopedia of Genes and Genomes (KEGG) pathway enrichment
analyses (20,21). FDR <0.05 was set as the cut-off for
GO and KEGG analysis.
Kaplan-meier analysis of the
association between 5 DEmiRNAs and survival time
Kaplan-Meier curves for OS analysis were produced to
analyze the association between the respective expression level of
5 DEmiRNAs and OS time. The 400 patients with miRNA expression data
from the TCGA dataset were segregated into high- and low-expression
groups with the cut-off of the median miRNA expression level.
Kaplan-Meier curves were drawn, and a log-rank test was performed
to determine the survival difference between groups. P<0.05 was
considered to indicate a significant difference. Kaplan-Meier and
log-rank test analyses were performed by SPSS version 19.0 (IBM
Corp., Armonk, NY, USA).
Results
Basic information of the study
cohort
Of the 423 patients enrolled in the study, there
were follow-up and miRNA data available for 312 patients. Table I shows the basic information of the
study cohort.
 | Table I.Basic information of the study
cohort. |
Table I.
Basic information of the study
cohort.
| Patient
information | Data |
|---|
| Sex |
|
|
Male | 195 |
|
Female | 117 |
| Age, years |
|
|
Mean | 64.5 |
|
Median | 65 |
|
Range | 30–90 |
| Ethnicity |
|
|
Asian | 82 |
|
White | 204 |
|
African | 6 |
| Tumor grade |
|
| G1 | 5 |
| G2 | 107 |
| G3 | 193 |
| GX | 7 |
| Patient
survival |
|
|
Yes | 220 |
| No | 92 |
| Follow-up time,
days |
|
|
Mean | 651 |
|
Median | 509 |
|
Range | 0–3, 720 |
Identification of DEmRNAs in STAD
mRNA expression data from 415 STAD tissue samples
and 35 non-tumor tissue samples were downloaded from TGCA (Table II). From the total 20,531 mRNAs, the
mRNAs expressed in <20% of the patients were removed, to produce
a list of 16,678 mRNAs, which subsequently underwent differential
expression analysis. A total of 1,772 mRNAs, including 1,060
upregulated genes and 712 downregulated genes, were identified as
DE based on the criteria of FDR <0.001 and |log2 fold
change| >1.5. The top 10 upregulated and downregulated DEmRNAs
in STAD are included in Table
III.
| Table II.Basic information of mRNA and miRNA
expression data. |
Table II.
Basic information of mRNA and miRNA
expression data.
| Data type | Platform | Genes | Cases | Controls |
|---|
| mRNA | Illumina
HiSeq_RNASeqV2 | 20,531 | 415 | 35 |
| miRNA | Illumina
HiSeq_miRNASeq | 1,046 | 400 | 46 |
| Table III.The top 10 upregulated and
downregulated differentially expressed mRNAs in stomach
adenocarcinoma. |
Table III.
The top 10 upregulated and
downregulated differentially expressed mRNAs in stomach
adenocarcinoma.
| A, Upregulated
mRNAs |
|---|
|
|---|
| Gene symbol | Gene name | Gene ID | log2 fold
change | P-value | False discovery
rate |
|---|
| FLG | Filaggrin | 2312 | 5.8937 |
1.86×10−47 |
1.44×10−44 |
| RBP2 | Retinol binding
protein 2 | 5948 | 5.4607 |
3.51×10⁻²⁵ |
1.75×10⁻²³ |
| AQP10 | Aquaporin 10 | 89872 | 5.4469 |
2.55×10⁻³² |
3.28×10⁻³⁰ |
| MEP1B | Meprin A subunit
β | 4225 | 5.4444 |
8.12×10⁻²⁹ |
6.53×10⁻²⁷ |
| SYNPO2L | Synaptopodin
2-like | 79933 | 4.7689 |
9.87×10−48 |
8.23×10−45 |
| MAL | Mal T-cell
differentiation protein | 4118 | 4.5980 |
8.80×10⁻²² |
3.06×10⁻²⁰ |
| ALOX12 | Arachidonate
12-lipoxygenase, 12S type | 239 | 4.5728 |
2.61×10−37 |
6.21×10⁻³⁵ |
| ENPP3 | Ectonucleotide
pyrophosphatase/phosphodiesterase 3 | 5169 | 4.5383 |
1.52×10⁻³⁴ |
2.43×10⁻³² |
| TGM3 | Transglutaminase
3 | 7053 | 4.4663 |
3.68×10⁻¹⁶ |
5.66×10⁻¹⁵ |
| ENDOU | Endonuclease,
poly(U) specific | 8909 | 4.4587 |
9.78×10⁻¹⁹ |
2.17×10⁻¹⁷ |
|
| B, Downregulated
mRNAs |
|
| Gene symbol | Gene name | Gene ID | log2 fold
change | P-value | False discovery
rate |
|
| CST1 | Cystatin SN | 1469 | −7.4241 |
1.90×10−99 |
1.58×10−95 |
| COL10A1 | Collagen type-X α 1
chain | 1300 | −7.0398 |
5.07×10−104 |
8.45×10−100 |
| ALPP | Alkaline
phosphatase, placental | 250 | −6.7971 |
1.35×10−42 |
6.25×10−40 |
| COL11A1 | Collagen type-XI α
1 chain | 1301 | −6.7034 |
2.41×10−70 |
1.00×10−66 |
| IBSP | Integrin-binding
sialoprotein | 3381 | −6.3919 |
4.7×10−40 |
1.70×10−37 |
| HOXC10 | Homeobox C10 | 3226 | −6.3265 |
7.66×10−59 |
1.60×10−55 |
| BAAT | Bile acid-CoA:amino
acid N-acyltransferase | 570 | −5.8683 |
1.30×10−43 |
6.97×10−41 |
| CST4 | Cystatin S | 1472 | −5.8488 |
5.52×10−42 |
2.36×10−39 |
| PRAME | Preferentially
expressed antigen in melanoma | 23532 | −5.8100 |
3.13×10−37 |
7.30×10⁻³⁵ |
| IGF2BP1 | Insulin like growth
factor 2 mRNA binding protein 1 | 10642 | −5.4442 |
5.02×10⁻²⁹ |
4.08×10⁻²⁷ |
Identification of DEmiRNAs in
STAD
miRNA expression data from 400 STAD tissue samples
and 46 non-tumor tissues were downloaded (Table I). From 1,046 miRNAs, miRNAs expressed
in <20% of the patients with STAD were removed, to give a total
of 355 miRNAs that subsequently underwent differential expression
analysis. A total of 43 miRNAs, including 15 upregulated miRNAs and
28 downregulated miRNAs, were identified as DE based on the
criteria of FDR <0.001 and |log2 fold change| >1.5
(Table IV).
| Table IV.All identified differentially
expressed miRNAs in stomach adenocarcinoma. |
Table IV.
All identified differentially
expressed miRNAs in stomach adenocarcinoma.
| A, Upregulated
miRNAs |
|---|
|
|---|
| miRNA | log2 fold
change | P-value | False discovery
rate |
|---|
| hsa-miR-490 | 3.1458 |
6.24×10⁻¹⁵ |
3.63×10⁻¹⁴ |
| hsa-miR-1–2 | 3.1339 |
2.77×10⁻²⁶ |
6.15×10⁻²⁵ |
| hsa-miR-133a-1 | 3.0433 |
7.51×10⁻²⁶ |
1.57×10⁻²⁴ |
| hsa-miR-133b | 2.7491 |
2.43×10⁻¹⁹ |
2.27×10⁻¹⁸ |
| hsa-miR-145 | 2.3263 |
4.71×10⁻²⁸ |
1.19×10⁻²⁶ |
| hsa-miR-139 | 2.3006 |
2.48×10−42 |
1.76×10−40 |
| hsa-miR-143 | 2.0146 |
2.32×10⁻²¹ |
3.05×10⁻²⁰ |
| hsa-miR-551b | 2.0124 |
1.05×10⁻¹⁶ |
7.75×10⁻¹⁶ |
| hsa-miR-204 | 1.8210 |
4.64×10⁻¹⁰ |
1.62×10⁻⁹ |
| hsa-miR-203 | 1.6346 |
3.41×10⁻¹¹ |
1.36×10⁻¹⁰ |
| hsa-miR-129–1 | 1.6208 |
3.33×10⁻⁹ |
9.92×10⁻⁹ |
| hsa-miR-195 | 1.5777 |
1.67×10⁻²³ |
2.69×10⁻²² |
| hsa-miR-29c | 1.5755 |
2.27×10⁻²⁶ |
5.38×10⁻²⁵ |
| hsa-miR-30a | 1.5660 |
8.37×10⁻²² |
1.19×10⁻²⁰ |
| hsa-miR-486 | 1.5314 |
3.65×10⁻¹⁵ |
2.27×10⁻¹⁴ |
|
| B, Downregulated
miRNAs |
|
| miRNA | log2 fold
change | P-value | False discovery
rate |
|
| hsa-miR-552 | −5.5020 |
3.04×10−39 |
1.35×10−37 |
| hsa-miR-196a-1 | −4.6379 |
5.6×10−70 |
9.93×10−68 |
| hsa-miR-196b | −4.3338 |
4.45×10−51 |
5.27×10−49 |
| hsa-miR-196a-2 | −4.1434 |
3.00×10−41 |
1.78×10−39 |
| hsa-miR-135b | −3.0610 |
1.16×10−43 |
1.03×10−41 |
| hsa-miR-935 | −2.6811 |
1.64×10⁻¹⁹ |
1.57×10⁻¹⁸ |
| hsa-miR-937 | −2.4858 |
7.67×10⁻²⁰ |
7.78×10⁻¹⁹ |
| hsa-miR-615 | −2.3883 |
4.68×10⁻¹⁷ |
3.53×10⁻¹⁶ |
| hsa-miR-483 | −2.3147 |
1.84×10⁻¹¹ |
7.61×10⁻¹¹ |
| hsa-miR-3648 | −2.3098 |
5.98×10⁻¹⁵ |
3.54×10⁻¹⁴ |
| hsa-miR-18a | −2.0652 |
3.4×10⁻³¹ |
1.01×10⁻²⁹ |
| hsa-miR-592 | −1.9724 |
6.98×10⁻¹⁶ |
4.76×10⁻¹⁵ |
| hsa-miR-21 | −1.8538 |
8.04×10−71 |
2.85×10−68 |
| hsa-miR-146b | −1.8327 |
4.90×10−40 |
2.48×10−38 |
| hsa-miR-508 | −1.8088 |
7.69×10⁻¹¹ |
3.00×10⁻¹⁰ |
| hsa-miR-301b | −1.8030 |
2.04×10⁻¹² |
9.79×10⁻¹² |
| hsa-miR-1304 | −1.7771 |
4.30×10⁻¹⁰ |
1.51×10⁻⁹ |
| hsa-miR-877 | −1.7532 |
5.21×10⁻¹⁸ |
4.20×10⁻¹⁷ |
| hsa-miR-96 | −1.7472 |
2.16×10⁻²⁰ |
2.39×10⁻¹⁹ |
| hsa-miR-183 | −1.7346 |
1.12×10⁻²⁰ |
1.33×10⁻¹⁹ |
| hsa-miR-1254 | −1.7246 |
1.88×10⁻¹⁰ |
6.95×10⁻¹⁰ |
| hsa-miR-7–3 | −1.6924 |
7.52×10⁻¹² |
3.22×10⁻¹¹ |
| hsa-miR-1228 | −1.6516 |
1.42×10⁻¹² |
6.91×10⁻¹² |
| hsa-miR-3651 | −1.6116 |
1.74×10⁻⁹ |
5.57×10⁻⁹ |
| hsa-miR-181b-2 | −1.5918 |
3.05×10⁻¹⁷ |
2.36×10⁻¹⁶ |
| hsa-miR-501 | −1.5581 |
1.54×10⁻²⁸ |
4.2×10⁻²⁷ |
| hsa-miR-584 | −1.5446 |
1.64×10⁻¹⁴ |
9.12×10⁻¹⁴ |
| hsa-miR-335 | −1.5428 |
2.25×10⁻²⁰ |
2.42×10⁻¹⁹ |
Negative correlation analysis between
DEmiRNAs and DEmRNAs
The 1,722 DEmRNAs and 43 DEmiRNAs were subjected to
a PCC correlation analysis. PCC <-0.3 and P<0.05 were set as
the threshold values. A total of 3,115 significantly negatively
correlated DEmiRNA-DEmRNA pairs, including 632 DEmRNAs and 30
DEmiRNAs, were identified (data not shown).
Target gene prediction of
DEmiRNAs
To identify the targeted genes of DEmiRNAs, the 30
identified DEmiRNAs were queried in the miRanda database. A total
of 14 of the miRNAs were available in the miRanda database.
DEmiRNA-target genes predicted through miRanda database were
overlapped with DEmiRNA-DEmRNA pairs calculated through PCC
analysis to obtain 500 DEmiRNA-DEmRNA pairs, including 230 DEmRNAs
and 14 DEmiRNAs. hsa-miR-96 and hsa-miR-183 had the highest
connectivity with DEmRNAs, regulating 91 and 59 DEmiRNAs,
respectively (data not shown).
Identification of miRNAs associated
with survival time of STAD
To identify the miRNAs associated with the survival
time of patients with STAD, the expression levels of 355 miRNAs and
the corresponding survival times of 400 STAD patients were compared
with univariate Cox regression analysis. A total of 57 miRNAs
associated with survival time, including 55 risk-associated miRNAs
and 2 protective miRNAs were identified, as included in Table V. The 57 miRNAs were overlapped with
the 14 DEmiRNAs previously mentioned, and this identified 5
DEmiRNAs associated with STAD survival, including 4 risk-associated
DEmiRNAs (miR-30a, −143, −145 and −133b) and 1 protective DEmiRNA
(miR-135b), as described in Table
VI.
| Table V.miRNAs associated with stomach
adenocarcinoma survival. |
Table V.
miRNAs associated with stomach
adenocarcinoma survival.
| A, miRNAs
negatively associated with patient survival time |
|---|
|
|---|
|
|
|
| 95% confidence
interval |
|
|---|
|
|
|
|
|
|
|---|
| miRNA | Coefficient | Hazard ratio | Lower | Upper | P-value |
|---|
| hsa-miR-136 | 0.3317 | 1.3933 | 1.1717 | 1.6567 |
1.74×10⁻⁴ |
| hsa-miR-328 | 0.3140 | 1.3688 | 1.1778 | 1.5909 |
4.26×10⁻⁵ |
| hsa-miR-653 | 0.3128 | 1.3673 | 1.1988 | 1.5595 |
3.12×10⁻⁶ |
| hsa-miR-199a-1 | 0.2918 | 1.3388 | 1.1301 | 1.5861 |
7.41×10⁻⁴ |
| hsa-miR-199a-2 | 0.2911 | 1.3379 | 1.1263 | 1.5892 |
9.20×10⁻⁴ |
| hsa-miR-125a | 0.2880 | 1.3338 | 1.1241 | 1.5826 |
9.65×10⁻⁴ |
| hsa-miR-101–1 | 0.2878 | 1.3335 | 1.1009 | 1.6152 |
3.25×10⁻³ |
| hsa-miR-708 | 0.2869 | 1.3323 | 1.1441 | 1.5514 |
2.22×10⁻⁴ |
| hsa-miR-34b | 0.2837 | 1.3280 | 1.1216 | 1.5724 |
9.99×10⁻⁴ |
| hsa-miR-199b | 0.2830 | 1.3271 | 1.1154 | 1.5789 |
1.42×10⁻³ |
| hsa-miR-152 | 0.2807 | 1.3240 | 1.1111 | 1.5777 |
1.70×10⁻³ |
| hsa-miR-2355 | 0.2770 | 1.3192 | 1.0972 | 1.5861 |
3.21×10⁻³ |
| hsa-miR-181a-2 | 0.2734 | 1.3144 | 1.1177 | 1.5457 |
9.49×10⁻⁴ |
| hsa-miR-28 | 0.2721 | 1.3127 | 1.0948 | 1.5740 |
3.31×10⁻³ |
| hsa-miR-218–2 | 0.2719 | 1.3124 | 1.1535 | 1.4932 |
3.63×10⁻⁵ |
| hsa-miR-100 | 0.2663 | 1.3051 | 1.1539 | 1.4762 |
2.25×10⁻⁵ |
| hsa-miR-1271 | 0.2618 | 1.2993 | 1.0884 | 1.5511 |
3.77×10⁻³ |
| hsa-miR-497 | 0.2608 | 1.2980 | 1.1203 | 1.5039 |
5.16×10⁻⁴ |
| hsa-miR-125b-1 | 0.2604 | 1.2974 | 1.1446 | 1.4707 |
4.65×10⁻⁵ |
| hsa-miR-99b | 0.2550 | 1.2904 | 1.1082 | 1.5026 |
1.03×10⁻³ |
| hsa-miR-34c | 0.2535 | 1.2885 | 1.0955 | 1.5156 |
2.20×10⁻³ |
| hsa-miR-3605 | 0.2500 | 1.2841 | 1.0749 | 1.5340 |
5.85×10⁻³ |
| hsa-miR-331 | 0.2453 | 1.2780 | 1.0639 | 1.5353 |
8.76×10⁻³ |
| hsa-miR-887 | 0.2422 | 1.2741 | 1.0819 | 1.5004 |
3.69×10⁻³ |
| hsa-miR-217 | 0.2409 | 1.2724 | 1.1290 | 1.4340 |
7.88×10⁻⁵ |
| hsa-miR-433 | 0.2356 | 1.2657 | 1.0815 | 1.4813 |
3.32×10⁻³ |
| hsa-miR-758 | 0.2307 | 1.2595 | 1.0937 | 1.4505 |
1.36×10⁻³ |
| hsa-miR-214 | 0.2243 | 1.2514 | 1.0829 | 1.4462 |
2.38×10⁻³ |
| hsa-miR-539 | 0.2219 | 1.2484 | 1.0750 | 1.4498 |
3.64×10⁻³ |
| hsa-miR-130a | 0.2210 | 1.2473 | 1.0699 | 1.4542 |
4.76×10⁻³ |
| hsa-miR-127 | 0.2206 | 1.2468 | 1.0633 | 1.4619 |
6.61×10⁻³ |
| hsa-miR-409 | 0.2194 | 1.2453 | 1.0637 | 1.4580 |
6.38×10⁻³ |
| hsa-miR-216a | 0.2139 | 1.2385 | 1.0854 | 1.4133 |
1.49×10⁻³ |
| hsa-miR-487a | 0.2122 | 1.2364 | 1.0544 | 1.4498 |
9.00×10⁻³ |
| hsa-miR-370 | 0.2110 | 1.2349 | 1.0535 | 1.4475 |
9.24×10⁻³ |
| hsa-miR-99a | 0.2098 | 1.2334 | 1.1090 | 1.3716 |
1.09×10⁻⁴ |
| hsa-let-7c | 0.2072 | 1.2302 | 1.0953 | 1.3818 |
4.74×10⁻⁴ |
| hsa-miR-337 | 0.2026 | 1.2246 | 1.0689 | 1.4029 |
3.49×10⁻³ |
| hsa-miR-145 | 0.1971 | 1.2179 | 1.0979 | 1.3509 |
1.94×10⁻⁴ |
| hsa-miR-134 | 0.1918 | 1.2114 | 1.0536 | 1.3929 |
7.06×10⁻³ |
| hsa-miR-30a | 0.1875 | 1.2062 | 1.0511 | 1.3842 |
7.60×10⁻³ |
| hsa-miR-654 | 0.1867 | 1.2053 | 1.0587 | 1.3721 |
4.77×10⁻³ |
| hsa-miR-125b-2 | 0.1856 | 1.2040 | 1.0740 | 1.3496 |
1.45×10⁻³ |
| hsa-miR-143 | 0.1843 | 1.2023 | 1.0633 | 1.3595 |
3.28×10⁻³ |
| hsa-miR-323b | 0.1701 | 1.1854 | 1.0573 | 1.3291 |
3.57×10⁻³ |
| hsa-miR-296 | 0.1654 | 1.1798 | 1.0531 | 1.3217 |
4.33×10⁻³ |
| hsa-miR-133b | 0.1506 | 1.1625 | 1.0688 | 1.2644 |
4.46×10⁻⁴ |
| hsa-miR-490 | 0.1483 | 1.1599 | 1.0836 | 1.2415 |
1.93×10⁻⁵ |
| hsa-miR-9–2 | 0.1392 | 1.1493 | 1.0433 | 1.2662 |
4.85×10⁻³ |
| hsa-miR-133a-1 | 0.1388 | 1.1489 | 1.0594 | 1.2460 |
7.91×10⁻⁴ |
| hsa-miR-9–1 | 0.1380 | 1.1480 | 1.0419 | 1.2649 |
5.28×10⁻³ |
| hsa-miR-1–2 | 0.1211 | 1.1287 | 1.0429 | 1.2216 |
2.70×10⁻³ |
| hsa-miR-1247 | 0.1147 | 1.1216 | 1.0297 | 1.2216 |
8.51×10⁻³ |
| hsa-miR-675 | 0.1144 | 1.1212 | 1.0390 | 1.2099 |
3.25×10⁻³ |
| hsa-miR-187 | 0.1136 | 1.1203 | 1.0398 | 1.2070 |
2.81×10⁻³ |
|
| B, miRNAs
positively associated with patient survival time |
|
|
|
|
| 95% confidence
interval |
|
|
|
|
|
|
|
| miRNA | Coefficient | Hazard ratio | Lower | Upper | P-value |
|
| hsa-miR-135b | −0.1446 | 0.8653 | 0.7821 | 0.9574 |
5.06×10⁻³ |
| hsa-miR-338 | −0.1892 | 0.8276 | 0.7190 | 0.9527 |
8.42×10⁻³ |
| Table VI.Connectivity of five differentially
expressed miRNAs associated with stomach adenocarcinoma survival
time. |
Table VI.
Connectivity of five differentially
expressed miRNAs associated with stomach adenocarcinoma survival
time.
|
|
|
|
| 95% confidence
interval |
|
|---|
|
|
|
|
|
|
|
|---|
| miRNA | Coefficient | Hazard ratio | Lower | Upper | P-value | Connectivity |
|---|
| hsa-miR-30a | 0.1875 | 1.2062 | 1.0511 | 1.3842 |
7.60×10⁻³ | 47 |
| hsa-miR-143 | 0.1843 | 1.2023 | 1.0633 | 1.3595 |
3.28×10⁻³ | 41 |
| hsa-miR-145 | 0.1971 | 1.2179 | 1.0979 | 1.3509 |
1.94×10⁻⁴ | 36 |
| hsa-miR-133b | 0.1506 | 1.1625 | 1.0688 | 1.2644 |
4.46×10⁻⁴ | 20 |
| hsa-miR-135b | −0.1446 | 0.8653 | 0.7821 | 0.9574 |
5.06×10⁻³ | 7 |
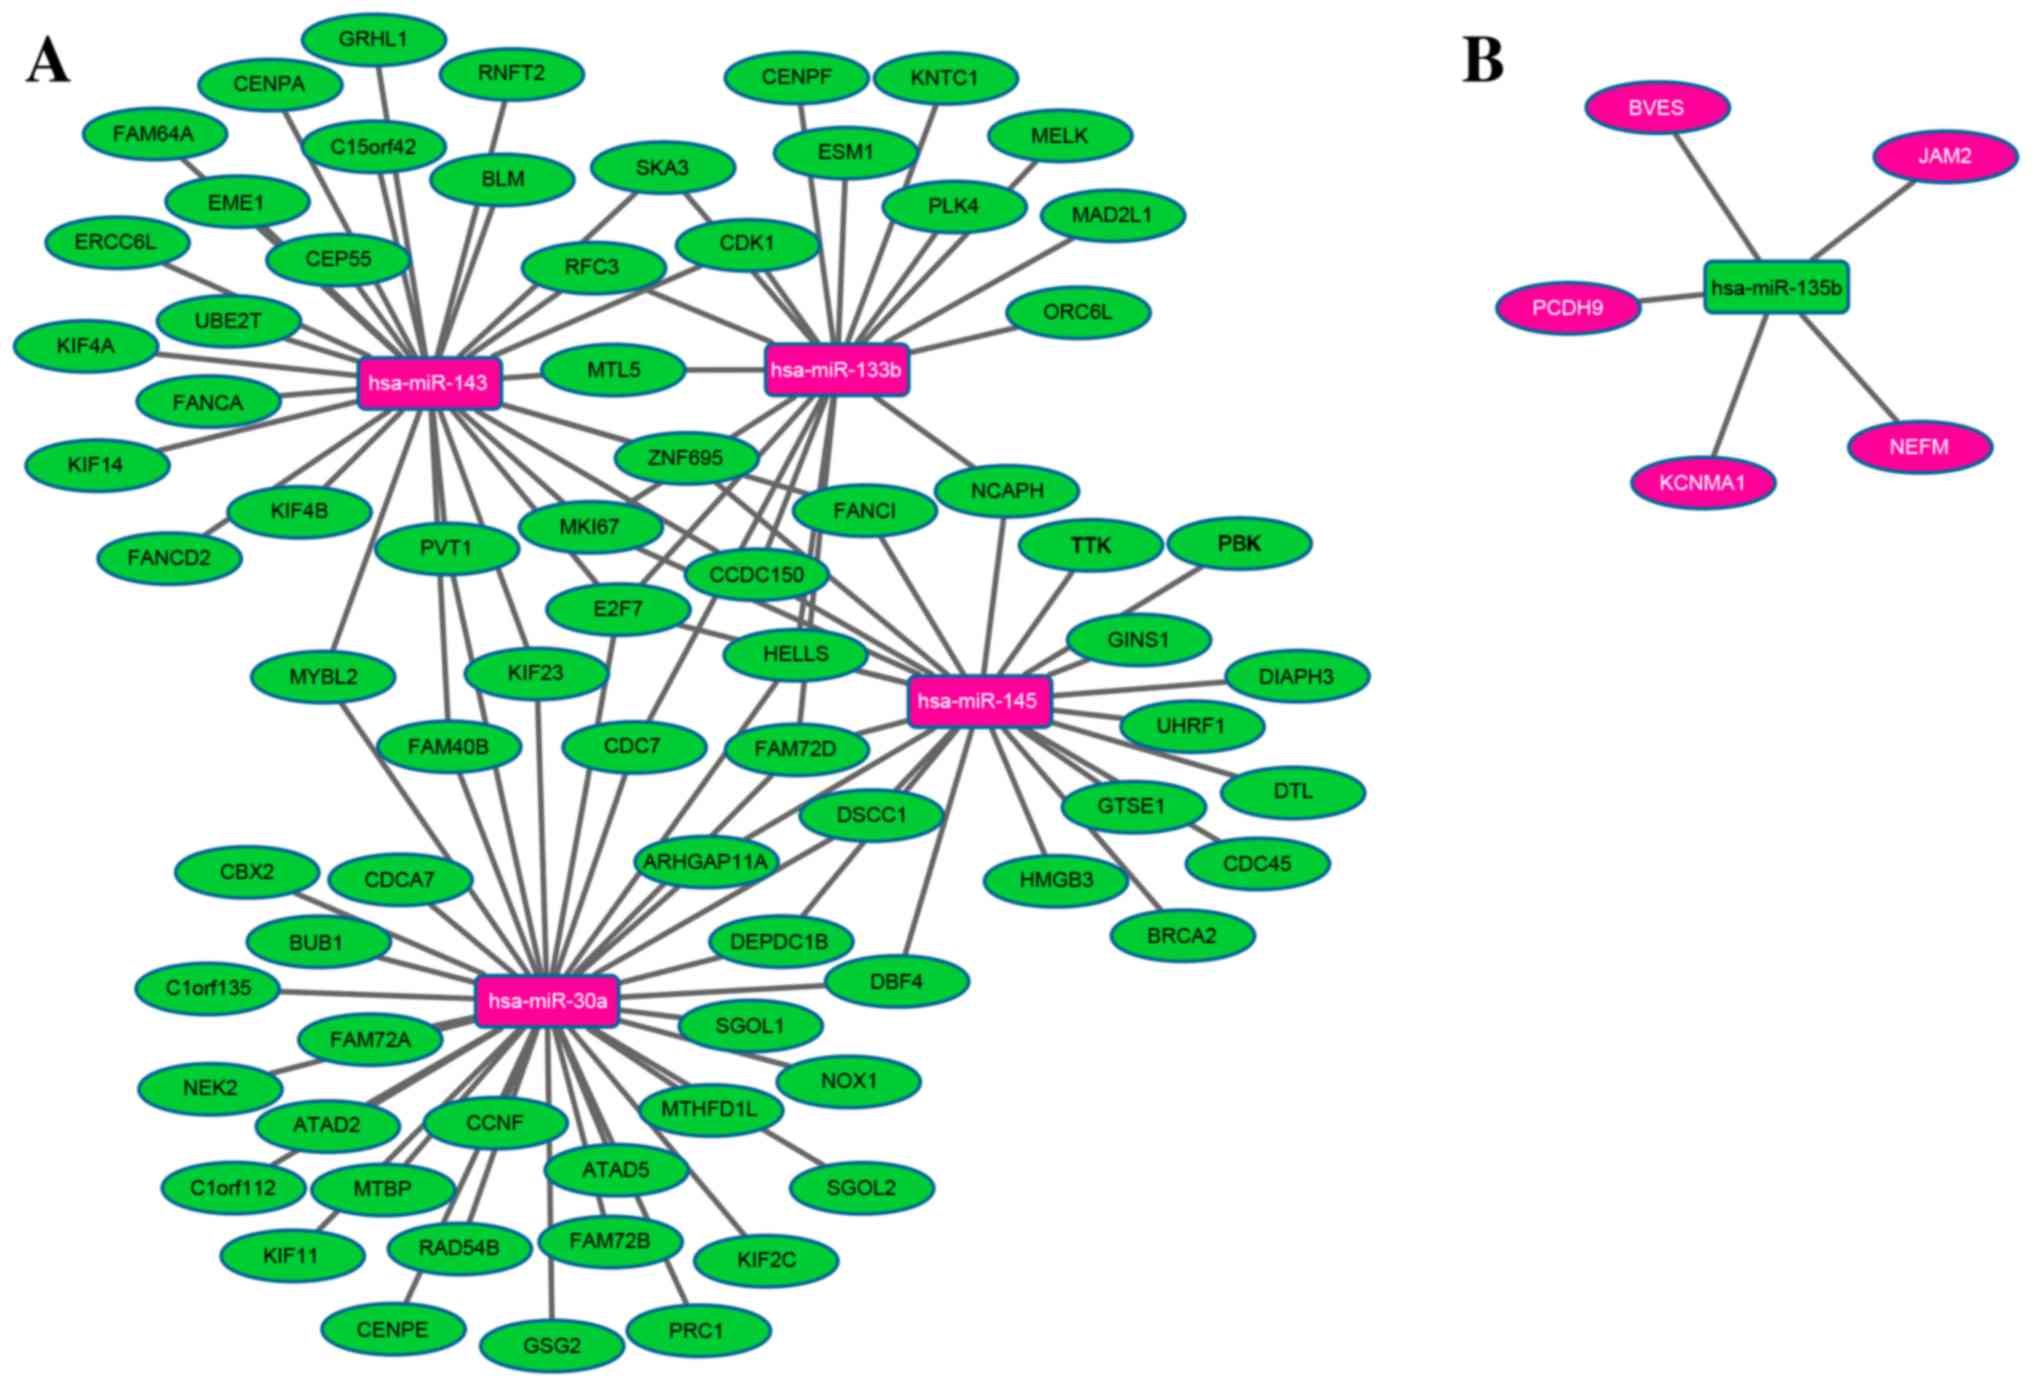
Regulatory network construction
between DEmiRNAs associated with STAD survival and targeted
DEmRNAs
A regulatory network was constructed of the DEmiRNAs
associated with STAD survival and their DEmRNA targets. The network
comprised a total of 85 nodes and 107 edges. miR-30a, −143, −145,
−133b and −135b regulated 34, 28, 22, 18 and 5 DEmRNAs in STAD,
respectively, as illustrated in Fig.
1.
Function and pathways enrichment
To gain insight into the biological function and
pathways of the target DEmRNAs of the 5 DEmiRNAs associated with
STAD survival time, GO and KEGG enrichment analyses were performed.
All 80 downregulated DEmRNAs were significantly enriched in the DNA
metabolic process of the biological process category; no enrichment
in items from the cellular component and molecular function GO
categories was identified (Table
VII). In addition, 79 of the 80 downregulated DEmRNAs (those
with an FDR <0.05) were significantly enriched in 4 KEGG
signaling pathways, including Cell cycle, Homologous recombination,
Progesterone-mediated oocyte maturation and Oocyte meiosis, as
described in Table VII.
| Table VII.Function and pathway enrichment of
targeted differentially expressed mRNAs of 5 differentially
expressed microRNAs associated with stomach adenocarcinoma
survival. |
Table VII.
Function and pathway enrichment of
targeted differentially expressed mRNAs of 5 differentially
expressed microRNAs associated with stomach adenocarcinoma
survival.
| ID | Terms | P-value | False discovery
rate | Associated
genes |
|---|
| Kyoto encyclopedia
of genes and genomes pathway |
|
|
|
|
|
hsa04110 | Cell cycle |
1.53×10⁻⁸ |
6.12×10⁻⁸ | CDC7,
MAD2L1, DBF4, CDC45, TTK, BUB1,
CDK1 |
|
hsa03440 | Homologous
recombination |
3.79×10⁻⁷ |
7.58×10⁻⁷ | RAD54B,
EME1, BRCA2, BLM |
|
hsa04914 |
Progesterone-mediated oocyte
maturation |
1.77×10⁻⁵ |
2.36×10⁻⁵ | MAD2L1,
BUB1, CDK1 |
|
hsa04114 | Oocyte meiosis |
1.26×10⁻⁴ |
1.26×10⁻⁴ | SGOL1,
MAD2L1, BUB1, CDK1 |
| Gene Ontology terms
biological process |
|
|
|
|
|
GO:0006259 | DNA metabolic
process |
1.68×10⁻⁴ |
2.14×10⁻¹ | RFC3,
CDK1, UBE2T, BRCA2, CENPF, BLM,
HMGB3, GINS1, FANCA, UHRF1, DTL,
HELLS, FANCD2, ORC6, DBF4,
MKI67, CDC45, DSCC1, EME1,
TICRR, FANCI, CDC7 |
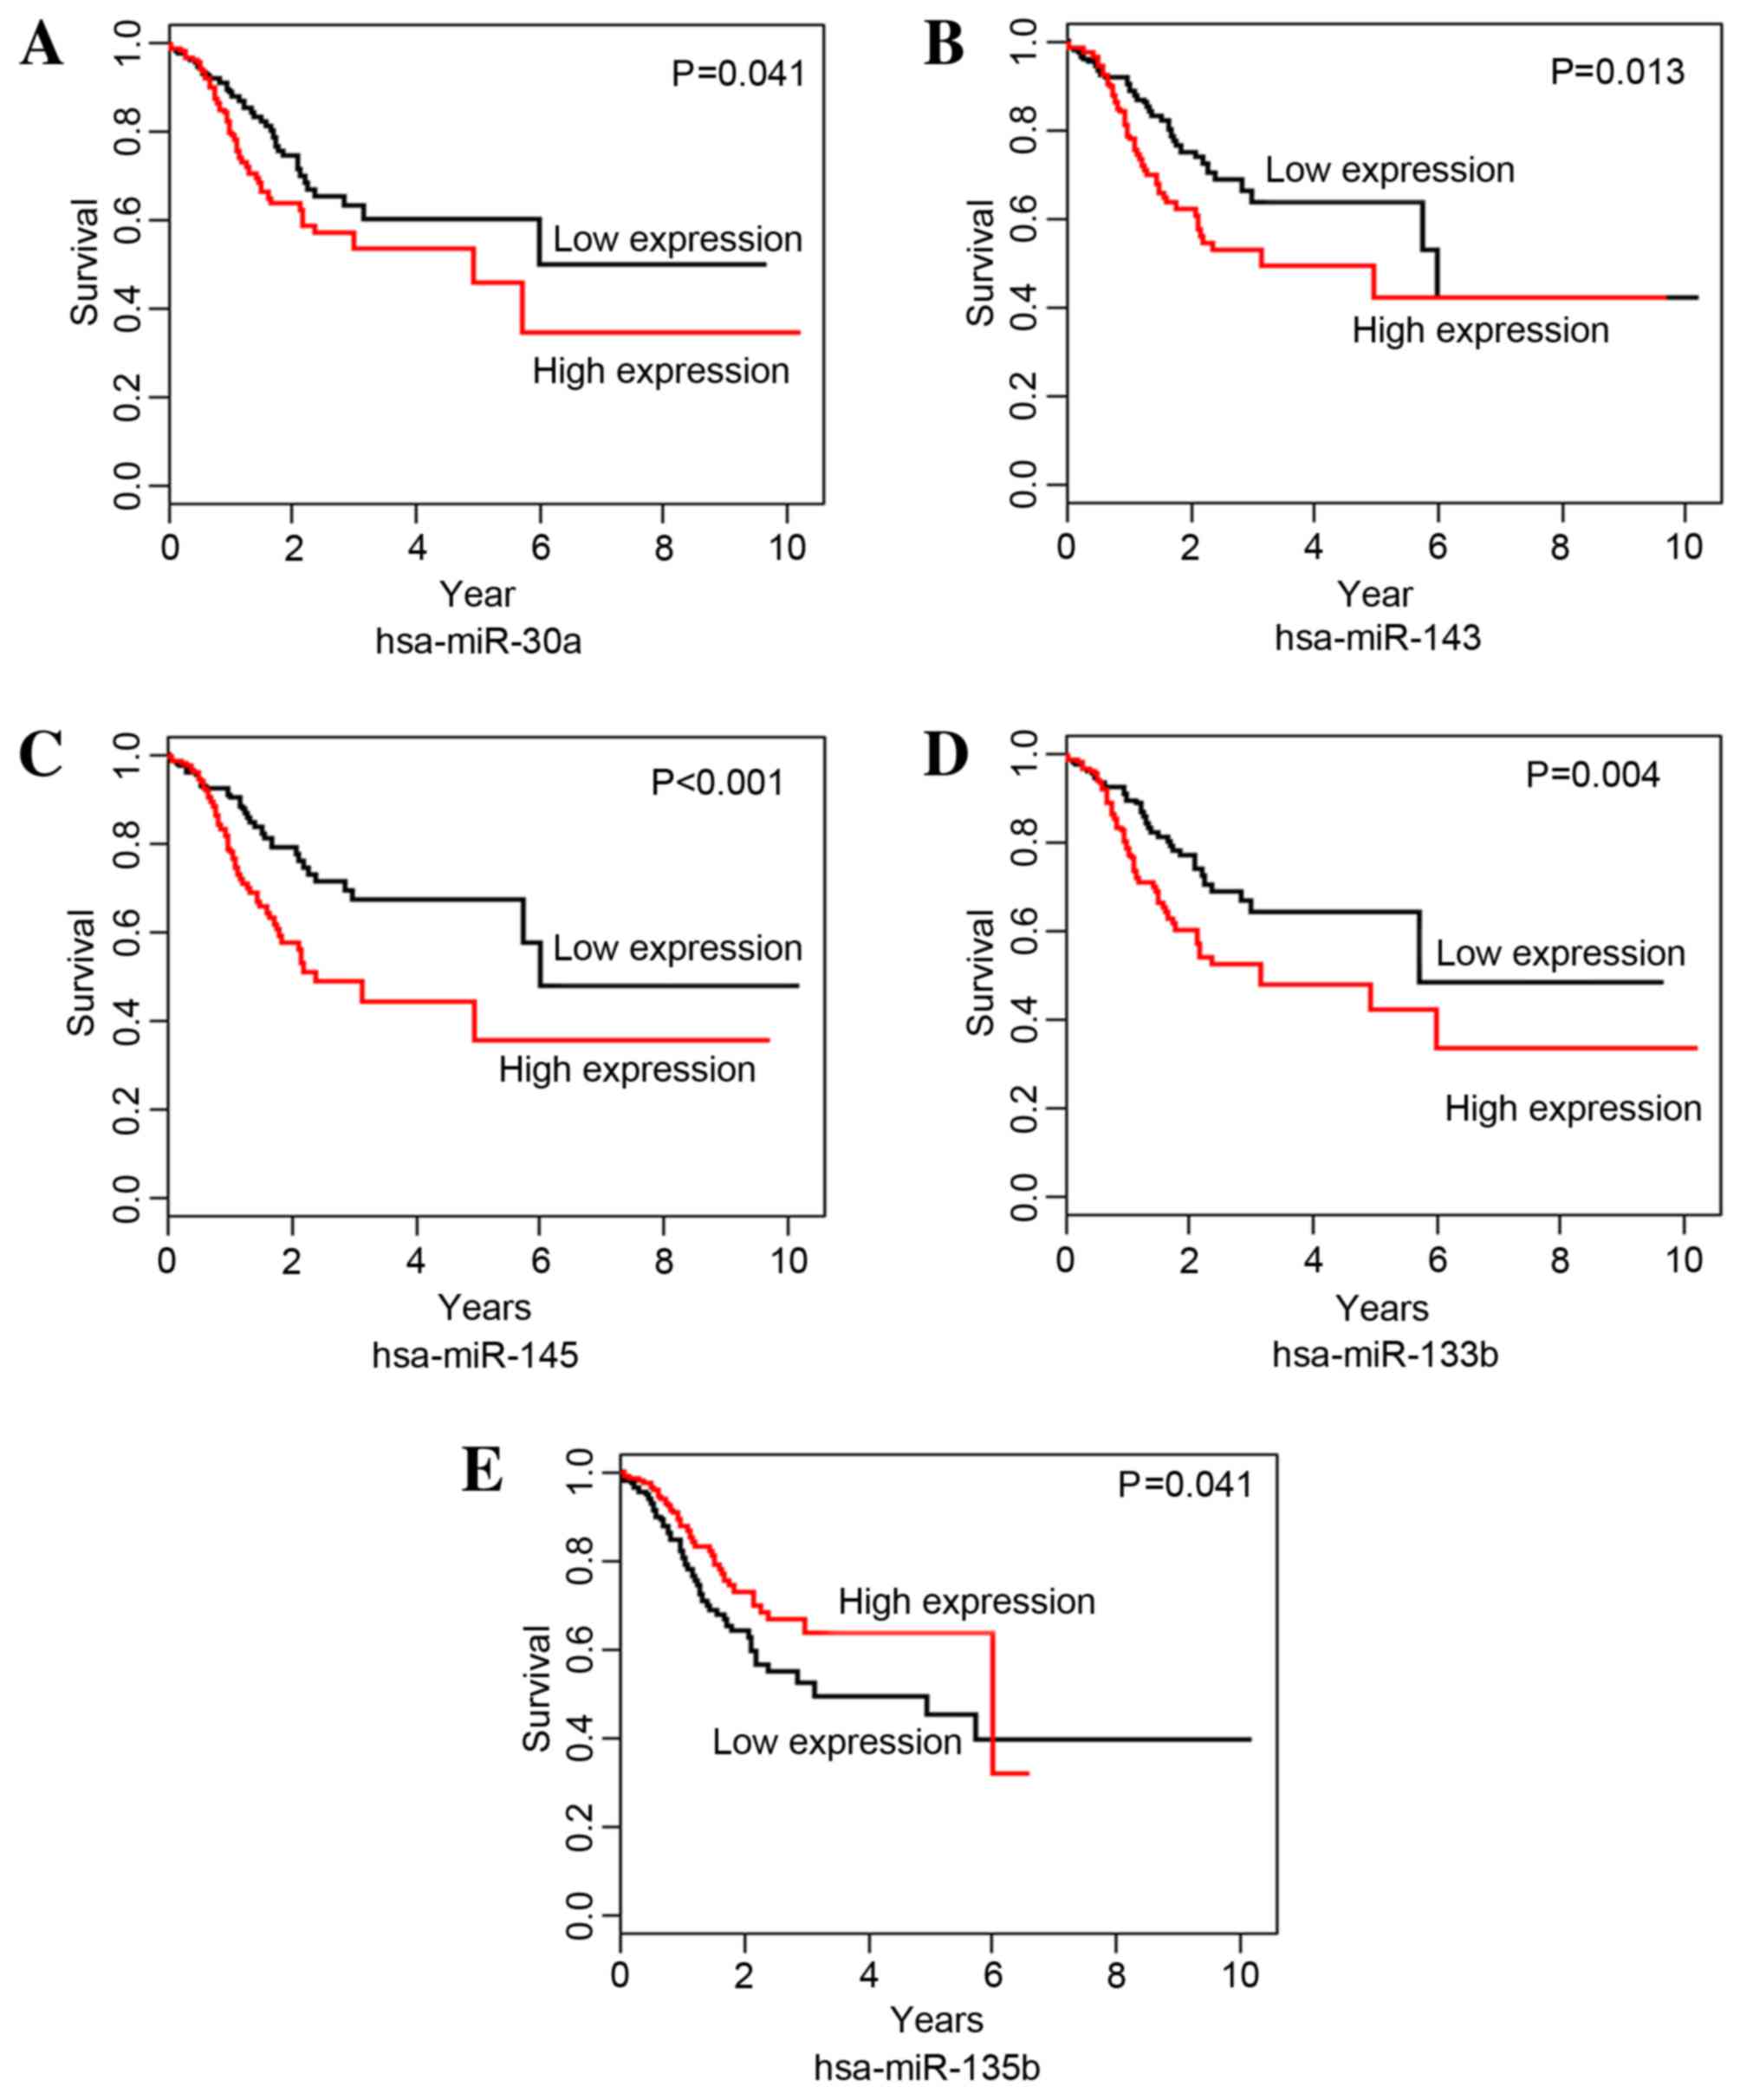
OS analysis in STAD patients by
Kaplan-Meier
The correlations between DEmiRNAs and STAD survival
time were analyzed with Kaplan-Meier curves. miR-30a, −143, −145
and −133b were identified as risk-associated DEmiRNAs; the OS time
of the high expression group was significantly shorter than that of
the low expression group for miR-30a (P=0.041; Fig. 2A), −143 (P=0.013; Fig. 2B), −145 (P=0.001; Fig. 2C) and −133b (P=0.004; Fig. 2D). hsa-miR-135b was identified as a
protective DEmiRNA for STAD survival; the OS time for the high
expression group was significantly higher than that of the low
expression group for hsa-miR-135b (P=0.041; Fig. 2E).
Discussion
In the present study, 5 DEmiRNAs associated with the
survival time of patients with STAD were identified, including 4
risk-associated DEmiRNAs (miR-30a, −143, −145 and −133b) and 1
protective DEmiRNA (miR-135b).
miR-30a was upregulated in STAD tumor tissue and was
identified as a risk-associated DEmiRNA with regard to survival
time. miR-30a targeted 34 DEmRNAs. It was previously reported that
miR-30a is overexpressed in a number of types of tumor, including
glioma, papillary thyroid carcinoma (PTC), pancreatic cancer,
nasopharyngeal carcinoma and variant serous adenocarcinoma (VSAD)
(22–27). miR-30a-5p expression is induced by the
Wnt/β-catenin pathway and promotes glioma cell invasion by
inhibiting the expression of neural cell adhesion molecules
(22). miR-30a-5p was significantly
increased in serum samples and fine-needle aspiration biopsy
samples from a group of patients with malignant PTC compared with
patients with benign nodular goiters (23). miR-30a-5p was also demonstrated to be
upregulated in the urine of patients with VSAD, and in VSAD tumor
tissues and cell lines; following the surgical removal of VSAD,
urinary miR-30a was distinctly reduced (24). miR-30a upregulation in stomach
signet-ring cell carcinoma compared with stomach tubular
adenocarcinoma has also been observed (25). Furthermore, the high expression of the
miR-30 family, including miR-30a, −30b or −30c, promotes
CD133+ pancreatic cancer cell migratory and invasive
abilities, and is associated with resistance to gemcitabine
(26). Overexpression of miR-30a also
promotes the metastatic and invasive abilities of nasopharyngeal
carcinoma tumor cells in vivo and in vitro (27). When taken together, the results of
these previous studies and the present study may indicate that
miR-30a serves a key role in the tumorigenesis and development of
STAD. However, the molecular mechanism of miR-30a in STAD requires
further investigation.
In the present study, miR-143 was identified as an
upregulated DEmiRNA in STAD. This was consistent with previous
reports that miR-143 is upregulated in STAD compared with non-tumor
tissue (28). However, other studies
have indicated that miR-143 is downregulated in gastric cancer
tumor tissues and cell lines, and the dysregulation of miR-143 has
been associated with cisplatin resistance, cell growth and lymph
node metastasis (29–31). Our future study will aim to validate
the expression of miR-143 in patients with STAD with a large sample
size of STAD tumor and adjacent non-tumor specimens.
In the present study, miR-135b was downregulated in
STAD and identified as a protective DEmiRNA associated with the
survival time of patients with STAD. miR-135b in gastric
adenocarcinoma samples was previously demonstrated to be
downregulated compared with non-atrophic chronic gastritis and
intestinal metaplasia samples (32).
In addition, miR-135b was observed to be commonly downregulated in
glioblastoma stem-like cells (GSCs), and the restoration of
miR-135b expression significantly inhibited the proliferation,
migration and clonogenic abilities of GSCs (33). It has also been demonstrated that
miR-135b overexpression enhances the radio-resistance of U87 cells,
a radio-resistant human glioblastoma cell line, by targeting
glycogen synthase kinase 3β, whereas miR-135b knockdown reverses
the radio-resistance of U87R cells (34). miR-135b is also downregulated in
osteosarcoma tissues and cell lines, and the inhibition of miR-135b
expression promotes cell proliferation, migration and invasion via
the increased expression of c-Myc (35). To the best of our knowledge, the
biological function of miR-135b in STAD has not been identified.
The mechanism by which miR-135b serves a protective function in the
pathogenesis of STAD requires further exploration.
It has been reported that miR-145 and −133b are
downregulated in gastric cancer compared with adjacent non-tumor
tissue (36,37). However, the opposite result was
observed in the present study, as miR-145 and −133b were
upregulated in STAD tissue. The abnormal expression of miR-145 and
−133b has been associated with cell cycle dysregulation and tumor
migration, invasion and metastasis in STAD (38–40). The
expression levels of miR-145 and −133b in STAD compared with paired
non-tumor controls requires verification with a large sample size
in future studies.
In conclusion, 5 potential miRNAs associated with
the survival time of patients with STAD were identified through the
analysis of microarray expression data from TCGA database. The
study had certain limitations. Firstly, the expression levels of
miR-30a, −143, −145, −133b and −135b must be further verified in
STAD tissue with reverse transcription-quantitative polymerase
chain reaction. Secondly, DEmiRNAs associated with STAD survival
were identified, but no prognosis model for STAD survival time was
established. In our further study, the expression of the 5
identified DEmiRNAs in STAD tissues will be verified with a larger
sample size, a prognosis model will be constructed to predict the
survival time of patients with STAD based on the
survival-associated DEmiRNAs identified in the present study, and
the model will be further verified through clinical
observation.
References
|
1
|
Siegel R, Naishadham D and Jemal A: Cancer
statistics, 2012. CA Cancer J Clin. 62:10–29. 2012. View Article : Google Scholar : PubMed/NCBI
|
|
2
|
Chen W, Zheng R, Baade PD, Zhang S, Zeng
H, Bray F, Jemal A, Yu XQ and He J: Cancer statistics in China,
2015. CA Cancer J Clin. 66:115–132. 2016. View Article : Google Scholar : PubMed/NCBI
|
|
3
|
Cancer Genome Atlas Research Network:
Comprehensive molecular characterization of gastric adenocarcinoma.
Nature. 513:202–209. 2014. View Article : Google Scholar : PubMed/NCBI
|
|
4
|
Ren G, Cai R, Zhang WJ, Ou JM, Jin YN and
Li WH: Prediction of risk factors for lymph node metastasis in
early gastric cancer. World J Gastroenterol. 19:3096–3107. 2013.
View Article : Google Scholar : PubMed/NCBI
|
|
5
|
Lagergren J, Andersson G, Talbäck M,
Drefahl S, Bihagen E, Härkönen J, Feychting M and Ljung R: Marital
status, education, and income in relation to the risk of esophageal
and gastric cancer by histological type and site. Cancer.
122:207–212. 2016. View Article : Google Scholar : PubMed/NCBI
|
|
6
|
Brosens LA, Wood LD, Offerhaus GJ, Arnold
CA, Lam-Himlin D, Giardiello FM and Montgomery EA: Pathology and
genetics of syndromic gastric polyps. Int J Surg Pathol.
24:185–199. 2016. View Article : Google Scholar : PubMed/NCBI
|
|
7
|
Plummer M, Franceschi S, Vignat J, Forman
D and de Martel C: Global burden of gastric cancer attributable to
Helicobacter pylori. Int J Cancer. 136:487–490. 2015.
View Article : Google Scholar : PubMed/NCBI
|
|
8
|
Krishnaveni D, Bhayal AC, Shravan KP,
Jyothy A, Pratibha N and Venkateshwari A: Heterozygosity of
stromelysin-1 (rs3025058) promoter polymorphism is associated with
gastric cancer. Indian J Cancer. 52:251–254. 2015. View Article : Google Scholar : PubMed/NCBI
|
|
9
|
Thutkawkorapin J, Picelli S, Kontham V,
Liu T, Nilsson D and Lindblom A: Exome sequencing in one family
with gastric- and rectal cancer. BMC Genet. 17:412016. View Article : Google Scholar : PubMed/NCBI
|
|
10
|
Ushiku T, Ishikawa S, Kakiuchi M, Tanaka
A, Katoh H, Aburatani H, Lauwers GY and Fukayama M: RHOA mutation
in diffuse-type gastric cancer: A comparative clinicopathology
analysis of 87 cases. Gastric Cancer. 19:403–411. 2016. View Article : Google Scholar : PubMed/NCBI
|
|
11
|
Tan X, Wang H, Luo G, Ren S, Li W, Cui J,
Gill HS, Fu SW and Lu Y: Clinical significance of a point mutation
in DNA polymerase beta (POLB) gene in gastric cancer. Int J Biol
Sci. 11:144–155. 2015. View Article : Google Scholar : PubMed/NCBI
|
|
12
|
Chen H, Ren C, Han C, Wang D, Chen Y and
Fu D: Expression and prognostic value of miR-486-5p in patients
with gastric adenocarcinoma. PLoS One. 10:e01193842015. View Article : Google Scholar : PubMed/NCBI
|
|
13
|
Kang W, Tong JH, Lung RW, Dong Y, Zhao J,
Liang Q, Zhang L, Pan Y, Yang W, Pang JC, et al: Targeting of YAP1
by microRNA-15a and microRNA-16-1 exerts tumor suppressor function
in gastric adenocarcinoma. Mol Cancer. 14:522015. View Article : Google Scholar : PubMed/NCBI
|
|
14
|
Minn YK, Lee DH, Hyung WJ, Kim JE, Choi J,
Yang SH, Song H, Lim BJ and Kim SH: MicroRNA-200 family members and
ZEB2 are associated with brain metastasis in gastric
adenocarcinoma. Int J Oncol. 45:2403–2410. 2014.PubMed/NCBI
|
|
15
|
Wang S, Lv C, Jin H, Xu M, Kang M, Chu H,
Tong N, Wu D, Zhu H, Gong W, et al: A common genetic variation in
the promoter of miR-107 is associated with gastric adenocarcinoma
susceptibility and survival. Mutat Res. 769:35–41. 2014. View Article : Google Scholar : PubMed/NCBI
|
|
16
|
Tomczak K, Czerwińska P and Wiznerowicz M:
The cancer genome atlas (TCGA): An immeasurable source of
knowledge. Contemp Oncol (Pozn). 19:A68–A77. 2015.PubMed/NCBI
|
|
17
|
Love MI, Huber W and Anders S: Moderated
estimation of fold change and dispersion for RNA-seq data with
DESeq2. Genome Biol. 15:5502014. View Article : Google Scholar : PubMed/NCBI
|
|
18
|
Benesty J, Chen J, Huang Y and Cohen I:
Pearson correlation coefficientNoise Reduction in Speech
Processing. 2. 1st. Springer; Heidelberg: pp. 1–4. 2009, View Article : Google Scholar
|
|
19
|
Shannon P, Markiel A, Ozier O, Baliga NS,
Wang JT, Ramage D, Amin N, Schwikowski B and Ideker T: Cytoscape: A
software environment for integrated models of biomolecular
interaction networks. Genome Res. 13:2498–2504. 2003. View Article : Google Scholar : PubMed/NCBI
|
|
20
|
Hashimoto K, Goto S, Kawano S,
Aoki-Kinoshita KF, Ueda N, Hamajima M, Kawasaki T and Kanehisa M:
KEGG as a glycome informatics resource. Glycobiology. 16:63R–70R.
2006. View Article : Google Scholar : PubMed/NCBI
|
|
21
|
Eden E, Navon R, Steinfeld I, Lipson D and
Yakhini Z: GOrilla: A tool for discovery and visualization of
enriched GO terms in ranked gene lists. BMC Bioinformatics.
10:482009. View Article : Google Scholar : PubMed/NCBI
|
|
22
|
Wang Z, Dai X, Chen Y, Sun C, Zhu Q, Zhao
H, Liu G, Huang Q and Lan Q: MiR-30a-5p is induced by Wnt/β-catenin
pathway and promotes glioma cell invasion by repressing NCAM.
Biochem Biophys Res Commun. 465:374–380. 2015. View Article : Google Scholar : PubMed/NCBI
|
|
23
|
Igci YZ, Ozkaya M, Korkmaz H, Bozgeyik E,
Bayraktar R, Ulasli M, Erkilic S, Eraydin A and Oztuzcu S:
Expression levels of miR-30a-5p in papillary thyroid carcinoma: A
comparison between serum and fine needle aspiration biopsy samples.
Genet Test Mol Biomarkers. 19:418–423. 2015. View Article : Google Scholar : PubMed/NCBI
|
|
24
|
Zhou J, Gong G, Tan H, Dai F, Zhu X, Chen
Y, Wang J, Liu Y, Chen P, Wu X and Wen J: Urinary microRNA-30a-5p
is a potential biomarker for ovarian serous adenocarcinoma. Oncol
Rep. 33:2915–2923. 2015. View Article : Google Scholar : PubMed/NCBI
|
|
25
|
Li FQ, Xu B, Wu YJ, Yang ZL and Qian JJ:
Differential microRNA expression in signet-ring cell carcinoma
compared with tubular adenocarcinoma of human gastric cancer. Genet
Mol Res. 14:739–747. 2015. View Article : Google Scholar : PubMed/NCBI
|
|
26
|
Tsukasa K, Ding Q, Miyazaki Y, Matsubara
S, Natsugoe S and Takao S: miR-30 family promotes migratory and
invasive abilities in CD133(+) pancreatic cancer stem-like cells.
Human Cell. 29:130–137. 2016. View Article : Google Scholar : PubMed/NCBI
|
|
27
|
Wang HY, Li YY, Fu S, Wang XP, Huang MY,
Zhang X, Shao Q, Deng L, Zeng MS, Zeng YX and Shao JY: MicroRNA-30a
promotes invasiveness and metastasis in vitro and in vivo through
epithelial-mesenchymal transition and results in poor survival of
nasopharyngeal carcinoma patients. Exp Biol Med (Maywood).
239:891–898. 2014. View Article : Google Scholar : PubMed/NCBI
|
|
28
|
Stánitz E, Juhász K, Tóth C, Gombos K,
Natali PG and Ember I: Evaluation of MicroRNA expression pattern of
gastric adenocarcinoma associated with socioeconomic, environmental
and lifestyle factors in northwestern Hungary. Anticancer Res.
33:3195–3200. 2013.PubMed/NCBI
|
|
29
|
Zhuang M, Shi Q, Zhang X, Ding Y, Shan L,
Shan X, Qian J, Zhou X, Huang Z, Zhu W, et al: Involvement of
miR-143 in cisplatin resistance of gastric cancer cells via
targeting IGF1R and BCL2. Tumour Biol. 36:2737–2745. 2015.
View Article : Google Scholar : PubMed/NCBI
|
|
30
|
Wu XL, Cheng B, Li PY, Huang HJ, Zhao Q,
Dan ZL, Tian DA and Zhang P: MicroRNA-143 suppresses gastric cancer
cell growth and induces apoptosis by targeting COX-2. World J
Gastroenterol. 19:7758–7765. 2013. View Article : Google Scholar : PubMed/NCBI
|
|
31
|
Wu WY, Xue XY, Chen ZJ, Han SL, Huang YP,
Zhang LF, Zhu GB and Shen X: Potentially predictive microRNAs of
gastric cancer with metastasis to lymph node. World J
Gastroenterol. 17:3645–3651. 2011. View Article : Google Scholar : PubMed/NCBI
|
|
32
|
Vidal AF, Cruz AMP, Magalhães L, Pereira
AL, Anaissi AK, Alves NC, Albuquerque PJ, Burbano RM, Demachki S
and Ribeiro-dos-Santos Â: Hsa-miR-29c and hsa-miR-135b differential
expression as potential biomarker of gastric carcinogenesis. World
J Gastroenterol. 22:2060–2070. 2016. View Article : Google Scholar : PubMed/NCBI
|
|
33
|
Lulli V, Buccarelli M, Martini M, Signore
M, Biffoni M, Giannetti S, Morgante L, Marziali G, Ilari R,
Pagliuca A, et al: miR-135b suppresses tumorigenesis in
glioblastoma stem-like cells impairing proliferation, migration and
self-renewal. Oncotarget. 6:37241–37256. 2015. View Article : Google Scholar : PubMed/NCBI
|
|
34
|
Xiao S, Yang Z, Lv R, Zhao J, Wu M, Liao Y
and Liu Q: miR-135b contributes to the radioresistance by targeting
GSK3β in human glioblastoma multiforme cells. PLoS One.
9:e1088102014. View Article : Google Scholar : PubMed/NCBI
|
|
35
|
Liu Z, Zhang G, Li J, Liu J and Lv P: The
tumor-suppressive microRNA-135b targets c-myc in osteoscarcoma.
PLoS One. 9:e1026212014. View Article : Google Scholar : PubMed/NCBI
|
|
36
|
Khalili M, Vasei M, Khalili D,
Alimoghaddam K, Sadeghizadeh M and Mowla SJ: Downregulation of the
genes involved in reprogramming (SOX2, c-MYC, miR-302, miR-145 and
P21) in gastric adenocarcinoma. J Gastrointest Cancer. 46:251–258.
2015. View Article : Google Scholar : PubMed/NCBI
|
|
37
|
Guo L, Bai H, Zou D, Hong T, Liu J, Huang
J, He P, Zhou Q and He J: The role of microRNA-133b and its target
gene FSCN1 in gastric cancer. J Exp Clin Cancer Res. 33:992014.
View Article : Google Scholar : PubMed/NCBI
|
|
38
|
Qiu T, Zhou X, Wang J, Du Y, Xu J, Huang
Z, Zhu W, Shu Y and Liu P: MiR-145, miR-133a and miR-133b inhibit
proliferation, migration, invasion and cell cycle progression via
targeting transcription factor Sp1 in gastric cancer. FEBS Lett.
588:1168–1177. 2014. View Article : Google Scholar : PubMed/NCBI
|
|
39
|
Chen JJ, Cai WY, Liu XW, Luo QC, Chen G,
Huang WF, Li N and Cai JC: Reverse correlation between MicroRNA-145
and FSCN1 affecting gastric cancer migration and invasion. PLoS
One. 10:e01268902015. View Article : Google Scholar : PubMed/NCBI
|
|
40
|
Liu Y, Zhang X, Zhang Y, Hu Z, Yang D,
Wang C, Guo M and Cai Q: Identification of miRNomes in human
stomach and gastric carcinoma reveals miR-133b/a-3p as therapeutic
target for gastric cancer. Cancer Lett. 369:58–66. 2015. View Article : Google Scholar : PubMed/NCBI
|