Introduction
Colorectal cancer (CRC) is a common gastrointestinal
cancer and its global incidence is outranked only by gastric and
esophageal cancers (1). There were
~14.1 million new cases of cancer globally in 2012, of which CRC
accounted for 1.4 million and in China, was surpassed only by lung
and breast cancers (2). In China, the
incidence of CRC and its mortality rate have been ranked third and
fourth, respectively among malignant tumors (3). Studies have demonstrated that China's
annual incidence of CRC increases twice as fast compared with the
global average (3,4). In Shanghai, Beijing and Guangzhou, the
incidence of colorectal cancer is 40/100,000 individuals (5); and a previous CRC survey program in
Wuhan, Hubei province has reported a high incidence of 90/100,000
individuals, which is twice that of the national average (6). According to the National Bowel Cancer
Screening Programme, whose aim was to reduce the incidence of
symptomatic CRC, the majority of patients present with symptoms to
their general practitioner (7–9). An
isolated symptom may be associated with CRC, but typically symptoms
were observed in clusters. In total ≥1 high-risk symptoms are seen
in ~85% of patients with CRC, who were referred to secondary care
(10). However, symptoms for disease
may be biased to a certain extent by ‘selection phenomena’, and
this is the case to CRC (11). When
performing diagnostic research in secondary care, this bias is not
always considered (12).
Additionally, the primary symptoms in the primary care setting may
differ amongst the community and the hospital practice (11). Despite this being investigated by
previous studies (12,13), no significant molecular markers with a
certain levels of efficacy or specificity for the early diagnosis
of CRC have been identified. Therefore, further studies focusing on
the molecular mechanisms of CRC development are imperative to
identify molecular markers for the early detection of CRC and to
develop individualized therapy, which would in turn improve the
survival rate of patients with CRC. Based on high-throughput
microarray technology, the present study aimed to identify
potential key molecules as biomarkers in colorectal cancer
development.
Patients and methods
Study subjects and tissue samples
In total, 6 patients with colorectal cancer, who
were admitted to the Abdominal Oncology Department of Zhongnan
Hospital of Wuhan University (Wuhan, China) between June 2012 and
November 2012, were enrolled in this study. Colorectal cancer
tissues and adjacent normal tissues were isolated intraoperatively,
then immediately placed into prepared cryogenic vials, and frozen
in liquid nitrogen within 5 min to avoid RNA degradation. The
selection criteria of the case were: Diagnosis of colorectal cancer
by postoperative pathological examination; and no preoperative
radiotherapy, chemotherapy or other antitumor therapy. The present
study was approved by Zhongnan Hospital of Wuhan University
(approval no. 2010017), and written informed consent was obtained
from all participants. The study was conducted in compliance with
the Declaration of Helsinki.
Microarray chips
Affymetrix Human U133 Plus 2.0 chips (Shanghai
Biotechnology Corporation, Shanghai, China) were used, which
consisted of 47,000 transcripts, representing 38,500 known human
genes.
Tissue RNA extraction, purification
and quality control
Total RNA was isolated from the colorectal cancer
and normal adjacent tissues using TRIzol (cat. no. 15596-026;
Thermo Fisher Scientific, Inc., Waltham, MA, USA) by a 1-step
extraction procedure, and the quality of the RNA was then examined
using the Agilent Bioanalyzer 2100 (Agilent Technologies, Inc.,
Santa Clara, CA, USA) to perform electrophoresis. The acceptable
quality threshold was set as an RNA integrity number (RIN) of ≥7.0
and a 28S/18S ribosomal RNA (rRNA) ratio of >0.7. To avoid a
reduction in RNA purity, which may affect hybridization to the
probe, total RNA was purified using the RNeasy Micro kit (cat. no.
74004; Qiagen GmbH, Hilden, Germany) and RNase-Free DNase set (cat.
no. 79254; Qiagen GmbH), according to the manufacturer's protocol
(the RNeasy Mini Protocol for RNA Cleanup; Qiagen GmbH).
Microarray assay
The purified total RNA sample was amplified and
labeled using an Affymetrix microarray accessory
GeneChip® 3′IVT Express kit (Affymetrix, Inc., Santa
Clara, CA, USA) to obtain biotin-labeled complementary RNA. The
labeling efficiency and quality monitoring were performed by
determination of fluorescent labeling efficiency to ensure the
reliability of the subsequent microarray assay results. With the
supporting standard process for hybridization and
GeneChip® Hybridization, Wash and Stain kits
(Affymetrix, Inc.) were provided along with the aforementioned
Affymetrix microarray chips. Hybridization was conducted in a
GeneChip® Hybridization Oven 645 (Affymetrix, Inc.) at
45°C for 16 h. Subsequent to hybridization, the Fluidics Station
450 (Affymetrix, Inc.) was used to wash the chips in accordance
with the manufacturer's protocol. Microarray results were scanned
using the GeneChip® Scanner 3000 (Affymetrix, Inc.). Raw
data were read using Command Console Software 3.1 (Affymetrix,
Inc.) and qualified data were normalized using Gene Spring Software
11.0 (Agilent Technologies, Inc.). The algorithm used was MAS 5.0
(14). By analyzing and comparing the
data in adjacent tissues and paired normal tissues, candidate
marker genes associated with the occurrence of colorectal cancer
were identified.
Reverse transcription-quantitative
polymerase chain reaction (RT-qPCR) to validate the microarray
results
The top 4 upregulated genes, including keratin 23
(KRT23), collagen type X α1 (COL10A1), collagen type XI α1
(COL11A1) and cell migration-inducing hyaluronan-binding protein
(KIAA1199), and the top 2 downregulated genes, including sodium
voltage-gated channel α subunit 7 (SCN7A) and EPH receptor A7
(EPHA7), were selected for RT-qPCR validation. Transforming growth
factor β1 (TGFB1) and V-Myc avian myelocytomatosis viral oncogene
homolog (MYC), which are established upregulated genes that
demonstrate a clear association with cancer development (15), were used as positive controls. The
basic information of the genes selected for qPCR validation is
summarized in Table I. To synthesize
first strand cDNA, the RNA was removed from storage in an −80°C
freezer and thawed at 4°C. A reaction system (20 µl) was then
prepared using 4-µl 5X reaction buffer, 1-µl RiboLock™ RNase
Inhibitor (Thermo Fisher Scientific, Inc.), 1-µl RevertAid™ M-Mu1 V
Reverse Transcriptase (200 U/µl; Thermo Fisher Scientific, Inc.),
2-µl 10 mM dNTP mix, 1-µl Oligo deoxy-thymidine 18, and 2-µg RNA
template; this was made up to 20 µl with water. The PCR tubes were
incubated at 42°C for 60 min, denatured at 70°C for 5 min and
stored at −20°C. Based on gene sequences in the Genebank database
(https://www.ncbi.nlm.nih.gov/genbank/), primers were
designed using Primer Premier 5.0 software (Premier Biosoft
International, Palo Alto, CA, USA). Primers were synthesized by
Shanghai Shenggong Biology Engineering Technology Service, Ltd.
(Shanghai, China), and β-actin was used as an internal reference
gene. Primer information is available in Table II. In total, 5-µl 2X SYBR-Green PCR
buffer (Applied Biosystems; Thermo Fisher Scientific, Inc.), 0.2-µl
forward primer (10 µmol), 0.2-µl reverse primer (10 µmol) and 5-ng
template were used for qPCR, and these were then made up to 10 µl
with water. The PCR cycling conditions were as follows: Incubation
at 50°C for 2 min, then 95°C for 10 min, followed by 40 cycles at
95°C for 15 sec and finally at 60°C for 1 min. The ABI 7900 HT
Sequence Detection System was used for qPCR and SDS 2.3 software
(Applied Biosystems; Thermo Fisher Scientific, Inc.) was used to
analyze the data. The relative amount of the target gene in each
sample was calculated using the 2−ΔΔCq method (16). The final results were generated from
the data of two independent experiments.
 | Table I.Genes selected for reverse
transcription quantitative-polymerase chain reaction
validation. |
Table I.
Genes selected for reverse
transcription quantitative-polymerase chain reaction
validation.
| Gene | Fold change | P-value |
|---|
| Upregulated
genes |
|
|
|
KRT23 | 111.37 | 8.57e-06 |
|
COL10A1 | 49.52 | 8.37e-05 |
|
COL11A1 | 48.54 | 48.54 |
|
KIAA1199 | 39.46 | 4.55e-06 |
|
TGFBI | 4.41 | 7.15e-05 |
|
MYC | 3.19 | 0.008739 |
| Downregulated
genes |
|
|
|
SCN7A | −35.71 | 0.001 |
|
EPHA7 | −30.30 | 0.008 |
| Table II.Primer information. |
Table II.
Primer information.
| Gene | Primer sequences
5′-3′ |
|---|
| KRT23 | F:
AGTGAAGGGACACGGGAAGA |
|
| R:
CCTGGGTTATGGCCTTGATCT |
| COL10A1 | F:
TCTCTAACTCTACCCCACCCTACAA |
|
| R:
TACGTTTTTACGTTGCTGCTCACT |
| COL11A1 | F:
ACGCTGCATATACAGGTACCATTTAG |
|
| R:
TCAGCCCTGTTTCCATCTTAGC |
| KIAA1199 | F:
TCTAATGCAAGGGTCTCACACTGT |
|
| R:
TGAACTGAGCCAAAGACATTCAA |
| TGFBI | F:
GAGGAGGGAGAGAGATGTACTTTTTAAA |
|
| R:
GGCAGTGACATCCAAGTTTCTG |
| MYC | F:
CAAGAGGCGAACACACAACGT |
|
| R:
AGGGCAAAAAAGCTCCGTTT |
| SCN7A | F:
CATGTTATGGAGACCAGTGAGGAA |
|
| R:
CCAAGAAATAGAAAACGGAGCTTAGA |
| EPHA7 | F:
CCTTGCTTTAATAGAGCCACCTTT |
|
| R:
GGACCAGATCAATTGCTGAGAAA |
| β-actin | F:
CTGGAACGGTGAAGGTGACA |
|
| R:
CGGCCACATTGTGAACTTTG |
Statistical analysis
Data analysis involved statistical analysis of
microarray data and differentially expressed genes, cluster
analysis, and gene ontology (GO) and pathway analysis. Microarray
data analysis was performed using SAM 4.0 software (Stanford
University, Stanford, CA, USA). Fold-changes (FC) of >2.0 or
<0.5 (i.e., subsequent to calculation, genes with FC >2 were
screened out) and P≤0.05 were used as the criteria for selection of
significant differentially expressed genes. In total ~1,183 genes
that were differently expressed between cancer and adjacent cancer
tissues were clustered using the unsupervised hierarchical
clustering method in Cluster software (17) to generate clustering heat-maps in
Treeview software (18). The
heat-maps were then used to identify gene expression patterns
associated with the samples. Based on GO (http://geneontology.org/page/go-database) and Kyoto
Encyclopedia of Genes and Genomes (KEGG) database (http://www.genome.jp/kegg/) resources, differentially
expressed genes were subjected to GO and pathway analyses using an
enriched P-value algorithm, the R-package Fisher's exact test.
P<0.05 was considered to indicate a statistically significant
difference.
Results
Baseline and demographic
characteristics of patients
All 6 patients met the selection criteria; they
consisted of 5 patients with colon cancer and 1 patient with rectal
cancer (Table III). There were 4
male and 2 female patients. Each sample was assigned a
hospitalization number, of which the middle 2 digits were
concealed.
| Table III.Baseline and demographic
characteristics of patients. |
Table III.
Baseline and demographic
characteristics of patients.
| Sample no. | Sample name | Gender | Age (years) | Lesion site |
|---|
| Cancer tissue |
|
|
|
|
| 1 | 72**10Ca | M | 64 | Colon |
| 2 | 72**62Ca | M | 68 | Colon |
| 3 | 72**34Ca | F | 74 | Colon |
| 4 | 72**75Ca | M | 64 | Colon |
| 5 | 70**39Ca | F | 40 | Rectum |
| 6 | 70**84Ca | M | 60 | Colon |
| Adjacent cancer
tissue |
|
|
|
|
| 7 | 72**10N | M | 64 | Colon |
| 8 | 72**62N | M | 68 | Colon |
| 9 | 72**34N | F | 74 | Colon |
| 10 | 72**75N | M | 64 | Colon |
| 11 | 70**39N | F | 40 | Rectum |
| 12 | 70**84N | M | 60 | Colon |
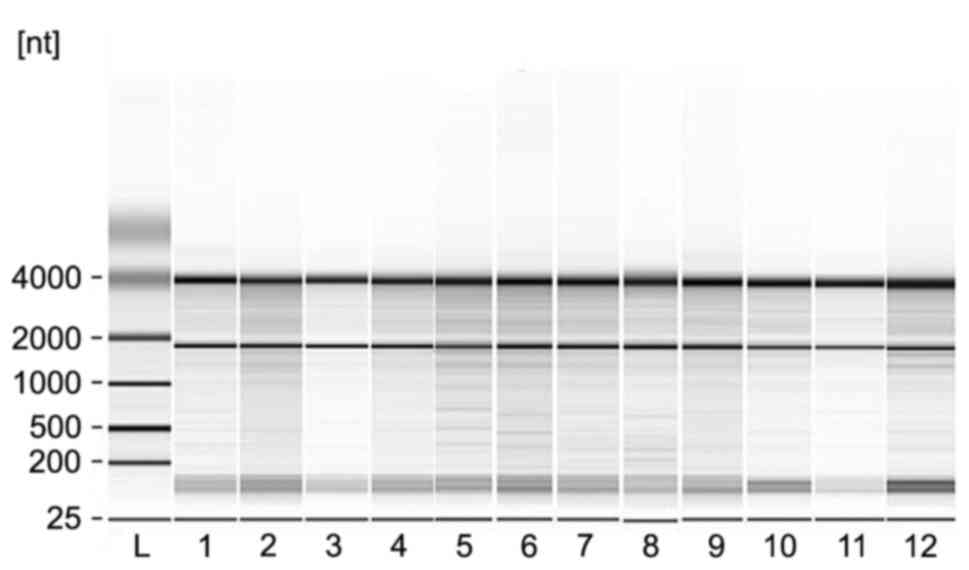
Quality control results of 12 RNA
samples
The quality of the extracted total RNA was examined
by Agilent Bioanalyzer 2100-mediated electrophoresis (Fig. 1). All of the samples exhibited RIN
values of ≥7.0 and 28S/18S rRNA ratios of >0.7, indicating the
RNA samples met the acceptable threshold.
Differentially expressed genes in
colorectal cancer and adjacent cancer tissues
By comparing gene expression profiles of colorectal
cancer and adjacent normal tissues, 1-class capabilities in SAM
software filtered out 3,680 differentially expressed genes
(P≤0.05), of which 2,043 genes were upregulated and 1,637 genes
were downregulated in cancer tissues compared with normal tissues.
To further screen for genes that showed significant differences in
their expression, a FC of >2.0 or <0.5 was added as the
standard to perform a second screen, which ultimately identified
1,183 differentially expressed genes, including 570 genes
upregulated and 613 genes downregulated in cancer tissues compared
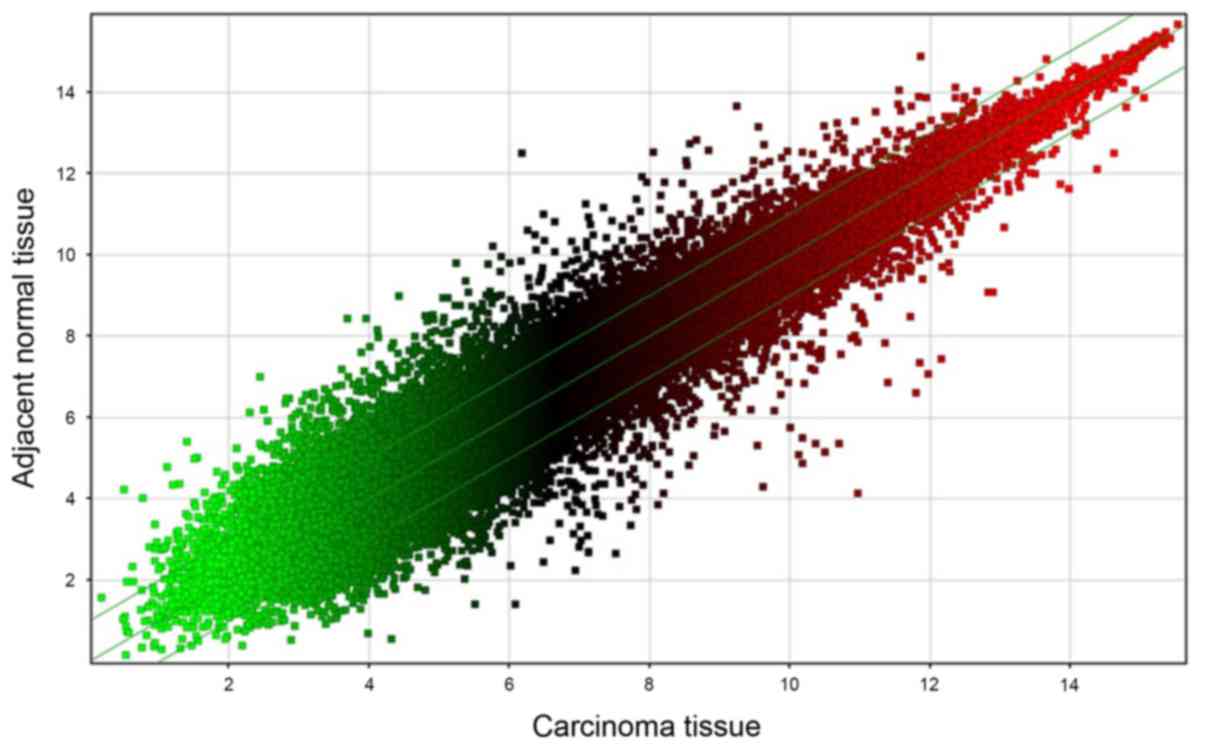
with normal tissues. The raw chip data were standardized and
log2-transformed, which gave rise to a scatter plot of the 1,183
differentially expressed genes (Fig.
2). A diagram of each point (representing the probe point on
the chip) was generated, wherein the x-axis represents the data of
carcinoma tissues and y-axis represents the data of the adjacent
normal tissues. In Fig. 2, points
falling outside of the 45° median lines represent probe signal
values where the average FC was either >2.0 or <0.5.
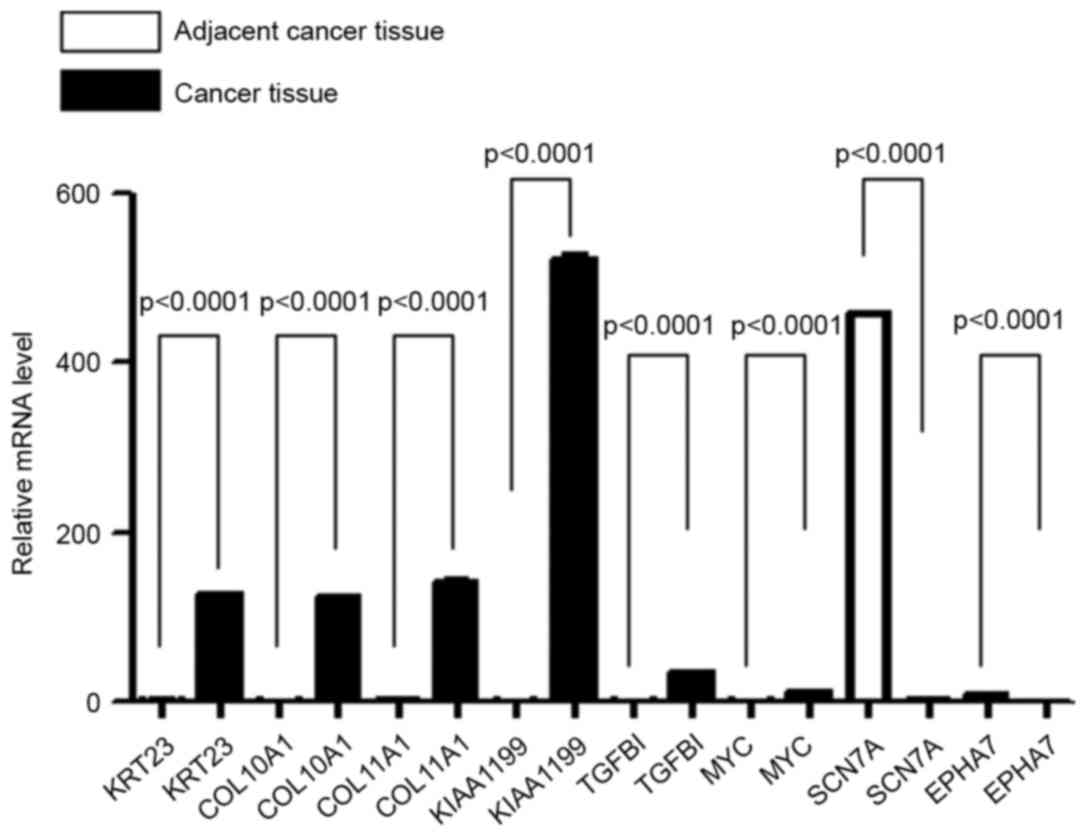
Validation of microarray results by
RT-qPCR
Data obtained from microarray assays contain a
fluorescent signal intensity of numerous noise points and missing
values, causing a certain proportion of false positive and false
negative results (19). Therefore, in
order to verify the accuracy of the gene expression prolife chips,
RT-qPCR analysis of the same samples was performed to evaluate the
data quality of the microarray. The top 4 upregulated genes (KRT23,
COL10A1, COL11A1 and KIAA1199) and the top 2 downregulated genes
(SCN7A and EPHA7) in cancer tissues were selected for RT-qPCR
validation. TGFBI and MYC, which are known upregulated genes in
cancer tissues, were used as positive controls. As shown in
Fig. 3, the results of the RT-qPCR
were consistent with the microarray assay; genes that were
upregulated in colorectal cancer tissues in the microarray results
also showed upregulated expression in the RT-qPCR, while genes that
were downregulated in the microarray results also showed
downregulated expression in RT-qPCR. Therefore, it is considered
that these 8 genes were differentially expressed between colorectal
cancer and adjacent normal tissues.
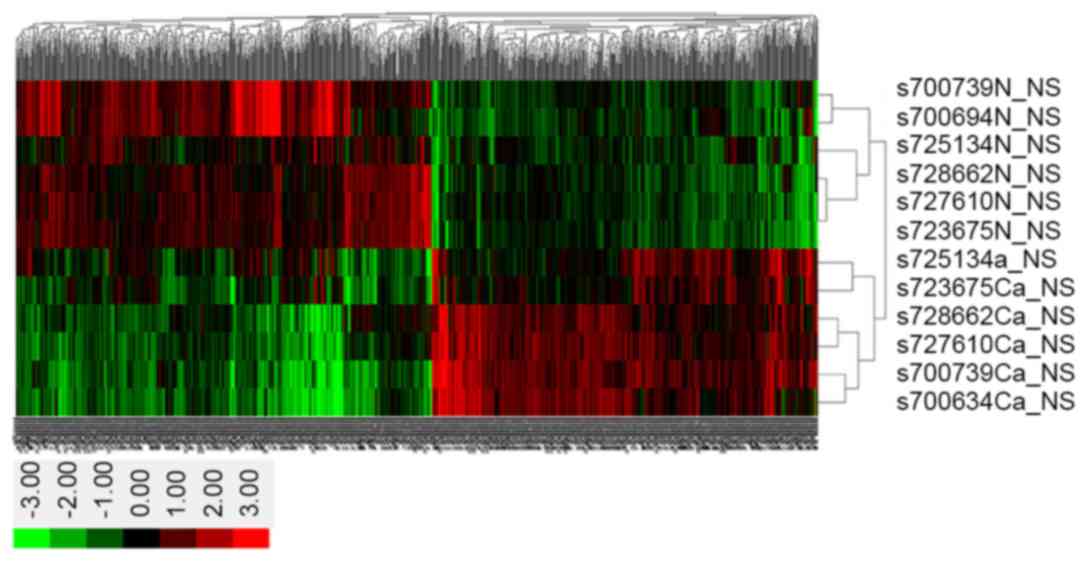
Clustering, GO and pathway analysis of
the differentially expressed genes
As exhibited in the clustered heat-map of the
microarray analysis (Fig. 4), the
1,183 differentially expressed genes between cancer and adjacent
normal tissues were divided into 2 groups using Clustering
analysis. In Fig. 4, the abscissa
represents the 1,183 differentially expressed genes, whereas the
ordinate represent the 6 samples each of cancer and adjacent normal
tissues from the bottom to the top. The red represents upregulated
genes, whilst green represents downregulated genes; genes that
exhibited no difference are shown in black.
GO analysis of the differentially expressed genes
between the two groups of samples was performed to gain a
preliminary understanding of the main biological functions. First,
based on the GO database, the functions of these 1,183
differentially expressed genes were annotated, followed by
calculation of the P-value and false discovery rate (FDR) for each
GO term using Fisher's exact and χ2 tests. Finally, according to
the screening criteria of P≤0.05 and FDR ≤5%, GO analysis results
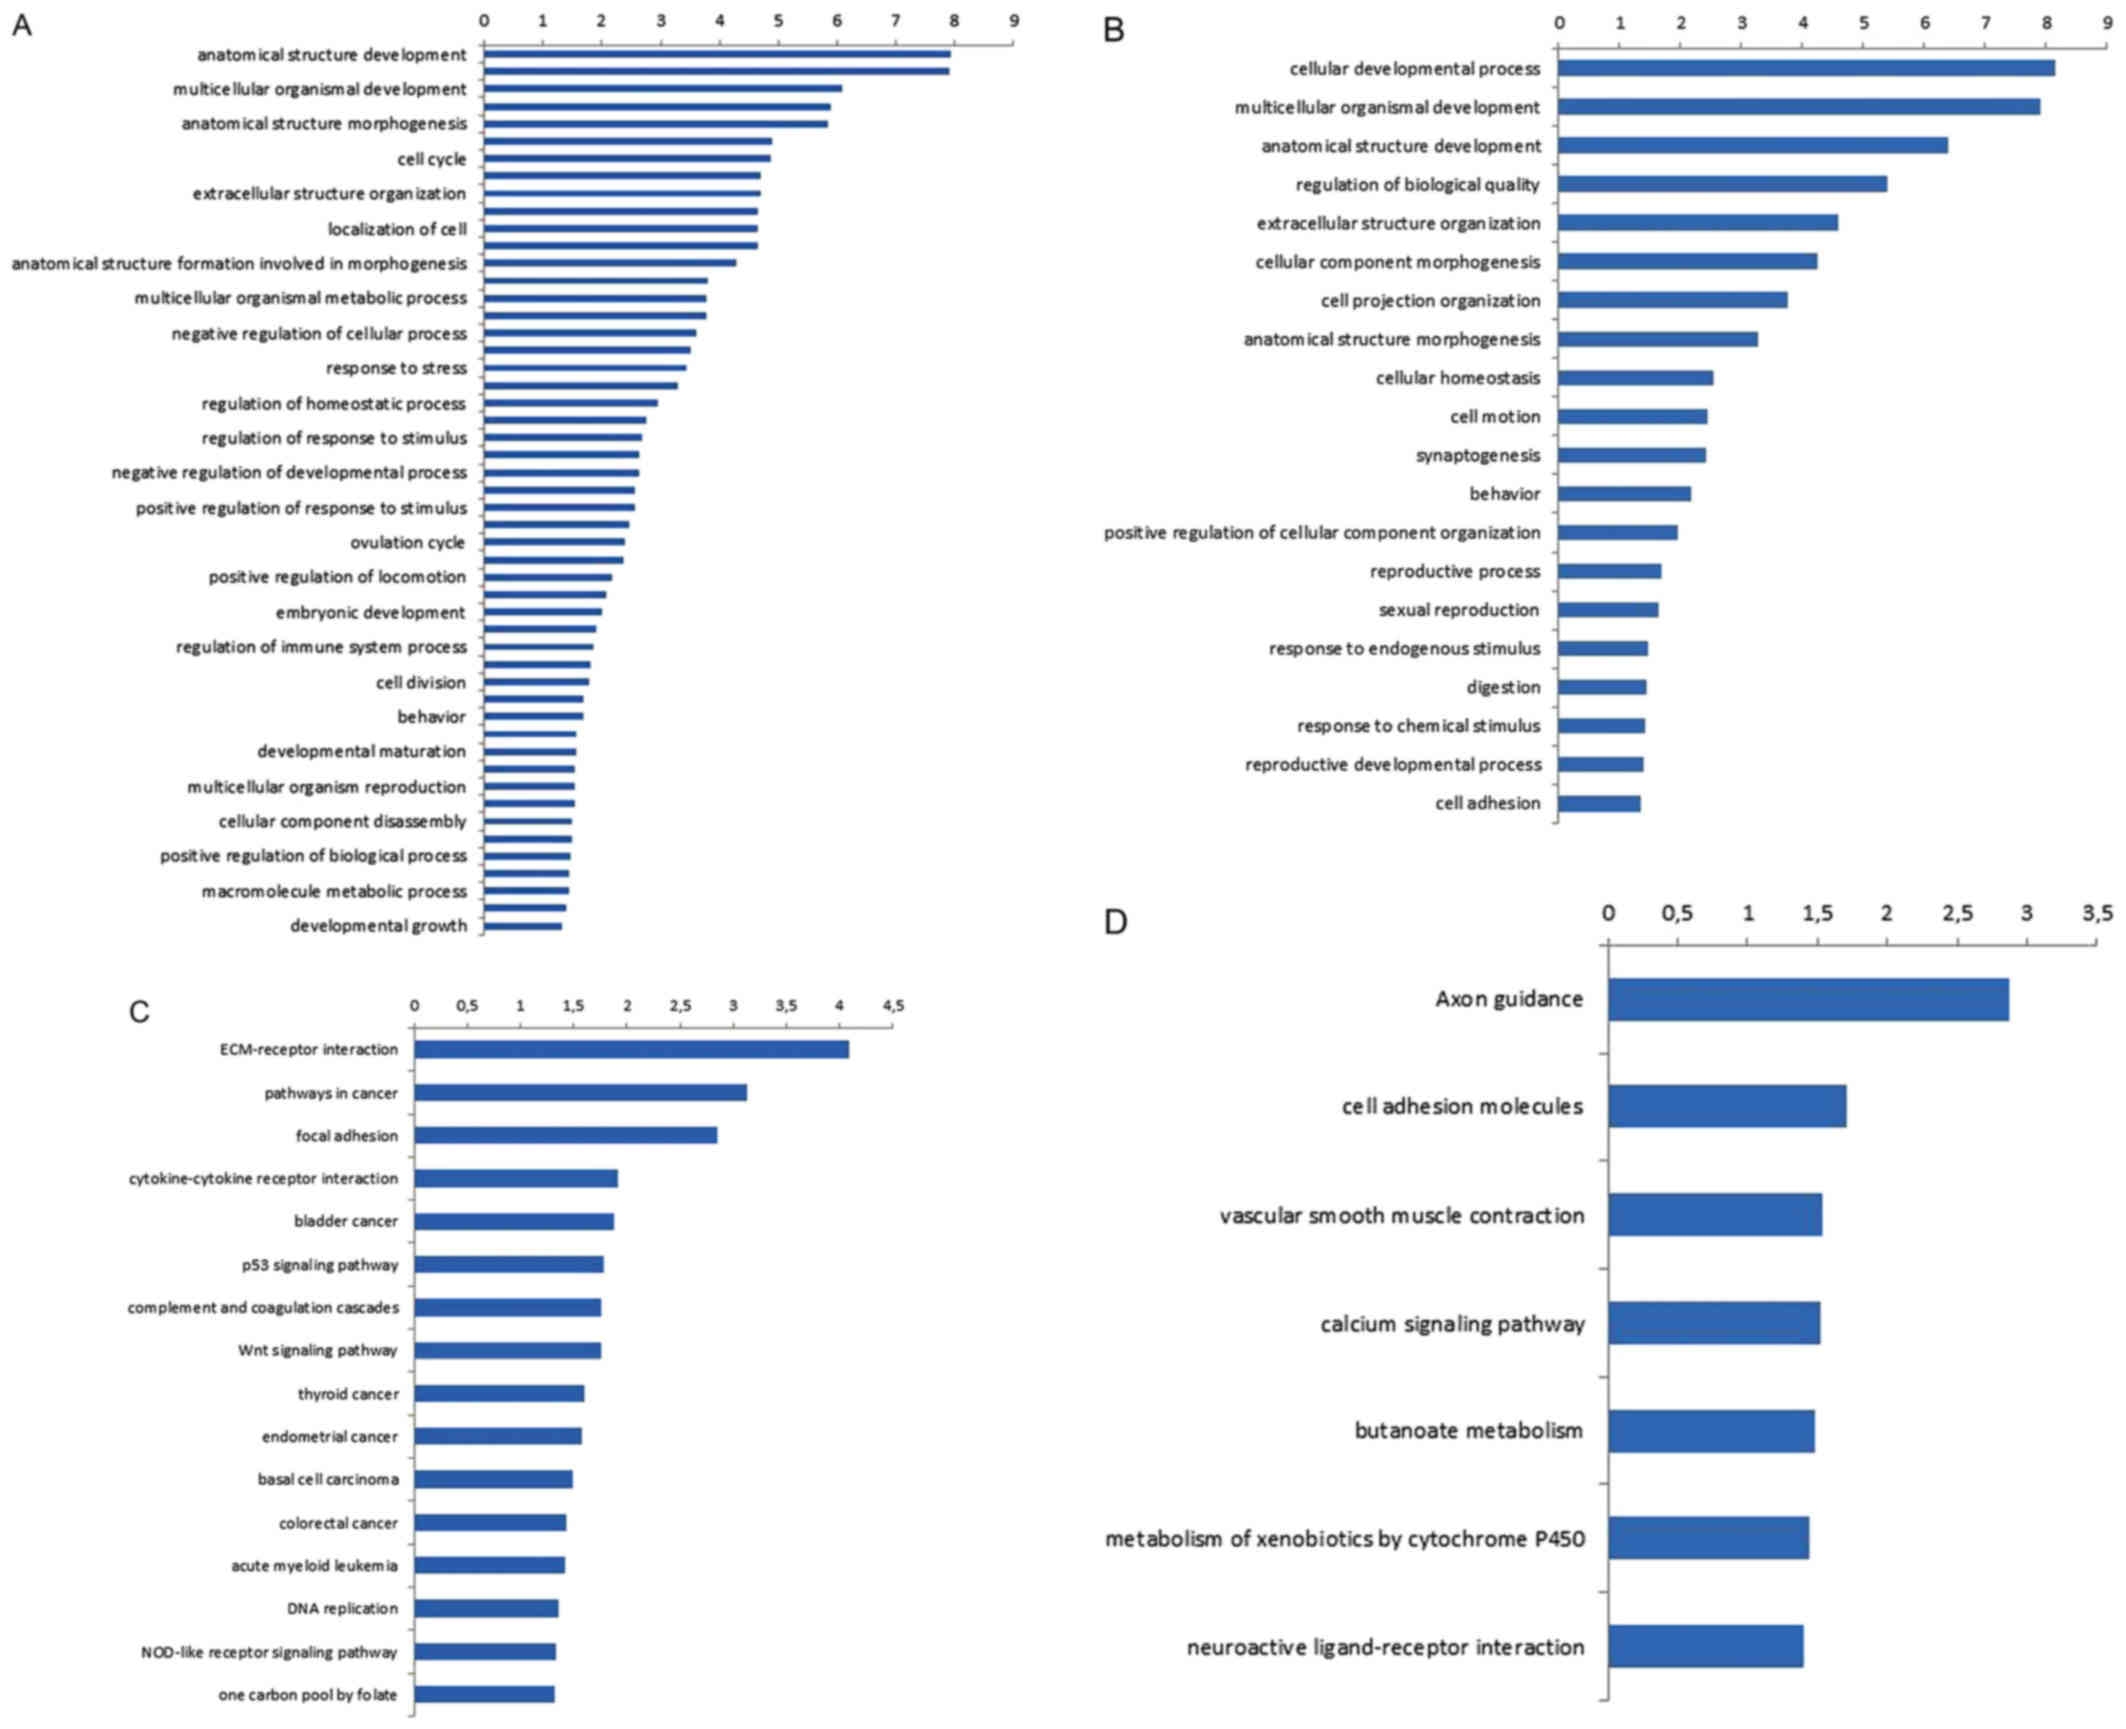
were obtained (Fig. 5A and B). As
shown in the figure, according to the functions, the upregulated
genes were divided into 51 categories, and the top 5 enriched GO
function entries were: i) Anatomical structure development (99
genes); ii) response to external stimulus (50 genes); iii)
multicellular organismal development (102 genes); iv) cell adhesion
(38 genes); and v) anatomical structure morphogenesis (54 genes).
The downregulated genes were divided into 20 categories, and the
top 5 enriched GO entries were: i) Cellular developmental process
(10 genes); ii) multicellular organismal development (18 genes);
iii) anatomical structure development (13 genes); iv) regulation of
biological quality (13 genes); and v) extracellular structure
organization (5 genes).
A similar result was observed (Fig. 5C and D) using the KEGG database,
wherein differentially expressed genes were annotated with
functions to obtain all involved pathways. The P-value and FDR for
each enriched KEGG term were calculated using Fisher's exact and χ2
tests, respectively. Subsequent to screening with the criteria of
P≤0.05 and FDR ≤5%, 16 signaling pathways were shown to be
associated with the upregulated genes, and the top 5 significantly
enriched pathways were: i) Extracellular matrix (ECM)-receptor
interaction (70 genes); ii) pathways in cancer (99 genes); iii)
focal adhesion (86 genes); iv) cytokine-cytokine receptor
interaction (56 genes); and v) bladder cancer (14 genes). The
downregulated genes were involved in 7 signal transduction
pathways, and the top 5 pathways were: i) Axon guidance (10 genes);
ii) cell adhesion molecules (8 genes); iii) vascular smooth muscle
contraction (7 genes); iv) calcium signaling pathway (9 genes); and
v) butanoate metabolism (4 genes). Table
IV summarizes the genes and pathways associated with colorectal
cancer, as filtered out by the KEGG analysis.
| Table IV.Partial KEGG analysis results for the
differentially expressed genes. |
Table IV.
Partial KEGG analysis results for the
differentially expressed genes.
| KEGG entries | No. of genes | Genes |
|---|
| Upregulated
genes |
|
|
|
ECM-receptor interaction | 10 | COL4A1, CD44,
COL3A1, COL1A2, LAMC2, COL1A1, COL5A2, THBS2, COL11A1, COL5A1 |
|
Pathways in cancer | 18 | BID, WNT5A, TCF7,
COL4A1, IL8, MET, BRCA2, LEF1, CDK6, MMP1, WNT2, CCND1, VEGFA,
SLC2A1, LAMC2, AXIN2, RUNX1, MYC |
| Focal
adhesion | 13 | COL4A1, COL3A1,
MET, COL5A2, COL5A1, CCND1, VEGFA, COL1A2, LAMC2, COL1A1, COL11A1,
THBS2, PARVB |
| Bladder
cancer | 5 | CCND1,
IL8a, VEGFA, MYC,
MMP1a |
| p53
signaling pathway | 6 | BID, CCND1,
SERPINE1, CDK6, PMAIP1, PERP |
| Wnt
signaling pathway | 9 | WNT2, WNT5A, TCF7,
CCND1, SFRP4a, LEF1,
RUVBL1, AXIN2, MYC |
| Thyroid
cancer | 4 | TCF7, CCND1, LEF1,
MYC |
|
Endometrial cancer | 5 | TCF7, CCND1, LEF1,
AXIN2, MYC |
| Basal
cell carcinoma | 5 | WNT2a, WNT5A, TCF7, LEF1, AXIN2 |
|
Colorectal cancer | 6 | TCF7, CCND1, MET,
LEF1, AXIN2, MYC |
| Acute
myeloid leukemia | 5 | TCF7, CCND1, LEF1,
RUNX1, MYC |
| Downregulated
genes |
|
|
| Cell
adhesion molecules | 8 | NCAM1, CADM1,
PVRL3, NLGN4X, NLGN1, NFASC, CNTN1, NRXN1a |
Discussion
Colorectal cancer is one of the most common types of
malignant tumors, and its incidence has shown an increasing trend
in recent years. The 2012 Annual Report of Cancer Registration in
China released by the National Cancer Registry Center (20) shows that the growth rate of the
incidence of colorectal cancer in Zhejiang, Shanghai and Jiangsu
far exceeded that in Western countries. In Shanghai, the latest
cancer surveillance data show that, from the early 1970s to date,
the ranking of colorectal cancer has risen from sixth to second
among common malignant tumors, with an increase of ~5 times
(21). In the 2013 Ninth Shanghai
International Forum of Colorectal Cancer, Professor Qin Xinyu, from
Zhongshan Hospital of Fudan University revealed that the
epidemiological trend in colorectal cancer in China in the past 20
years has shown a novel change from low-incidence disease to
high-incidence disease and the absolute number of morbidity and
fatality has exceeded that in the USA in previous years, with a
high proportion of young patients (22). The average age of colorectal cancer
onset in China is now equal to developed countries. However,
similar to numerous other typical gastrointestinal cancers,
colorectal cancer has a long time of progression, generally 8 to 10
years, which provides sufficient time for detection and treatment.
Through active prevention, early diagnosis, and effective
treatment, it is possible to cure this lethal disease (23). Therefore, early detection and
diagnosis of colorectal cancer may fundamentally change the outcome
of colorectal cancer patients.
cDNA microarrays are a high-throughput, integrated
and emerging inspection technology that have been used for
investigations at the genomic, transcriptomic and epigenetic
levels. In the present study, Human Genome U133 Plus 2.0 Array
chips were used to compare 6 pairs of gene expression profiles from
colorectal cancer and adjacent normal tissues. In total, 1,183
genes, including 570 that were upregulated and 613 that were
downregulated, were identified to be differentially expressed
between these two groups. Subsequently, 4 genes that were
upregulated (KRT23, COL10A1, COL11A1 and KIAA1199) and 2 genes that
were downregulated (SCN7A and EPHA7) in all 6 patients with
carcinoma were selected for validation by RT-qPCR. TGFBI and MYC,
which are known to be upregulated in cancers (15), served as positive controls. The
RT-qPCR results were consistent with the microarray results, which
demonstrated the reliability of the microarray results.
Cluster analysis is one of the commonly used methods
in microarray data mining. By calculating the similarities of the
data, the unsupervised data obtained from microarrays were
classified to cluster similar data. It has been demonstrated
(24) theoretically that genes that
are classified into one cluster potentially have similar or
associated functions; thus, the functions of unknown genes may be
deduced by functional association. The heat-map of the cluster
analysis in the present study suggested that the expression
patterns of the first 6 samples were different from the other 6
samples. The two types of expression patterns among these 12
samples represented two types of samples: The cancer tissues and
adjacent normal tissues. These results suggested that the cancer
tissues and adjunct normal tissues had different gene expression
patterns. Using cDNA microarrays, 1,183 differentially expressed
genes were identified between the cancer and normal tissues, which
may lay the foundation for subsequent analysis in future
studies.
By GO analysis, the upregulated genes were divided
into 51 categories, and the downregulated genes were classified
into 20 categories, according to different functions. Through KEGG
pathway analysis, the upregulated genes were associated with 16
signal transduction pathways and the downregulated genes were
associated with 7 signal transduction pathways; these included
pathways that are known to be directly associated with the
development of colorectal cancer or other cancers, such as
ECM-receptor interaction. ECM-receptor interaction was identified
to be significantly activated in patients with meningioma (25). Other key pathways that regulate cell
adhesion, migration, proliferation and survival were downregulated,
and have been associated with numerous tumors, including breast and
thyroid carcinoma (26). The p53
signaling pathway was demonstrated to serve a pivotal role by
forming a complex with its target genes to suppress tumorigenesis
(27), and the Wnt signaling pathway,
which is a complex network of protein-protein interactions and a
major pathway involved in cancer development and embryogenesis,
have been reported to be abnormally regulated in a variety of
tumors (28–31). Amongst the pathways associated with
the differentially expressed genes in the present study, 6 genes
identified to have previously been directly associated with
colorectal cancer: T-cell-specific transcription factor 1 (TCF7)
(32), cyclin D1 (CCND1) (33), tyrosin-protein kinase met (MET)
(34), lymphoid enhancer binding
factor 1 (LEF1) (35), axin 2 (AXIN2)
(36) and MYC (37). TCF7, CCND1, LEF1, AXIN2 and MYC were
all associated with the Wnt signaling pathway. TCF7 and LEF1
regulate transcription initiation by forming a coactivating complex
with nuclear β-catenin. P53 and the nuclear receptor family may
inhibit the Wnt signaling pathway by regulating TCF7/LEF1
activation or repression (38). AXIN2
(39) and MYC (40) are the targets in the classic Wnt
signaling pathway, which modulates the stability of β-catenin to
regulate cell proliferation and differentiation. CCND1 and MET are
the receptors for the hepatocyte growth factor (HGF); the
activation of HGF results in the phosphorylation of two
MET-adjacent tyrosine residues, which in turn activates multiple
signaling pathways, thereby promoting cell division, angiogenesis,
tumor cell invasion and metastasis (41,42). CCND1
is a key factor in the regulation of the cell cycle, and its
overexpression shortens the G1/S phase, such that cells produce
less growth-dependent cytokines, which in turn affects tumor
occurrence, development and prognosis (43).
With the current popularity of gene chip technology
and rapid development of bioinformatics, more studies are exploring
tumor-associated gene signaling pathways. Key gene effectors and
signaling pathways involved in the occurrence and development of
colorectal cancer have gradually been revealed (44–46). In
the present study, a cDNA microarray analysis was performed to
screen for genes that were differentially expressed between
colorectal cancer and adjacent normal tissues. A KEGG analysis
revealed 6 overlapping genes amongst numerous signaling pathways,
which have been implicated in the development of a variety of
tumors, were also significantly enriched in colorectal cancer
tissues. These 6 genes, which have been closely associated with the
development of colorectal cancer, were involved in the regulation
of the cell cycle, adhesion, metabolism, proliferation and
differentiation; thus, their dysregulation may be involved in the
process of tumor development. Further research on these genes and
the implicated signaling pathways may shed new light on the
pathogenesis of colorectal cancer.
Acknowledgements
The present study was supported by the National
Natural Science Foundation of China (grant no. 81072152).
References
|
1
|
Nordlinger B, Sorbye H, Glimelius B,
Poston GJ, Schlag PM, Rougier P, Bechstein WO, Primrose JN, Walpole
ET, Finch-Jones M, et al: Perioperative chemotherapy with FOLFOX4
and surgery versus surgery alone for resectable liver metastases
from colorectal cancer (EORTC Intergroup trial 40983): A randomised
controlled trial. Lancet. 371:1007–1016. 2008. View Article : Google Scholar : PubMed/NCBI
|
|
2
|
Ferlay J, Soerjomataram I, Dikshit R, Eser
S, Mathers C, Rebelo M, Parkin DM, Forman D and Bray F: Cancer
incidence and mortality worldwide: Sources, methods and major
patterns in GLOBOCAN 2012. Int J Cancer. 136:E359–E386. 2015.
View Article : Google Scholar : PubMed/NCBI
|
|
3
|
Jemal A, Bray F, Center MM, Ferlay J, Ward
E and Forman D: Global cancer statistics. CA Cancer J Clin.
61:69–90. 2011. View Article : Google Scholar : PubMed/NCBI
|
|
4
|
Torre LA, Bray F, Siegel RL, Ferlay J,
Lortet-Tieulent J and Jemal A: Global cancer statistics, 2012. CA
Cancer J Clin. 65:87–108. 2015. View Article : Google Scholar : PubMed/NCBI
|
|
5
|
Wan D: Epidemiology and prevention of
colorectal cancer. Chin J Surg Integ Tradit West Med. 17:3–7.
2012.
|
|
6
|
Galizia G, Gemei M, Del Vecchio L, Zamboli
A, Di Noto R, Mirabelli P, Salvatore F, Castellano P, Orditura M,
De Vita F, et al: Combined CD133/CD44expression as a prognostic
indicator of disease-free survival in patientswith colorectal
cancer. Arch Surg. 147:18–24. 2012. View Article : Google Scholar : PubMed/NCBI
|
|
7
|
The changing face of UK primary cancer
care: Lancet Oncol. 2:6492001.
|
|
8
|
Speights VO, Johnson MW, Stoltenberg PH,
Rappaport ES, Helbert B and Riggs M: Colorectal cancer: Current
trends in initial clinical manifestations. South Med J. 84:575–578.
1991.PubMed/NCBI
|
|
9
|
Summerton N: Symptoms of possible
oncological significance: Separating the wheat from the chaff. BMJ.
325:1254–1255. 2002. View Article : Google Scholar : PubMed/NCBI
|
|
10
|
Flashman K, O'Leary DP, Senapati A and
Thompson MR: The department of health's ‘two week standard’ for
bowel cancer: Is it working? Gut. 53:387–391. 2004. View Article : Google Scholar : PubMed/NCBI
|
|
11
|
Knottnerus JA, Knipschild PG and Sturmans
F: Symptoms and selection bias: The influence of selection towards
specialist care on the relatioship between symptoms and diagnosis.
Theor Med. 10:67–81. 1989. View Article : Google Scholar : PubMed/NCBI
|
|
12
|
LaPointe LC, Pedersen SK, Dunne R, Brown
GS, Pimlott L, Gaur S, McEvoy A, Thomas M, Wattchow D, Molloy PL,
et al: Discovery and validation of molecular biomarkers for
colorectal adenomas and cancer with application to blood testing.
PLoS One. 7:e290592012. View Article : Google Scholar : PubMed/NCBI
|
|
13
|
Yi JM, Dhir M, Guzzetta AA,
Iacobuzio-Donahue CA, Heo K, Yang KM, Suzuki H, Toyota M, Kim HM,
Ahuja N, et al: DNA methylation biomarker candidates for early
detection of colon cancer. Tumour Biol. 33:363–72. 2012. View Article : Google Scholar : PubMed/NCBI
|
|
14
|
Gautier L, Cope L, Bolstad BM and Irizarry
RA: Affy-analysis of Affymetrix GeneChip data at the probe level.
Bioinformatics. 20:307–315. 2004. View Article : Google Scholar : PubMed/NCBI
|
|
15
|
Wright JB, Brown SJ and Cole MD:
Upregulation of c-MYC in cis through a large chromatin loop linked
to a cancer risk-associated single-nucleotide polymorphism in
colorectal cancer cells. Mol Cell Biol. 30:1411–1420. 2010.
View Article : Google Scholar : PubMed/NCBI
|
|
16
|
Livak KJ and Schmittgen TD: Analysis of
relative gene expression data using real-time quantitative PCR and
the 2(-Delta Delta C(T)) method. Methods. 25:402–408. 2001.
View Article : Google Scholar : PubMed/NCBI
|
|
17
|
de Hoon MJ, Imoto S, Nolan J and Miyano S:
Open source clustering software. Bioinformatics. 20:1453–1454.
2004. View Article : Google Scholar : PubMed/NCBI
|
|
18
|
Maitra A, Adsay NV, Argani P,
Iacobuzio-Donahue C, De Marzo A, Cameron JL, Yeo CJ and Hruban RH:
Multicomponent analysis of the pancreatic adenocarcinoma
progression model using a pancreatic intraepithelial neoplasia
tissue microarray. Mod Pathol. 16:902–912. 2003. View Article : Google Scholar : PubMed/NCBI
|
|
19
|
Huber W, Von Heydebreck A and Vingron M:
Analysis of microarray gene expression dataHandbook of Statistical
Genetics. 2nd. John Wiley & Sons; (NJ, USA): pp. 37–53.
2003
|
|
20
|
National Cancer Centre, . Bureau for
Disease Control and Prevention of Health Ministry: The 2011 Chinese
cancer registry annual report. Military Medical Science Press 17;
Beijing: 53–57(58)2012, (In Chinese).
|
|
21
|
Chen JG, Zhu J, Parkin DM, Zhang YH, Lu
JH, Zhu YR and Chen TY: Trends in the incidence of cancer in
Qidong, China, 1978–2002. Int J Cancer. 119:1447–1454. 2006.
View Article : Google Scholar : PubMed/NCBI
|
|
22
|
Xu J, Qin X, Wang J, Zhang S, Zhong Y, Ren
L, Wei Y, Zeng S, Wan D, Zheng S, et al: Chinese guidelines for the
diagnosis and comprehensive treatment of hepatic metastasis of
colorectal cancer. J Cancer Res Clin Oncol. 137:1379–1396. 2011.
View Article : Google Scholar : PubMed/NCBI
|
|
23
|
Fearon ER: Molecular genetics of
colorectal cancer. Annu Rev Pathol. 6:479–507. 2011. View Article : Google Scholar : PubMed/NCBI
|
|
24
|
Quackenbush J: Computational analysis of
microarray data. Nat Rev Genet. 2:418–427. 2001. View Article : Google Scholar : PubMed/NCBI
|
|
25
|
Wang X, Gong Y, Wang D, Xie Q, Zheng M,
Zhou Y, Li Q, Yang Z, Tang H, Li Y, et al: Analysis of gene
expression profiling in meningioma: Deregulated signaling pathways
associated with meningioma and EGFL6 overexpression in benign
meningioma tissue and serum. PLoS One. 7:e527072012. View Article : Google Scholar : PubMed/NCBI
|
|
26
|
Fang XQ, Liu XF, Yao L, Chen CQ, Gu ZD, Ni
PH, Zheng XM and Fan QS: Somatic mutational analysis of FAK in
breast cancer: A novel gain-of-function mutation due to deletion of
exon 33. Biochem Biophys Res Commun. 443:363–369. 2014. View Article : Google Scholar : PubMed/NCBI
|
|
27
|
Liu J, Zhang C and Feng Z: Tumor
suppressor p53 and its gain-of-function mutants in cancer. Acta
Biochim Biophys Sin (Shanghai). 46:170–179. 2014. View Article : Google Scholar : PubMed/NCBI
|
|
28
|
Colli LM, Saggioro F, Serafini LN, Camargo
RC, Machado HR, Moreira AC, Antonini SR and de Castro M: Components
of the canonical and non-canonical Wnt pathways are not
mis-expressed in pituitary tumors. PLoS One. 8:e624242013.
View Article : Google Scholar : PubMed/NCBI
|
|
29
|
Cai Y, Cai T and Chen Y: Wnt pathway in
osteosarcoma, from oncogenic to therapeutic. J Cell Biochem.
115:625–631. 2014. View Article : Google Scholar : PubMed/NCBI
|
|
30
|
Wang SH, Li N, Wei Y, Li QR and Yu ZP:
β-catenin deacetylation is essential for WNT-induced proliferation
of breast cancer cells. Mol Med Rep. 9:973–978. 2014. View Article : Google Scholar : PubMed/NCBI
|
|
31
|
Krausova M and Korinek V: Wnt signaling in
adult intestinal stem cells and cancer. Cell Signal. 26:570–579.
2014. View Article : Google Scholar : PubMed/NCBI
|
|
32
|
Waterman ML: Lymphoid enhancer factor/T
cell factor expression in colorectal cancer. Cancer Metastasis Rev.
23:41–52. 2004. View Article : Google Scholar : PubMed/NCBI
|
|
33
|
Tetsu O and McCormick F: Beta-catenin
regulates expression of cyclin D1 in colon carcinoma cells. Nature.
398:422–426. 1999. View
Article : Google Scholar : PubMed/NCBI
|
|
34
|
Emaduddin M, Bicknell DC, Bodmer WF and
Feller SM: Cell growth, global phosphotyrosine elevation, and c-Met
phosphorylation through Src family kinases in colorectal cancer
cells. Proc Natl Acad Sci USA. 105:2358–2362. 2008. View Article : Google Scholar : PubMed/NCBI
|
|
35
|
Kriegl L, Horst D, Reiche JA, Engel J,
Kirchner T and Jung A: LEF-1 and TCF4 expression correlate
inversely with survival in colorectal cancer. J Transl Med.
8:1232010. View Article : Google Scholar : PubMed/NCBI
|
|
36
|
Liu W, Dong X, Mai M, Seelan RS, Taniguchi
K, Krishnadath KK, Halling KC, Cunningham JM, Boardman LA, Qian C,
et al: Mutations in AXIN2 cause colorectal cancer with defective
mismatch repair by activating beta-catenin/TCF signalling. Nat
Genet. 26:146–147. 2000. View
Article : Google Scholar : PubMed/NCBI
|
|
37
|
He TC, Sparks AB, Rago C, Hermeking H,
Zawel L, da Costa LT, Morin PJ, Vogelstein B and Kinzler KW:
Identification of c-MYC as a Target of the APC Pathway. Science.
281:1509–1512. 1998. View Article : Google Scholar : PubMed/NCBI
|
|
38
|
Mao CD and Byers SW: Cell-context
dependent TCF/LEF expression and function: Alternative tales of
repression, de-repression and activation potentials. Crit Rev
Eukaryot Gene Expr. 21:207–236. 2011. View Article : Google Scholar : PubMed/NCBI
|
|
39
|
Wang FW, Wen L, Zhu SW, Yao Q, Cai YM and
Ma G: Mechanism of Wnt signaling pathway regulation by a truncated
mutant of Axin2 in colorectal cancer. Cancer. 26:1041–1046.
2007.(In Chinese).
|
|
40
|
van de Wetering M, Sancho E, Verweij C, de
Lau W, Oving I, Hurlstone A, van der Horn K, Batlle E, Coudreuse D,
Haramis AP, et al: The beta-catenin/TCF-4 complex imposes a crypt
progenitor phenotype on colorectal cancer cells. 111:241–250.
2002.
|
|
41
|
Wang Y and Zheng T: Screening of hub genes
and pathways in colorectal cancer with microarray technology.
Pathol Oncol Res. 20:611–618. 2014. View Article : Google Scholar : PubMed/NCBI
|
|
42
|
Nishimura Y, Takiguchi S, Ito S and Itoh
K: Evidence that depletion of the sorting nexin 1 by siRNA promotes
HGF-induced MET endocytosis and MET phosphorylation in a
gefitinib-resistant human lung cancer cell line. Int J Oncol.
44:412–426. 2014. View Article : Google Scholar : PubMed/NCBI
|
|
43
|
Naushad SM, Reddy CA, Kumaraswami K,
Divyya S, Kotamraju S, Gottumukkala SR, Digumarti RR and Kutala VK:
Impact of hyperhomocysteinemia on breast cancer initiation and
progression: Epigenetic perspective. Cell Biochem Biophys.
68:397–406. 2014. View Article : Google Scholar : PubMed/NCBI
|
|
44
|
Han L, Wu Z and Zhao Q: Revealing the
molecular mechanism of colorectal cancer by establishing
LGALS3-related protein-protein interaction network and identifying
signaling pathways. Int J Mol Med. 33:581–588. 2014. View Article : Google Scholar : PubMed/NCBI
|
|
45
|
Takahashi Y, Sawada G, Kurashige J, Uchi
R, Matsumura T, Ueo H, Takano Y, Eguchi H, Sudo T, Sugimachi K, et
al: Amplification of PVT-1 is involved in poor prognosis via
apoptosis inhibition in colorectal cancers. Br J Cancer.
110:164–171. 2014. View Article : Google Scholar : PubMed/NCBI
|
|
46
|
Gantt GA, Chen Y, Dejulius K, Mace AG,
Barnholtz-Sloan J and Kalady MF: Gene expression profile is
associated with chemoradiation resistance in rectal cancer.
Colorectal Dis. 16:57–66. 2014. View Article : Google Scholar : PubMed/NCBI
|