Introduction
Neuroblastoma is a malignancy that arises from the
neural crest cells of the sympathetic nervous system and accounts
for 15% of paediatric cancer mortalities (1). The cancer presents as a highly diverse
heterogeneous disease that ranges from sporadically regressing to
refractory forms (2). Although there
have been advances in the understanding of this disease and the use
of aggressive treatment strategies, including surgery, radiation
therapy, immunotherapy and differentiation therapy, it remains one
of the most challenging types of cancer to treat with a 5-year
survival rate of 42% (3). Therefore,
there is a requirement for alternative approaches to treatment.
Drugs that target metabolic diseases, including the
type II diabetes drugs metformin and phenformin, have been reported
to be clinically important in the treatment of cancer (4,5). Although
phenformin was removed from the recommended treatment plan for
diabetics as it has a propensity to induce lactic acidosis at high
doses (6), it has been identified to
have anti-neoplastic activity in phosphatase and tensin homolog
(PTEN)-deficient tumors and in MCF-7 and MDA-MD-231 breast cancer
cells (7,8) at reduced concentrations compared with
those established for efficacious treatment with metformin
(9). Phenformin was also previously
identified to induce the expression of the cyclin-dependent kinases
inhibitor p21 and promote cell cycle arrest at the G2/M
phase of the cell cycle leading to the apoptosis of neuroblastoma
SH-SY5Y cells (10). However, the
underlying mechanism by which phenformin causes these effects
remains to be elucidated.
Adenosine monophosphate-activated protein kinase
(AMPK) is a sensor of cellular homeostasis that is activated in
response to a reducing level of cellular ATP in order to maintain
the energy balance within the cell. AMPK is phosphorylated when the
ratio of AMP:ATP decreases leading to the inhibition of
ATP-consuming pathways and the activation of ATP-producing pathways
(11,12). AMPK phosphorylation promotes a
phosphorylation cascade that regulates the activity of numerous
downstream targets, including the mammalian target of rapamycin
(mTOR) signalling pathway. In the majority of the cases where the
biguanides, metformin and phenformin are associated with antitumor
effects, it is considered that the AMPK/mTOR signalling pathway may
serve an important role in the underlying mechanism of that action
(7). Metformin and phenformin have
been hypothesized to indirectly activate AMPK via the inhibition of
complex I (13–15) of the respiratory chain in mitochondria
therefore, decreasing ATP synthesis and increasing the AMP:ATP
ratio (13,14). The increase in peripheral glucose
utilization and metabolism, and the stimulation of glycolytic
lactate production, observed following metformin treatment of
patients with diabetes, are effects that would be predicted with
the inhibition of complex I of the respiratory chain (16).
Therefore, mitochondrial complex I has been a focus
for investigating the activity of phenformin (and metformin).
Wheaton et al (9) demonstrated
that phenformin inhibits complex I of mitochondria at low
concentrations and that this inhibition was important for its
anti-proliferative effects on colon cancer cells. Furthermore,
biguanide sensitivity of a range of cancer cells was reversed using
ectopic expression of yeast NADH-quinone oxidoreductase 1 (Ndi1), a
ubiquinone oxidoreductase that allows the bypassing of complex I
function (17).
The present study demonstrated that phenformin may
be capable of promoting cell death in human-derived neuroblastoma
SH-SY5Y cells and may inform further on the underlying mechanism of
this action.
Materials and methods
Reagents
Phenformin hydrochloride (Sigma Aldrich; Merck KGaA,
Darmstadt, Germany) was dissolved in H2O and sterile
filtered. Antimycin A (Sigma Aldrich; Merck KGaA) was dissolved in
ethanol. All the antibodies were sourced from Cell Signalling
Technology, Inc., (Danvers, MA, USA). Media and FBS were obtained
from Invitrogen (Thermo Fisher Scientific, Inc.). The Immobilon
Western Chemiluminescence HRP substrate was sourced from Merck
KGaA. Bicinchoninic acid reagents were obtained from Pierce (Thermo
Fisher Scientific, Inc.). The polyvinylidene difluoride (PVDF)
membrane was purchased from Merck KGaA, and the protease inhibitors
were sourced from Roche Applied Science (Penzberg, Germany). Unless
otherwise stated, chemicals were obtained from Sigma Aldrich (Merck
KGaA).
Cell culture
SH-SY5Y cells (American Type Culture Collection,
Manassas, VA, USA) were maintained in Dulbecco's modified Eagle's
medium (DMEM) F12 and GlutaMAX™ medium supplemented with
2% penicillin/streptomycin and 10% fetal bovine serum. The cells
were incubated at 37°C in a humidified atmosphere containing 5%
CO2 and passaged twice a week.
Alamar blue viability assay
The cell proliferation assay was performed using the
AlamarBlue® assay (Medical Supply Company, Ltd., Dublin,
Ireland) according to the manufacturer's protocol. The cells were
plated at a density of 3×10⁴ cells/ml in triplicate in a
96-well plate in a volume of 200 µl, cultured overnight at 37°C in
5% CO2, and the following day the cells were treated
with a range of concentrations of phenformin (0.1–10,000 µM) and
cultured for 72 h. Alamar blue (10% v/v, 20 µl) was added to the
wells for 3–5 h. Fluorescence was analysed using Spectra Gemini
microplate reader (Molecular Devices, LLC, Sunnyvale, CA, USA) at a
wavelength of 544 nm with a reference wavelength of 590 nm. Results
were presented as the percentage of viability relative to the
vehicle control (100%). Dose response curves and IC50
determination were analyzed using Prism GraphPad version 5 software
(GraphPad Software, Inc., La Jolla, CA, USA).
Cell cycle analysis by flow
cytometry
On day 0, SH-SY5Y cells were plated in a 6-well
plate at a density of 1.1×10⁵ cells/well. On day 1, 80
µl of phenformin, to a final concentration of 0.1, 0.5, 1, 2 and 5
mM, was added to the respective wells and incubated at 37°C in 5%
CO2 for 72 h. Following treatment, the cells were
trypsinised and pelleted by centrifugation. The cells were
subsequently fixed in 70% ethanol/PBS and incubated overnight at
4°C. The ethanol was removed using centrifugation at 300 × g
for 5 min at room temperature, and the pellets were resuspended in
400 µl PBS supplemented with 10 µg/ml RNase A (Sigma Aldrich; Merck
KGaA) and propidium iodide (PI) 100 µg/ml (Sigma Aldrich; Merck
KGaA). The cells were then incubated in the dark for 30 min at
37°C. Cell cycle distribution was analysed using the FACS Calibur
flow cytometer (BD Biosciences, Franklin Lakes, NJ, USA) using Cell
Quest Pro (version 4.3; BD Biosciences).
Annexin V assay
Following treatment, the cells were analysed using
the Apopnexin Annexin V/Fluorescein isothiocyanate apoptosis kit
(EMD Millipore, Billerica, MA, USA) following the manufacturer's
protocol as previously described (18). The cells were analysed using the CyAn
ADP Analyser flow cytometer (Beckman Coulter, Inc., Brea, CA, USA)
and the Summit software (version 4.3; Beckman Coulter Inc.).
Oxygen consumption measurements
Oxygen consumption rates (OCR) were measured using
the Oxygraph 2-k respirometer (Oroboros® Instruments
Corporation, Innsbruck, Austria) and the XF24 Seahorse
Extracellular Flux analyser (Agilent Technologies, Inc., Santa
Clara, CA, USA).
Oxygraph measurements
SH-SY5Y cells were plated at a density of
1×10⁶ in T75 flasks and were cultured overnight at 37°C
in 5% CO2. The following day, the cells were treated
with 1 mM phenformin or vehicle (H2O) for 6–48 h,
trypsinized and pelleted by centrifugation at 300 × g for 5
min then resuspended in the appropriate cell culture media and
divided equally between the two chambers in the oxygraph
respirometer. Once stable basal cellular oxygen consumption rates
were observed, the mitochondrial electron transport chain inhibitor
antimycin A (1 µM) was added to the two chambers using a Hamilton
syringe to determine cellular oxygen consumption rates not due to
oxidative phosphorylation.
Seahorse measurements
SH-SY5Y cells were plated at a density of
8×10⁵ in the Agilent Seahorse XF24 cell culture
micro-plate (Agilent Technologies, Inc.) and incubated overnight at
37°C in 5% CO2. The cells were subsequently incubated at
37°C in 5% CO2 with 1 mM phenformin or vehicle for 0.5–6
h and treated with a range of concentrations of phenformin (0.05–2
mM) for 6 h for the dose response experiment. Subsequently, 30 min
prior to the assay, the media was replaced with 500 µl of XF assay
medium (Seahorse Bioscience; Agilent Technologies GmbH)
supplemented with 17 mM glucose (Sigma Aldrich; Merck KGaA).
Mitochondrial oxygen consumption was obtained by subtracting the
Antimycin A OCR from the basal OCR.
NADH dehydrogenase transfection
As the origin of the Ndi1 gene is from yeast, the
Ndi1 gene was modified to include human codons and therefore,
optimize the expression of the Ndi1 gene in human cells, including
human-derived neuroblastoma SH-SY5Y cells. The Ndi1 construct used
in this study had an altered codon usage profile so that it was
compatible with human codon usage, which differs from yeast. The
optimised sequence was synthesized de novo (Invitrogen;
Thermo Fischer Scientific, Inc.) and cloned into the pAAV-MCS
plasmid (Agilent Technologies GmbH, Waldbronn, Germany) using
Xba1 (catalog no. R0145) and Xho1 (catalog no. R0146)
(both New England BioLabs Inc., Ipswich, MA, USA) restriction
enzymes for 2 h at 37°C. Fragments were isolated on a 1% agarose
gel and ligated together using T4 DNA ligase (Roche Applied
Science) at 18°C overnight. Following transformation into XLI-blue
competent cells (Agilent Technologies GmbH), DNA was isolated
(Qiagen GmbH, Hilden, Germany), and the sequences of the DNA
fragments were verified by sequencing (Eurofins Genomics, GmbH,
Ebersberg, Germany). Ndi1 and control pAAV-MCS vectors (containing
green fluorescent protein) were transfected into SH-SY5Y cells
using the Neon electroporation system (Invitrogen; Thermo Fisher
Scientific, Inc.). Transfection conditions were optimised for
maximum expression of the plasmid. The cells were subsequently
plated at a density of 4×10⁵ cells in the Seahorse
micro-plates, incubated at 37°C in 5% CO2 for 48 h and
treated with a range of concentrations of phenformin (0.1–1 mM) for
6 h.
Digitonin permeabilisation of SH-SY5Y
cells
SH-SY5Y cells were plated at a density of
8×10⁵ in the Seahorse microplates and incubated
overnight at 37°C in 5% CO2. Half of the SH-SY5Y cells
were incubated with 100 µM phenformin for 6 h and 30 min prior to
the assay, the DMEM F12 media was replaced by mitochondrial assay
buffer [220 mM mannitol, 70 mM sucrose, 10 mM
KH2PO4, 5 mM MgCl2, 2 mM
4-(2-hydroxyethyl)-1-piperazineethanesulphonic acid, 1.0 mM EGTA
and 0.2% (w/v) fatty acid-free bovine serum albumin, pH 7.4,
supplemented with 4 mM ADP (Sigma Aldrich; Merck KGaA) and
permeabilized with 10 or 50 µg/ml digitonin (Sigma Aldrich; Merck
KGaA)]. Concentrations of digitonin were previously optimised in
the laboratory. Basal rates were measured according to the
previously described protocol by Divakaruni et al (19), then complex I substrates
(glutamate/malate; 5 mM; Sigma Aldrich; Merck KGaA) and complex II
substrate (succinate (Sigma Aldrich; Merck KGaA), 5 mM) were added
and the increase in OCR was recorded.
Western blot analysis
SH-SY5Y cells were harvested in AMPK Lysis buffer
[50 mM Tris/HCl pH 7.4 at 4°C, 50 mM NaF, 5 mM Na pyrophosphate, 1
mM EDTA, 1 mM EGTA, 250 mM mannitol, 1% (v/v) Triton X-100, 1 mM
dithiothreitol (DTT) and a proteinase inhibitors cocktail tablet],
snap frozen and stored at −20°C until required as previously
performed by Hardie et al (20). For poly(ADP-ribose) polymerase (PARP)
analysis, the cells were suspended in PARP lysis buffer [62.5 mM
Tris (pH 6.8), 6M urea, 2% (w/v) SDS, 10% (v/v) glycerol, 0.00125%
(w/v) bromophenol blue and 50 mM DTT] with the volume amended to
the size of the pellet. The cells were sonicated for 10 min 40 kHz
in a water bath (Sonicator 2000; Branson Ultrasonics Co., Danbury
CT, USA) to ensure complete lysis and boiled at 100°C for 5 min. 5%
(w/v) DTT was added to the samples prior to being loaded in a 10%
SDS-PAGE gel immersed in electrolyte in an electrophoresis
apparatus (BIORAD Mini-Protean; Bio-Rad Laboratories, Inc.,
Hercules, CA, USA). Equal quantities of protein (50 µg) (as
determined by bicinchoninic acid assay, Pierce; Thermo Fisher
Scientific, Inc.) were separated on 6 or 10% SDS-PAGE gels and
transferred to PVDF membranes. The membranes were blocked in 5%
(w/v) Marvel® milk in Tris-buffered saline (TBS)-Tween
for 1 h at room temperature. The membranes were incubated with
primary antibody at 4°C overnight, washed at room temperature and
incubated in horseradish peroxidise conjugated secondary antibody
for 1 h at room temperature and washed again at room temperature.
Western blot analysis was performed using antibodies targeting
AMPKα (1:1,000; catalog no. 2532L), phospho-AMPK (1:714; catalog
no. 2531L), acetyl-coenzyme A carboxylase (ACC) (1:714; catalog no.
3662S), phospho-ACC (1:1,000; catalog no. 3661S; Cell Signalling
Technology, Inc.), γ-tubulin (1:2,000; catalog no. NB110-90616;
Novus Biologicals, Ltd., Cambridge, UK), Ndi1 (custom made; 1:500;
Cambridge Research Biochemicals, Cleveland, UK), β-actin (1:5,000;
catalog no. AB8227), (Abcam, Cambridge, UK) and monoclonal
antibodies to PARP (1:1,000; catalog no. AM30; Merck KGaA) followed
by incubation with horseradish peroxidase (HRP)-conjugated
anti-mouse (1:2,500; catalog no. W4021), anti-rabbit (1:2,500;
catalog no. W4011; Promega Corporation, Madison, IW, USA).
Immobilon Western Chemiluminescence HRP substrate (EMD Millipore)
was used for protein detection. Western blots were normalised to
total AMPK or ACC as a control and densitometry analysis of bands
was performed using ImageJ software (version 1.47v; National
Institutes of Health, Bethesda, MD, USA). The increase in
phosphorylation was presented as the fold change compared with the
control.
Statistical analysis
Unless otherwise stated, data are expressed as the
mean ± standard error of the mean from three separate experiments
performed in triplicate. Statistical analysis was performed using
an unpaired Student's t-test. P<0.05 was considered to indicate
a statistically significant difference.
Results
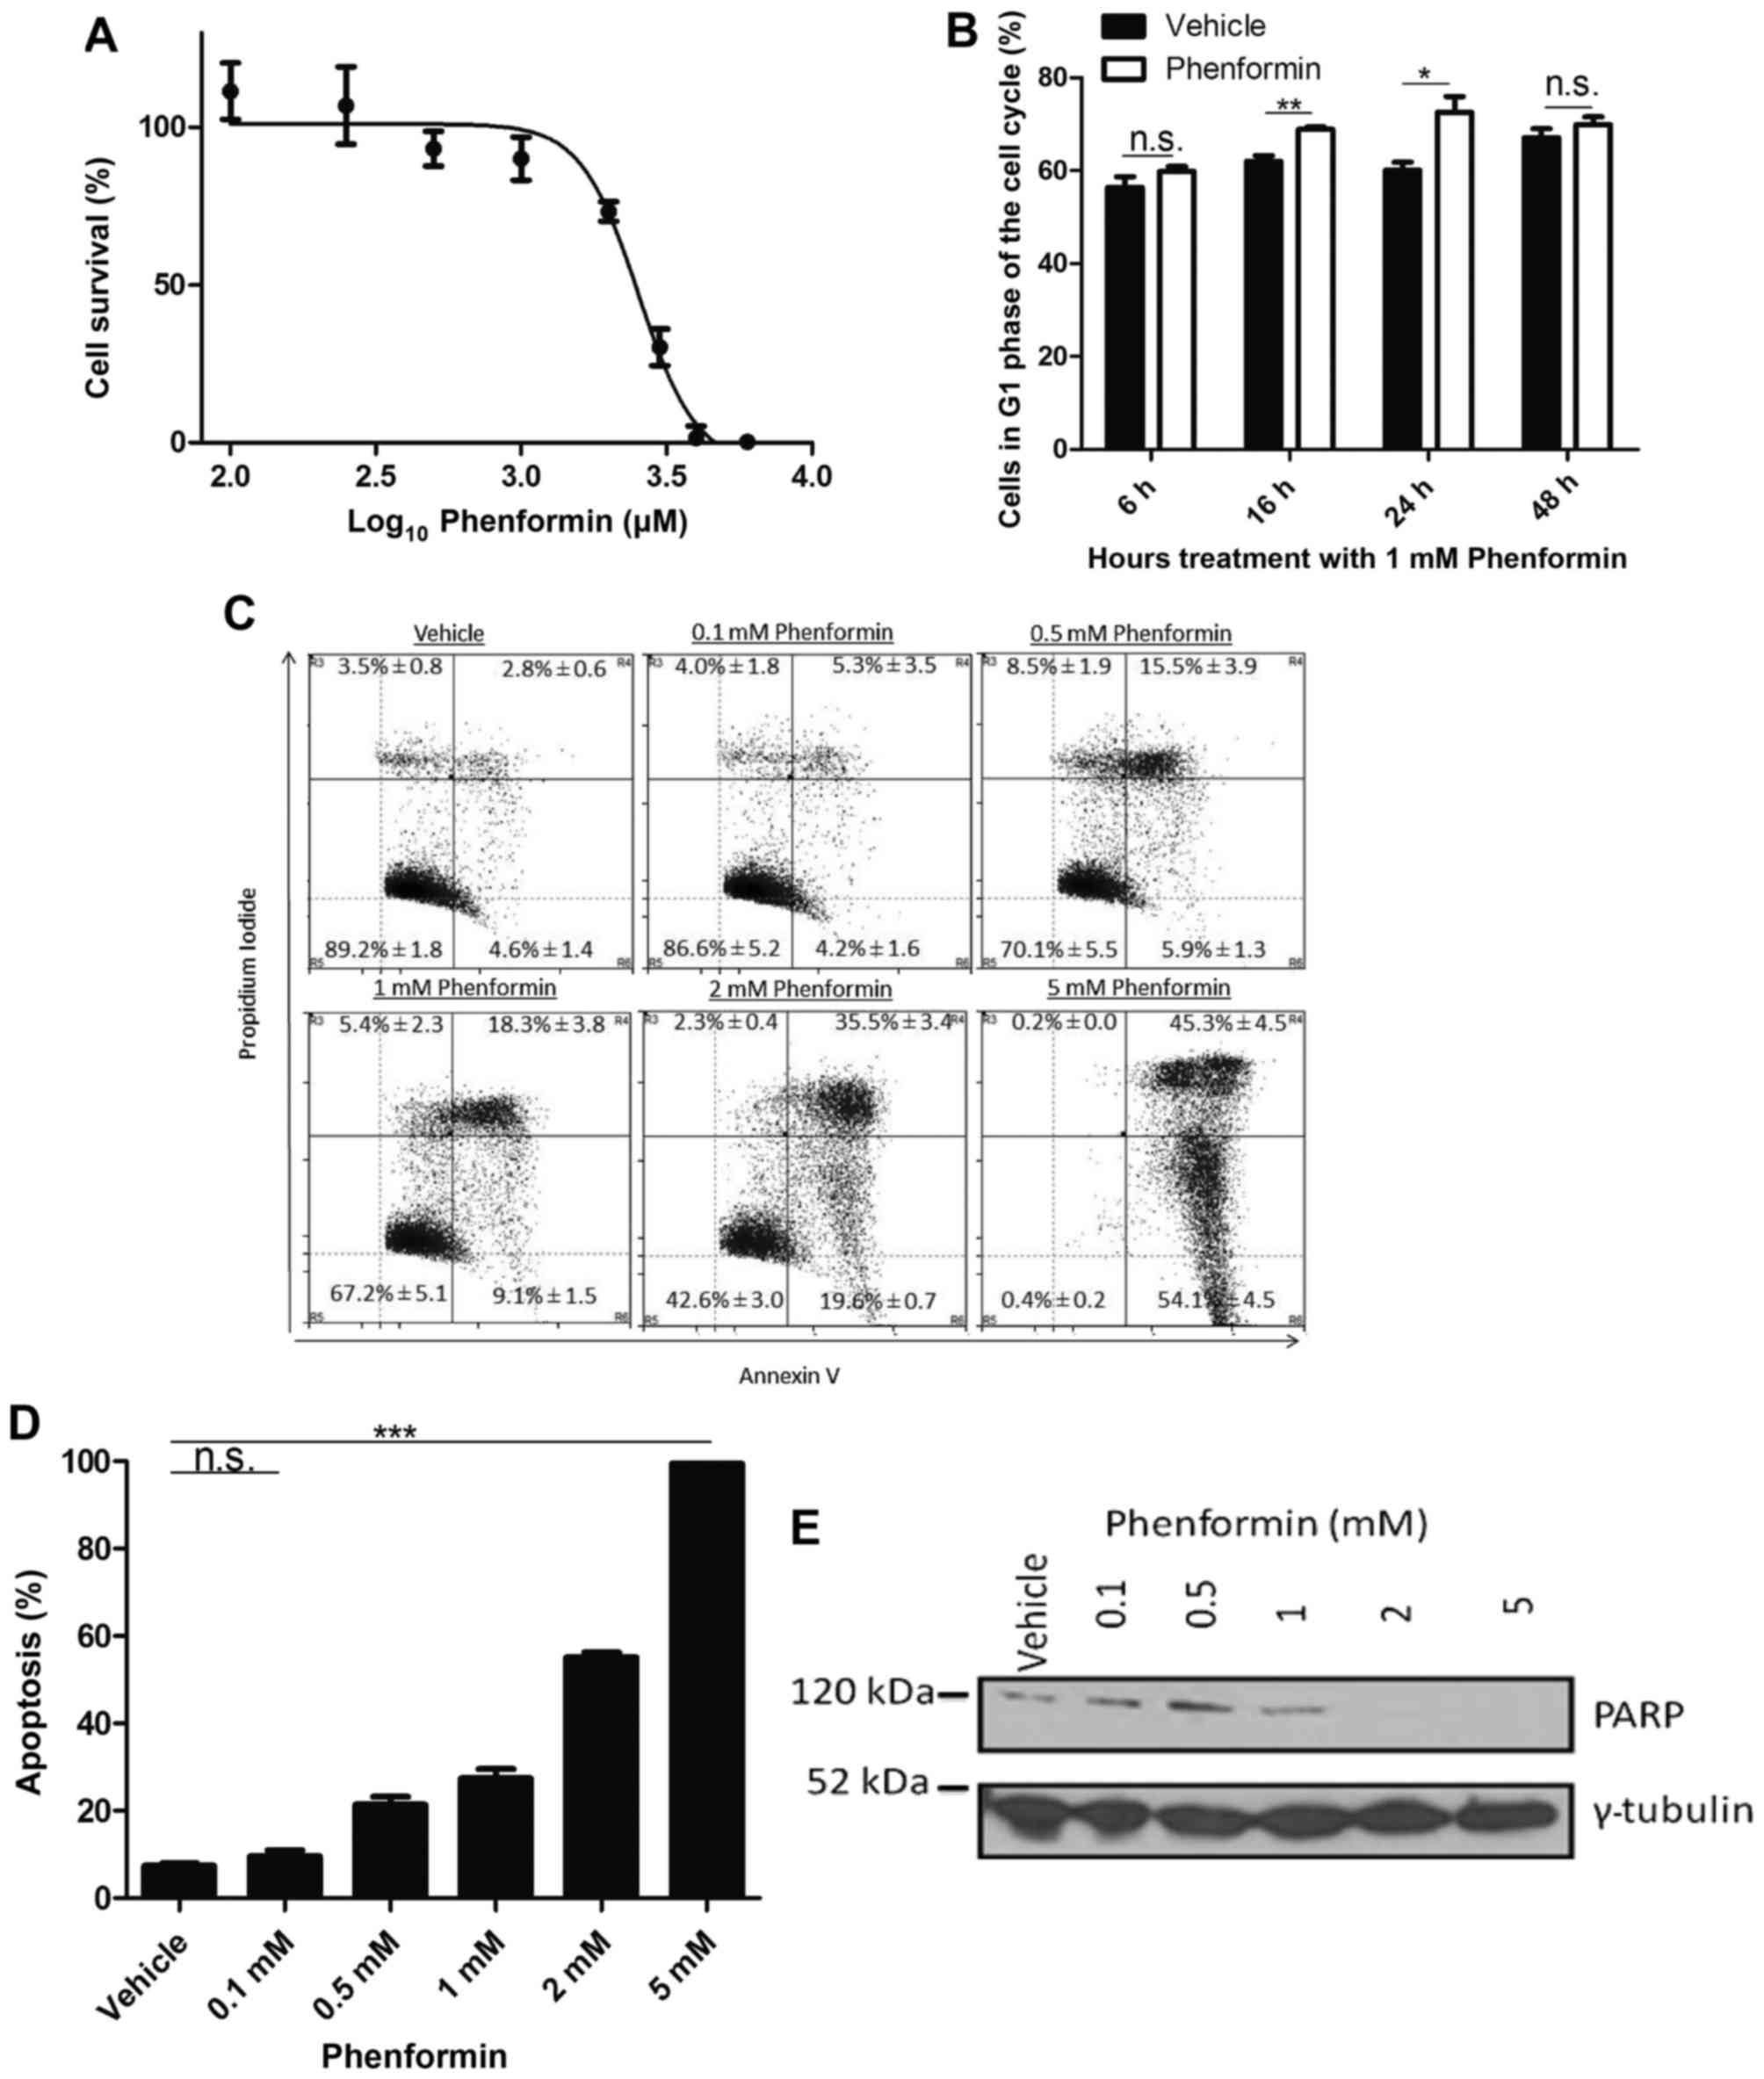
Phenformin reduces the viability of
SH-SY5Y cells in a dose-dependent manner
To evaluate the potency of phenformin on the
neuroblastoma SH-SY5Y cell line, cells were treated with vehicle
(H2O) or with a range of concentrations of phenformin
(0.1–10 mM) for 72 h. As presented in Fig. 1A, phenformin decreased the cell
viability in a dose-dependent manner with maximum cytotoxic effect
at 5 mM. The IC50 value for SH-SY5Y cells treated with
phenformin was 2.76±0.09 mM.
Phenformin induces G1 cell
cycle arrest followed by apoptosis in a dose-dependent manner
A transient increase in the G1 population
relative to the vehicle control was observed at 16 h (P<0.005)
and 24 h (P<0.05; Fig. 1B). This
significant increase indicated that the cells were undergoing
G1 cell cycle arrest as a result of phenformin
treatment. To validate that cell death occurred as a result of
phenformin treatment at the 72 h time point and to determine the
mechanism of cell death, the cells were stained with PI and annexin
V. It was observed that as the percentage of live cells decreased,
there was an increase in the population of cells undergoing
apoptosis as a result of phenformin treatment (Fig. 1C), which demonstrated a significant
difference at the dose of 0.5 mM phenformin compared with the
vehicle (P<0.0001; Fig. 1D). A
reduction was observed in PARP protein with increasing phenformin
concentrations (Fig. 1E). These
results demonstrate that phenformin may be promoting G1
cell cycle arrest prior to the induction of apoptosis.
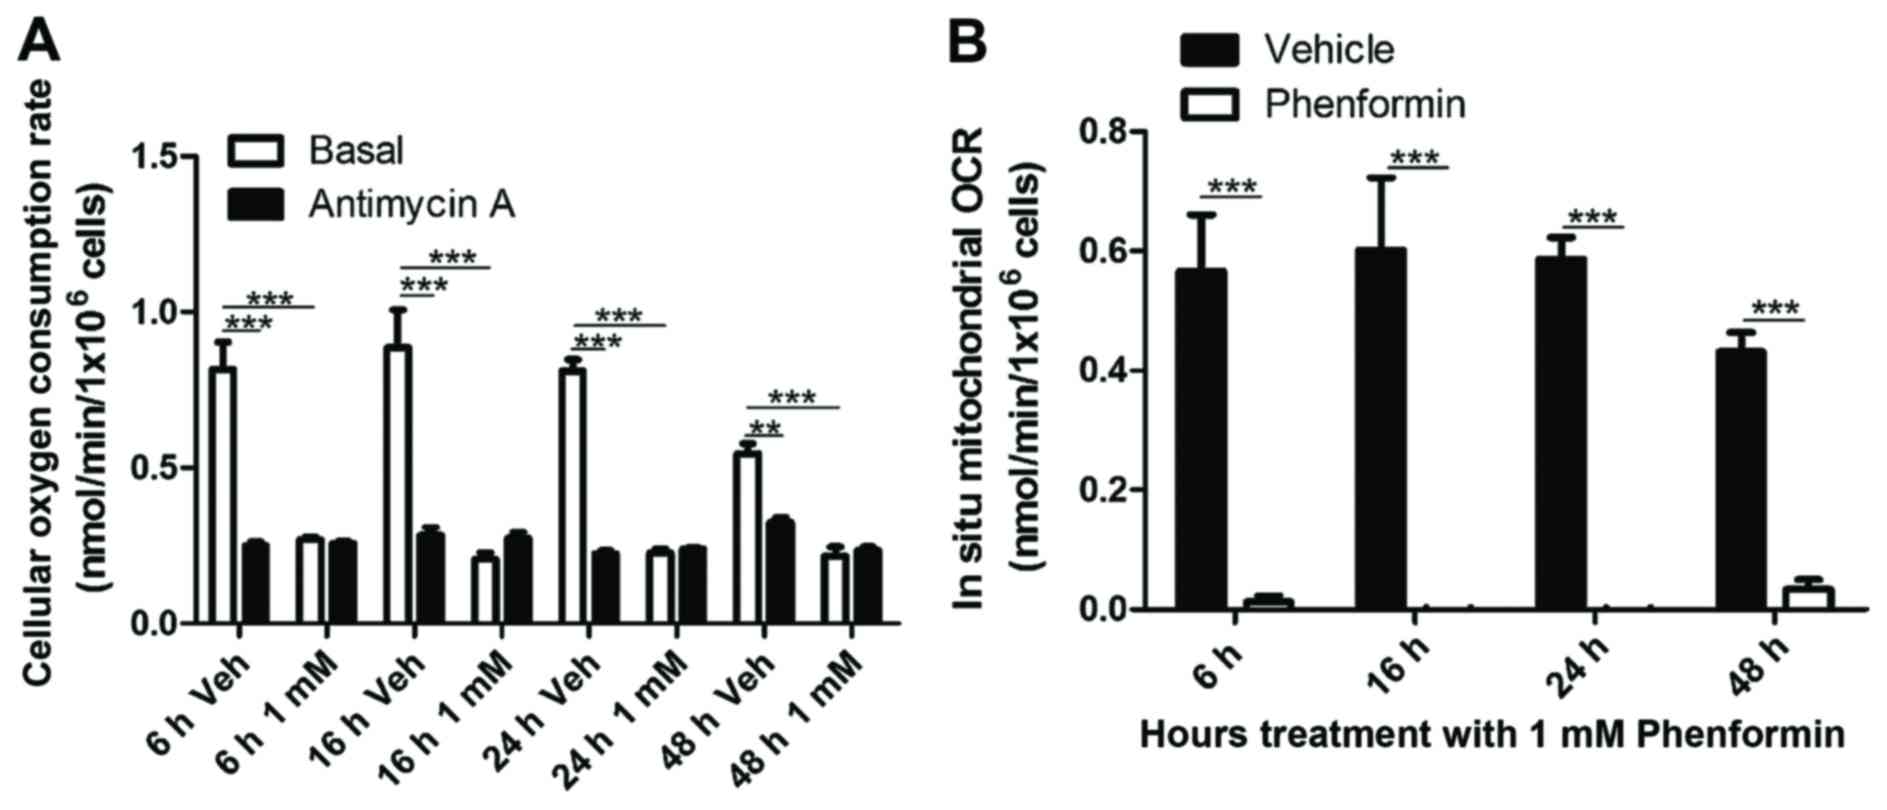
Phenformin inhibits
cellular/mitochondrial oxygen consumption in SH-SY5Y cells
The ability of phenformin to affect the metabolism
of the cells in suspension was examined. As shown in Fig. 2A, there was significant inhibition of
total cellular OCR at 6 h (P<0.0001), 16 h (P<0.005), 24 h
(P<0.0001) and 48 h (P<0.0001) following phenformin (1 mM)
treatment of SH-SY5Y cells. Correcting for non-mitochondrial OCR,
it was found that phenformin demonstrated a complete inhibition of
mitochondrial oxygen consumption at all time points (Fig. 2B).
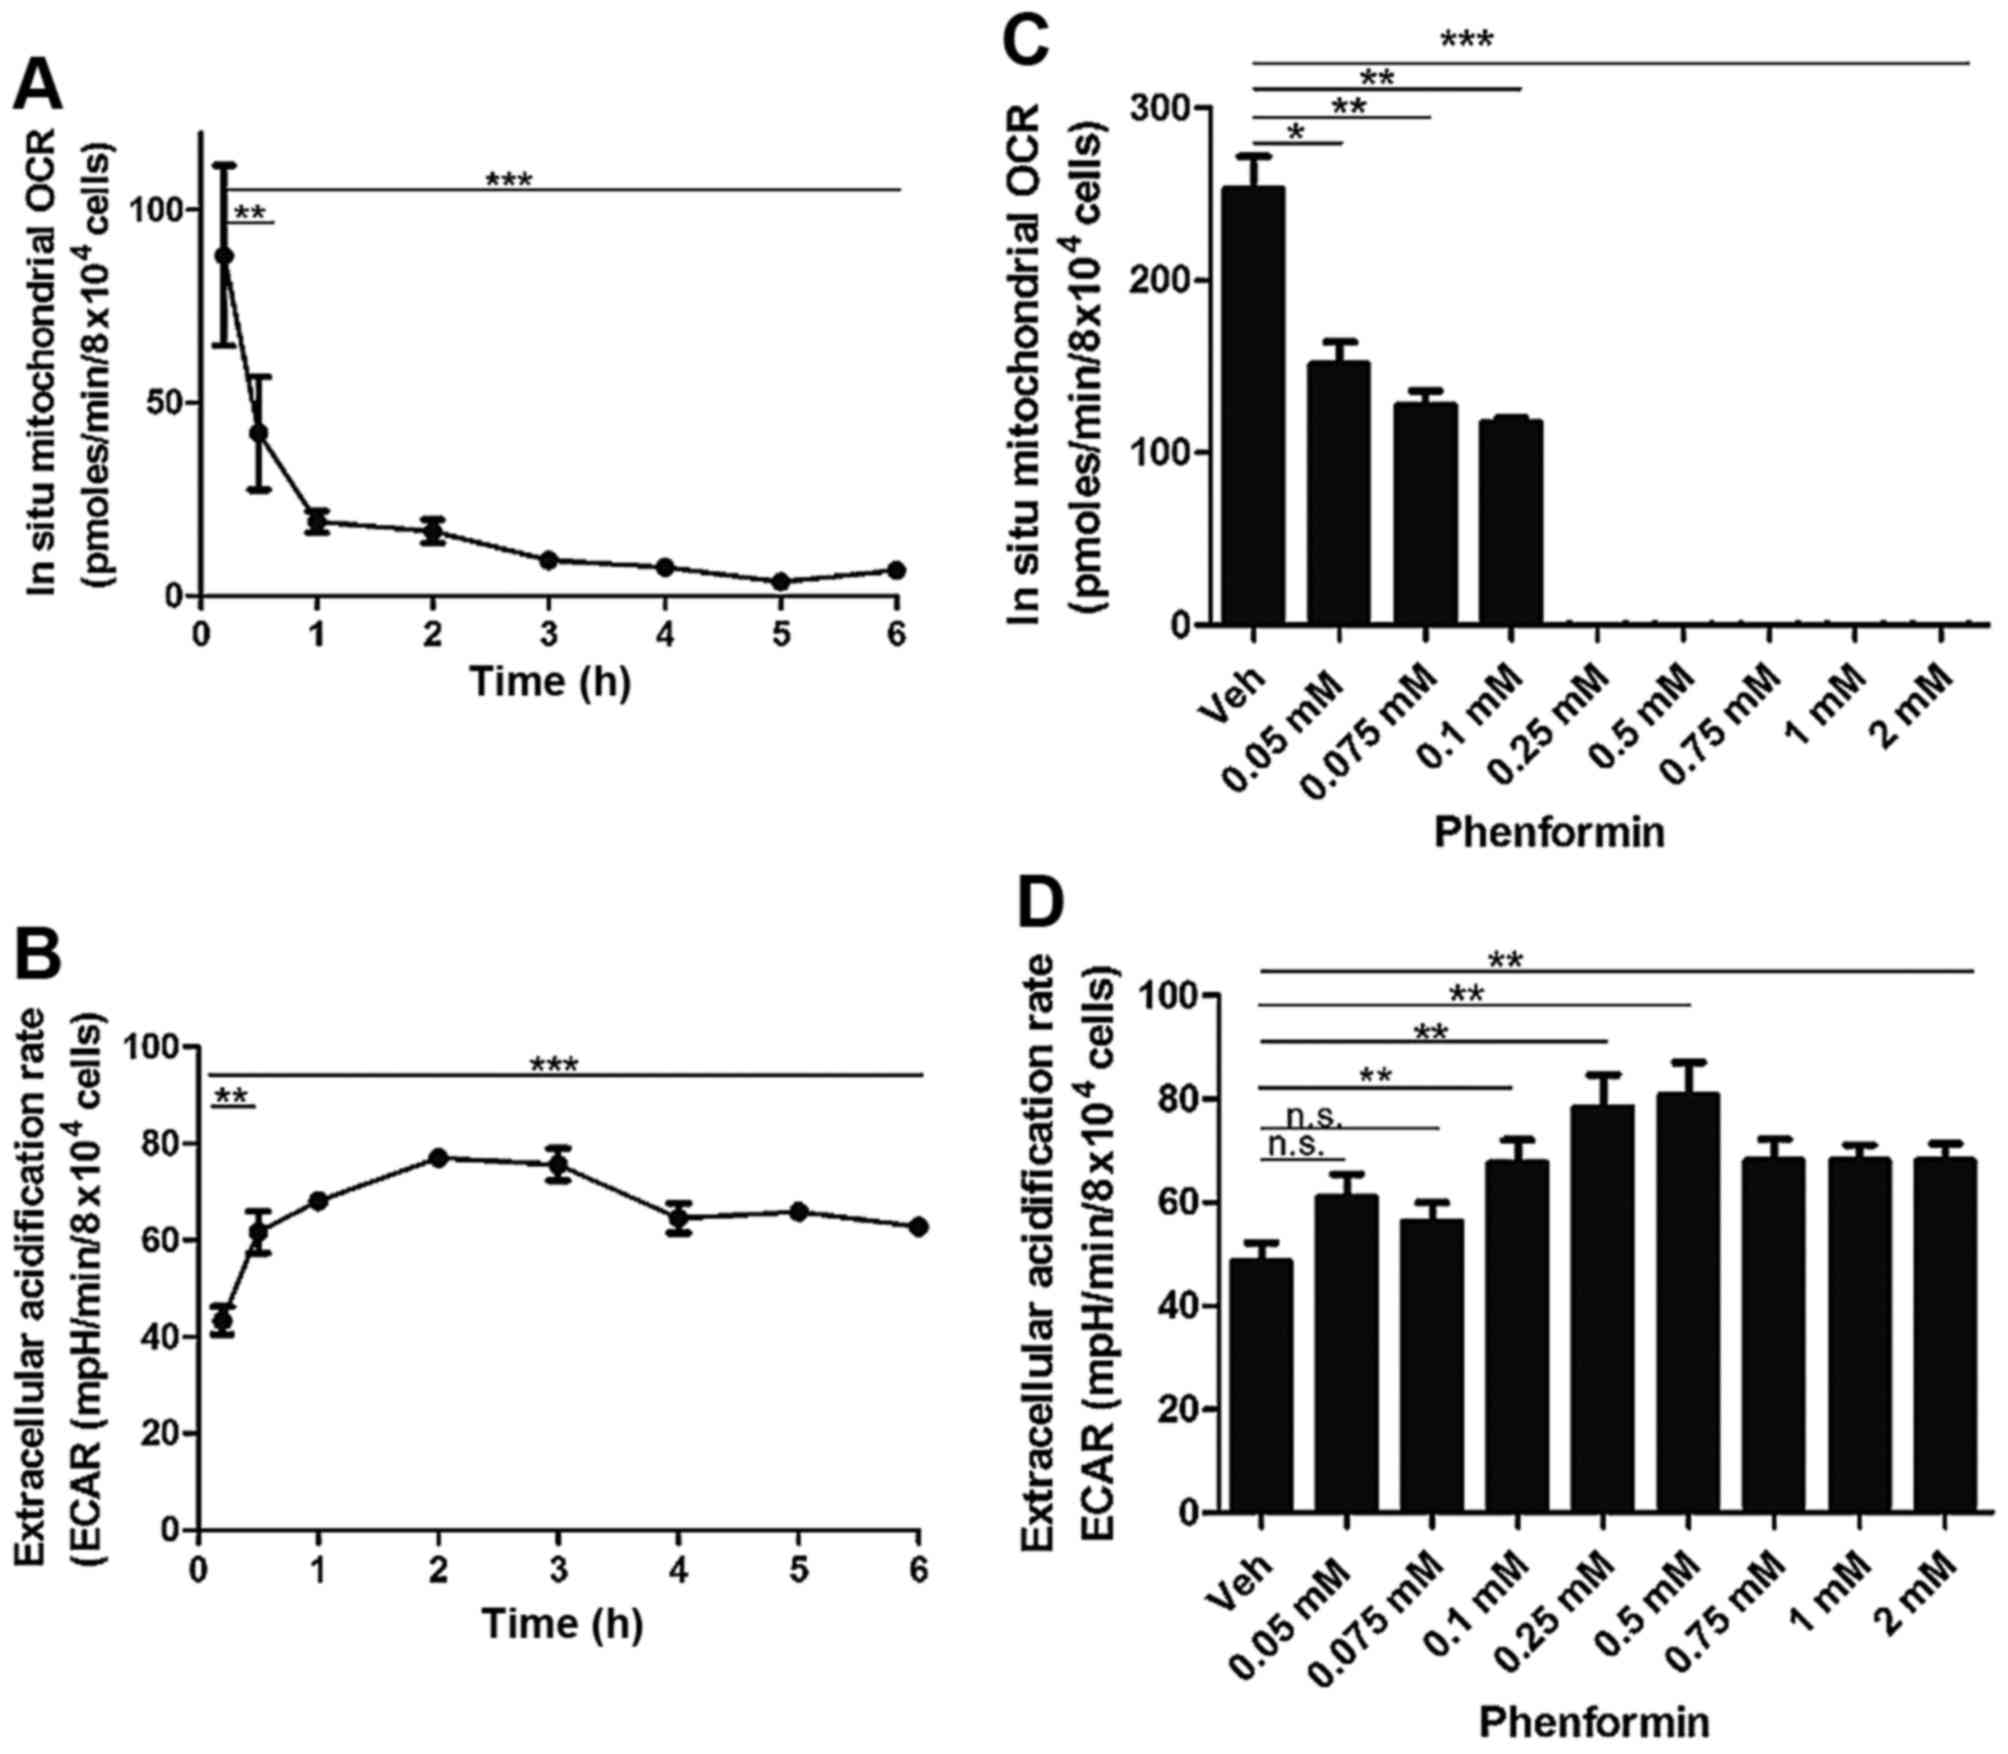
Following the determination that phenformin was
affecting the mitochondrial OCR as early as 6 h, the present study
investigated whether phenformin affected oxygen consumption at
earlier time points. Adherent cells were treated with 1 mM
phenformin and the OCR was measured using a Seahorse Flux Analyser
with correction using non-mitochondrial OCR.
There was a significant decrease in mitochondrial
OCR from 30 min (P<0.005) with a time-dependent decrease
continuing until 6 h of incubation (P<0.0001) following
treatment with 1 mM phenformin (Fig.
3A). Concordant with this decrease in cellular OCR, there was a
significant increase in the extracellular acidification rate (ECAR)
from as early as 30 min. This increase in ECAR remained
statistically significant up to the 6 h timepoint (P<0.0001)
(Fig. 3B).
At a concentration of 0.05 mM phenformin (P<0.05)
there was a significant reduction in the in situ
mitochondrial OCR and at a concentration of 0.25 mM phenformin
(P<0.0005) exhibited complete inhibition of mitochondrial OCR
(Fig. 3C). There was a significant
increase in the ECAR at 0.1 mM phenformin (P<0.005), which
persisted up to 1 mM phenformin (P<0.005) (Fig. 3D). The current study also demonstrated
that phenformin decreases intracellular reactive oxygen-containing
species production in a concentration-dependent manner (data not
shown).
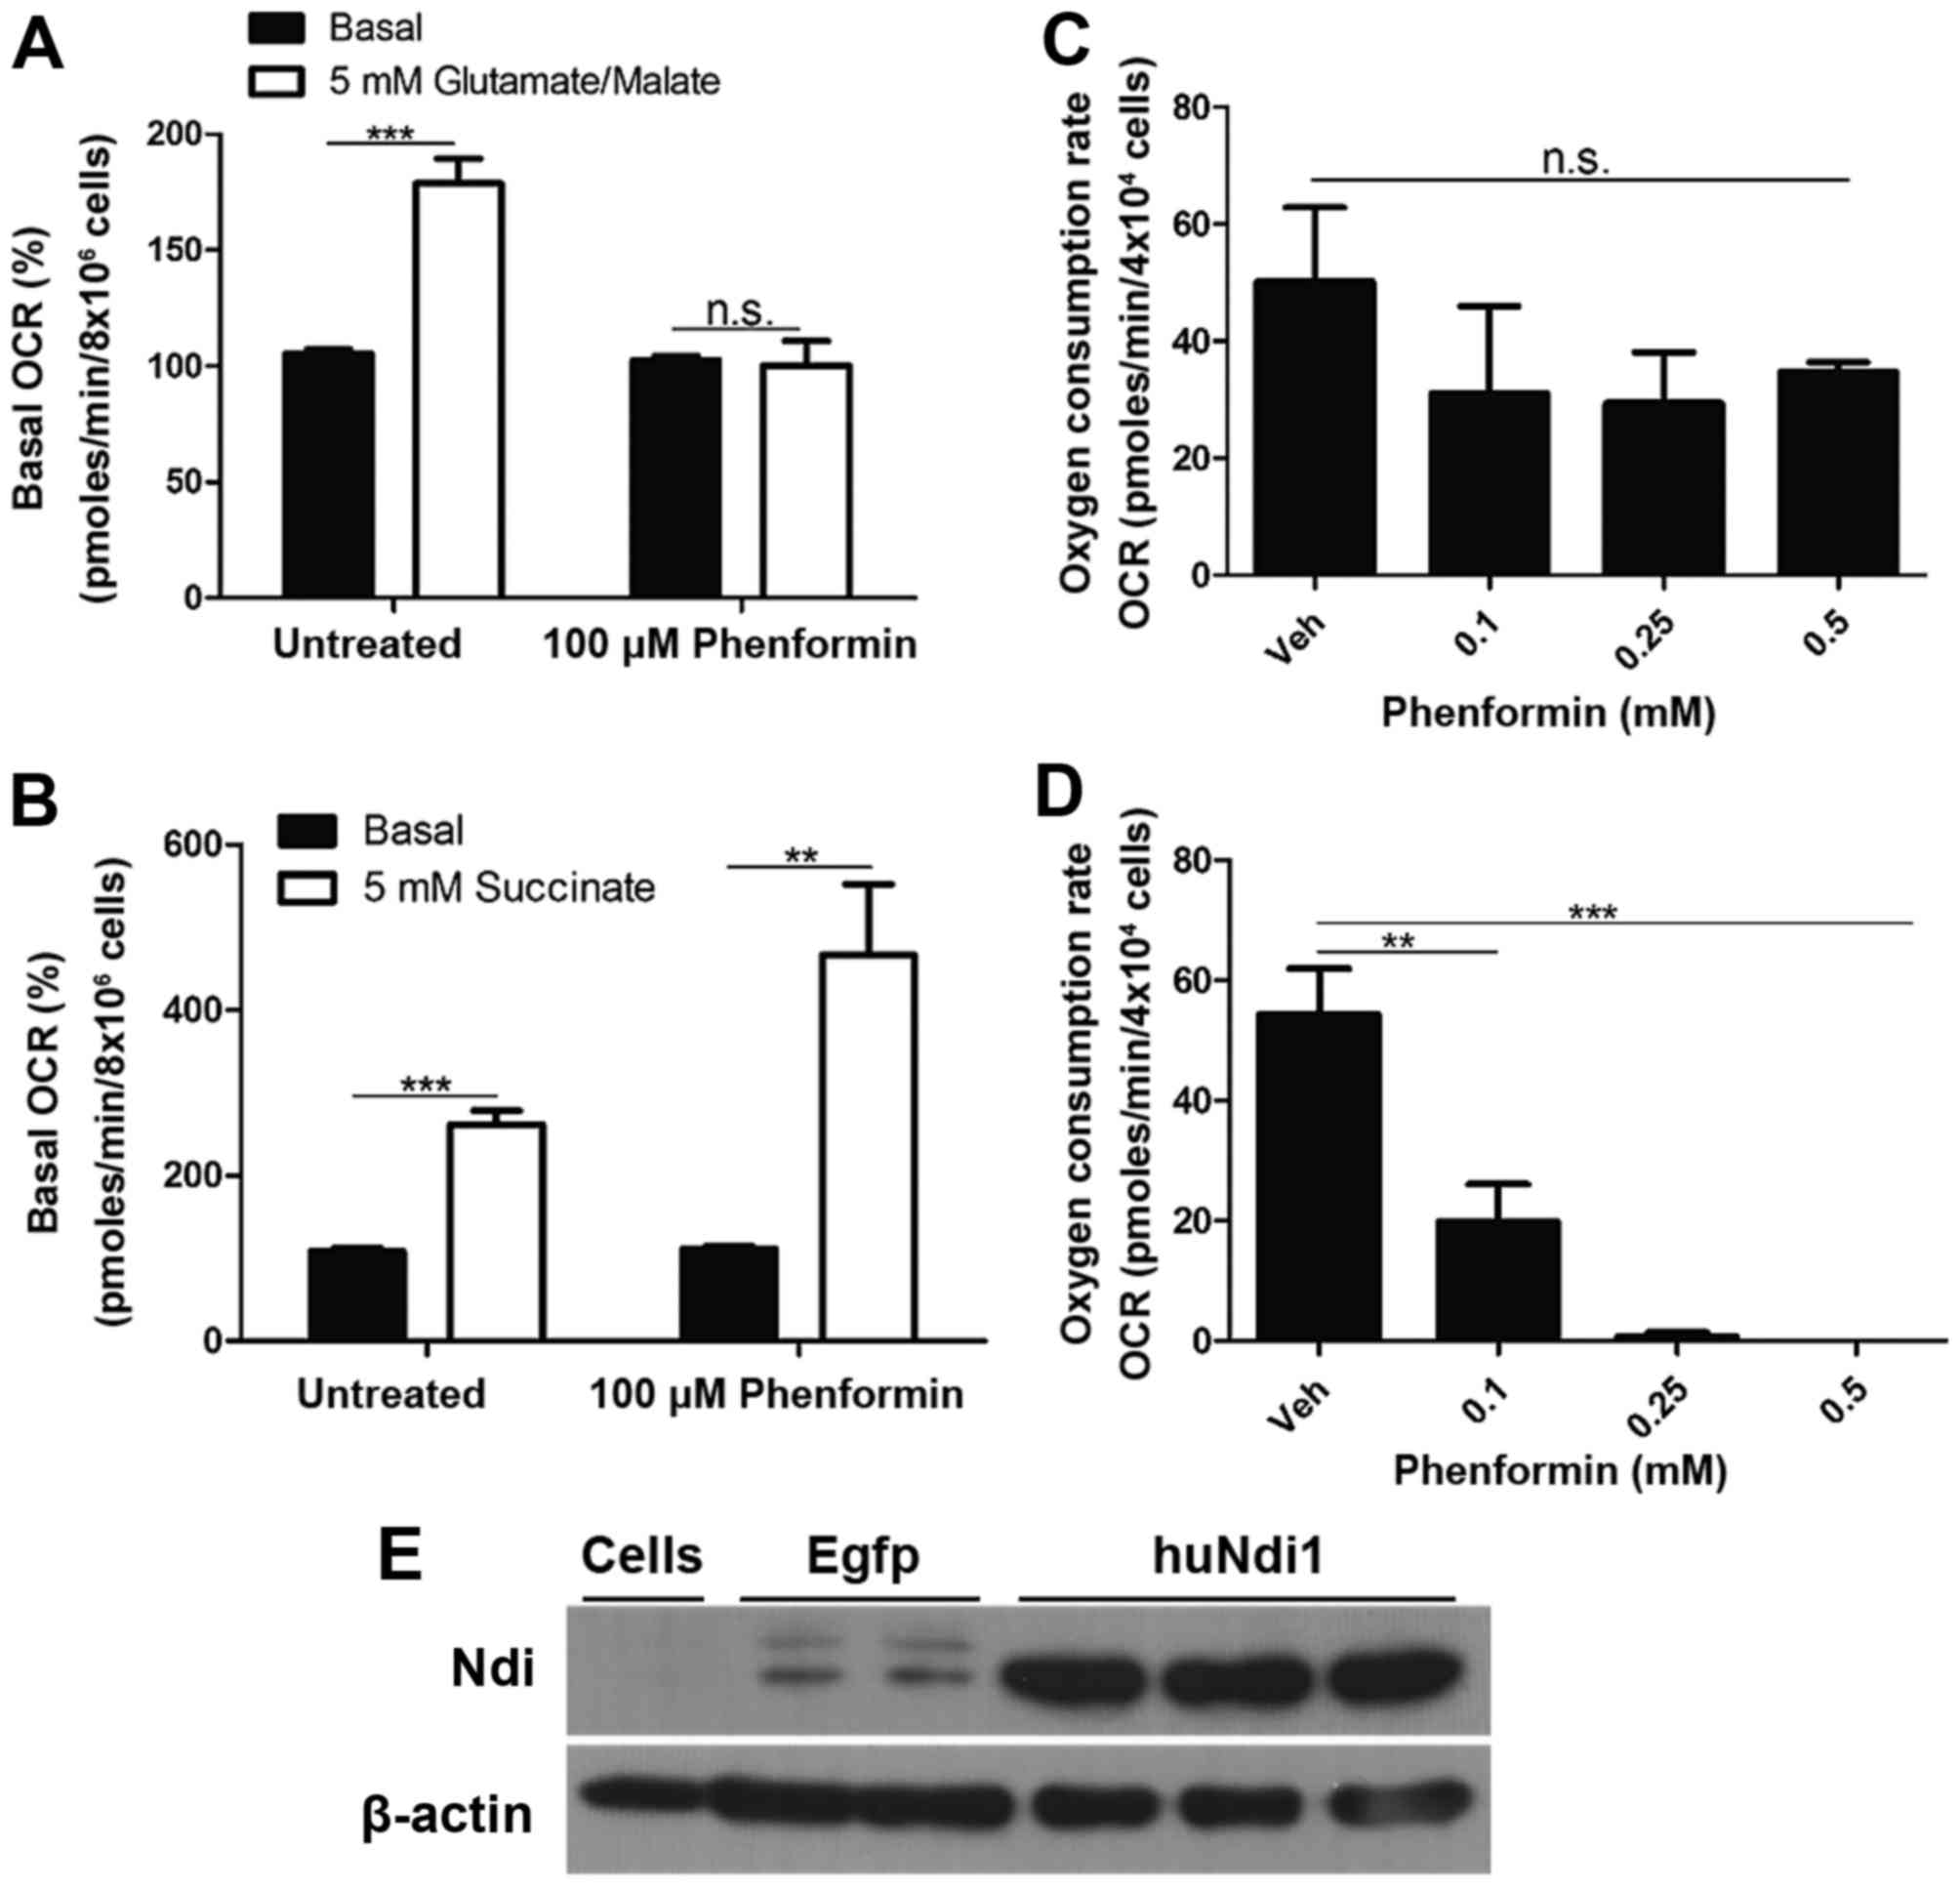
Inhibition of mitochondrial complex I
of SH-SY5Y cells by phenformin
To determine whether the inhibition of mitochondrial
OCR by phenformin was a result of the inhibition of complex I,
mitochondrial OCR was measured in digitonin permeabilized SH-SY5Y
cells. In the presence of ADP and complex I substrates
(glutamate/malate), phenformin demonstrated a complete inhibition
of any increase in oxygen consumption as a result of the addition
of glutamate and malate (Fig. 4A).
However, phenformin did not inhibit the increase in mitochondrial
OCR in digitonin-permeabilised SH-SY5Y cells following the addition
of succinate, a complex II substrate (Fig. 4B). These experiments identified that
phenformin inhibits mitochondrial OCR via complex I, but not
complex II. Further evidence that the inhibition of in situ
mitochondrial oxygen consumption by phenformin occurs at complex I
was demonstrated by recovery experiments in which the inhibition at
complex I is circumvented by transfection with Ndi1. SH-SY5Y cells
treated with a number of concentrations of phenformin (0.1–0.5 mM)
and were transiently transfected with an empty vector or a version
of the yeast Ndi1 gene optimized for expression in human cells.
Ndi1 is a single subunit of the NADH dehydrogenase, that oxidizes
NADH in a similar process present in mammalian complex I, without
proton pumping or ROS generation (21). The expression of Ndi1 conferred
resistance to the inhibitory effects of phenformin (Fig. 4C) compared with cells transfected with
an empty vector (Fig. 4D). The
confirmation of Ndi1 protein expression was demonstrated using an
immunoblot (Fig. 4E).
AMPK and ACC activation in SH-SY5Y
cells occurs as a result of treatment with phenformin over a time
course determined using western blot analysis
Following the demonstration that phenformin inhibits
complex I of the mitochondria, it was hypothesized that there would
be an increase in AMP and ADP levels, therefore activating AMPK,
the major energy sensor of the cell. In addition, the current study
investigated ACC, which is a downstream enzyme phosphorylated by
AMPK as a further indication of AMPK activation.
Activation (via phosphorylation) of AMPK in SH-SY5Y
cells occurred as a result of phenformin treatment compared with
the vehicle-treated controls (Fig. 5A and
B). The inhibition (via AMPK phosphorylation) of ACC also
occurs as a result of phenformin treatment compared with the
vehicle-treated controls and this is significantly different after
2 h of phenformin treatment (P<0.05) (Fig. 5C and D). The positive control
2-deoxyglucose increased the phosphorylation of AMPK and ACC as
expected.
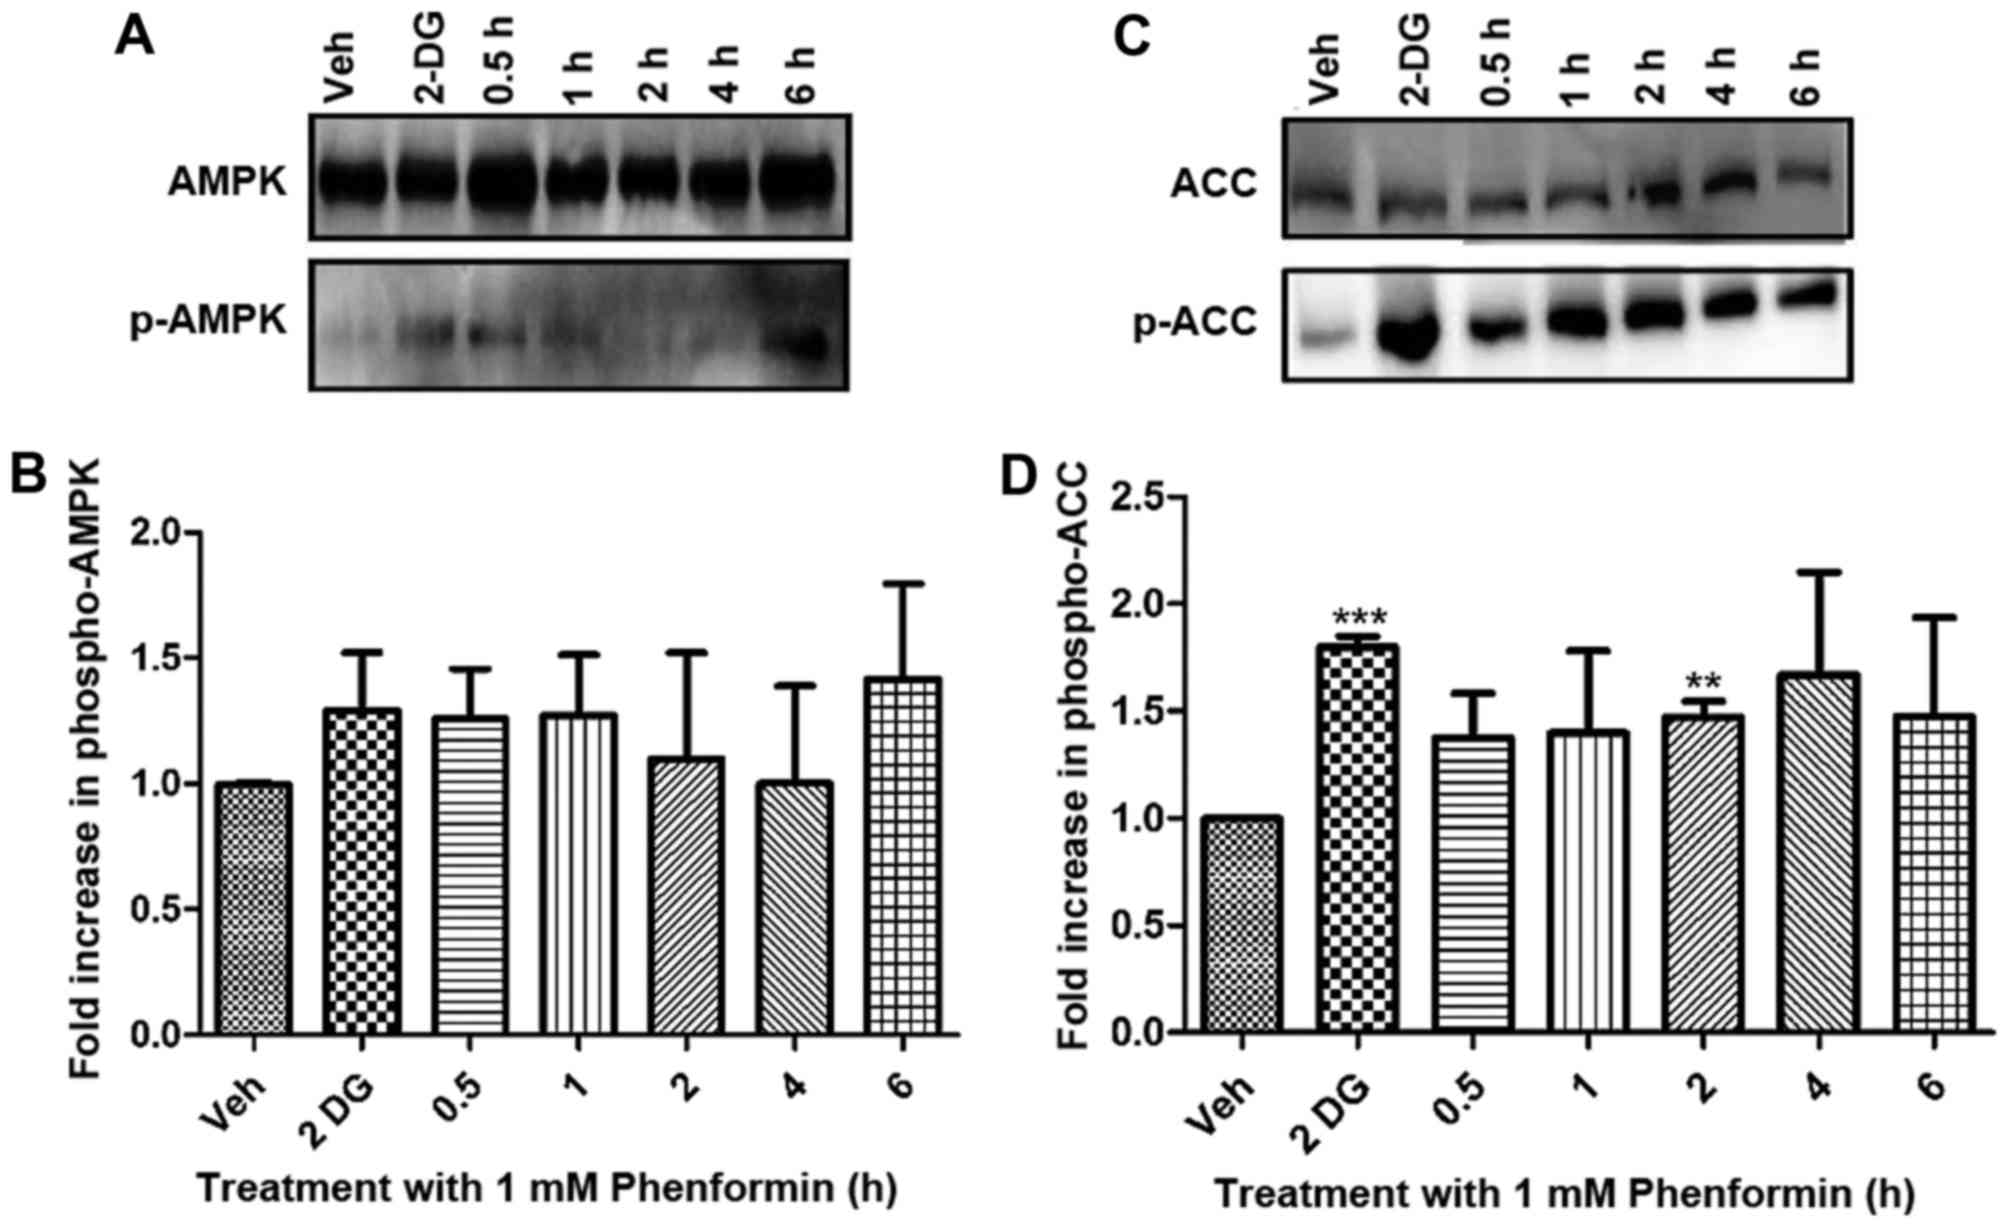 | Figure 5.Phenformin treatment-dependent
phosphorylation of AMPK and ACC as determined by immunoblot
analysis. Whole cell lysates (50 µg protein) were prepared from
confluent cultures of SH-SY5Y cells and separated by SDS-PAGE gels
and transferred to a polyvinylidene fluoride membranes. (A)
Representative blot of AMPK activation. (B) Fold increase in p-AMPK
relative to vehicle, normalised against loading control for AMPK.
(C) Representative blot of the phosphorylation of ACC. (D) Fold
increase in p-ACC relative to vehicle, normalised against loading
control ACC. Data is represented as the mean ± standard error.
*P<0.05, **P<0.001, ***P<0.0001. AMPK, adenosine
monophosphate-activated protein kinase; p-AMPK, phosphorylation of
adenosine monophosphate-activated protein kinase; ACC, acetyl-CoA
carboxylase; p-ACC, phosphorylation of acetyl-CoA carboxylase;
2-DG, 2-deoxyglucose; Veh, vehicle. |
Discussion
Neuroblastoma is a paediatric malignancy that
affects the sympathetic nervous system. Patients are initially
responsive to treatment, including etoposide, carboplatin,
vincristine and doxorubicin, but become refractory (22,23) due to
development of multi-drug resistance (24). Resistance may develop as a result of
numerous underlying mechanisms, such as loss of p53, amplification
of the MYCN oncogene and increased expression of drug efflux pumps
(25). There is a requirement for
alternative treatments for these resistant forms of
neuroblastoma.
Phenformin, a former type II diabetic drug, has
demonstrated significant anti-neoplastic activity in humans and
animals (7,10,17) at
lower concentrations compared with its analogue metformin. Lactic
acidosis, a phenformin-associated adverse effect, is insufficient
to be considered as contraindicative as a cancer therapy due to the
marked anti-neoplastic activity demonstrated by phenformin
treatment (26,27). Phenformin is less polar compared with
metformin and therefore, has increased lipid solubility (28). Phenformin is able to permeate across
biological membranes and has been identified to have a higher
affinity for mitochondrial membranes compared with metformin
(29). The molecular mechanisms
underlying the antitumor effects of phenformin (and metformin)
remain to be elucidated. It has been hypothesized that the
anti-cancer effect of metformin may be as a result of pleiotrophic
effects via insulin and insulin growth factors (28). The focus of this study was to
determine whether phenformin directly promotes death of SH-SY5Y
cancer cells and if so, to determine the underlying mechanism of
this action.
The current study determined the effect of
phenformin on the viability of the neuroblastoma SH-SY5Y cells. The
IC50 for phenformin was identified to be in a similar
range to that of SKOV3 and HEY ovarian cells (30), Sk-Mel-28 and WM115 melanoma cells
(31) and MCF-7 and MDA-MB-231 breast
cells (32). In the present study,
metformin did not reduce the viability of the neuroblastoma SH-SY5Y
cells to a level <50%, and thus, an IC50 value was
not obtained (results not shown). Similar results for metformin
were observed by Caraci et al (10) in the same cell line. Caraci et
al (10) also demonstrated a
lower IC50 value (500 µM) following phenformin treatment
of SH-SY5Y cells compared with the results of the present study
(2.76±0.09 mM). This differential may be as result of
methodological variation, such as the use of scraping to detach
cells and the use of the MTT assay to determine viability in Caraci
et al (10), compared with the
use of trypsin to harvest cells and the Alamar blue assay to
evaluate cell viability in the present study. Reassuringly,
however, this previous study is concordant with the present finding
that phenformin is capable of directly affecting neuroblastoma
cells by inducing cell death.
Phenformin has been identified to transiently
increase the expression of the cell cycle inhibitor p21 and to
cause G1 and G2/M arrest in a cell
type-specific manner (10,30). The current study has demonstrated that
phenformin causes an accumulation of cells in the G1
phase of the cell cycle prior to inducing cell death. By contrast,
Caraci et al (10)
demonstrated that phenformin caused G2/M arrest in
SH-SY5Y cells and this discrepancy may be as a result of
methodological variation, such as their use of scraping to detach
cells compared with the use of trypsin to detach cells or
differences in cell storage prior to FACS analysis (4°C vs. −20°C)
and sample preparation prior to FACS analysis (pre-incubated
samples with RNase A for 1 h prior to adding PI compared with
treating with RNase A and PI, simultaneously).
Investigation into the underlying mechanism of cell
death induced by phenformin treatment of the SH-SY5Y cells
exhibited a substantial increase in the apoptotic population of
cells. These results are in accordance with previous studies that
have demonstrated phenformin to promote apoptosis in A549 non-small
cell lung cancer cells, MC7 and MDA-MD-231 breast cancer cells and
PTEN-deficient tumors (7,8,33).
The current study also demonstrated that phenformin
significantly inhibits in situ mitochondrial oxygen
consumption at subcytotoxic micromolar concentrations as well as
increasing glycolytic flux in a dose- and time-dependent manner in
neuroblastoma cells. These data are concordant with the
observations of Owen et al (14) who demonstrated the potent inhibition
of mitochondrial oxygen consumption by phenformin in a micromolar
range in hepatoma cells. This previous study suggested that the
positive charge of phenformin allows it to accumulate within the
matrix of mitochondria as a result of the membrane potential
(34,35). El-Mir et al (13) also demonstrated a time-dependent
effect of phenformin on oxygen consumption in hepatocytes. Taken
together, these data suggest that the underlying mechanism of
action of phenformin may be at the level of mitochondrial
function.
Additionally, the current study found that
phenformin inhibited complex I substrates, but not complex II
substrates, through the promotion of mitochondrial OCR in
permeabilized SH-SY5Y neuroblastoma cells. Furthermore, the
expression of ‘humanized’ yeast Ndi1 protected the
non-permeabilised SH-SY5Y cells from the inhibitory effects of
phenformin on mitochondrial OCR. Therefore, phenformin appears to
inhibit complex I. The results of the present study are in
accordance with previous studies that have suggested that
phenformin has antitumor effects via the inhibition of complex I in
cancer cell lines (9,17).
As phenformin inhibits complex I, the present study
aimed to determine whether AMPK was activated. A previous study
suggested that phenformin does not act directly on AMPK but
indirectly through increasing intracellular AMP and ADP
concentrations (36). These findings
are in agreement with the observation that phenformin does not
activate AMPK in cells that have a mutation in AMPK that effects
AMP and ADP sensitivity (20).
Whether phenformin is required to activate AMPK to affect the cells
proliferative or survival capacity has yet to be elucidated. Huang
et al (7) identified that AMPK
activation was important in decreasing the occurrence of
PTEN-deficient tumors following phenformin treatment, whereas
Shackelford et al (33) found
that phenformin was effective in the treatment of LKB1-deficient
non-small cell lung cancer, as LKB1 is the major upstream kinase
activating AMPK. In the present study, the activation of AMPK and
inhibition of ACC, a downstream target of AMPK, occurs as a result
of phenformin treatment.
In conclusion, phenformin is effective in reducing
the cell viability of the human-derived neuroblastoma SH-SY5Y
cancer cells through the promotion of G1 cell cycle
arrest and apoptosis. Bioenergetic analysis found that phenformin
significantly decreased mitochondrial oxygen consumption at
sub-cytotoxic concentrations in a dose- and time-dependent manner
via the inhibition of the mitochondrial complex I while
simultaneously increasing glycolytic flux. As a result of this
inhibition by phenformin, AMPK is activated and ACC inhibited.
Therefore, phenformin may have potential as an effective
anti-cancer agent.
Acknowledgements
RKP and FG would like to thank the Higher Education
Authority PRTLI5 scheme (grant no. 12259) for funding the project.
GJF and NC wish to acknowledge Science Foundation Ireland (SFI)
(grant no. 11/PI/1080) for the funding of their work.
References
|
1
|
Galenkamp K, Carriba P, Urresti J,
Planells-Ferrer L, Coccia E, Lopez-Soriano J, Barneda-Zahonero B,
Moubarak RS, Segura MF and Comella JX: TNFα sensitizes
neuroblastoma cells to FasL-, cisplatin- and etoposide-induced cell
death by NF-κB-mediated expression of Fas. Mol Cancer. 14:622015.
View Article : Google Scholar : PubMed/NCBI
|
|
2
|
Amoroso F, Capece M, Rotondo A, Cangelosi
D, Ferracin M, Franceschini A, Raffaghello L, Pistoia V, Varesio L
and Adinolfi E: The P2X7 receptor is a key modulator of the
PI3K/GSK3β/VEGF signaling network: Evidence in experimental
neuroblastoma. Oncogene. 34:5240–5251. 2015. View Article : Google Scholar : PubMed/NCBI
|
|
3
|
Cheung NK and Dyer MA: Neuroblastoma:
Developmental biology, cancer genomics and immunotherapy. Nat Rev
Cancer. 13:397–411. 2013. View
Article : Google Scholar : PubMed/NCBI
|
|
4
|
Dowling RJ, Goodwin PJ and Stambolic V:
Understanding the benefit of metformin use in cancer treatment. BMC
Med. 9:332011. View Article : Google Scholar : PubMed/NCBI
|
|
5
|
Evans JM, Donnelly LA, Emslie-Smith AM,
Alessi DR and Morris AD: Metformin and reduced risk of cancer in
diabetic patients. BMJ. 330:1304–1305. 2005. View Article : Google Scholar : PubMed/NCBI
|
|
6
|
Kwong SC and Brubacher J: Phenformin and
lactic acidosis: A case report and review. J Emerg Med. 16:881–886.
1998. View Article : Google Scholar : PubMed/NCBI
|
|
7
|
Huang X, Wullschleger S, Shapiro N,
McGuire VA, Sakamoto K, Woods YL, McBurnie W, Fleming S and Alessi
DR: Important role of the LKB1-AMPK pathway in suppressing
tumorigenesis in PTEN-deficient mice. Biochem J. 412:211–221. 2008.
View Article : Google Scholar : PubMed/NCBI
|
|
8
|
Appleyard MV, Murray KE, Coates PJ,
Wullschleger S, Bray SE, Kernohan NM, Fleming S, Alessi DR and
Thompson AM: Phenformin as prophylaxis and therapy in breast cancer
xenografts. Br J Cancer. 106:1117–1122. 2012. View Article : Google Scholar : PubMed/NCBI
|
|
9
|
Wheaton WW, Weinberg SE, Hamanaka RB,
Soberanes S, Sullivan LB, Anso E, Glasauer A, Dufour E, Mutlu GM,
Budigner GS and Chandel NS: Metformin inhibits mitochondrial
complex I of cancer cells to reduce tumorigenesis. Elife.
3:e022422014. View Article : Google Scholar : PubMed/NCBI
|
|
10
|
Caraci F, Chisari M, Frasca G, Chiechio S,
Salomone S, Pinto A, Sortino MA and Bianchi A: Effects of
phenformin on the proliferation of human tumor cell lines. Life
Sci. 74:643–650. 2003. View Article : Google Scholar : PubMed/NCBI
|
|
11
|
Martin M and Marais R: Metformin: A
diabetes drug for cancer, or a cancer drug for diabetics? J Clin
Oncol. 30:2698–2700. 2012. View Article : Google Scholar : PubMed/NCBI
|
|
12
|
Carling D: The AMP-activated protein
kinase cascade-a unifying system for energy control. Trends Biochem
Sci. 29:18–24. 2004. View Article : Google Scholar : PubMed/NCBI
|
|
13
|
El-Mir MY, Nogueira V, Fontaine E, Avéret
N, Rigoulet M and Leverve X: Dimethylbiguanide inhibits cell
respiration via an indirect effect targeted on the respiratory
chain complex I. J Biol Chem. 275:223–228. 2000. View Article : Google Scholar : PubMed/NCBI
|
|
14
|
Owen MR, Doran E and Halestrap AP:
Evidence that metformin exerts its anti-diabetic effects through
inhibition of complex 1 of the mitochondrial respiratory chain.
Biochem J 348 Pt. 3:607–614. 2000. View Article : Google Scholar
|
|
15
|
Miskimins WK, Ahn HJ, Kim JY, Ryu S, Jung
YS and Choi JY: Synergistic anti-cancer effect of phenformin and
oxamate. PLoS ONE. 9:e855762014. View Article : Google Scholar : PubMed/NCBI
|
|
16
|
Bailey CJ and Turner RC: Metformin. N Engl
J Med. 334:574–579. 1996. View Article : Google Scholar : PubMed/NCBI
|
|
17
|
Birsoy K, Possemato R, Lorbeer FK,
Bayraktar EC, Thiru P, Yucel B, Wang T, Chen WW, Clish CB and
Sabatini DM: Metabolic determinants of cancer cell sensitivity to
glucose limitation and biguanides. Nature. 508:108–112. 2014.
View Article : Google Scholar : PubMed/NCBI
|
|
18
|
Zhang X, Wang H, Zhang S, Song J, Zhang Y,
Wei X and Feng Z: MiR-134 functions as a regulator of cell
proliferation, apoptosis, and migration involving lung septation.
In Vitro Cell Dev Biol Anim. 48:131–136. 2012. View Article : Google Scholar : PubMed/NCBI
|
|
19
|
Divakaruni AS, Rogers GW and Murphy AN:
Measuring mitochondrial function in permeabilized cells using the
seahorse XF analyzer or a clark-type oxygen electrode. Curr Protoc
Toxicol. 60(25.2): 1–16. 2014.
|
|
20
|
Hardie DG, Salt IP and Davies SP: Analysis
of the role of the AMP-activated protein kinase in the response to
cellular stress. Methods Mol Biol. 99:63–74. 2000.PubMed/NCBI
|
|
21
|
Seo BB, Kitajima-Ihara T, Chan EK,
Scheffler IE, Matsuno-Yagi A and Yagi T: Molecular remedy of
complex I defects: Rotenone-insensitive internal NADH-quinone
oxidoreductase of Saccharomyces cerevisiae mitochondria
restores the NADH oxidase activity of complex I-deficient mammalian
cells. Proc Natl Acad Sci USA. 95:9167–9171. 1998. View Article : Google Scholar : PubMed/NCBI
|
|
22
|
Seeger RC and Reynolds CP: Treatment of
high-risk solid tumors of childhood with intensive therapy and
autologous bone marrow transplantation. Pediatr Clin North Am.
38:393–424. 1991. View Article : Google Scholar : PubMed/NCBI
|
|
23
|
Keshelava N, Seeger RC, Groshen S and
Reynolds CP: Drug resistance patterns of human neuroblastoma cell
lines derived from patients at different phases of therapy. Cancer
Res. 58:5396–5405. 1998.PubMed/NCBI
|
|
24
|
Lennon JC, Bright SA, Carroll E, Butini S,
Campiani G, O'Meara A, Williams DC and Zisterer DM: The novel
pyrrolo-1,5-benzoxazepine, PBOX-6, synergistically enhances the
apoptotic effects of carboplatin in drug sensitive and multidrug
resistant neuroblastoma cells. Biochem Pharmacol. 87:611–624. 2014.
View Article : Google Scholar : PubMed/NCBI
|
|
25
|
Balayssac D, Cayre A, Authier N, Bourdu S,
Penault-Llorca F, Gillet JP, Maublant J, Eschalier A and Coudore F:
Patterns of P-glycoprotein activity in the nervous system during
vincristine-induced neuropathy in rats. J Peripher Nerv Syst.
10:301–310. 2005. View Article : Google Scholar : PubMed/NCBI
|
|
26
|
Shackelford DB and Shaw RJ: The LKB1-AMPK
pathway: Metabolism and growth control in tumour suppression. Nat
Rev Cancer. 9:563–575. 2009. View Article : Google Scholar : PubMed/NCBI
|
|
27
|
Goodarzi MO and Bryer-Ash M: Metformin
revisited: Re-evaluation of its properties and role in the
pharmacopoeia of modern antidiabetic agents. Diabetes Obes Metab.
7:654–665. 2005. View Article : Google Scholar : PubMed/NCBI
|
|
28
|
Rizos CV and Elisaf MS: Metformin and
cancer. Eur J Pharmacol. 705:96–108. 2013. View Article : Google Scholar : PubMed/NCBI
|
|
29
|
Hawley SA, Pan DA, Mustard KJ, Ross L,
Bain J, Edelman AM, Frenguelli BG and Hardie DG:
Calmodulin-dependent protein kinase kinase-beta is an alternative
upstream kinase for AMP-activated protein kinase. Cell Metab.
2:9–19. 2005. View Article : Google Scholar : PubMed/NCBI
|
|
30
|
Jackson AL, Kilgore JE, Qiu H, Zhou C,
Gehrig PA and Victoria L: Abstract 2442: Antitumorigenic effects of
phenformin in human ovarian cancer cell lines. Cancer Res.
73:24422013. View Article : Google Scholar
|
|
31
|
Yuan P, Ito K, Perez-Lorenzo R, Del Guzzo
C, Lee JH, Shen CH, Bosenberg MW, McMahon M, Cantley LC and Zheng
B: Phenformin enhances the therapeutic benefit of BRAF(V600E)
inhibition in melanoma. Proc Natl Acad Sci USA. 110:18226–18231.
2013. View Article : Google Scholar : PubMed/NCBI
|
|
32
|
Guo Z, Chavez KJ, Alvarez J, Zhang X,
Norris B, Maher M, Morgan M, Schumacher RJ, Cuellar R, Sevrioukova
IF, et al: Abstract 2689: Breast cancer inhibition by a novel and
potent biguanide, N1-hexyl-N5-benzyl-biguanide. Cancer Res.
74:26892014. View Article : Google Scholar
|
|
33
|
Shackelford DB, Abt E, Gerken L, Vasquez
DS, Seki A, Leblanc M, Wei L, Fishbein MC, Czernin J, Mischel PS
and Shaw RJ: LKB1 inactivation dictates therapeutic response of
non-small cell lung cancer to the metabolism drug phenformin.
Cancer Cell. 23:143–158. 2013. View Article : Google Scholar : PubMed/NCBI
|
|
34
|
Davidoff F: Effects of guanidine
derivatives on mitochondrial function: III. The mechanism of
phenethylbiguanide accumulation and its relationship to in vitro
respiratory inhibition. J Biol Chem. 246:4017–4027. 1971.PubMed/NCBI
|
|
35
|
Bridges HR, Jones AJ, Pollak MN and Hirst
J: Effects of metformin and other biguanides on oxidative
phosphorylation in mitochondria. Biochem J. 462:475–487. 2014.
View Article : Google Scholar : PubMed/NCBI
|
|
36
|
Hardie DG: AMPK: A target for drugs and
natural products with effects on both diabetes and cancer.
Diabetes. 62:164–2172. 2013. View Article : Google Scholar
|