Introduction
Altered metabolism is considered to be a hallmark of
cancer cells, aiding the maintenance of uncontrolled growth and
proliferation by providing sufficient biomass and energy (1). Since the altered metabolism of
transformed cells significantly contributes to cellular
proliferation, targeting metabolic pathways of cancer cells is a
promising area in cancer therapeutics (2). A key metabolic alteration exhibited by
the majority of cancer cells is enhanced aerobic glycolysis, a
phenomenon known as the Warburg effect, which provides several
metabolic benefits to proliferating cancer cells (3). Additionally, cancer cells exhibit
increased glutamine metabolism, which has important roles in
bioenergetic and biosynthetic processes of cancer cells (4).
Clear cell renal cell carcinoma (ccRCC) is the most
common malignancy of the kidney (5).
Previous studies revealed that renal cancer tissues exhibited a
different metabolic profile from normal tissues; RCC tissues
exhibited the Warburg glycolytic phenotype and higher glucose
levels than normal tissues (6). To
meet the unique energetic requirements of cancer cells, changes in
glycolysis and glutaminolysis alter the intracellular carbon flux
(7,8).
During the initiation and progression of cancer, the inactivation
of tumor suppressor genes and the activation of oncogenes results
in multiple intracellular signaling shifts, affecting glycolytic
flux and glutaminolysis in cancer cells (9–12). An
improved understanding of the molecular mechanisms involved in
tumor metabolism may facilitate the identification of novel
diagnostic approaches and treatment strategies for targeted cancer
therapy.
The most critical amino acid in the metabolism of
cancer cells is glutamine, the deprivation of which can cause
apoptosis of neuroblastoma cells (13). The catabolism of glutamine is
catalyzed by glutaminase 1 (GLS 1) and glutamate dehydrogenase. ASC
amino-acid transporter 2 (ASCT2) is the primary glutamine
transporter in cancer cells (14).
The activation of ASCT2 can transport large amounts of glutamine
into cancer cells to support their proliferation (15); on the basis of this mechanism,
inhibiting glutamine transportation by ASCT2 has the potential to
be a cancer therapy (16). In
glutaminolysis, glutaminase 1 (GLS1) is the first rate-limiting
enzyme, and is regulated by v-myc avian myelocytomatosis viral
oncogene (c-Myc) (17–19).
The N-Myc downstream-regulated gene (NDRG) family is
comprised of four members, all of which exhibit high expression in
normal brain, heart, skeletal muscle and kidney tissues (20). The expression of NDRG family member 2
(NDRG2) differs markedly between tumor and healthy tissue. The
expression level of NDRG2 is positively correlated with the
differentiation and development grade of an organ and negatively
correlated with the proliferative capacity of cells (21). Higher expression of NDRG2 mRNA is
clinically associated with less aggressive tumors in meningioma
(22) and higher survival rates in
high-grade gliomas (23). In previous
studies, the expression level of NDRG2 mRNA and protein in ccRCC
was found to be downregulated (24),
indicating that NDRG2 may have a critical function in the
development of ccRCC. However, to the best of our knowledge, the
mechanism of NDRG2 inactivation in cancer has not been
explained.
The objective of the present study was to
investigate the underlying mechanism behind the inhibition of
glycolysis and glutaminolysis by NDRG2 in ccRCC. Presented in the
current study are novel results revealing that NDRG2 can suppress
glycolysis and glutaminolysis in ccRCC by inhibiting glucose
transporter 1 (GLUT1), hexokinase 2 (HK2), pyruvate kinase isoform
M2 (PKM2), lactate dehydrogenase (LDHA), ASCT2 and GLS1 gene
expression. In light of the present data, NDRG2 could be considered
as a promising therapeutic target for cancer treatment.
Materials and methods
Cell cultures
The ccRCC 786-O and Caki-1 cell lines were purchased
from the American Type Culture Collection (ATCC; Manassas, VA,
USA). The 786-O cells were cultured in RPMI-1640 medium (HyClone
Laboratories; GE Healthcare Life Sciences, Logan, UT, USA); Caki-1
cells were cultured in McCoy's 5A Modified medium (HyClone
Laboratories; GE Healthcare Life Sciences). The two media were
supplemented with 10% fetal bovine serum (Gibco; Thermo Fisher
Scientific, Inc., Waltham, MA, USA). The cell lines were incubated
in a humidified atmosphere of 5% CO2 at 37°C.
Plasmid construction, virus packaging
and infection
Recombinant lentiviral vectors were constructed in
the present laboratory using the Invitrogen ViraPower™ Lentiviral
System (Thermo Fisher Scientific, Inc.). Human full-length NDRG2
DNA was subcloned into a plenti6 vector in HEK-293T cells (ATCC).
HEK-293 cells were transfected with pLenti6-mCherry/pLenti6-NDG2,
PMD2G and PAX2 lentiviral vectors via Lipofectamine 2000
(Invitrogen; Thermo Fisher Scientific, Inc.), according to the
manufacturer's protocol. The viral supernatants were collected,
filtered (through a 0.45-µm filter; Millipore; Merck KGaA,
Darmstadt, Germany), and introduced into 786-O and Caki-1 cells
after 48 h.
Reverse transcription-quantitative
polymerase chain reaction (RT-qPCR) analysis
TRIzol reagent (Invitrogen; Thermo Fisher
Scientific, Inc.) was used to isolate total RNA from cells. cDNA
was synthesized from the isolated RNA using AMV reverse
transcriptase (Promega Corporation, Madison, WI, USA), according to
the manufacturer's protocol. The cDNA was used as a template for
qPCR using ABI Prism 7500 (Applied Biosystems; Thermo Fisher
Scientific, Inc.). The specific primer pairs were as follows: NDRG2
forward, 5′-GAGATATGCTCTTAACCACCCG-3′ and reverse,
5′-GCTGCCCAATCCATCCAA-3′; GLUT1 forward, 5′-ACCATTGGCTCCGGTATCG-3′
and reverse 5′-GCTCGCTCCACCACAAACA-3′; hexokinase 1 forward,
5′-TGGAGTCCGAGGTTTATG-3′ and reverse, 5′-TTTGGATTGTTGGCAAGG-3′; HK2
forward, 5′-CCAGTTCATTCACATCATCAG-3′ and reverse,
5′-CTTACACGAGGTCACATAGC-3′; PKM1 forward,
5′-CGAGCCTCAAGTCACTCCAC-3′ and reverse, 5′-GTGAGCAGACCTGCCAGACT-3′;
PKM2 forward, 5′-CTGTGGACTTGCCTGCTGTG-3′ and reverse,
5′-TGCCTTGCGGATGAATGACG-3′; LDHA forward,
5′-CTGGGAGTTCACCCATTAAGCT-3′ and reverse,
5′-CAGGCACACTGGAATCTCCAT-3′; LDHB forward,
5′-AGGGAGTGTGTATATTTGAGTT-3′ and reverse,
5′-TCAAACTTACCTATAAACCAAA-3′; ASCT2 forward,
5′-CCGCTTCTTCAACTCCTTCAA-3′ and reverse 5′-ACCCACATCCTCCATCTCCA-3′;
GLS1 forward, 5′-GCTGTGCTCCATTGAAGTGACT-3′ and reverse,
5′-TTGGGCAGAAACCACCATTAG-3′; and β-actin forward,
5′-CGCGAGAAGATGACCCAGAT-3′ and reverse, 5′-GTACGGCCAGAGGCGTACAG-3′.
The following thermocycling conditions were maintained: 95°C for 3
min; 95°C for 10 sec and 60°C for 30 sec for 39 cycles; and melting
curve analysis using increase from 65.0 to 95.0°C in 0.5°C
increments for 5 sec. Independent experiments were repeated three
times. The relative expression levels of mRNA were analyzed using
Bio-Rad CFX Manager v3.1 software (Bio-Rad Laboratories, Inc.,
Hercules, CA, USA) with the 2−∆∆Cq method (25).
Western blot analysis
Total protein was isolated from cell lines and
clinical ccRCC tissue samples for western blot analysis using RIPA
buffer (Beyotime Institute of Biotechnology, Haimen, China).
Immunoblotting was the performed as described below. Total protein
content was measured using a BCA protein assay then 50 µg/lane was
separated using 10% SDS-PAGE and transferred to a polyvinylidene
difluoride membrane. The membranes were incubated with 5% non-fat
milk for 1 h at room temperature, followed by washing with TBS with
Tween-20. The blots were then incubated with primary antibodies for
12 h at 4°C followed by incubation with the secondary antibody for
2 h at room temperature. The following primary antibodies were
used: Polyclonal rabbit anti-human HK2 (dilution, 1:2,000; cat. no.
2106S; Cell Signaling Technology, Inc., Danvers, MA, USA);
polyclonal rabbit anti-human PKM2 (dilution, 1:2,000; cat. no.
3198S; Cell Signaling Technology, Inc.); polyclonal rabbit
anti-human LDHA (dilution, 1:2,000; cat. no. 2012S; Cell Signaling
Technology, Inc.); polyclonal rabbit anti-human ASCT2 (dilution,
1:2,000; cat. no. 5345S; Cell Signaling, Inc.); polyclonal rabbit
anti-human GLS1 (dilution, 1:2,000, cat. no. ab93434; Abcam,
Cambridge, UK); monoclonal rabbit anti-human GLUT1 (dilution;
1:1,000; cat. no. ab115730; Abcam); monoclonal mouse anti-human
NDRG2 (dilution, 1:5,000, cat. no. H57447-M03; Abnova, Taipei,
Taiwan); and polyclonal rabbit anti-human β-actin (dilution,
1:1,000; cat. no. bs-0061R; Beijing Biosynthesis Biotechnology Co.,
Ltd., Beijing, China). Horesradish peroxidase-conjugated secondary
antibodies polyclonal goat anti-rabbit IgG (dilution, 1:3,000; cat.
no. 7074S; Cell Signaling Technology, Inc.) and polyclonal horse
anti-mouse IgG (dilution, 1:3,000; cat. no. 7076S; Cell Signaling
Technology, Inc.) were used. An ECL kit (Beyotime Institute of
Biotechnology) was used to perform chemiluminescence detection
according to the manufacturer's protocol.
Glucose consumption and lactate
production test
NDRG2-overexpressing- and cherry-control- 786-O, and
Caki-1 cells were seeded on 6-well plates at a density of
1×10⁵ cells/well, and the culture Dulbecco's modified
Eagle's medium (DMEM; HyClone Laboratories; GE Healthcare Life
Sciences) was changed to fresh DMEM following incubation at 37°C
for 12 h. The concentrations of glucose and lactate in culture
medium were measured after 24 h using the Glucose Test kit (Nanjing
Jiancheng Bioengineering Institute, Nanjing, China) and the Lactate
Assay kit (Nanjing Jiancheng Bioengineering Institute),
respectively, according to the manufacturer's protocol.
Glutamine/glutamate concentration
test
NDRG2-overexpressing and cherry-control-786-O, and
Caki-1 cells were cultured for 24 h in 6-well plates in phenol
red-free medium. The culture medium was collected and cells were
lysed with RIPA buffer. Concentrations of glutamine in the medium
and in the cell lysate were determined using the
Glutamine/Glutamate Determination kit (cat. no. GLN-1;
Sigma-Aldrich; Merck KGaA). All protein levels were determined
spectrophotometrically using a standard curve, using absorbance
measurements at 340 nm. The absorbance is proportional to the ratio
of NAD+:NADH, which accompanies the oxidation of
glutamate to α-ketoglutarate, as catalyzed by glutamic
dehydrogenase. Glutamine levels were determined from the amount of
glutamine converted to glutamate via GLS1. The glutamine
consumption was calculated as the difference between the initial
and final glutamine levels of the cells in culture. Glutamate
production was calculated as the difference between the final and
initial levels of glutamate.
Colony formation assay
NDRG2-overexpressing and cherry-control- 786-O cells
were seeded into a 6-well plate at a density of 100 cells/well. The
cells were grown for 14 days in DMEM under the same incubation
conditions as described in the aforementioned culture method. The
colonies were dried and stained for 10 min at 37°C with 0.5%
crystal violet. The colonies formation efficiency was calculated by
a standard formula: Colony formation efficiency
(%)=(colonies/seeded cells)x100%.
Wound healing assay
NDRG2-overexpressing and control-cherry 786-O cells
were cultured at a density of 1.0×10⁶ cells/well in
6-well plates. Once the cells had grown to a fully confluent
monolayer, the cell monolayer was carefully scraped using a sterile
tip to create a wound (scratch) and washed twice with fresh DMEM to
remove any debris. Cells were then incubated for 24 h. Images of
the wound and the surrounding area were captured immediately (0 h)
and 24 h after scraping.
In vivo tumorigenicity assay
A subcutaneous injection of 1×10⁷ cells
was administered to six 6-week-old athymic nude female mice
(weighing 18–22 g) in the right hind limb (all the animals were
kept in the animal center of The Fourth Military Medical
University, Xi'an, China). All animals were raised in a sterile
environment in laminar flow cabinets with disinfectant-treated
baskets and bedding, adequate feed and drinking water, aseptic
operation, constant temperature (18–20°C) and constant humidity
(50–60%). Tumor growth was quantified by measuring tumor size with
vernier calipers weekly for 1 month. Tumor volume was calculated
using a standard formula: Tumor volume (mm3) = width
(mm2) × length (mm) × 0.5. At the end of the experiment,
tumors and tumor tissues were harvested and analyzed once a tumor
size of 2×2 cm was achieved. The assessment was performed by
weighing the tumors and measuring protein expression via western
blot analysis.
Statistical analysis
Statistical analyses were performed using SPSS
v.19.0 software (IBM Corp., Armonk, NY, USA) for Windows. All data
shown are the mean ± standard error of triplicate values from three
separate experiments. P<0.05 was considered to indicate a
statistically significant difference. Independent Student's t-tests
were used to compare the variables between two groups.
Results
NDRG2 inhibits glycolysis and
glutaminolysis in ccRCC
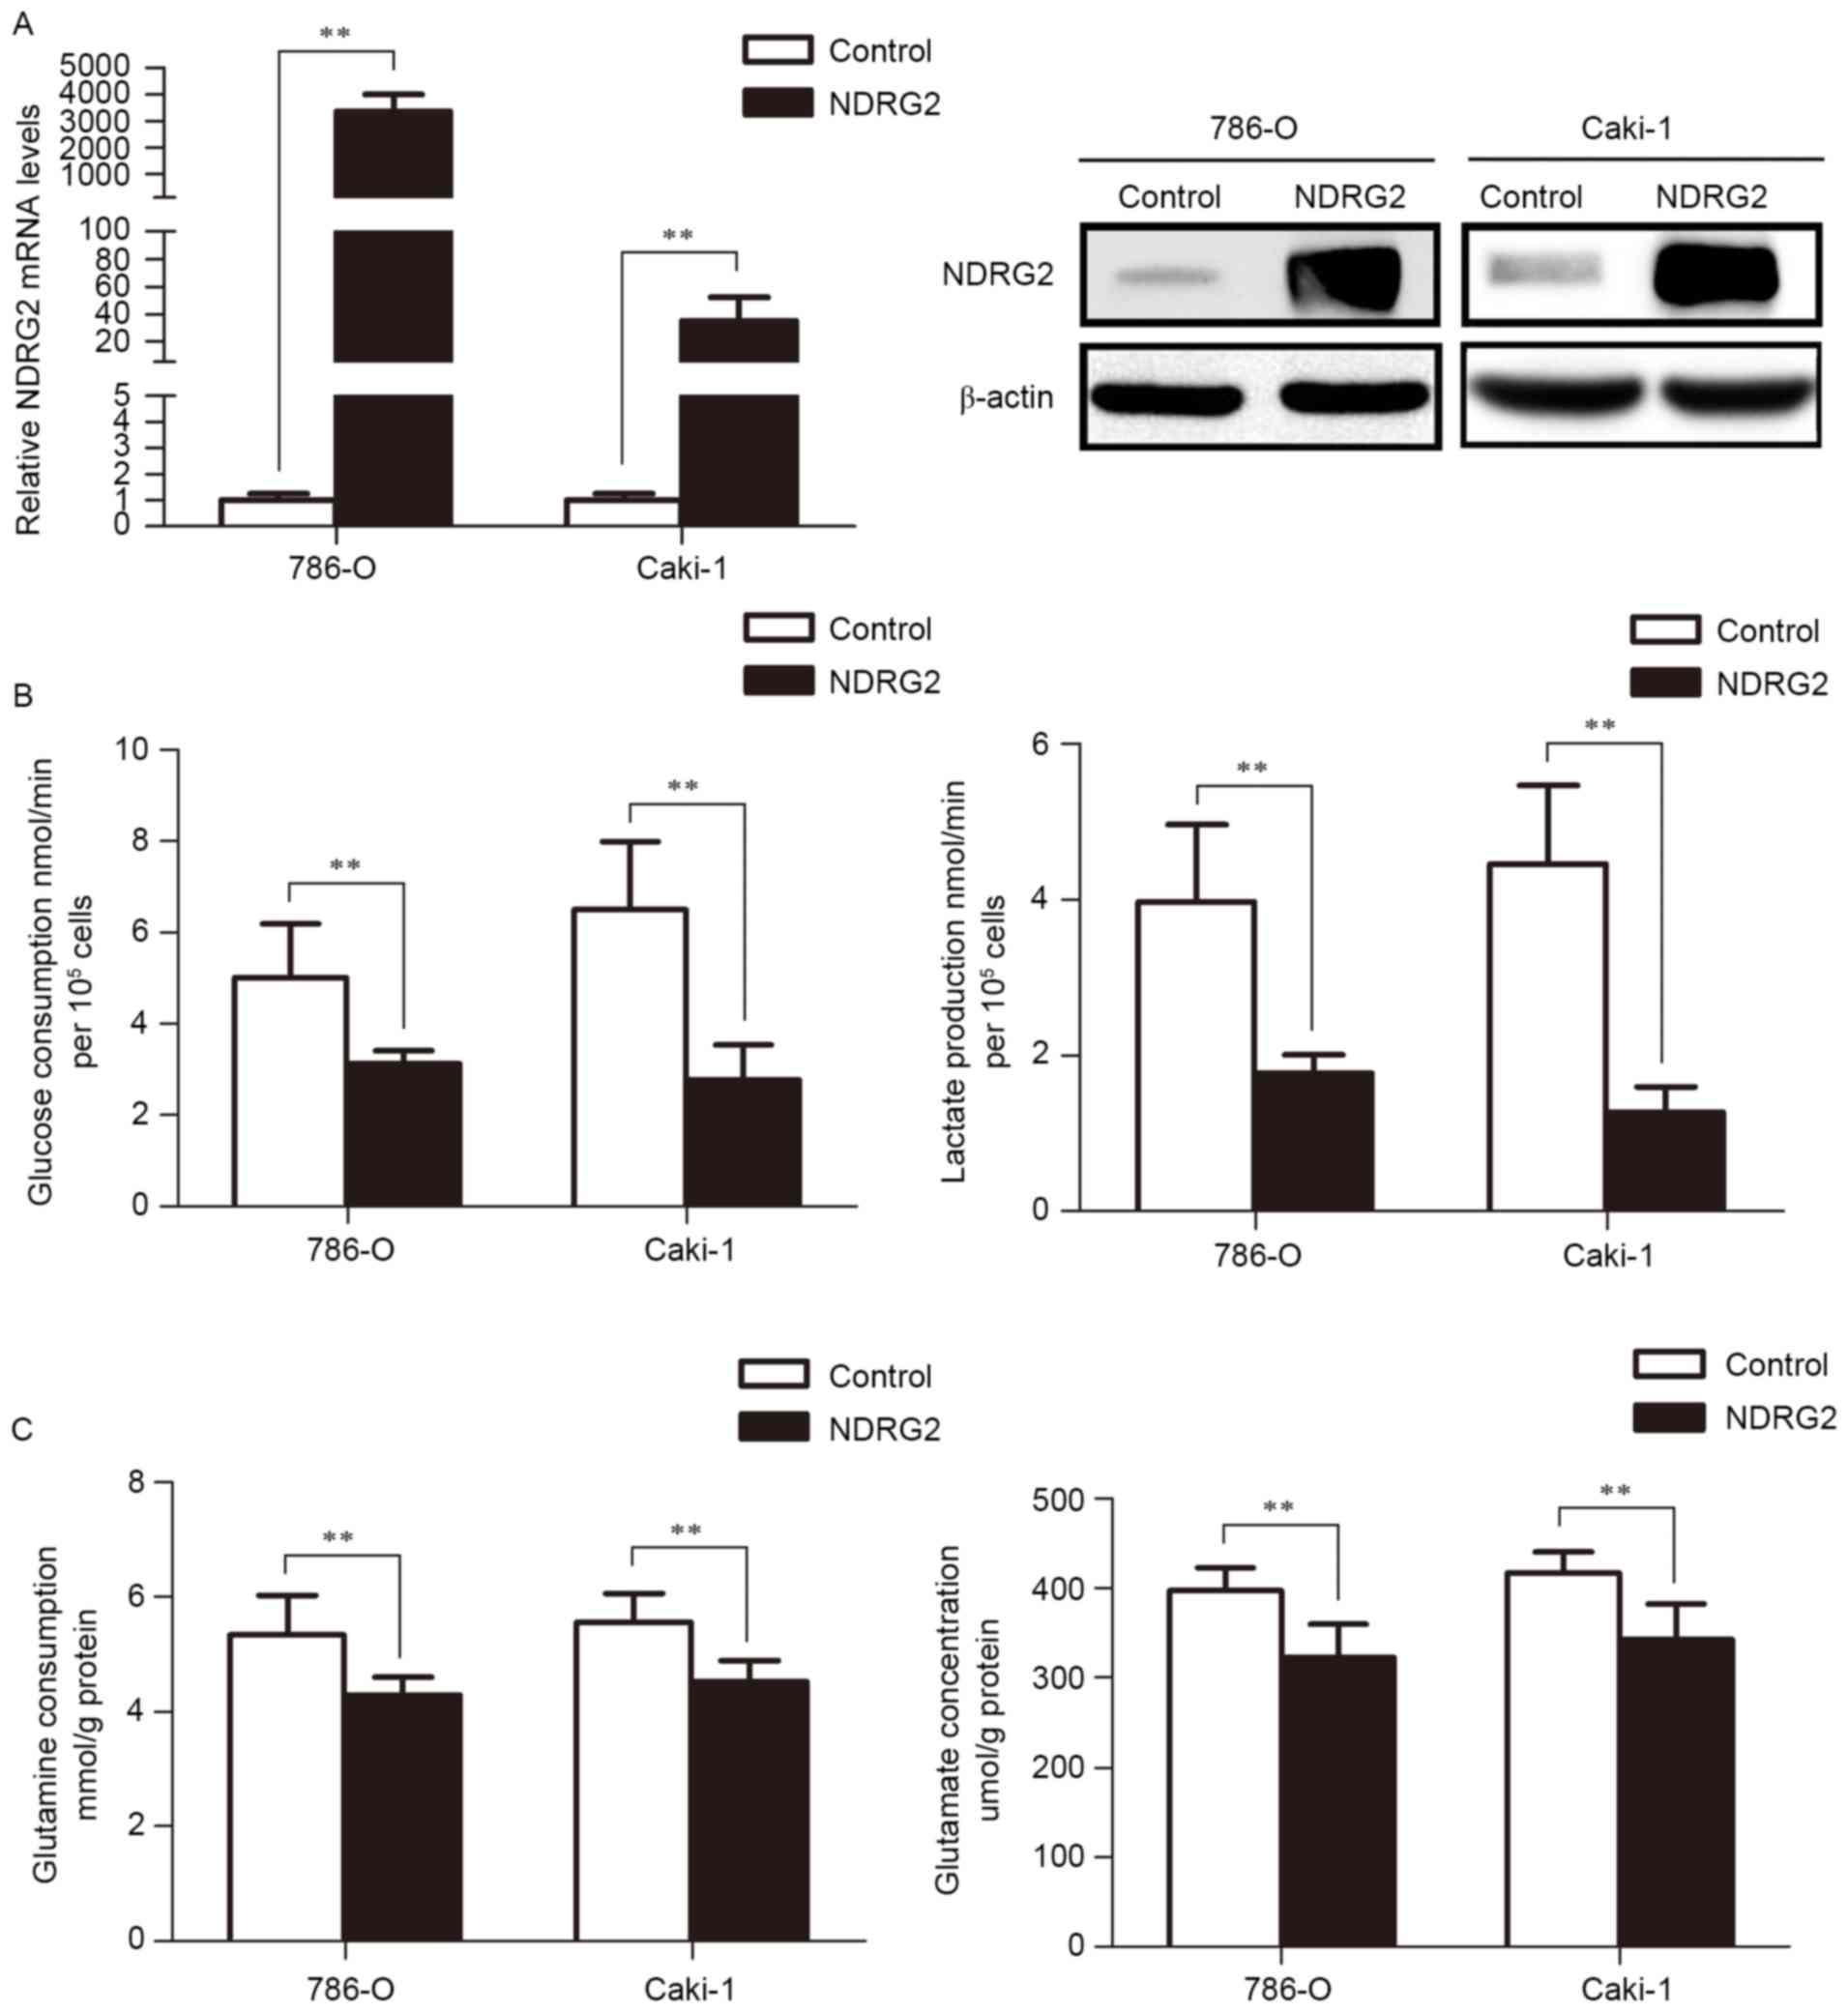
To study the function of NDRG2 in the metabolic
reprogramming of ccRCC, NDRG2 was successfully overexpressed in two
ccRCC cell lines (786-O and Caki-1) through lentivirus transfection
(Fig. 1A). The results of the present
study reveal that NDRG2 inhibits aerobic glycolysis, as indicated
by the decrease in glucose consumption and lactate production in
786-O and Caki-1 cells (Fig. 1B).
Additionally, overexpression of NDRG2 also inhibits glutaminolysis,
as indicated by decreased glutamine consumption and glutamate
concentration in the culture medium of NDRG2-overexpressing 786-O
and Caki-1 cells, compared to controls (Fig. 1C).
NDRG2 inhibited expression of
glycolysis and glutaminolysis genes in ccRCC cells
To identify the molecular targets involved in
NDRG2-regulated aerobic glycolysis, the expression of glucose
transporters and enzymes in glycolysis, and glutamine transporters
and glutaminolysis pathway enzymes was assessed in
NDRG2-overexpressing 786-O and Caki-1 cells. Compared with the
control group, overexpression of NDRG2 significantly reduced the
expression of GLUT1, HK2, PKM2 and LDHA genes in 786-O and Caki-1
cell lines (Fig. 2A and B).
Overexpression of NDRG2 also significantly decreased the expression
of ASCT2 and GLS1 genes in 786-O and Caki-1 cells (Fig. 2C and D). Tissue analysis from the
tumor-formation experiment, in which mice were injected with 786-O
cells overexpressing NDRG2, agreed with the in vivo result
(Fig. 3A).
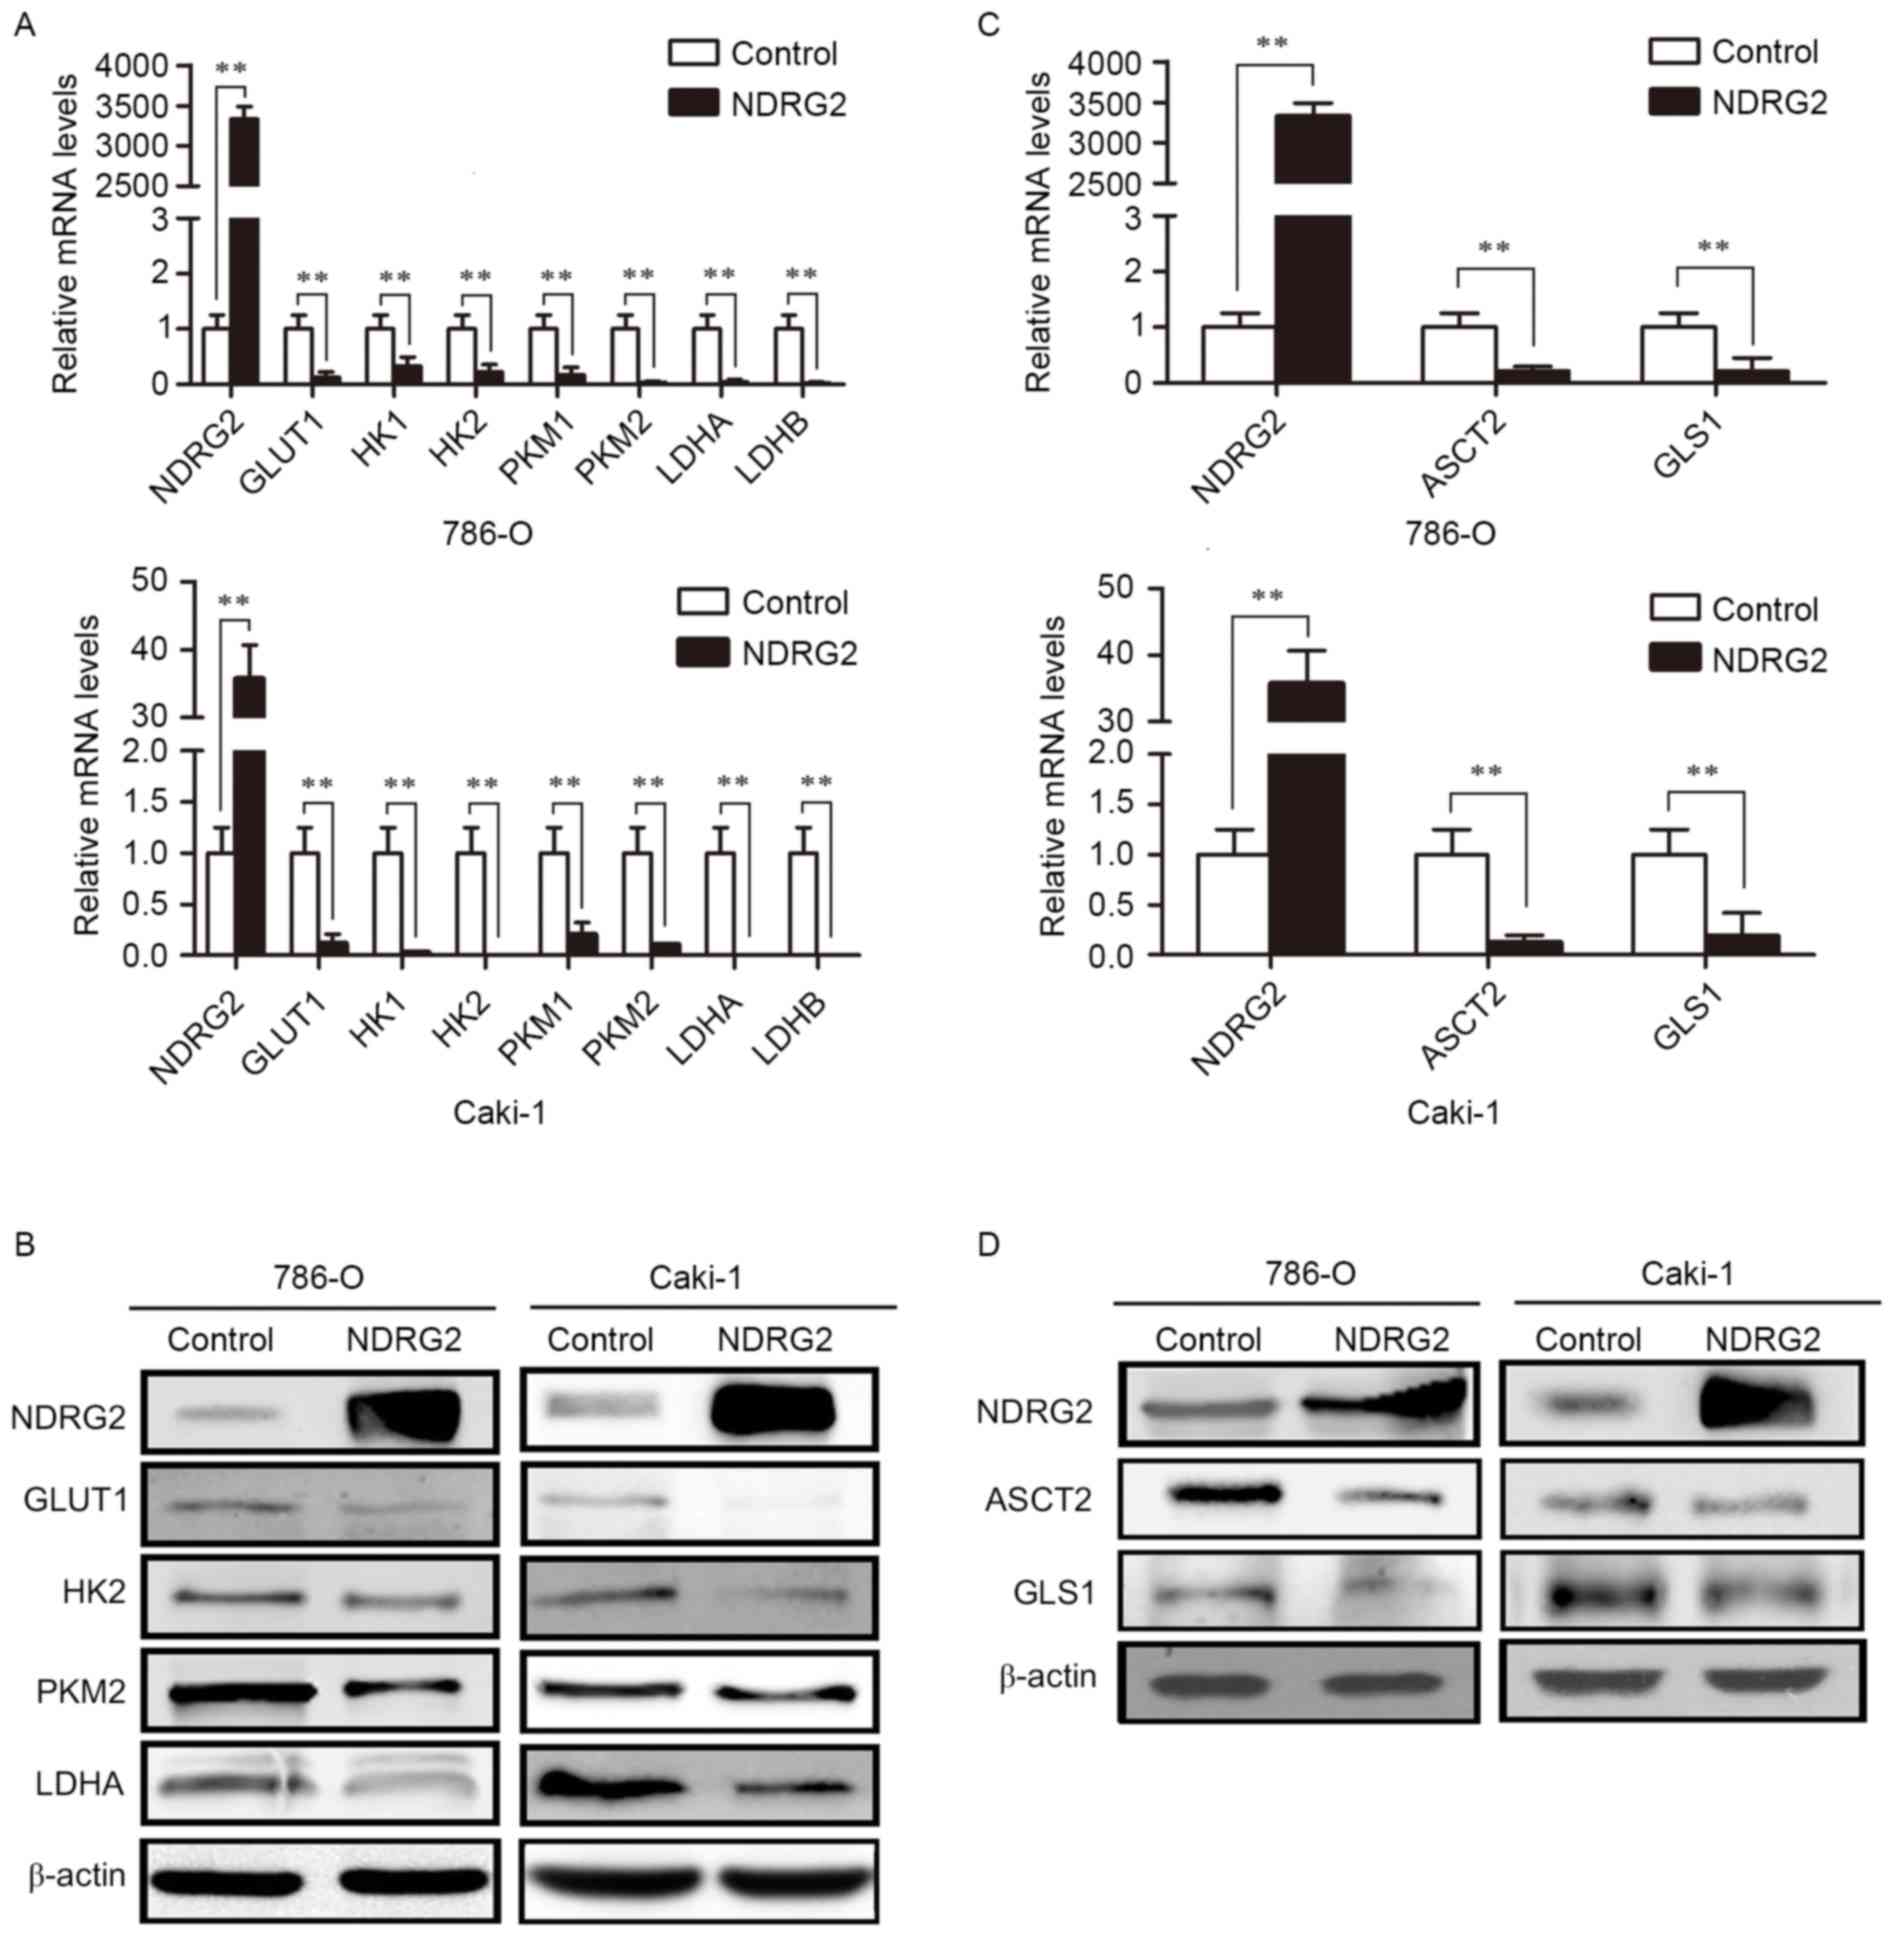 | Figure 2.Expression levels of various metabolic
enzymes in NDRG2-overexpressing clear cell renal cell carcinoma
cell lines. (A) NDRG2, GLUT1, HK1, HK2, PKM1, PKM2, LDHA and LDHB
mRNA expression in 786-O and Caki-1 cells transfected with
lentivirus containing NDRG2 or mCherry (control). (B) Western blot
analysis showing NDRG2, GLUT1, HK2, PKM2 and LDHA protein levels in
786-O and Caki-1 cells. β-actin acted as an internal control to
ensure equal loading. (C) NDRG2, ASCT2 and GLS1 mRNA expression of
786-O and Caki-1 cells transfected with lentivirus containing NDRG2
or mCherry, and β-actin acted as an internal control to ensure
equal loading. (D) Western blot analysis showing protein expression
of NDRG2, ASCT2 and GLS1 in 786-O and Caki-1 cells. β-actin acted
as an internal control to ensure equal loading. **P<0.01. NDRG2,
N-myc downstream-regulated gene 2 protein; GLUT1, glucose
transporter 1; HK1, hexokinase-1; PKM1, pyruvate kinase isoform 1;
LDHA, lactate dehydrogenase A chain; GLS1, glutaminase 1; ASCT2,
alanine-serine-cysteine transporter 2. |
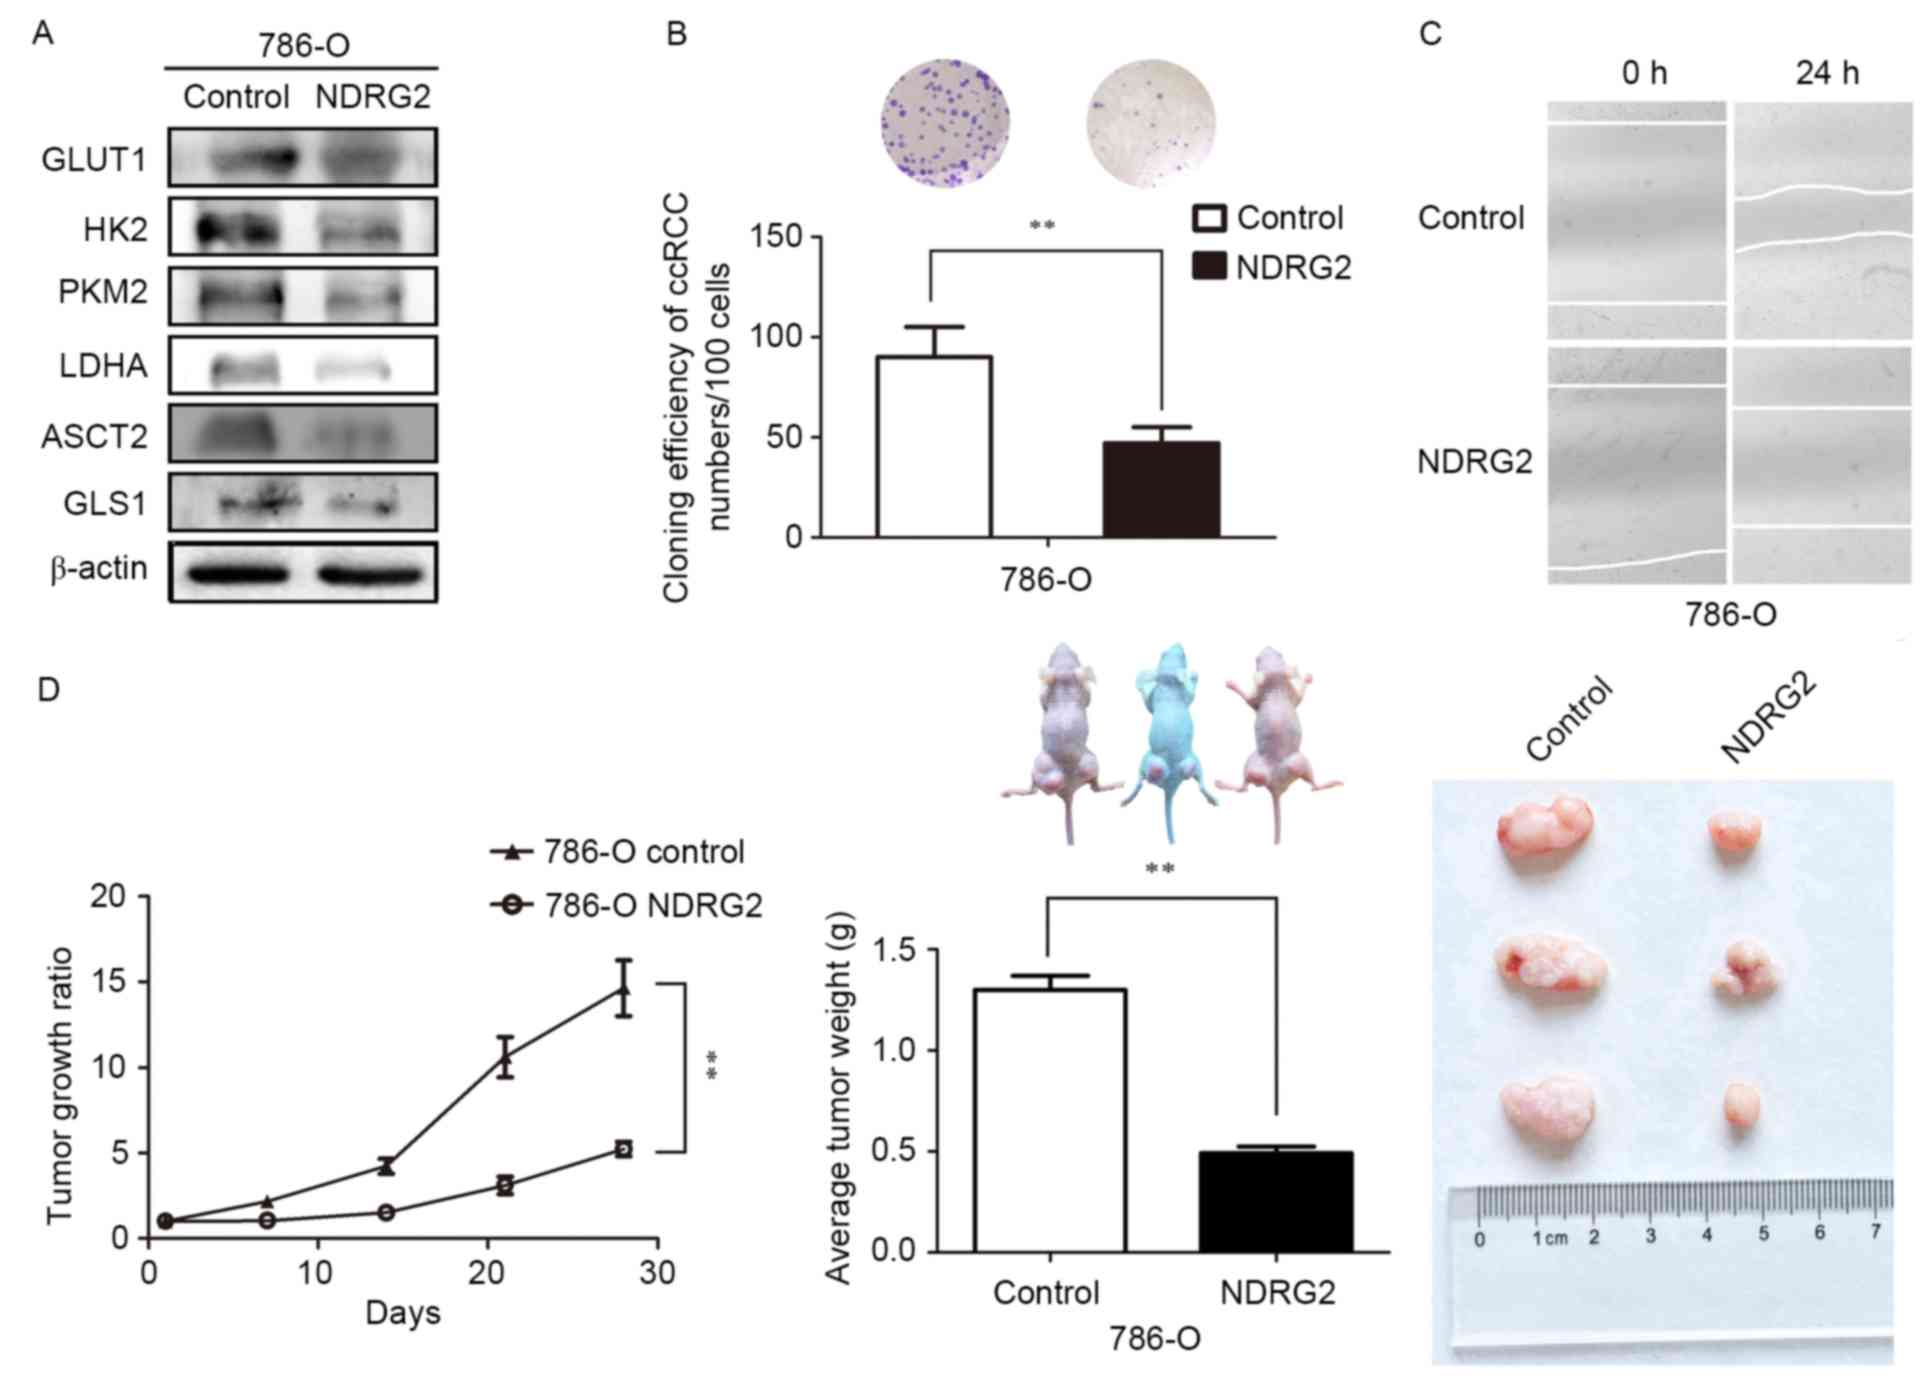 | Figure 3.Expression levels of various metabolic
enzymes and tumor growth ratio of NDRG2-overexpressing 786-O cells
in a tumor bearing experiment; in addition to the effects of NDRG2
overexpression on the proliferative, and migratory abilities of
786-O cells. (A) Levels of GLUT1, HK2, PKM2, LDHA, ASCT2 and GLS1
protein in tumor tissues were assessed ex vivo via western
blot analysis; β-actin acted as an internal control to ensure equal
loading. (B) Equal numbers of NDRG2-overexpressing and control
786-O cells were seeded onto a 60-mm dish and after 14 days, the
cells were fixed and stained with crystal violet. (C) Equal numbers
of NDRG2-overexpressing and control 786-O cells were seeded onto
6-well plates, then the cell motility of NDRG2-overexpressing and
control 786-O cells were determined by wound migration assay.
**P<0.01. (D) Tumor volume was calculated by the formula
(width2 × length × 0.5). The tumor weight of mice was
measured 28 days after injection, at which point each tumor was
photographed. NDRG2, N-myc downstream-regulated gene 2 protein;
GLUT1, glucose transporter 1; HK2, hexokinase-2; PKM2, pyruvate
kinase isoform 2; LDHA, lactate dehydrogenase A chain; GLS1,
glutaminase 1; ASCT2, alanine-serine-cysteine transporter 2. |
NDRG2 inhibited the growth and
proliferation of ccRCC
Colony formation assays, wound-scratch assays and
tumor-formation experiments in nude mice in vivo were used
to investigate whether NDRG2 regulates the growth and proliferation
of ccRCC cells. The results of the present study indicate that
overexpression of NDRG2 significantly inhibits the efficiency of
colony formation in the 786-O cell line (Fig. 3B). Data also revealed that
overexpression of NDRG2 clearly reduced the migratory ability of
the 786-O cell line (Fig. 3C).
Additionally, overexpression of NDRG2 significantly suppressed
tumor growth in nude mice: Tumor formation in mice injected with
NDRG2-overexpressing 786-O cells progressed much more slowly than
it did in the control groups (Fig.
3D). At the end of fourth week after injection of tumor cells,
mice injected with 786-O cells over-expressing NDRG2 exhibited a
statistically significant decrease in mean tumor volume compared
with the control groups (Fig. 3D). In
addition, the mean tumor weight in mice injected with
NDRG2-overexpressing 786-O cells was significantly lower than that
of mice injected with control 786-O cells (Fig. 3D). These data indicated that NDRG2
effectively suppresses the growth and proliferation of ccRCC cells
in vitro and in vivo.
Discussion
One of the hallmarks of cancer tissues is the
metabolic reprogramming phenotype, in which glucose consumption and
lactate production are significantly increased. Glucose and
glutamine are key metabolites in the metabolic processes that
generate energy for the cell. In cancer cells, metabolic
reprogramming assists in maintaining uncontrolled growth and
proliferation by providing sufficient energy (1).
A previous study revealed that the activation of
oncogenes and inactivation of tumor suppressor genes are closely
associated with tumor metabolic reprogramming (12). NDRG2 is a tumor suppressor gene that
can inhibit tumor cell proliferation and invasion (26). In 2015, Xu et al (27) found that NDRG2 could inhibit
glycolysis and glutaminolysis in colorectal cancer cells through
the inhibition of c-Myc. However, the inhibitory function of NDRG2
in the metabolism of renal cancer remains unclear.
The present study demonstrates that NDRG2 can
downregulate glycolysis and glutaminolysis in ccRCC by inhibiting
the expression of GLUT1, HK2, PKM2, LDHA, ASCT2 and GLS1. The data
produced by the current study demonstrate that NDRG2 acts as a key
inhibitor of glycolysis and glutaminolysis in ccRCC.
Xu et al (27)
demonstrated that the NDRG2-dependent inhibition of glycolysis and
glutaminolysis in colorectal cancer cells occurs through inhibition
of c-Myc. Although associations between NDRG2 and c-Myc in ccRCC
were not examined in the present study, previous studies have
revealed that the majority of the enzymes and transporters involved
in glycolysis and glutaminolysis can be regulated by c-Myc
(9,28–31). For
example, the expression and activation of glucose transporters,
HK2, PKM2 and LDHA are all regulated by c-Myc (9,28–30). Additionally, lactate-induced
activation of c-Myc can trigger the expression of the glutamine
transporter ASCT2 and GLS1, resulting in increased glutamine uptake
and catabolism (31). This
association, in addition to the regulatory roles of NDRG2 in
glycolysis and glutaminolysis, suggests that c-Myc could also
regulate the same metabolic pathways in ccRCC. The present study
therefore indicates that the association between NDRG2 and c-Myc on
the inhibition of glutaminolysis and glycolysis in ccRCC should be
a topic of future studies.
A previous study reported that NDRG2 could inhibit
growth and proliferation of ccRCC cells (32). A similar effect was observed in 786-O
and Caki-1 cells that overexpressed NDRG2, which were confirmed to
exhibit reduced glycolysis and glutaminolysis metabolism in
vivo and in vitro. Since the growth and proliferation of
cancer cells rely on glycolysis and glutaminolysis (8), the inhibitory effect on the growth and
proliferation of ccRCC may be due to NDRG2. However, the
association between the inhibition of the growth and proliferation
of ccRCC cells and the inhibition of glycolysis and glutaminolysis
caused by overexpression of NDRG2 has not been confirmed; this
association should therefore be explored further in future
studies.
In summary, the present study illustrates the
regulatory role of the tumor suppressor gene NDRG2 in the metabolic
reprogramming of ccRCC. With these findings, the mechanism of tumor
metabolic reprogramming can be further understood, with the pathway
representing a novel metabolic target for cancer treatment.
Acknowledgements
Support for this study was provided by grants from
the Scientific Innovative Project of Shaanxi Province (no.
2012KTCL03-0), the Xijing Hospital Subject Booster Plan for
Translational Medicine Research Projects (no. XJZT13Z05) and the
Collaborative Innovation Projects of Shaanxi Province (no.
2015XT-53).
Glossary
Abbreviations
Abbreviations:
|
NDRG2
|
N-Myc downstream regulated gene 2
|
|
ccRCC
|
clear cell renal cell carcinoma
|
|
GLUT1
|
glucose transporter 1
|
|
HK2
|
hexokinase 2
|
|
PKM2
|
M2 isoform of pyruvate kinase
|
|
LDHA
|
lactate dehydrogenase A
|
|
GLS1
|
glutaminase 1
|
|
ASCT2
|
alanine-serine-cysteine (ASC) amino
acid transporter 2
|
References
|
1
|
Hanahan D and Weinberg RA: Hallmarks of
cancer: The next generation. Cell. 144:646–674. 2011. View Article : Google Scholar : PubMed/NCBI
|
|
2
|
Tennant DA, Durán RV and Gottlieb E:
Targeting metabolic transformation for cancer therapy. Nat Rev
Cancer. 10:267–277. 2010. View
Article : Google Scholar : PubMed/NCBI
|
|
3
|
Heiden MG Vander, Cantley LC and Thompson
CB: Understanding the Warburg effect: The metabolic requirements of
cell proliferation. Science. 324:1029–1033. 2009. View Article : Google Scholar : PubMed/NCBI
|
|
4
|
Wise DR and Thompson CB: Glutamine
addiction: A new therapeutic target in cancer. Trends Biochem Sci.
35:427–433. 2010. View Article : Google Scholar : PubMed/NCBI
|
|
5
|
Cohen HT and McGovern FJ: Renal-cell
carcinoma. N Engl J Med. 353:2477–2490. 2005. View Article : Google Scholar : PubMed/NCBI
|
|
6
|
Catchpole G, Platzer A, Weikert C,
Kempkensteffen C, Johannsen M, Krause H, Jung K, Miller K,
Willmitzer L, Selbig J and Weikert S: Metabolic profiling reveals
key metabolic features of renal cell carcinoma. J Cell Mol Med.
15:109–118. 2011. View Article : Google Scholar : PubMed/NCBI
|
|
7
|
Dang CV: Links between metabolism and
cancer. Genes Dev. 26:877–890. 2012. View Article : Google Scholar : PubMed/NCBI
|
|
8
|
Deblois G and Giguère V: Oestrogen-related
receptors in breast cancer: Control of cellular metabolism and
beyond. Nat Rev Cancer. 13:27–36. 2013. View Article : Google Scholar : PubMed/NCBI
|
|
9
|
Dang CV, Le A and Gao P: MYC-induced
cancer cell energy metabolism and therapeutic opportunities. Clin
Cancer Res. 15:6479–6483. 2009. View Article : Google Scholar : PubMed/NCBI
|
|
10
|
DeBerardinis RJ, Lum JJ, Hatzivassiliou G
and Thompson CB: The biology of cancer: Metabolic reprogramming
fuels cell growth and proliferation. Cell Metab. 7:11–20. 2008.
View Article : Google Scholar : PubMed/NCBI
|
|
11
|
Hsu PP and Sabatini DM: Cancer cell
metabolism: Warburg and beyond. Cell. 134:703–707. 2008. View Article : Google Scholar : PubMed/NCBI
|
|
12
|
Jones RG and Thompson CB: Tumor
suppressors and cell metabolism: A recipe for cancer growth. Genes
Dev. 23:537–548. 2009. View Article : Google Scholar : PubMed/NCBI
|
|
13
|
Qing G, Li B, Vu A, Skuli N, Walton ZE,
Liu X, Mayes PA, Wise DR, Thompson CB, Maris JM, et al: ATF4
regulates MYC-mediated neuroblastoma cell death upon glutamine
deprivation. Cancer Cell. 22:631–644. 2012. View Article : Google Scholar : PubMed/NCBI
|
|
14
|
McGivan JD and Bungard CI: The transport
of glutamine into mammalian cells. Front Biosci. 12:874–882. 2007.
View Article : Google Scholar : PubMed/NCBI
|
|
15
|
Ren P, Yue M, Xiao D, Xiu R, Gan L, Liu H
and Qing G: ATF4 and N-Myc coordinate glutamine metabolism in
MYCN-amplified neuroblastoma cells through ASCT2 activation. J
Pathol. 235:90–100. 2015. View Article : Google Scholar : PubMed/NCBI
|
|
16
|
Wang Q, Beaumont KA, Otte NJ, Font J,
Bailey CG, van Geldermalsen M, Sharp DM, Tiffen JC, Ryan RM,
Jormakka M, et al: Targeting glutamine transport to suppress
melanoma cell growth. Int J Cancer. 135:1060–1071. 2014. View Article : Google Scholar : PubMed/NCBI
|
|
17
|
Frigerio F, Casimir M, Carobbio S and
Maechler P: Tissue specificity of mitochondrial glutamate pathways
and the control of metabolic homeostasis. Biochim Biophys Acta.
1777:965–972. 2008. View Article : Google Scholar : PubMed/NCBI
|
|
18
|
Li M, Li C, Allen A, Stanley CA and Smith
TJ: The structure and allosteric regulation of mammalian glutamate
dehydrogenase. Arch Biochem Biophys. 519:69–80. 2012. View Article : Google Scholar : PubMed/NCBI
|
|
19
|
Wise DR, DeBerardinis RJ, Mancuso A, Sayed
N, Zhang XY, Pfeiffer HK, Nissim I, Daikhin E, Yudkoff M, McMahon
SB and Thompson CB: Myc regulates a transcriptional program that
stimulates mitochondrial glutaminolysis and leads to glutamine
addiction. Proc Natl Acad Sci USA. 105:pp. 18782–18787. 2008;
View Article : Google Scholar : PubMed/NCBI
|
|
20
|
Boulkroun S, Fay M, Zennaro MC, Escoubet
B, Jaisser F, Blot-Chabaud M, Farman N and Courtois-Coutry N:
Characterization of rat NDRG2 (N-Myc downstream regulated gene 2),
a novel early mineralocorticoid-specific induced gene. J Biol Chem.
277:31506–31515. 2002. View Article : Google Scholar : PubMed/NCBI
|
|
21
|
Deng Y, Yao L, Chau L, Ng SS, Peng Y, Liu
X, Au WS, Wang J, Li F, Ji S, et al: N-Myc downstream-regulated
gene 2 (NDRG2) inhibits glioblastoma cell proliferation. Int J
Cancer. 106:342–347. 2003. View Article : Google Scholar : PubMed/NCBI
|
|
22
|
Lusis EA, Watson MA, Chicoine MR, Lyman M,
Roerig P, Reifenberger G, Gutmann DH and Perry A: Integrative
genomic analysis identifies NDRG2 as a candidate tumor suppressor
gene frequently inactivated in clinically aggressive meningioma.
Cancer Res. 65:7121–7126. 2005. View Article : Google Scholar : PubMed/NCBI
|
|
23
|
Phillips HS, Kharbanda S, Chen R, Forrest
WF, Soriano RH, Wu TD, Misra A, Nigro JM, Colman H, Soroceanu L, et
al: Molecular subclasses of high-grade glioma predict prognosis,
delineate a pattern of disease progression, and resemble stages in
neurogenesis. Cancer Cell. 9:157–173. 2006. View Article : Google Scholar : PubMed/NCBI
|
|
24
|
Ma J, Jin H, Wang H, Yuan J, Bao T, Jiang
X, Zhang W, Zhao H and Yao L: Expression of NDRG2 in clear cell
renal cell carcinoma. Biol Pharm Bull. 31:1316–1320. 2008.
View Article : Google Scholar : PubMed/NCBI
|
|
25
|
Livak KJ and Schmittgen TD: Analysis of
relative gene expression data using real-time quantitative PCR and
the 2(-Delta Delta C(T)) method. Methods. 25:402–408. 2001.
View Article : Google Scholar : PubMed/NCBI
|
|
26
|
Faraji SN, Mojtahedi Z, Ghalamfarsa G and
Takhshid MA: N-myc downstream regulated gene 2 overexpression
reduces matrix metalloproteinase-2 and −9 activities and cell
invasion of A549 lung cancer cell line in vitro. Iran J Basic Med
Sci. 18:773–779. 2015.PubMed/NCBI
|
|
27
|
Xu X, Li J, Sun X, Guo Y, Chu D, Wei L, Li
X, Yang G, Liu X, Yao L, et al: Tumor suppressor NDRG2 inhibits
glycolysis and glutaminolysis in colorectal cancer cells by
repressing c-Myc expression. Oncotarget. 6:26161–26176. 2015.
View Article : Google Scholar : PubMed/NCBI
|
|
28
|
Shim H, Dolde C, Lewis BC, Wu CS, Dang G,
Jungmann RA, Dalla-Favera R and Dang CV: c-Myc transactivation of
LDH-A: Implications for tumor metabolism and growth. Proc Natl Acad
Sci USA. 94:pp. 6658–6663. 1997; View Article : Google Scholar : PubMed/NCBI
|
|
29
|
Chen JQ and Russo J: Dysregulation of
glucose transport, glycolysis, TCA cycle and glutaminolysis by
oncogenes and tumor suppressors in cancer cells. Biochim Biophys
Acta. 1826:370–384. 2012.PubMed/NCBI
|
|
30
|
Kim JW, Gao P, Liu YC, Semenza GL and Dang
CV: Hypoxia-inducible factor 1 and dysregulated c-Myc cooperatively
induce vascular endothelial growth factor and metabolic switches
hexokinase 2 and pyruvate dehydrogenase kinase 1. Mol Cell Biol.
27:7381–7393. 2007. View Article : Google Scholar : PubMed/NCBI
|
|
31
|
Pérez-Escuredo J, Dadhich RK, Dhup S,
Cacace A, Van Hée VF, De Saedeleer CJ, Sboarina M, Rodriguez F,
Fontenille MJ, Brisson L, et al: Lactate promotes glutamine uptake
and metabolism in oxidative cancer cells. Cell Cycle. 15:72–83.
2016. View Article : Google Scholar : PubMed/NCBI
|
|
32
|
Ma JJ, Liao CG, Jiang X, Zhao HD, Yao LB
and Bao TY: NDRG2 suppresses the proliferation of clear cell renal
cell carcinoma cell A-498. J Exp Clin Cancer Res. 29:1032010.
View Article : Google Scholar : PubMed/NCBI
|