Introduction
Prostate cancer (PCa) is the most common cancer of
the male urogenital system and the second leading cause of
cancer-associated mortality in the US (1). In China, the incidence and mortality of
PCa have been continually increasing (2). Although treatment modalities for this
cancer have improved, predicting the clinical outcome of PCa
remains difficult (3). Biochemical
recurrence (BCR) occurs in ~20% of patients with PCa following
radical prostatectomy or radiotherapy (4). A series of clinical parameters,
including serum prostate-specific antigen (PSA) levels, Gleason
score and surgical margin status, in various combinations, have
been used to predict the outcome for PCa (5,6). However,
the ability of conventional prognostic factors to identify
insignificant PCa may be limited (7).
Therefore, it is important to identify more novel and sensitive PCa
molecular markers that are associated with biological
aggressiveness and able to provide valuable information for the
diagnosis and treatment of the disease.
Located at chromosome 5 (5q12.1), the DEP
domain-containing protein 1B (DEPDC1B) gene encodes a protein
containing two structural domains: A DEP domain and a RhoGAP domain
(8–10). The DEP domain enables the protein to
interact with G protein coupled receptors as well as
negatively-charged membrane phospholipids, and the RhoGAP domain is
responsible for Rho GTPase signaling (9–11). The
precise function of DEPDC1B is uncharacterized. It has been
reported to be associated with regulating cellular activities,
including cell growth, movement, differentiation, cell cycle and
reorganization of cytoskeleton (10).
Subsequent studies demonstrated that DEPDC1B is also overexpressed
in other types of cancer, including breast cancer (12), oral cancer (13) and non-small cell lung cancer (14), and is a prognostic factor that
predicts outcomes in patients with non-small cell lung cancer
(14). The potential prognostic value
of DEPDC1B in patients with PCa remains unknown. Therefore, the
present study examined the expression of DEPDC1B in prostate
tissues, using immunohistochemistry to explore its clinical
significance.
In the present study, DEPDC1B expression in a tissue
microarray (TMA) containing 80 samples was examined. In order to
investigate the expression of DEPDC1B at the mRNA level and perform
survival analysis, the clinical information of the Taylor dataset
(15), including 150 prostate cancer
tissues and 29 normal prostate tissue, was also collected. The
association between the relative expression of DEPDC1B and
clinicopathological parameters was examined to evaluate its
clinical significance. In addition, the impact of DEPDC1B
expression on the biochemical recurrence (BCR) of patients with PCa
was assessed.
Materials and methods
Patients and tissue samples
For immunohistochemical analysis, a TMA (n=80;
catalog no. PR803c), including 73 tumor tissue samples from
patients with PCa, 3 adjacent normal prostate tissue samples from
patients with PCa and 4 normal prostate tissue samples from healthy
donors, and detailed clinical information were obtained from
Alenabio Biotechnology Ltd. (Xi'an, China), a distributor of US
Biomax, Inc. (Rockville, MD, USA) in China. Patients who received
chemotherapy or radiotherapy prior to surgery were excluded from
the present study. In order to investigate the expression of
DEPDC1B at the mRNA level and perform survival analysis, the
clinical information of the Taylor dataset, including 150 prostate
cancer tissue samples and 29 normal prostate tissue samples, was
also collected (15). All patients
were followed up for 13 months or longer. Detailed information on
the clinical features of all patients and healthy controls in the
present study is summarized in Table
I. All procedures performed in studies involving human patients
were in accordance with the ethical standards of the institutional
and/or national research committee and with the 1964 Helsinki
declaration and its later amendments or comparable ethical
standards. The present study is a retrospective study in accordance
with ethics review regulations and was reviewed and approved by the
Ethics Committee, Sun Yat-sen Memorial Hospital, Sun Yat-sen
University (Guangzhou, China) on December 26th, 2015.
 | Table I.Associations between DEPDC1B
expression and clinicopathological characteristics of patients with
prostate cancer in the TMA and Taylor database. |
Table I.
Associations between DEPDC1B
expression and clinicopathological characteristics of patients with
prostate cancer in the TMA and Taylor database.
|
| TMA | Taylor |
|---|
|
|
|
|
|---|
| Clinical
features | Total patients,
n | Low, n (%) | High, n (%) | P-value | Total patients, n
(mean ± SD) | P-value
(χ2 test) |
|---|
| Tissue |
|
|
|
|
|
|
|
Cancer | 69 | 31 (44.9) | 38 (55.1) | 0.012 | 150
(6.35±0.27) | <0.001 |
|
Benign | 6 | 6
(100.0) | 0 (0.0) |
| 29
(6.18±0.14) |
|
| Age |
|
|
|
|
|
|
| ≤60
years | 16 | 10 (62.5) | 6
(37.5) | 0.271 | 93
(6.36±0.28) | 0.950 |
| >60
years | 59 | 27 (45.8) | 32 (54.2) |
| 57
(6.36±0.26) |
|
| PSA level |
|
|
|
|
|
|
| ≤4
ng/ml | – | – | – | – | 34
(6.29±0.24) | 0.149 |
| >4
ng/ml | – | – | – |
| 113
(6.36±0.26) |
|
| Gleason score |
|
|
|
|
|
|
|
<7 | – | – | – | – | 41
(6.25±0.19) | <0.001 |
| =7 | – | – | – |
| 76
(6.31±0.18) |
|
|
>7 | – | – | – |
| 22
(6.59±0.40) |
|
| Pathological
grade |
|
|
|
|
|
|
| ≤2 | 22 | 10 (45.5) | 12 (54.5) | 0.604 | 86
(6.26±0.17) | <0.001 |
|
>2 | 44 | 20 (45.5) | 24 (54.5) |
| 55
(6.44±0.32) |
|
| Clinical stage |
|
|
|
|
|
|
| I | 42 | 25 (59.5) | 17 (40.5) | 0.006 | 80
(6.33±0.24) | 0.022 |
| II | 25 | 6
(24.0) | 19 (76.0) |
| 58
(6.31±0.24) |
|
|
III |
|
|
|
| 6
(6.47±0.34) |
|
| IV |
|
|
|
| 1
(7.01±0.00) |
|
| T stage |
|
|
|
|
|
|
|
T1-T2 | 44 | 25 (56.8) | 19 (43.2) | 0.021 | – | – |
|
T3-T4 | 24 | 6
(25.0) | 18 (75.0) |
| – |
|
| Lymph node
metastasis |
|
|
|
|
|
|
| N0 | 56 | 30 (53.6) | 26 (46.4) | 0.004 | 105
(6.30±0.20) | <0.001 |
| N1 | 12 | 1 (8.3) | 11 (91.7) |
| 16
(6.67±0.41) |
|
| Distant
metastasis |
|
|
|
|
|
|
| M0 | 60 | 30 (50.0) | 30 (50.0) | 0.063 | 122
(6.27±0.18) | <0.001 |
| M1 | 8 | 1
(12.5) | 7
(87.5) |
| 28
(6.69±0.34) |
|
| Biochemical
recurrences |
|
|
|
|
|
|
|
Negative | – | – | – | – | 104
(6.27±0.18) | <0.001 |
|
Positive | – | – | – |
| 36
(6.51±0.33) |
|
Immunohistochemical analysis
(IHC)
The specimens were fixed in 10% neutral buffered
formalin at room temperature for 12 h and subsequently embedded in
paraffin. The paraffin-embedded tissues were cut into 4 µm sections
and then deparaffinized with xylene and rehydrated (100% ethanol
twice for 10 min, 95% ethanol for 5 min, 80% ethanol for 5 min and
70% ethanol for 5 min) for blocking of endogenous peroxidase
activity, 3,3′-diaminobenzidine (DAB) staining and IHC using the
Dako EnVision system (Dako; Agilent Technologies, Inc., Santa
Clara, CA, USA). Following a brief proteolytic digestion (0.1%
trypsin; no. ZLI9010; Beijing Zhongshan Golden Bridge Biotechnology
Co., Ltd., Beijing, China) and peroxidase blocking (3%
H2O2, no. HPBIO-JX170, HePeng Biology,
Shanghai, China) at 37°C for 10 min, tissue slides were incubated
with the primary antibody against DEPDC1B (rabbit polyclonal
antibody, cat. no. bs-14278R; BIOSS, Beijing, China) at a dilution
of 1:600 at 4°C overnight. Following washing (PBS for 5 min, 3
times), peroxidase-labeled polymer mouse anti-rabbit antibodies
(cat. no. 3678S; Cell Signaling Technology, Inc., NY, USA;
1:20,000; at 37°C for 1 h or at 4°C overnight) and
substrate-chromogen staining (DAB, no. 9018, Beijing Zhongshan
Golden Bridge Biotechnology Co., Ltd., Beijing, China) were
employed in order to visualize the protein. Negative controls were
performed by omitting the primary antibody.
Evaluation of immunostaining
results
The intensity of immunostaining was scored
separately by two independent experienced pathologists, who were
blinded to the clinicopathological data and clinical outcomes of
the patients. The scores of the two pathologists were compared and
any discrepancies were resolved through re-examination of the
staining by the two pathologists to achieve a consensus score. The
immunolabeling of cancer cells was then evaluated. The number of
positive-staining cells in five representative fields at 400-fold
were counted under an inverted microscope and the percentage of
positive cells was also calculated. According to the antibody
specification sheet, cytoplasmic staining was regarded as positive
signals. The semi-quantitative scoring of the expression intensity
in each sample was performed according to a previous study and was
based on the staining intensity and percentage (16). The staining intensity was visually
scored and stratified according to the following criteria: No
staining, 0 points; mild staining, 1 point; moderate staining, 2
points and strong staining, 3 points. The score for the percentage
of immunoreactive tumor cells was defined as follows: <5%, 0
points; 6–25%, 1 point; 26–50%, 2 points; 51–75%, 3 points and
>75%, 4 points. The final immunoreactivity scores (IRS) of each
sample was calculated by adding the two scores for the
immunostaining intensity and immunostaining percentage. An IRS
score <4 was defined as low expression and ≥4 was defined as
high expression.
Assays of levels of DEPDC1B mRNA and
protein in prostate cell lines
Normal prostate epithelial cell (RWPE1),
androgen-dependent prostatic carcinoma cell (LNcap) and
androgen-independent prostatic carcinoma cells (DU145 and PC-3)
were used in the present study. RWPE1, LNcap, DU145 and PC-3 cell
lines were obtained from the Center for Experimental Animals of Sun
Yat-Sen University. The cells were maintained in RPMI-1640 (Gibco;
Thermo Fisher Scientific, Inc., Waltham, MA, USA) supplemented with
10% fetal bovine serum, 1% penicillin and streptomycin (all
Invitrogen; Thermo Fisher Scientific, Inc.). The RWPE1 cell line
was maintained in complete keratinocyte serum-free medium
supplemented with 50 mg/ml bovine pituitary extract and 5 ng/ml
epidermal growth factor (all Gibco; Thermo Fisher Scientific,
Inc.). All cell lines were cultivated in a humidified incubator at
37°C with 5% CO2. Total RNA was extracted from cultured
prostate cells (~5×10⁶ cells), including LNcap, DU145,
PC3 and RWPE-1. The Invitrogen SuperScript III First-Strand System
(Invitrogen; Thermo Fisher Scientific, Inc.) was used for reverse
transcription (RT) with random primers [Hexadeoxyribonucleotide
mixture; pd (N)6; cat. no. 3801; Takara Biotechnology Co., Ltd.,
Dalian, China]. Quantitative polymerase chain reaction analysis was
performed with SYBR Premix ExTaq (Takara RR820A; Takara
Biotechnology Co., Ltd.). Real-time PCR primers were as follows:
DEPDC1B forward, 5′-AGCTACCAGGCTGTGGAATG-3′ and reverse,
5′-AGCTCTTGAAACGACAGCGA-3′; GAPDH forward,
5′-TGGTCGTATTGGGCGCCTGGT-3′ and reverse,
5′-TCGCTCCTGGAAGATGGTGA-3′. Amplification was achieved using the
following protocol: 48°C for 30 min, 95°C for 1 min followed by 40
cycles at 95°C for 15 sec, 52°C for 30 sec and 72°C for 30 sec. The
relative mRNA expression levels of DEPDC1B were normalized to GAPDH
mRNA. The results were calculated using the 2−∆∆Cq
method (17). Cell lysates were
prepared and subjected to immunoblot analysis of DEPDC1B protein.
Cells (~1×10⁷) were washed twice with ice-cold PBS,
lysed with RIPA Lysis Buffer (no. P0013B; Beyotime Institute of
Biotechnology, Haimen, China) and complete protease inhibitor
cocktail (no. B14001a; Selleck, Shanghai, China) on ice for 30 min
and then cleared by centrifugation at 9,500 × g at 4°C for another
30 min. The total protein concentration in the extracts were
evaluated utilizing a BCA protein assay kit (Beyotime Institute of
Biotechnology). Equal amounts (30 µg) of protein were separated by
SDS-PAGE and transferred to a polyvinylidene fluoride membrane (EMD
Millipore, Billerica, MA, USA). The membranes were blocked with 5%
bovine serum albumin or non-fat dry milk in TBST at room
temperature for 1 h and then probed with antibodies against DEPDC1B
(no. bs-14278R; 1:1,000; BIOSS) and GAPDH (no. 2118; 1:20,000; Cell
Signaling Technology, Inc.). The relative protein intensities of
DEPDC1B to loading control GAPDH were quantified using Image J
software (v2.1.4.7; National Institutes of Health, Bethesda, MD,
USA).
Statistical analysis
SPSS 22.0 software (IBM SPSS, Armonk, NY, USA) was
used for Statistical analysis. Data are presented as the mean ±
standard deviation. All of the P-values were two-sided and
P<0.05 was considered to indicate a statistically significant
difference. Pearson's χ2 test and Fisher's exact test
were used to analyze the association of DEPDC1B expression with
clinicopathological characteristics. Overall survival time and BCR
survival time were analyzed using the Kaplan-Meier method, and
differences were assessed using the log-rank test. Receiver
operating characteristic curves (ROC) revealed that the cut off of
DEPDC1B mRNA levels was 6.193 and the area under the ROC was 0.732
(P<0.001). A DEPDC1B mRNA level ≥6.193 was defined as high
expression and <6.193 was defined as low expression. Univariate
analysis comparisons and multivariate survival comparisons were
performed using Cox proportional hazard regression models. The
relative risks of mortality were expressed as adjusted hazard
ratios (HRs) and their corresponding 95% confidence intervals
(CIs). P<0.05 was considered to indicate a statistically
significant difference.
Results
DEPDC1B protein is upregulated in
tumor tissues of patients with PCa
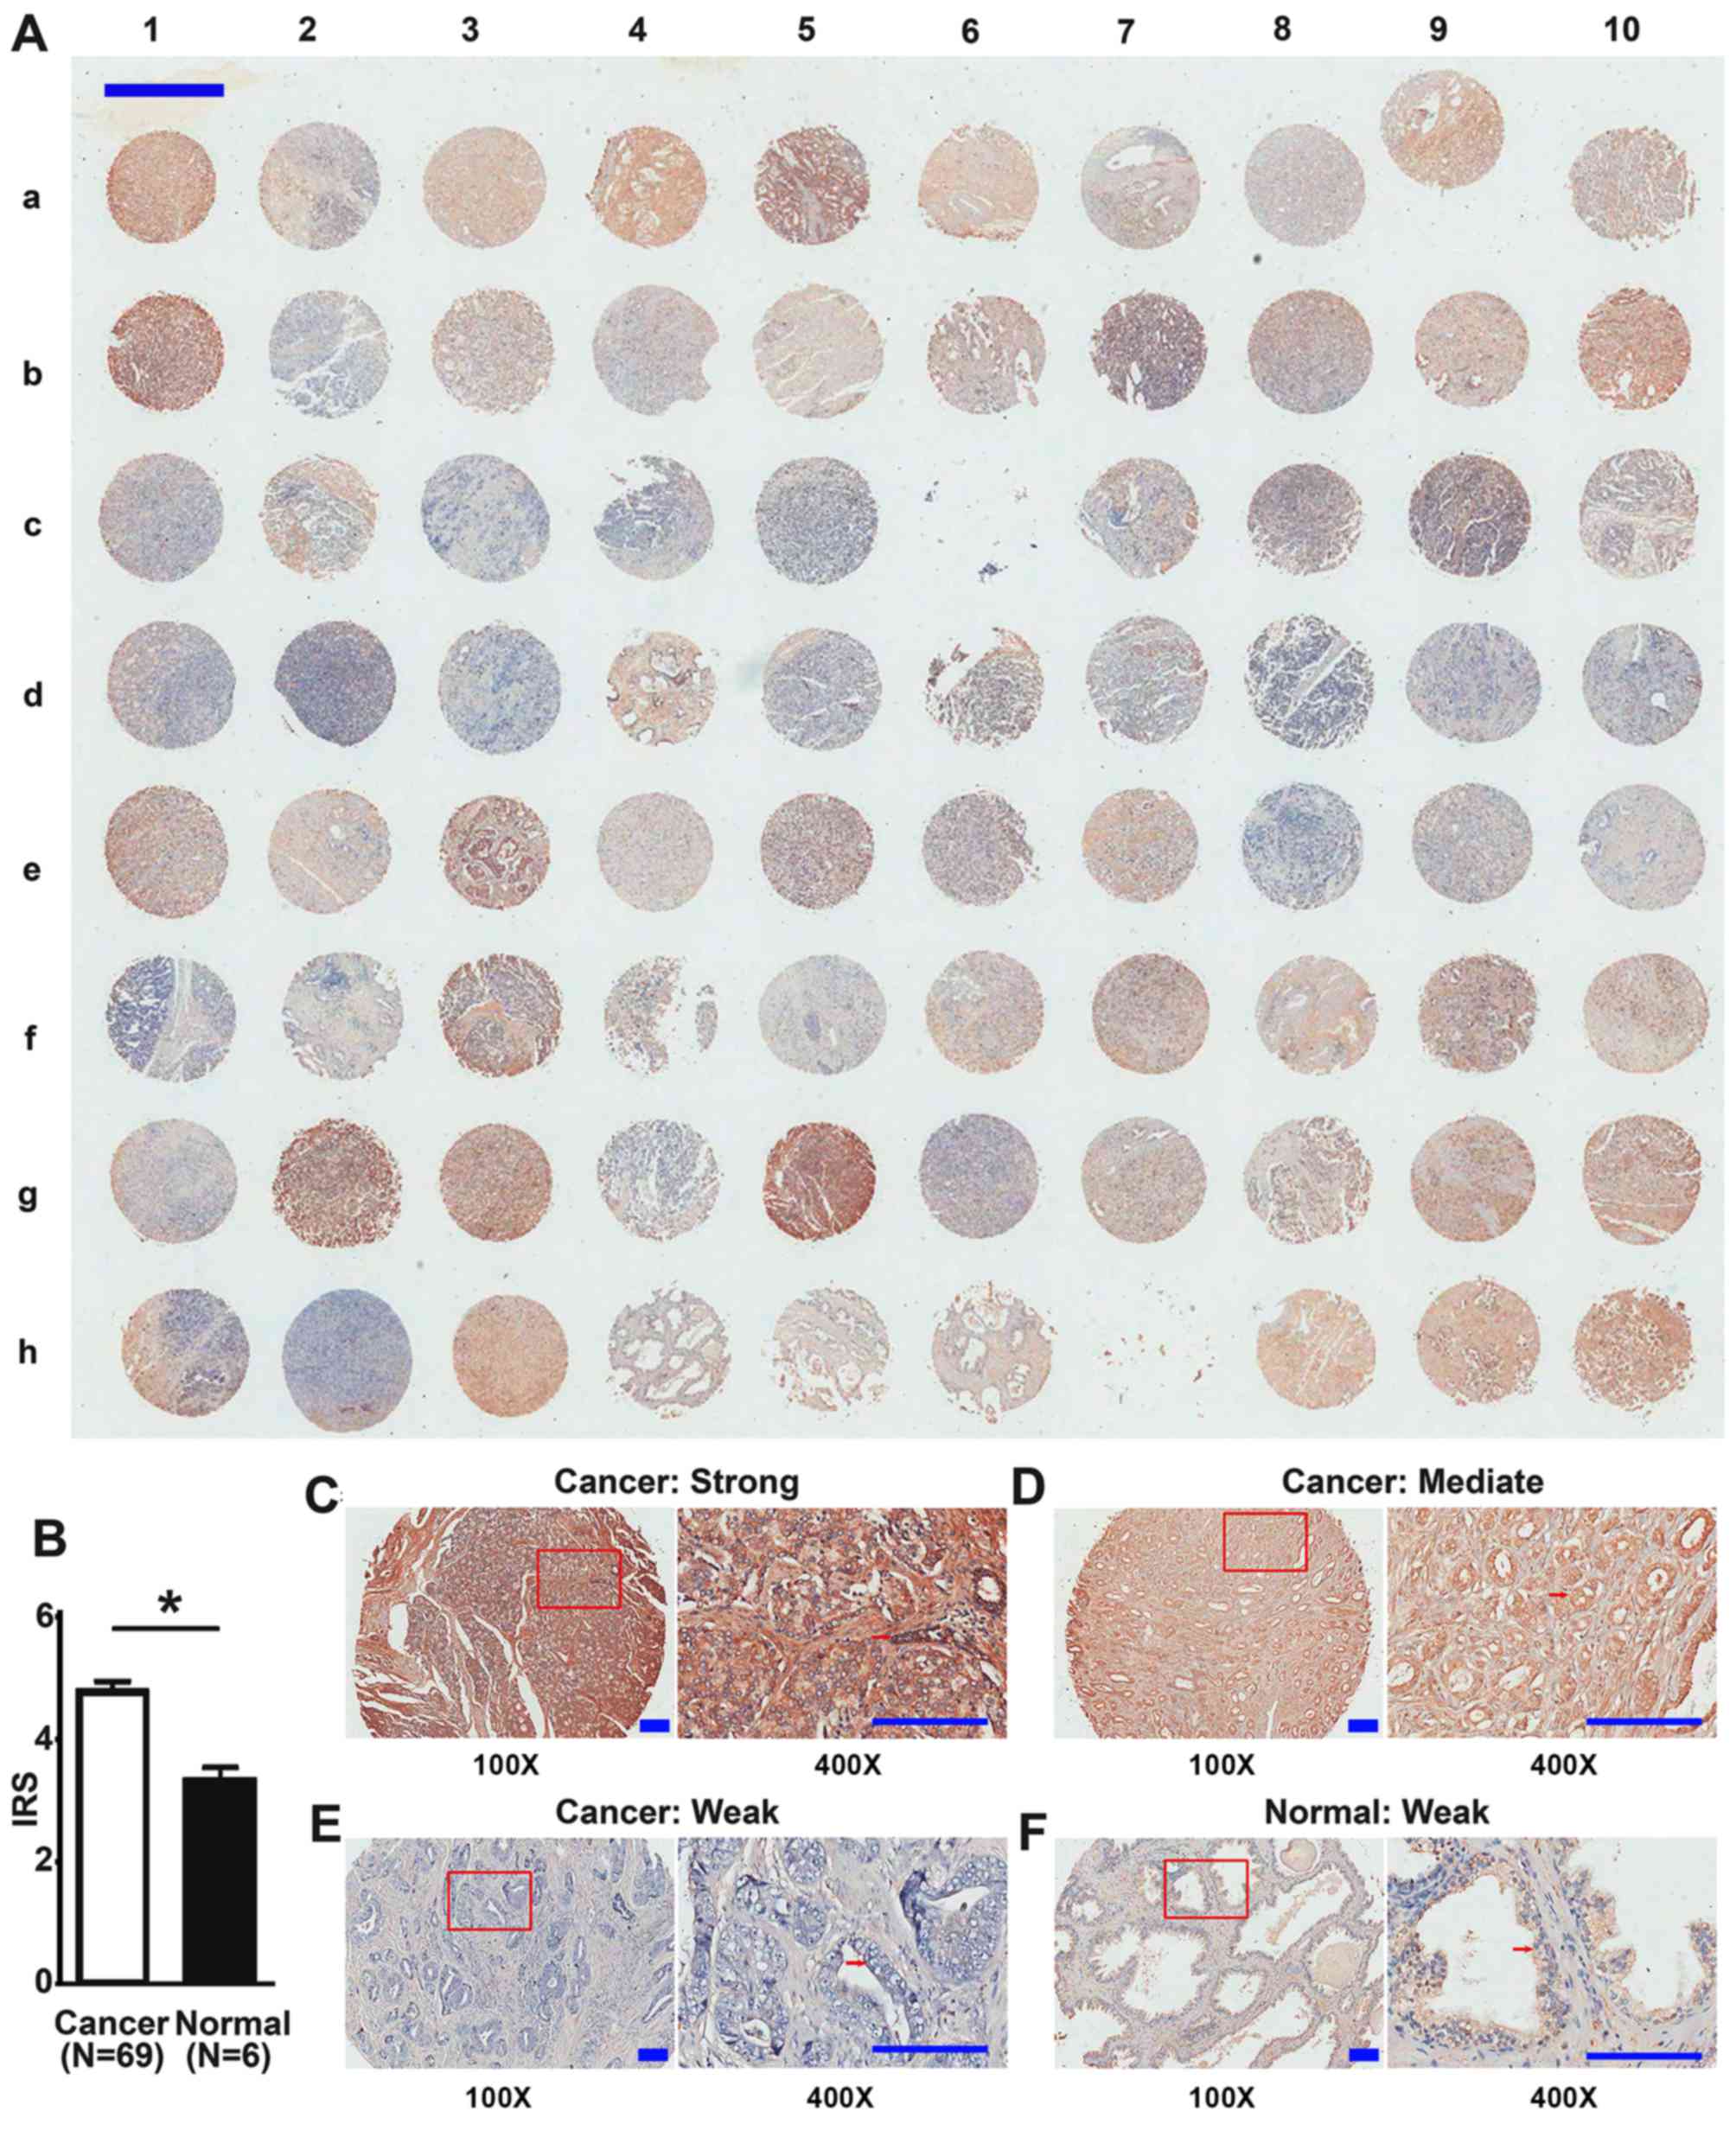
The expression of DEPDC1B protein was detected in
the TMA by IHC (Table I). There were
80 samples in total, and 2 samples of prostatic sarcomas and 2 lost
samples were not included in the analyses. There was strong
expression of DEPDC1B in the cytoplasm of cancer cells from tumor
tissues, but weak expression in luminal epithelial cells of
adjacent normal prostate tissues from patients with PCa and normal
prostate tissues from healthy donors (Fig. 1). Of the 69 tumor tissue samples, 17
(24.6%) demonstrated low levels, while 52 (75.4%) high levels of
DEPDC1B. Furthermore, the expression levels of DEPDC1B in tumor
tissues were significantly increased compared with normal prostate
tissues (4.78±1.47 and 3.33±0.51, respectively; P=0.039; Fig. 1).
Immunostaining results were analyzed using the
limited clinical information of the TMA. The results revealed that
the overexpression of DEPDC1B protein was significantly associated
with advanced clinical stage (P=0.006; Table I), advanced T stage (P=0.012; Table I) and lymph node metastasis (P=0.004;
Table I). However, high levels of
DEPDC1B were not associated with age, pathological grade and
distant metastasis (P>0.05; Table
I).
Increased expression of DEPDC1B mRNA
is associated with the aggressive progression and poor prognosis of
PCa in the Taylor dataset
To validate the results of the present cohort, a
publicly available dataset (Taylor dataset) consisting of 150
prostate tissues with mRNA micro-array expression data for
protein-coding genes (mRNA) was used. DEPDC1B mRNA was upregulated
in tumor tissue samples from patients with PCa with a high Gleason
score (P<0.001; Table I), advanced
pathological stage (P<0.001; Table
I), high lymph node metastasis (P<0.001; Table I), high distant metastasis
(P<0.001; Table I) and high rate
of biochemical recurrence (P<0.001; Table I).
DEPDC1B serves as an independent
prognostic factor for the survival time of patients with PCa
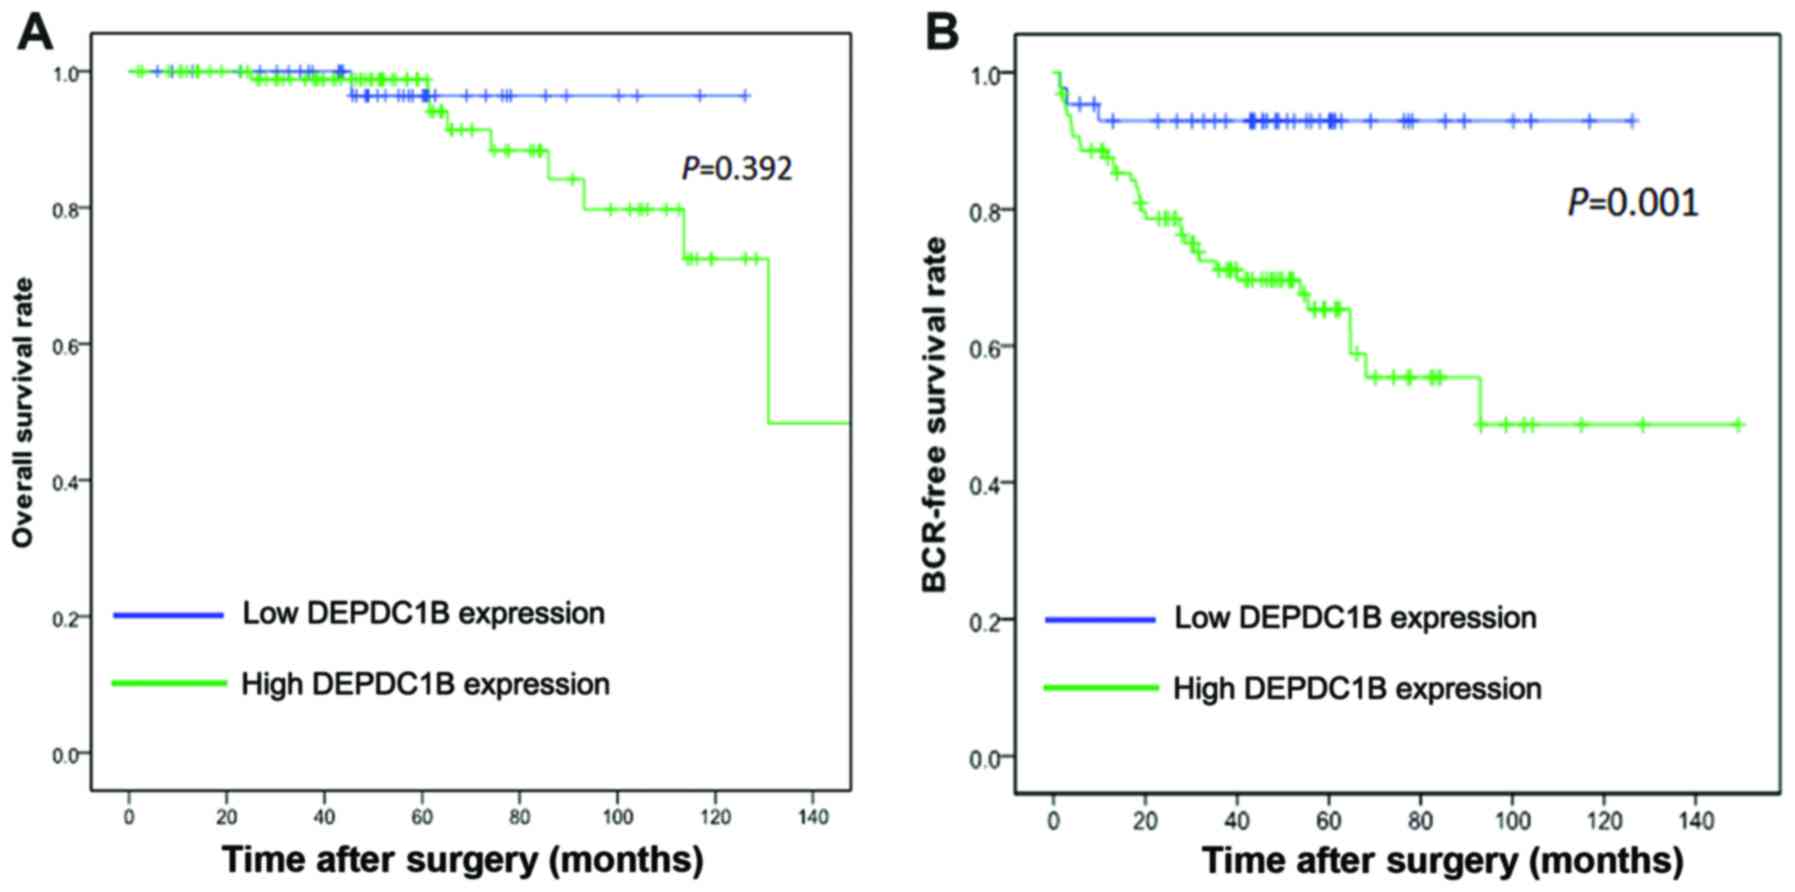
The association of DEPDC1B expression with the
survival time of patients with PCa was analyzed by Kaplan-Meier
plots and the Taylor dataset. The BCR-free survival times of
patients with PCa with high levels of DEPDC1B mRNA expression were
significantly shorter compared with those with low levels of
DEPDC1B mRNA expression (P=0.001), although no significant
difference in their overall survival rate was observed (P=0.392;
Fig. 2). As the present data
indicated a mortality rate of <50%, it was not possible to
calculate median survival time. In addition, univariate analysis
revealed that expression levels of DEPDC1B mRNA were significant
prognostic factors for BCR-free survival times of patients with PCa
(HR, 5.503; 95% CI, 1.687–17.952; P=0.005; Table II). Multivariate analysis using Cox
proportional hazards model revealed that high levels of DEPDC1B
mRNA expression were significant independent prognostic factors for
patients with PCa (HR, 4.285; 95% CI 1.257–14.609; P=0.020;
Table II). However, PSA is not
cancer-specific, and as a biomarker has caused over-diagnosis
(18). PSA demonstrated no
statistical significance in Cox model analysis (Table II). Since the Taylor dataset used in
the present study contained no information associated with the PSA
free/total (F/T) ratio, it was not possible to explore the
potential of the PSA F/T ratio for prognosis prediction.
| Table II.Prognostic value of DEPDC1B
expression for BCR-free survival, assessed by Cox proportional
hazards model. |
Table II.
Prognostic value of DEPDC1B
expression for BCR-free survival, assessed by Cox proportional
hazards model.
|
| BCR-free
survival |
|---|
|
|
|
|---|
| Clinical features
and DEPDC1B expression | HR (95% CI) | P-value |
|---|
| Univariate
analysis |
|
|
| Age,
≤60 vs. >60 years | 1.055
(0.539–2.066) | 0.875 |
| PSA
level, ≤4 vs. >4 ng/ml | 1.588
(0.658–1.588) | 0.304 |
| Gleason
score, <7 vs. =7 vs. >7 | 7.361
(4.025–13.46) | <0.001 |
|
Pathological stage, pT2 vs.
pT3/4 | 5.232
(2.564–10.68) | <0.001 |
|
Clinical stage, ≤T2a vs. T2b
vs. ≥T2c | 0.943
(0.822–2.559) | 0.831 |
| Distant
metastasis, M0 vs. M1 | 21.15
(10.27–43.54) | <0.001 |
| Lymph
node metastasis, N0 vs. N1 | 9.179
(4.428–19.03) | <0.001 |
| DEPDC1B
expression, low vs. high | 5.503
(1.687–17.95) | 0.005 |
| Multivariate
analysis |
|
|
| Age,
≤60 vs. >60 years | 0.697
(0.264–1.838) | 0.465 |
| PSA
level, ≤4 vs. >4 ng/ml | 0.546
(0.235–1.269) | 0.160 |
|
Clinical stage, ≤T2a vs. T2b
vs. ≥T2c | 0.855
(0.454–1.612) | 0.628 |
| Gleason
score, <7 vs. =7 vs. >7 | 7.824
(3.777–16.21) | <0.001 |
| DEPDC1B
expression, low vs. high | 4.285
(1.257–14.61) | 0.020 |
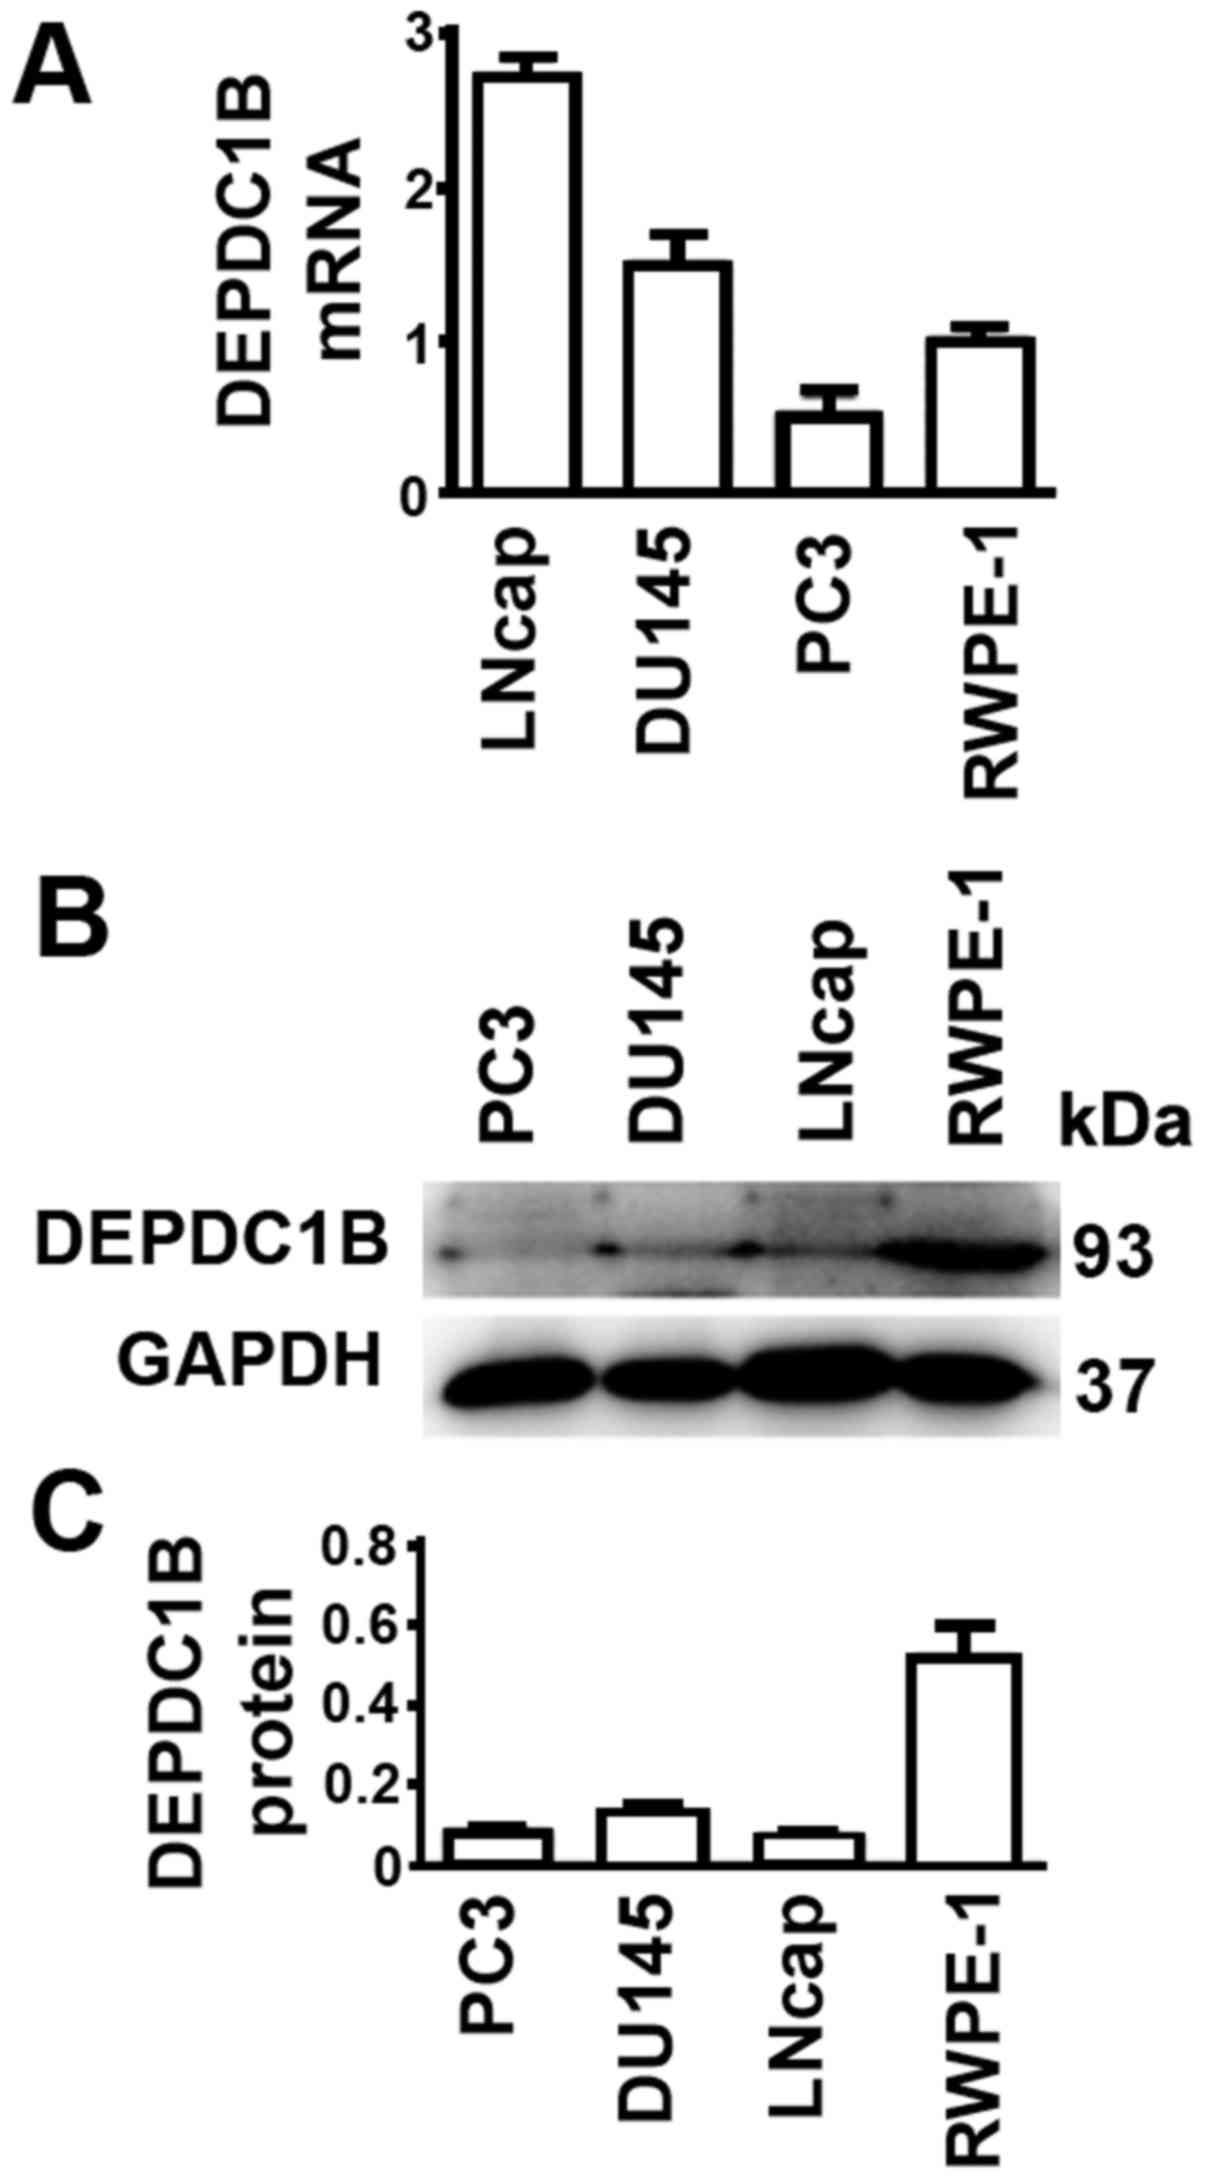
DEPDC1B protein and mRNA levels are
not consistent in cultured cells
It would be ideal to obtain data about the
expression levels of mRNA and protein in all patient tissue
samples. However, such datasets were unavailable. Therefore, the
expression levels of prostate cell lines were examined. The PCa
DU145 and LNCap cell lines had higher DEPDC1B mRNA levels, while
PC3 had lower DEPDC1B mRNA levels, compared with the normal
prostate RWPE-1 cell line (Fig. 3A).
In contrast, protein levels of all three PCa cell lines were lower
than those in RWPE-1 cells (Fig. 3B and
C). Thus, the results from cultured cells were unable to
reflect the expression levels of DEPDC1B in tissue samples of
patients with PCa.
Discussion
Patients may have different clinical courses with
similar clinicopathological characteristics when being treated with
the same therapy, indicating that the value of current diagnostic
markers is limited. Thus, it is important to identify novel
biomarkers for the treatment of patients with PCa, as such markers
may help to establish personalized treatment for each individual
patient.
To the best of our knowledge, the present study is
the first to investigate the association between DEPDC1B levels and
clinical features of patients with PCa. Three main results were
obtained by the present study. First, IHC was used to detect
DEPDC1B protein levels in prostate tissues from patients with PCa,
and DEPDC1B protein levels were revealed to be higher in prostate
cancer tissues compared with their adjacent non-cancerous or normal
tissues. Second, to the best of our knowledge, the present study
was the first to describe a significant association between DEPDC1B
levels and Gleason score, clinical or pathological stage, lymph
node metastasis and distant metastasis of patients with PCa. Third,
DEPDC1B mRNA levels were demonstrated to be significantly
associated with the BCR-free survival time of patients with PCa.
Kaplan-Meier analyses revealed that overexpression of DEPDC1B mRNA
was associated with a significantly shorter BCR-free survival time,
indicating that high levels of DEPDC1B mRNA are biomarkers for
short BCR-free survival times of patients with PCa. Multivariate
analysis revealed that upregulation of DEPDC1B mRNA was a predictor
of shorter BCR-free survival time independent from Gleason score.
The results from the present study suggested that DEPDC1B may be
involved in the aggressiveness of PCa, and may provide useful
information to help clinicians establish personalized treatment
regimens for patients.
Previous expression profiling of DEPDC1B mRNA in
MDA-MB 231 human breast cancer cells revealed an association with a
reduction in cell death and an increase in cell proliferation
(12). DEPDC1B was also overexpressed
in patients with oral cancer, and promoted cell migration and
induced cell invasion in oral cancer cell lines (13). In addition, high levels of DEPDC1B
expression contributed to metastasis-associated malignant
phenotypes in non-small cell lung cancer (14). Although high levels of DEPDC1B
expression were demonstrated in those types of cancer, it is not
possible to consider them as independent prognostic factors. The
present study demonstrated that DEPDC1B may be a good marker for
the diagnosis or prognosis of PCa. The high expression of DEPDC1B
in 75.4% of prostate tissues from patients with PCa and little or
no expression in normal prostate tissues suggested that an
anti-DEPDC1B therapy would have minimal toxicity to normal prostate
cells; and DEPDC1B expression levels demonstrated a significant
association with BCR-free survival times of patients with PCa.
Despite the present understanding of the oncogenic
function of DEPDC1B in prostate progression, it remains to be
clarified how DEPDC1B, either directly or indirectly, affects the
prognosis of patients with PCa. DEPDC1B protein contains DEP and
RhoGAP conserved domains, which are involved in Rho GTPase
signaling (19). Rho GTPases are best
known for their regulation of cytoskeletal dynamics (20,21). As
major components of Rho GTPase signaling, Rho GTPase proteins,
including ras homolog family member A (RHOA), ras-related C3
botulinum toxin substrate 1 (RAC1) and cell division cycle 42
(CDC42) are primarily activated by guanine nucleotide exchange
factors (GEFs) and inactivated by GTPase-activating proteins
(22–24). RAC1 and CDC42 regulate the formation
of lamellipodia and filopodia, respectively, and promote protrusive
activities; whereas RHOA regulates the formation of stress fibers
and contractile rings (25). The
stress fibers and the contractile rings are formed by actomyosin
bundles with antiparallel actin filaments cross-linked by myosin
(23). RHOA regulates these
structures through the stimulation of actin polymerization and
activation of myosin (26). Exogenous
expression of DEPDC1B suppressed RAC1 activation, but did not
markedly affect the activation of RHOA or CDC42 (27). Previous data indicated that actin is
involved in the early stages of autophagosome formation (28,29). In
addition, RHOA and RAC1 were demonstrated to be involved in
starvation-mediated autophagy, but serve opposite functions
(30). Notably, autophagy marker LC3
binds to SOS Ras/Rac guanine nucleotide exchange factor 1 (SOS1), a
GEF for RAC1, and inhibits the GEF activity of SOS1 to block RAC1
activation (31). Taken together,
signals involved in the autophagic pathway and the RAC signaling
pathway are mutually regulated (27).
Therefore, it was suggested that different levels of DEPDC1B may
affect the prognosis of patients with PCa through regulation of
autophagy.
At present, due to the effect of patient age,
prostate tumor size or other prostatic tissues in patients with
PCa, the value of PSA as a general biomarker is judged with
skepticism (32,33). The Gleason score has been demonstrated
to be one of the reliable parameters for prediction of PCa
progression (34). The present study
demonstrated that levels of DEPDC1B expression may serve as an
indicator for PCa BCR-free survival time, independent from Gleason
scores. Additional tests concerning DEPDC1B may result in improved
PCa treatment if it is able to distinguish patients who require
additional treatment from those who only require monitoring.
However, whether the assay is reproducible in other patients
remains unknown. Since the data associated with protein and mRNA
expression in the TMA and Taylor datasets was not matched, whether
DEPDC1B protein is a prognosis marker remains inconclusive.
Notably, PCa cell lines had lower DEPDC1B protein levels compared
with the normal prostate cell line. It is possible that an unknown
factor was suppressed in the tumor tissues but activated to a
greater degree in cancer cell lines compared with the normal cell
line. High levels of mRNA resulted in high levels of protein in
tumor tissue samples, as expected. However, the unknown factor may
have been more activated in PCa cell lines compared with the normal
cell line, leading to faster degradation of the DEPDC1B protein and
relatively lower levels of DEPDC1B protein in PCa cell lines
compared with the normal cell line. Our future study will
investigate this unknown factor. In addition, the data from the
present study were unable to support the conclusion that the
expression of DEPDC1B was a direct or indirect target of overall
survival time. Larger cohorts and multicenter studies with profiles
of protein and mRNA expression may demonstrate the significance and
reliability of such a biomarker more effectively, and additional
studies are required to decipher the mechanism by which DEPDC1B
impacts survival time.
In conclusion, the present study offered convincing
evidence for the first time that DEPDC1B protein was upregulated in
tumor tissues. DEPDC1B mRNA was an independent prognostic factor
for BCR-free survival time in patients with PCa. Overexpression of
DEPDC1B was associated with Gleason score, clinical or pathological
stage, lymph node metastasis and distant metastasis. The present
study provided additional understanding of the mechanisms
underlying PCa, which may be helpful for the development of an
effective therapeutic treatment.
Acknowledgements
The present study was supported by the National
Natural Science Foundation of China (grant nos. 81472382 and
81672550), the National Natural Science Foundation of China for
Young Scientists (grant no. 81101947), the Guangdong Province
Natural Science Foundation (grant no. 2014A030313079), the
Fundamental Research Funds for the Central Universities (grant no.
14ykpy19), Guangdong Province Science and Technology for Social
Development Project (grant no. 2013B021800107 and 2013B021800095),
2015 Guangzhou City Scientific Research Projects (grant no.
201510010298) and the International Science and Technology
Cooperation Project of Guangdong Province Science and Technology
Plan (grant no. 2016A050502020).
References
|
1
|
Siegel RL, Miller KD and Jemal A: Cancer
statistics, 2016. CA Cancer J Clin. 66:7–30. 2016. View Article : Google Scholar : PubMed/NCBI
|
|
2
|
Chen W, Zheng R, Baade PD, Zhang S, Zeng
H, Bray F, Jemal A, Yu XQ and He J: Cancer statistics in China,
2015. CA Cancer J Clin. 66:115–132. 2016. View Article : Google Scholar : PubMed/NCBI
|
|
3
|
Kristiansen G: Diagnostic and prognostic
molecular biomarkers for prostate cancer. Histopathology.
60:125–141. 2012. View Article : Google Scholar : PubMed/NCBI
|
|
4
|
Ferlay J, Parkin DM and Steliarova-Foucher
E: Estimates of cancer incidence and mortality in Europe in 2008.
Eur J Cancer. 46:765–781. 2010. View Article : Google Scholar : PubMed/NCBI
|
|
5
|
Shariat SF, Karakiewicz PI, Roehrborn CG
and Kattan MW: An updated catalog of prostate cancer predictive
tools. Cancer. 113:3075–3099. 2008. View Article : Google Scholar : PubMed/NCBI
|
|
6
|
Stephenson AJ, Scardino PT, Eastham JA,
Bianco FJ Jr, Dotan ZA, DiBlasio CJ, Reuther A, Klein EA and Kattan
MW: Postoperative nomogram predicting the 10-year probability of
prostate cancer recurrence after radical prostatectomy. J Clin
Oncol. 23:7005–7012. 2005. View Article : Google Scholar : PubMed/NCBI
|
|
7
|
Moyer VA: U.S. Preventive Services Task
Force: Screening for prostate cancer: U.S. preventive services task
force recommendation statement. Ann Intern Med. 157:120–134. 2012.
View Article : Google Scholar : PubMed/NCBI
|
|
8
|
Sokol S: A role for Wnts in morpho-genesis
and tissue polarity. Nat Cell Biol. 2:E124–E125. 2000. View Article : Google Scholar : PubMed/NCBI
|
|
9
|
Ballon DR, Flanary PL, Gladue DP, Konopka
JB, Dohlman HG and Thorner J: DEP-domain-mediated regulation of
GPCR signaling responses. Cell. 126:1079–1093. 2006. View Article : Google Scholar : PubMed/NCBI
|
|
10
|
Peck J, Douglas G IV, Wu CH and Burbelo
PD: Human RhoGAP domain-containing proteins: Structure, function
and evolutionary relationships. FEBS Lett. 528:27–34. 2002.
View Article : Google Scholar : PubMed/NCBI
|
|
11
|
Martemyanov KA, Lishko PV, Calero N,
Keresztes G, Sokolov M, Strissel KJ, Leskov IB, Hopp JA, Kolesnikov
AV, Chen CK, et al: The DEP domain determines subcellular targeting
of the GTPase activating protein RGS9 in vivo. J Neurosci.
23:10175–10181. 2003.PubMed/NCBI
|
|
12
|
Boudreau HE, Broustas CG, Gokhale PC,
Kumar D, Mewani RR, Rone JD, Haddad BR and Kasid U: Expression of
BRCC3, a novel cell cycle regulated molecule, is associated with
increased phospho-ERK and cell proliferation. Int J Mol Med.
19:29–39. 2007.PubMed/NCBI
|
|
13
|
Su YF, Liang CY, Huang CY, Peng CY, Chen
CC, Lin MC, Lin RK, Lin WW, Chou MY, Liao PH and Yang JJ: A
putative novel protein, DEPDC1B, is overexpressed in oral cancer
patients, and enhanced anchorage-independent growth in oral cancer
cells that is mediated by Rac1 and ERK. J Biomed Sci. 21:672014.
View Article : Google Scholar : PubMed/NCBI
|
|
14
|
Yang Y, Liu L, Cai J, Wu J, Guan H, Zhu X,
Yuan J and Li M: DEPDC1B enhances migration and invasion of
non-small cell lung cancer cells via activating Wnt/β-catenin
signaling. Biochem Biophys Res Commun. 450:899–905. 2014.
View Article : Google Scholar : PubMed/NCBI
|
|
15
|
Taylor BS, Schultz N, Hieronymus H,
Gopalan A, Xiao Y, Carver BS, Arora VK, Kaushik P, Cerami E, Reva
B, et al: Integrative genomic profiling of human prostate cancer.
Cancer Cell. 18:11–22. 2010. View Article : Google Scholar : PubMed/NCBI
|
|
16
|
Lin ZY, Huang YQ, Zhang YQ, Han ZD, He HC,
Ling XH, Fu X, Dai QS, Cai C, Chen JH, et al: MicroRNA-224 inhibits
progression of human prostate cancer by downregulating TRIB1. Int J
Cancer. 135:541–550. 2014. View Article : Google Scholar : PubMed/NCBI
|
|
17
|
Livak KJ and Schmittgen TD: Analysis of
relative gene expression data using real-time quantitative PCR and
the 2(-Delta Delta C(T)) method. Methods. 25:402–408. 2001.
View Article : Google Scholar : PubMed/NCBI
|
|
18
|
Jakobsen NA, Hamdy FC and Bryant RJ: Novel
biomarkers for the detection of prostate cancer. J Clin Urol. 9 2
Suppl:S3–S10. 2016. View Article : Google Scholar
|
|
19
|
Burchett SA: Regulators of G protein
signaling: A bestiary of modular protein binding domains. J
Neurochem. 75:1335–1351. 2000. View Article : Google Scholar : PubMed/NCBI
|
|
20
|
Ridley AJ: Rho GTPases and actin dynamics
in membrane protrusions and vesicle trafficking. Trends Cell Biol.
16:522–529. 2006. View Article : Google Scholar : PubMed/NCBI
|
|
21
|
Jaffe AB and Hall A: Rho GTPases:
Biochemistry and biology. Annu Rev Cell Dev Biol. 21:247–269. 2005.
View Article : Google Scholar : PubMed/NCBI
|
|
22
|
Schmidt A and Hall A: Guanine nucleotide
exchange factors for Rho GTPases: Turning on the switch. Genes Dev.
16:1587–1609. 2002. View Article : Google Scholar : PubMed/NCBI
|
|
23
|
Hall A: Rho GTPases and the control of
cell behaviour. Biochem Soc Trans. 33:891–895. 2005. View Article : Google Scholar : PubMed/NCBI
|
|
24
|
Spiering D and Hodgson L: Dynamics of the
Rho-family small GTPases in actin regulation and motility. Cell Adh
Migr. 5:170–180. 2011. View Article : Google Scholar : PubMed/NCBI
|
|
25
|
Takeya R, Taniguchi K, Narumiya S and
Sumimoto H: The mammalian formin FHOD1 is activated through
phosphorylation by ROCK and mediates thrombin-induced stress fibre
formation in endothelial cells. EMBO J. 27:618–628. 2008.
View Article : Google Scholar : PubMed/NCBI
|
|
26
|
Sipos A, Iván J, Bécsi B, Darula Z, Tamás
I, Horváth D, Medzihradszky KF, Erdődi F and Lontay B: Myosin
phosphatase and RhoA-activated kinase modulate arginine methylation
by the regulation of protein arginine methyltransferase 5 in
hepatocellular carcinoma cells. Sci Rep. 7:405902017. View Article : Google Scholar : PubMed/NCBI
|
|
27
|
Wu D, Zhu X, Jimenez-Cowell K, Mold AJ,
Sollecito CC, Lombana N, Jiao M and Wei Q: Identification of the
GTPase-activating protein DEP domain containing 1B (DEPDC1B) as a
transcriptional target of Pitx2. Exp Cell Res. 333:80–92. 2015.
View Article : Google Scholar : PubMed/NCBI
|
|
28
|
Köchl R, Hu XW, Chan EY and Tooze SA:
Microtubules facilitate autophagosome formation and fusion of
autophagosomes with endosomes. Traffic. 7:129–145. 2006. View Article : Google Scholar : PubMed/NCBI
|
|
29
|
Fass E, Shvets E, Degani I, Hirschberg K
and Elazar Z: Microtubules support production of starvation-induced
autophagosomes but not their targeting and fusion with lysosomes. J
Biol Chem. 281:36303–36316. 2006. View Article : Google Scholar : PubMed/NCBI
|
|
30
|
Aguilera MO, Berón W and Colombo MI: The
actin cytoskeleton participates in the early events of
autophagosome formation upon starvation induced autophagy.
Autophagy. 8:1590–1603. 2012. View Article : Google Scholar : PubMed/NCBI
|
|
31
|
Furuta S, Miura K, Copeland T, Shang WH,
Oshima A and Kamata T: Light Chain 3 associates with a Sos1 guanine
nucleotide exchange factor: Its significance in the Sos1-mediated
Rac1 signaling leading to membrane ruffling. Oncogene.
21:7060–7066. 2002. View Article : Google Scholar : PubMed/NCBI
|
|
32
|
Diamandis EP: Prostate cancer screening
with prostate-specific antigen testing: More answers or more
confusion? Clin Chem. 56:345–351. 2010. View Article : Google Scholar : PubMed/NCBI
|
|
33
|
Kirby R: The role of PSA in detection and
management of prostate cancer. Practitioner. 260:17–21, 3.
2016.PubMed/NCBI
|
|
34
|
Leapman MS, Cowan JE, Simko J, Roberge G,
Stohr BA, Carroll PR and Cooperberg MR: Application of a prognostic
gleason grade grouping system to assess distant prostate cancer
outcomes. Eur Urol. 71:750–759. 2017. View Article : Google Scholar : PubMed/NCBI
|