Introduction
Esophageal cancer is one of the leading causes of
cancer-associated mortalities in China (1,2).
Chemotherapy has been considered an essential method to treat
esophageal cancer. However, the efficacy of the chemotherapeutic
agents has been limited with rates between 11 and 35% (3–5).
Furthermore, to date, there is no ‘gold standard’ chemotherapy for
esophageal cancer. With the development of pharmacogenomics and
pharmacogenetics, tumor heterogeneity is considered to be a
significant factor that is responsible for the failure of
conventional chemotherapeutics (6,7). In
predictive biomarker studies, a number of genes have been reported
to predict response to chemotherapy for solid tumors, including
excision repair cross-complementation group 1 (ERCC1), breast
cancer type 1 gene (BRCA1) or ADP ribosylation factor like GTPase 6
interacting protein 5 (JWA) for cisplatin (8), BRCA1, tubulin β-3 class III (TUBB3) or
F-box and WD repeat domain containing 7 (FBW7) for docetaxel
(9–11), thymidylate synthetase (TS) for
fluorouracil (12), and
ribonucleotide reductase catalytic subunit M1 (RRM1) for
gemcitabine (13), murine double
minute 2 (MDM2) for etoposide (14)
and DNA topoisomerase 1 (TOP1) for irinotecan (15). Additionally, a few of the genes,
including BRCA1, JWA and TS, have been validated for their clinical
value in esophageal cancer (8,12).
However, the clinical value of the aforementioned biomarkers for
chemotherapeutic agents such as irinotecan (16), gemcitabine (5) and etoposide (17), which are not commonly used but exhibit
moderate activity for treating esophageal cancer, remains unclear.
Therefore, it is important to investigate practical methods, which
can be used to screen and identify appropriate biomarkers for
personalized therapy of esophageal cancer with chemotherapeutic
agents of which there are limited clinical application data
available.
The histoculture drug response assay (HDRA) is one
of a number of in vitro tests for chemosensitivity, which
allows the characteristics of the three-dimensional tissue
structure to be maintained (18).
HDRA has the advantage of being able to maintain three-dimensional
tissue structure and may be able to more accurately mimic the in
vivo response compared with a cell culture model (18,19). The
clinical reliability and utility of HDRA have been examined in
several clinical studies for various solid tumors, including oral
squamous cell carcinoma, head and neck, gastric, colorectal and
ovarian cancer (20–22). Furthermore, HDRA has gradually been
applied to identify candidate genes or gene sets with the capacity
to predict efficiency of chemotherapeutic and targeted agents.
Therefore, in the present study, HDRA was employed to evaluate the
sensitivity of chemotherapeutic agents (cisplatin, docetaxel,
gemcitabine, etoposide, fluorouracil and irinotecan) in tumor
tissues, and the quantitative reverse transcription polymerase
chain reaction method was performed to detect the mRNA expression
of ERCC1, BRCA1, TUBB3, FBW7, RRM1, MDM2, TS and TOP1.
Additionally, the present study verified the predictive value of a
potential biomarker in patients with advanced esophageal
cancer.
Patients and methods
Patients and sample collection
All patients and relevant clinical data were
obtained from the Huai'an First People's Hospital, Nanjing Medical
University (Huai'an, China) from May 2012 to June 2013. The median
age was 62, and the majority of patients were male. Written
informed consent for the use of tissue specimens was obtained from
all patients, and the protocols for the present study were approved
by the Ethics Committee of Huai'an First People's Hospital, Nanjing
Medical University.
The surgically resected tumor specimens were
obtained from 49 patients. Each specimen was divided into three
parts. One part of the specimens was kept in 4°C Hanks' balanced
salt solution with 1% penicillin/streptomycin, and HDRA was
employed to measure inhibition rates of chemotherapeutic agents
in vitro within 15 min. Another part of the specimen was
fixed by 10% formalin for 24 h at room temperature and embedded
with paraffin for pathological observation. The rest of the tissue
was stored in −80°C for further detection of gene expression.
The paraffin-embedded tumor materials were collected
from 72 cases with advanced esophageal cancer that received
cisplatin-fluorouracil (cisplatin 25 mg/m2 on day 1–3;
fluorouracil 500 mg/m2 on day 1–5) or
docetaxel-fluorouracil (docetaxel 60–75 mg/m2;
fluorouracil 500 mg/m2 on day 1–5) chemotherapy.
Chemotherapy was repeated every 3–4 weeks for a maximum of six
cycles unless patients had disease progression or in unsupportable
adverse reactions.
HDRA
HDRA procedures were performed as previously
described by Furukawa et al (18). Cancerous portions of specimens were
washed three times with Hank's balanced salt solution and divided
into ~10 mg pieces. Then, the tissue fragments were placed on
prepared collagen sponge surfaces (Health Design, Rochester, NY,
USA) in 24-well plates and incubated for 6 days in RPMI 1640 medium
(Gibco; Thermo Fisher Scientific, Inc., Waltham, MA, USA)
supplemented with 20% fetal bovine serum (Gibco; Thermo Fisher
Scientific, Inc.) at 37°C in 5% CO2. The concentration
of each agent was determined by a preliminary experiment with 25%
growth inhibition (IC25 value) as follows: 100 µg/ml for
cisplatin, 30 µg/ml for docetaxel (Jiangsu Hengrui Medicine Co.,
Ltd., Nanjing, China), 10 µg/ml for fluorouracil, 30 µg/ml for
gemcitabine, 10 µg/ml for etoposide and 10 µg/ml for irinotecan
(Jiangsu Haosen Medicine Company, Nanjing, China).
Following histoculture, 100 µl Hank's balanced salt
solution containing 0.1 mg/ml type I collagenase (Sigma-Aldrich;
Merck KGaA, Darmstadt, Germany) and 100 µl MTT solution (2 mg/ml)
were added to each well. The plates were incubated at 37°C for
another 24 h. Following extraction with dimethyl sulfoxide, the
absorbance of the solution in each well was measured with
microplate reader at 540 nm. Absorbance per gram of cultured tumor
tissue was calculated from the mean absorbance from 8 parallel
culture wells, and the weight of tumor tissue was determined prior
to culture. The inhibition rate (IR) was calculated using the
following formula: IR=(1-T/C) ×100%, where T is the mean absorbance
of the treated tumor/weight, and C is the mean absorbance of the
control tumor/weight.
Quantitative reverse transcription
polymerase chain reaction (RT-qPCR)
Frozen tissues (~10 mg/per sample) were grinded in
liquid nitrogen, and the total RNA was extracted by using the
TRIzol reagent (Invitrogen; Thermo Fisher Scientific, Inc.). For
paraffin-embedded tumor specimens, micro-dissection was performed
to ensure serial sections of 7 mm in thickness with >80% of
tumor cells. The pellet of micro-dissected cells was resuspended in
Trizol reagent supplemented with proteinase K to extract RNA. Then
RNA was reverse-transcribed with FastQuant RT kit (Tiangen Biotech
Co., Ltd., Beijing, China). Each sample was detected in triplicate
with RNase-free water, and commercial RNA as negative and positive
control. Template cDNA was amplified with specific primers for
different genes with the SuperReal PreMix Plus (Tiangen Biotech
Co., Ltd., Beijing, China) by using the Real-Time PCR Detection
system (Roche Applied Science Madison, WI, USA). The sequences of
the primers are provided in Table I.
Relative gene expression quantification was calculated using the Cq
method. Final values were determined by the formula
2−ΔΔCq and were analyzed with the Stratagene analysis
software (version Mx3000P; Agilent Technologies, Inc., Santa Clara,
CA, USA).
 | Table I.Primer sequences used for gene
analysis. |
Table I.
Primer sequences used for gene
analysis.
| Genes | Forward primer
(5′-3′) | Reverse primer
(5′-3′) |
|---|
| ERCC1 |
ACCCCTCGACGAGGATGA | GATGGC
ATATTCGGCGTAGGT |
| BRCA1 |
TCCCATCTGTCTGGAGTTGA |
GCCCTTTCTTCTGGTTGAGA |
| TUBB3 |
GCAGTCGCAGTTTTCACACTC |
GCAGTCGCAGTTTTCACACTC |
| FBXW7 |
GGCCAAAATGATTCCCAGCAA |
ACTGGAGTTCGTGACACTGTTA |
| RRM1 |
AGCAGCCAAAGTATCTAGTTCCA |
AGCAGCCAAAGTATCTAGTTCCA |
| MDM2 |
TCGTCGGGTGAGGGTACTG |
AACCACTTCTTGGAACCAGGT |
| TS |
CTTCAGCGAGAACCCAGACC |
TCCAGCCCAACCCCTAAAGAC |
| TOP1 |
GAGAGCTGTAGCCCTGTACTTCATC |
CAGTGTCCGCTGTTTCTCCTT |
| β-actin |
CTCCATCCTGGCCTCGCTGT |
GCTGTCACCTTCACCGTTCC |
Statistical analysis
The Mann-Whitney U and Kruskal-Wallis tests were
used to analyze the association between inhibition rates of agents
or gene expression levels and clinical characteristics. The mean
value was employed as the cutoff point of gene levels to divide the
patients into low or high expression groups. The Mann-Whitney U
test was used to compare the inhibition rates between the two
groups. Clinical response was evaluated according to the Response
Evaluation Criteria in Solid Tumors (23). Overall survival (OS) was calculated
from the date of diagnosis to the date of last follow-up or
mortality from any cause. The distributions of OS were analyzed
using Kaplan-Meier method and compared with the two-sided log-rank
test. P<0.05 was considered to indicate a statistically
significant difference. Statistical analyses were performed by SPSS
19.0 software (IBM Corp., Armonk, NY, USA).
Results
Patient characteristics
Characteristics of all patients are shown in
Table II. In the HDRA cohort, all
patients were in stages II–III (24)
at the time of diagnosis. In the clinical cohort, the patients were
restricted to stages III–IV. In the clinical cohort, 34 patients
treated with cisplatin-fluorouracil-based chemotherapy with
response rate (RR) of 38.2% and median OS (mOS) of 13.2 [95%
confidence interval (CI), 11.3–17.0] months, while the other 38
patients received the docetaxel-fluorouracil-based chemotherapy
with RR of 36.8% and mOS of 10.3 (95% CI, 9.5–14.3) months.
| Table II.Clinical characteristics of patients
with esophageal cancer. |
Table II.
Clinical characteristics of patients
with esophageal cancer.
|
|
| Clinical
cohort |
|---|
|
|
|
|
|---|
| Clinical
values | HDRA cohort | Total |
Cisplatin-fluorouracil |
Docetaxel-fluorouracil |
|---|
| Sex, n (%) |
|
|
|
|
|
Male | 31 (63.3) | 45 (62.5) | 21 (61.7) | 24 (63.2) |
|
Female | 18 (36.7) | 27 (37.5) | 13 (38.2) | 14 (36.8) |
| Age, n (%) |
|
|
|
|
|
≤62 | 27 (55.1) | 40 (55.6) | 21 (61.7) | 19 (50.0) |
|
>62 | 22 (44.9) | 32 (44.4) | 13 (38.2) | 19 (50.0) |
| Tumor site, n
(%) |
|
|
|
|
|
Upper | 5 (10.2) | 7 (9.7) | 4 (11.8) | 3 (7.9) |
|
Middle | 29 (59.2) | 52 (72.2) | 23 (67.6) | 29 (76.3) |
|
Lower | 15 (30.6) | 13 (18.1) | 7 (20.6) | 6 (15.7) |
| Histological grade,
n (%) |
|
|
|
|
| 1 | 10 (20.4) | 3 (4.1) | 2 (5.9) | 1 (2.6) |
| 2 | 39 (79.6) | 49 (68.1) | 25 (73.5) | 24 (63.1) |
| 3 | 0 (0.0) | 20 (27.8) | 7 (20.5) | 13 (34.2) |
| Stage, n (%) |
|
|
|
|
| II | 27 (55.1) | 0 (0.0) | 0 (0.0) | 0 (0.0) |
|
III | 22 (44.9) | 4 (5.6) | 2 (5.9) | 1 (2.6) |
| IV | 0 (0.0) | 68 (94.4) | 32 (94.1) | 37(97.4) |
| Response rate, n
(%) |
|
|
|
|
| CR +
PR |
|
| 13 (38.2) | 14 (36.8) |
| SD +
PD |
|
| 21 (61.8) | 24 (63.2) |
| mOS
(months, 95% CI) |
|
| 13.2
(11.3–17.0) | 10.3
(9.5–14.3) |
Inhibition rates of chemotherapeutic
agents
The ability of 6 chemotherapeutic agents to inhibit
the growth of 49 tumor specimens was successfully tested using
HDRA. Not only did the spectrum of sensitive agent vary between
individual patients, but the inhibition rate of each agent also
varied and ranged widely. The average inhibition rates were as
follows: Cisplatin, 37.6% (95% CI, 35.6–47.5%); docetaxel, 20.0%
(95% CI, 15.1–22.9%); gemcitabine, 22.2% (95% CI, 16.0–23.8%);
etoposide, 19.9% (95% CI, 16.0–23.8%); fluorouracil, 19.5% (95% CI,
15.8–23.2%); and irinotecan, 21.2% (95% CI, 16.7–25.7%) (Fig. 1A). However, there was no significant
association between inhibition rates and clinical characteristics
(all P>0.05, Table III).
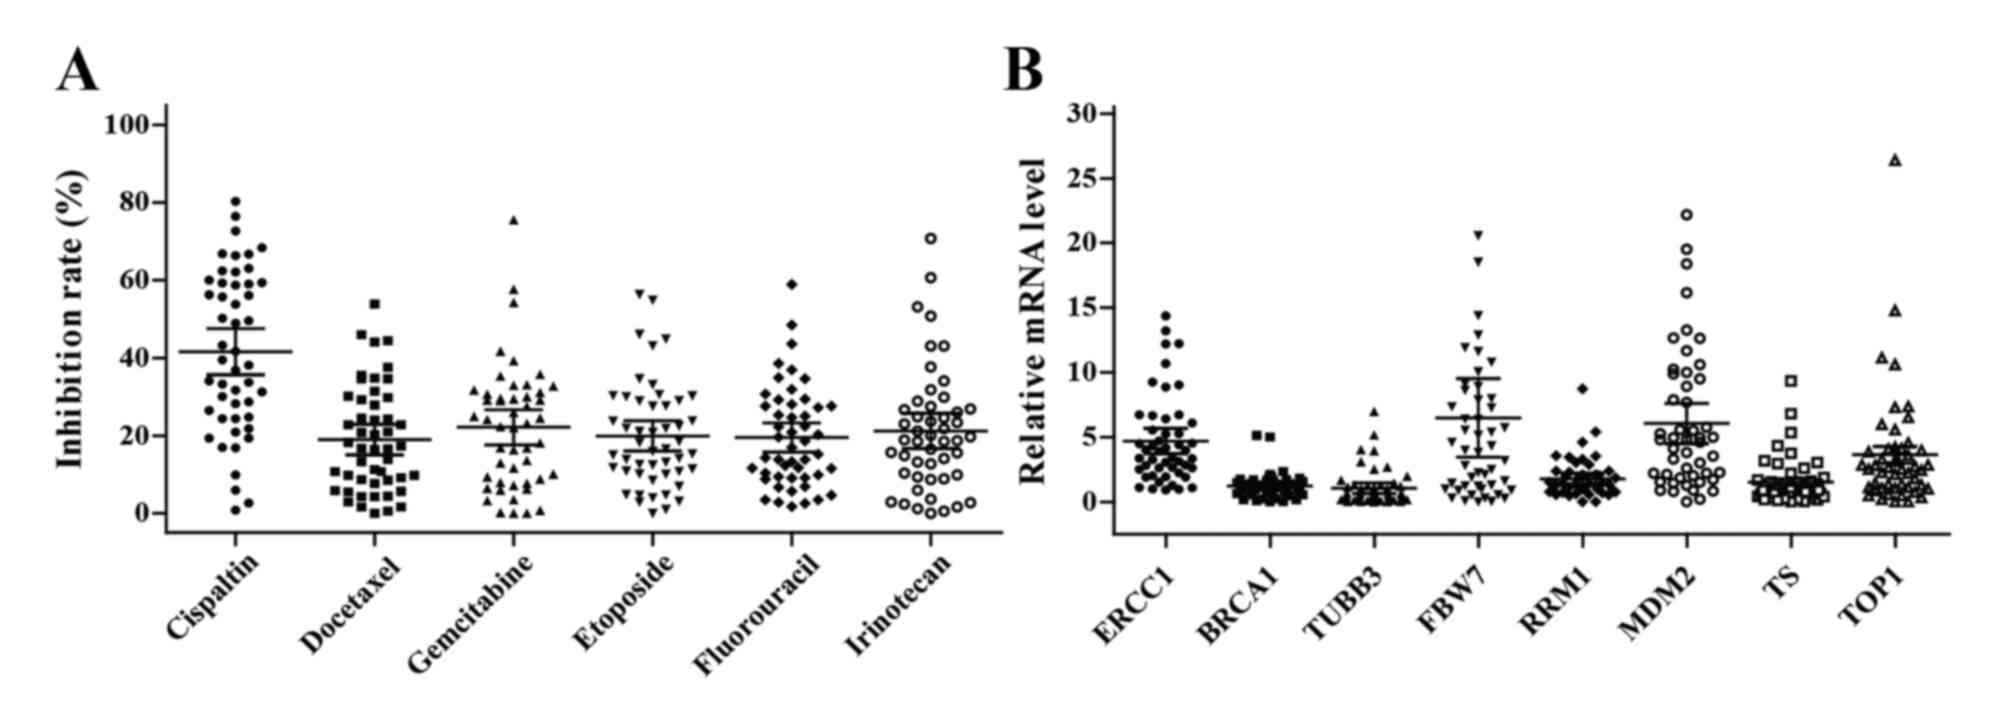 | Figure 1.Chemosensitivity and gene expression
levels in esophageal cancer tissues. (A) In vitro
chemosensitivity to cisplatin, docetaxel, gemcitabine, etoposide,
fluorouracil and irinotecan were tested using histoculture drug
response assay. (B) The levels of ERCC1, BRCA1, TUBB3, FBW7, RRM1,
MDM2, TS and TOP1 mRNA expression in tumor tissues were analyzed by
quantitative PCR. The bars indicate the mean and 95% confidence
interval. ERCC1, excision repair cross-complementation group 1;
BRCA1, breast cancer type 1 gene; TUBB3, tubulin β-3 class III;
FBXW7, F-box and WD repeat domain containing 7; RRM1,
ribonucleotide reductase catalytic subunit M1; MDM2, murine double
minute 2; TS, thymidylate synthetase; TOP1, DNA topoisomerase
1. |
| Table III.Association between inhibition rates
of chemotherapy agents and clinical characteristics. |
Table III.
Association between inhibition rates
of chemotherapy agents and clinical characteristics.
|
| Inhibition rates
(%) of chemotherapy agents (mean and 95% CI)a |
|---|
|
|
|
|---|
| Clinical
values | Cisplatin | Docetaxel | Gemcitabine | Etoposide | Fluorouracil | Irinotecan |
|---|
| Sex |
|
|
|
|
|
|
|
Male | 39.1
(31.2–46.9) | 21.3
(15.9–26.7) | 18.4
(13.7–23.0) | 20.1
(14.9–25.1) | 17.5
(13.9–21.2) | 20.5
(14.7–26.3) |
|
Female | 45.9
(36.3–55.5) | 14.9
(9.6–20.3) | 28.7
(19.3–38.0) | 19.7
(12.9–26.5) | 22.9
(14.6–31.3) | 22.4
(14.2–30.5) |
| Age |
|
|
|
|
|
|
|
≤62 | 42.0
(34.5–49.5) | 21.3
(16.5–26.2) | 21.5
(15.5–27.4) | 22.3
(16.6–28.1) | 21.4
(15.9–26.8) | 25.1
(19.0–31.2) |
|
>62 | 41.1
(30.8–51.4) | 16.1
(9.4–22.7) | 23.0
(15.4–30.6) | 16.9
(11.6–22.3) | 17.3
(11.9–22.6) | 16.4
(9.6–23.2) |
| Tumor site |
|
|
|
|
|
|
|
Upper | 39.0
(12.3–65.8) | 33.8
(12.4–55.3) | 30.4
(0.0–61.2) | 26.8
(12.1–41.4) | 29.1
(14.8–43.3) | 22.9
(5.1–50.9) |
|
Middle | 43.9
(35.8–52.2) | 15.4
(11.2–19.5) | 21.4
(16.7–26.1) | 18.9
(13.6–24.3) | 19.5
(14.2–24.7) | 20.0
(15.0–25.0) |
|
Lower | 37.8
(27.0–48.7) | 21.0
(13.1–28.9) | 20.9
(10.6–31.3) | 19.5
(12.0–29.9) | 16.4
(10.4–22.5) | 23.0
(12.5–33.4) |
| Histological
grade |
|
|
|
|
|
|
| 1 | 39.7
(20.1–59.3) | 22.6
(14.6–30.7) | 21.7
(8.9–34.5) | 27.4
(15.4–39.4) | 22.2
(11.1–33.4) | 26.2
(10.8–41.5) |
| 2 | 42.1
(35.9–48.3) | 18.1
(13.5–22.6) | 22.3
(17.2–27.3) | 18.0
(14.0–21.9) | 18.8
(14.8–22.8) | 19.9
(15.4–23.5) |
| Stage |
|
|
|
|
|
|
| II | 44.4
(35.9–52.9) | 17.2
(11.9–22.4) | 24.2
(16.7–31.6) | 21.4
(15.8–26.9) | 22.0
(16.1–27.9) | 21.5
(13.6–29.4) |
|
III | 38.1
(29.4–46.8) | 21.2
(15.0–27.4) | 19.7
(14.8–24.6) | 18.1
(12.3–23.9) | 16.4
(12.3–20.6) | 20.9
(17.0–24.7) |
Gene expression levels
The mRNA expression levels of 8 genes were detected
in all tumor tissues, with mean levels of 4.7 (95% CI, 3.7–5.7) for
ERCC1; 1.2 (95% CI, 0.9–1.5) for BRCA1; 1.1 (95% CI, 0.7–1.5) for
TUBB3; 6.5 (95% CI, 3.5–9.5) for FBW7; 1.8 (95% CI, 1.3–2.2) for
RRM1; 6.1 (95% CI, 4.5–7.6) for MDM2; 1.5 (95% CI, 1.0–2.1) for TS;
and 3.6 (95% CI, 2.4–4.9) for TOP1 (Fig.
1B). No association between clinical characteristics and gene
expression was identified (all P>0.05, Table IV).
| Table IV.Association between gene expression
and clinical characteristics. |
Table IV.
Association between gene expression
and clinical characteristics.
|
| Genes mRNA
expression levels (mean ± standard error)a |
|---|
|
|
|
|---|
| Clinical
values | ERCC1 | BRCA1 | TUBB3 | FBW7 | RRM1 | MDM2 | TS | TOP1 |
|---|
| Sex |
|
|
|
|
|
|
|
|
|
Male | 4.4±0.5 | 1.1±0.1 | 1.0±0.2 | 5.0±0.9 | 1.7±0.2 | 5.5±0.9 | 1.7±0.4 | 3.4±0.9 |
|
Female | 5.2±1.0 | 1.4±0.3 | 1.3±0.4 | 9.0±3.8 | 1.9±0.5 | 7.1±1.4 | 1.2±0.2 | 4.0±0.8 |
| Age |
|
|
|
|
|
|
|
|
|
≤62 | 4.5±0.6 | 1.0±0.1 | 0.7±0.1 | 7.0±2.6 | 1.7±0.2 | 5.2±0.9 | 1.5±0.4 | 3.6±1.0 |
|
>62 | 4.2±0.8 | 1.5±0.3 | 1.5±0.4 | 5.9±1.0 | 1.9±0.4 | 7.2±1.3 | 1.6±0.3 | 3.7±0.7 |
| Tumor site |
|
|
|
|
|
|
|
|
|
Upper | 3.5±0.4 | 1.0±0.2 | 0.6±0.3 | 2.6±1.7 | 1.8±0.5 | 4.0±1.6 | 2.6±1.7 | 1.9±0.7 |
|
Middle | 5.3±0.7 | 1.4±0.2 | 1.2±0.3 | 8.0±2.5 | 2.0±0.3 | 7.4±1.1 | 1.6±0.3 | 4.3±1.0 |
|
Lower | 4.0±0.8 | 1.0±0.1 | 0.9±0.3 | 4.9±0.8 | 1.4±0.3 | 4.2±0.9 | 1.1±0.3 | 2.9±0.6 |
| Histological
grade |
|
|
|
|
|
|
|
|
| 1 | 4.8±1.4 | 1.2±0.2 | 0.8±0.3 | 4.4±1.1 | 1.3±0.3 | 4.4±1.1 | 1.3±1.1 | 3.4±1.3 |
| 2 | 4.7±0.5 | 1.2±0.2 | 1.1±1.2 | 7.0±1.9 | 1.9±0.3 | 6.5±0.9 | 1.6±0.3 | 3.7±0.7 |
| Stage |
|
|
|
|
|
|
|
|
| II | 5.1±0.7 | 1.3±0.2 | 1.1±0.3 | 6.1±1.1 | 1.9±0.3 | 7.2±1.2 | 1.5±0.2 | 4.1±1.0 |
|
III | 4.2±0.7 | 1.1±0.1 | 1.0±0.3 | 7.0±3.1 | 1.6±0.2 | 4.7±0.9 | 1.6±0.5 | 3.1±0.6 |
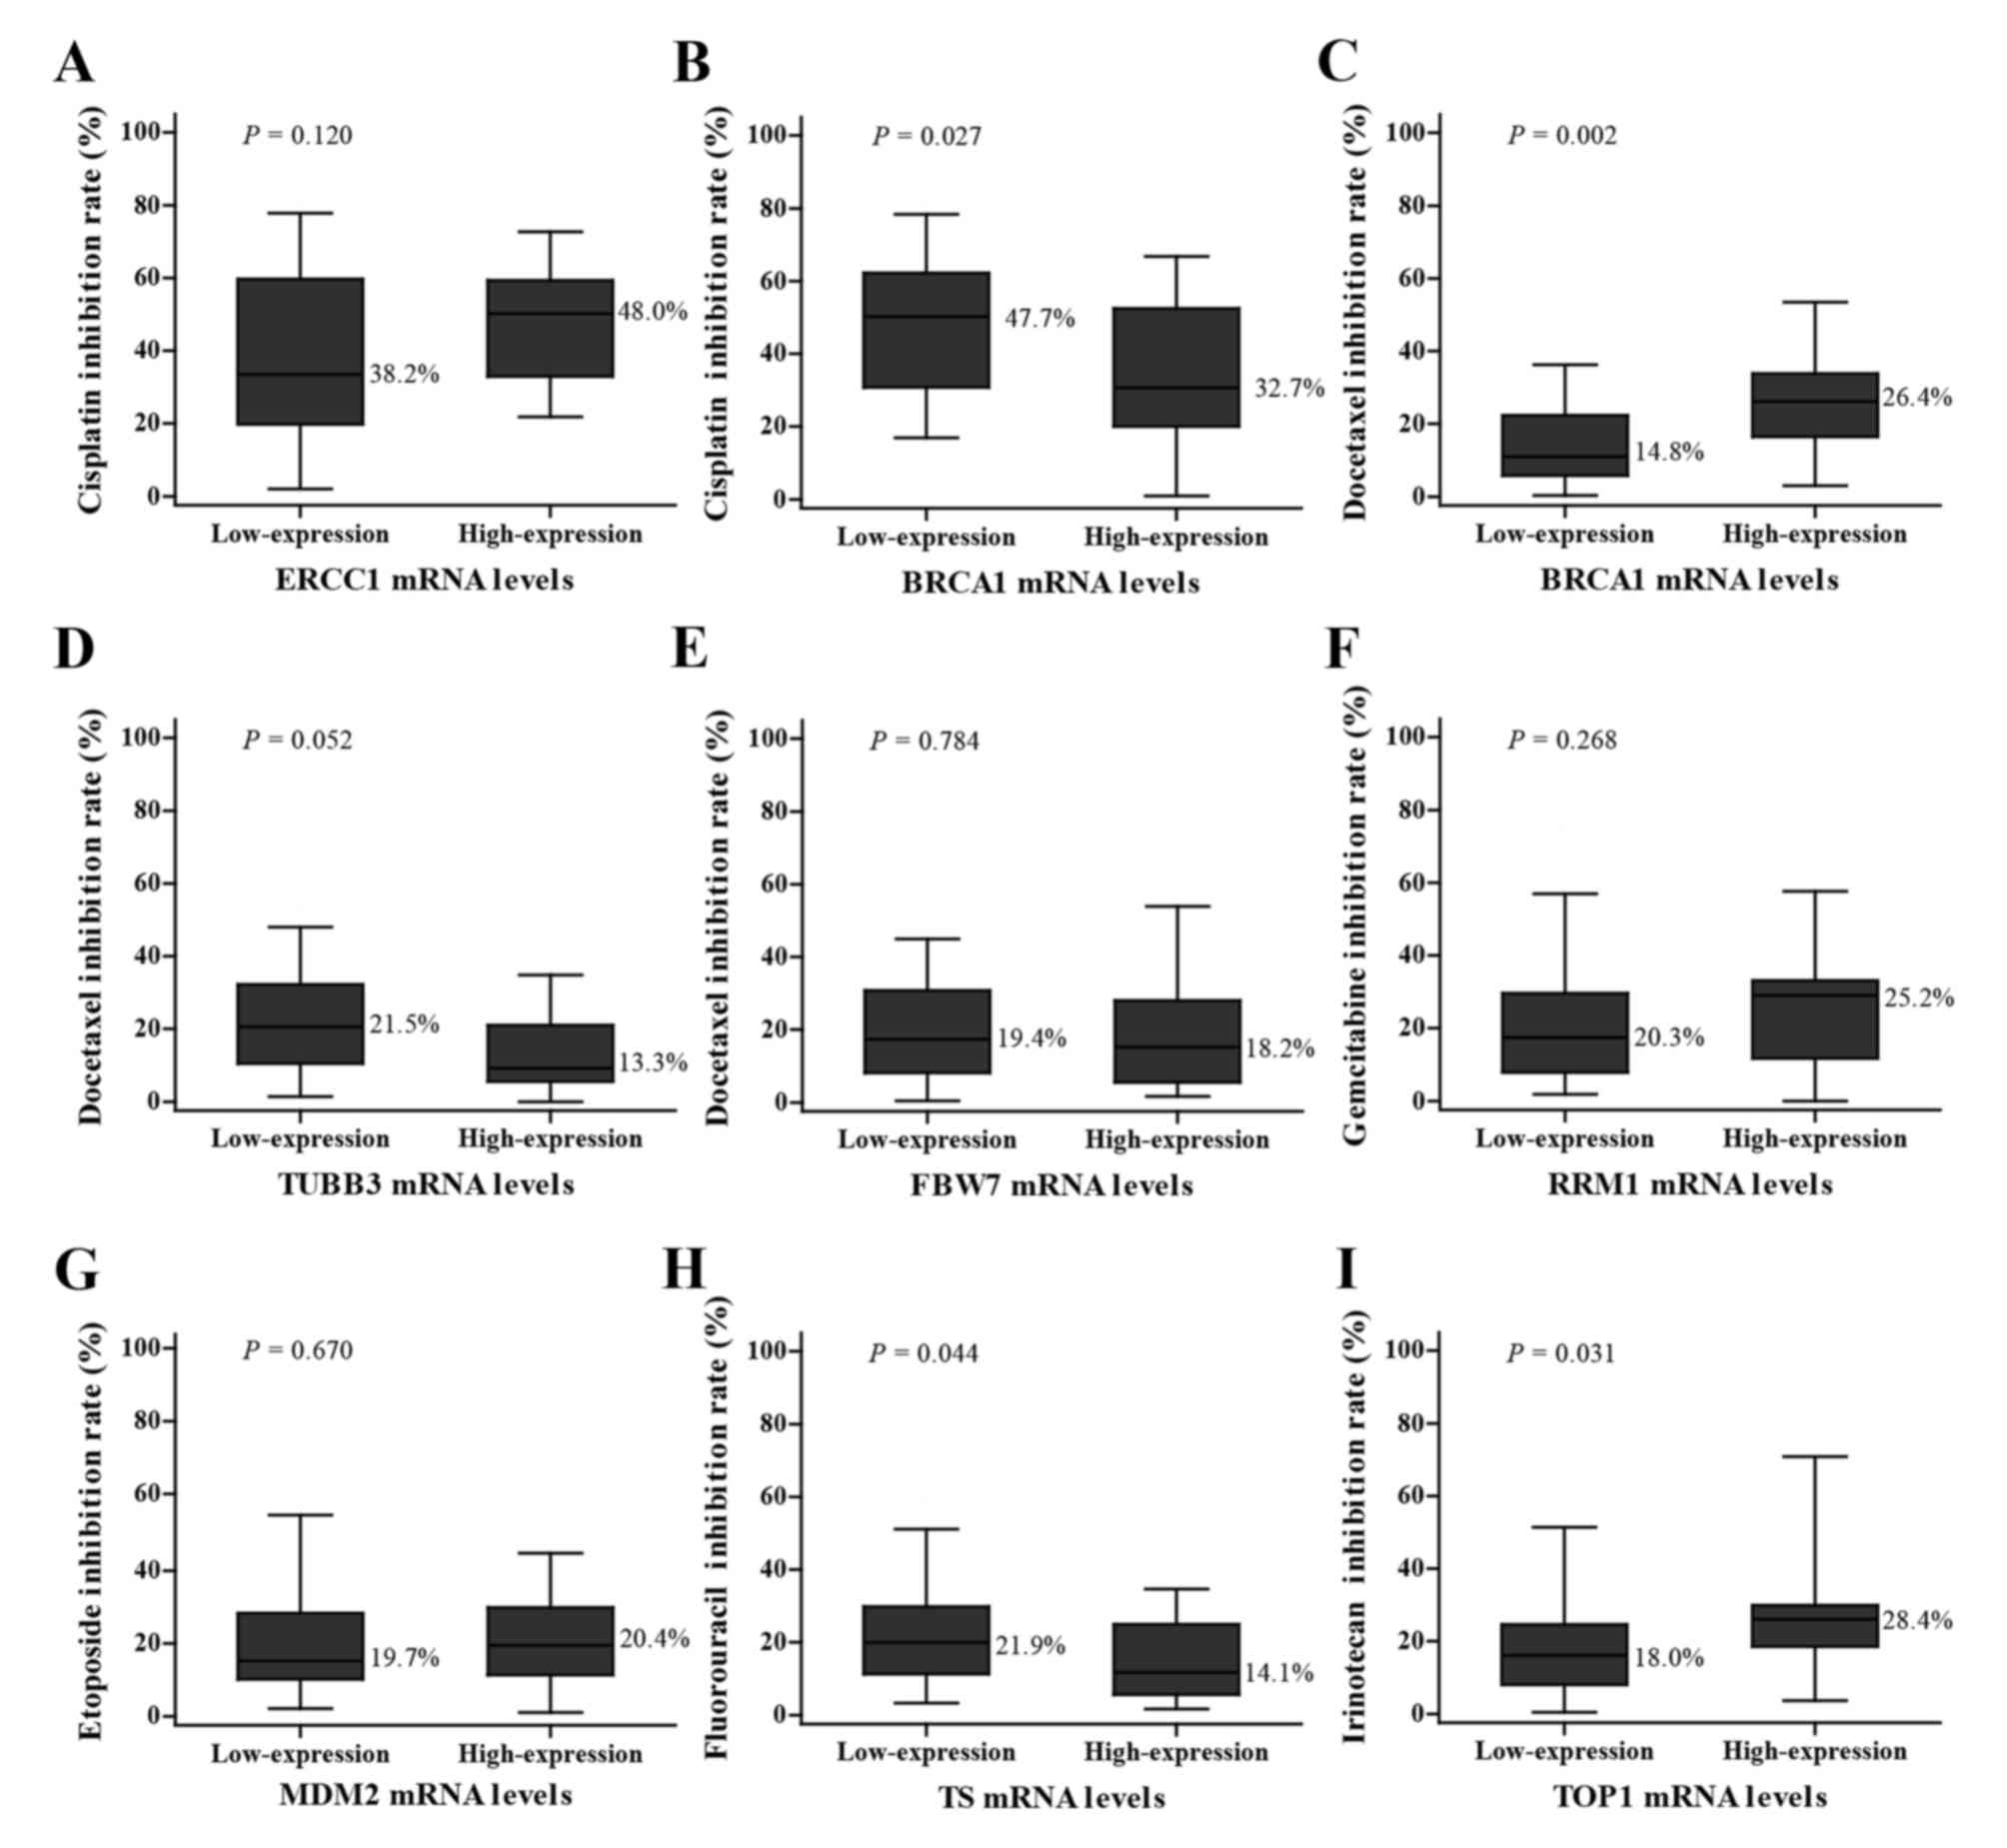
Association between gene expression
and chemosensitivity
The inhibition rates of various chemotherapeutic
agents are indicated in Fig. 2. The
inhibition rate of cisplatin in the group with low BRCA1 mRNA
expression was higher compared with the group with high expression
(44.7 vs. 32.7%; P=0.027; low expression vs. high expression group;
Fig. 2B), while the result of
docetaxel inhibition rate was the opposite with a higher inhibition
rate in the high expression group (14.8 vs. 26.4%, low expression
vs. high expression group; P=0.002; Fig.
2C). The tissues with low TS mRNA expression levels had a
higher sensitivity to fluorouracil compared with those with high
expression levels (21.9 vs. 14.1%; P=0.044; Fig. 2H). The group with high TOP1 mRNA
expression levels was more sensitive to irinotecan compared with
those with low expression levels (18.0 vs. 28.4%; P=0.031; Fig. 2I). However, statistically
insignificant associations between genes levels and inhibition
rates were also observed as follows: ERCC1 with cisplatin (38.2 vs.
48.0%, P=0.120; Fig. 2A), TUBB3 with
docetaxel (21.5 vs. 13.3%, P=0.052; Fig.
2D), FBW7 with docetaxel (19.4 vs. 18.2%, P=0.784; Fig. 2E), RRM1 with gemcitabine (20.3 vs.
25.2%, P=0.268; Fig. 2F) and MDM2
with etoposide (19.7 vs. 20.4%, P=0.670; Fig. 2G).
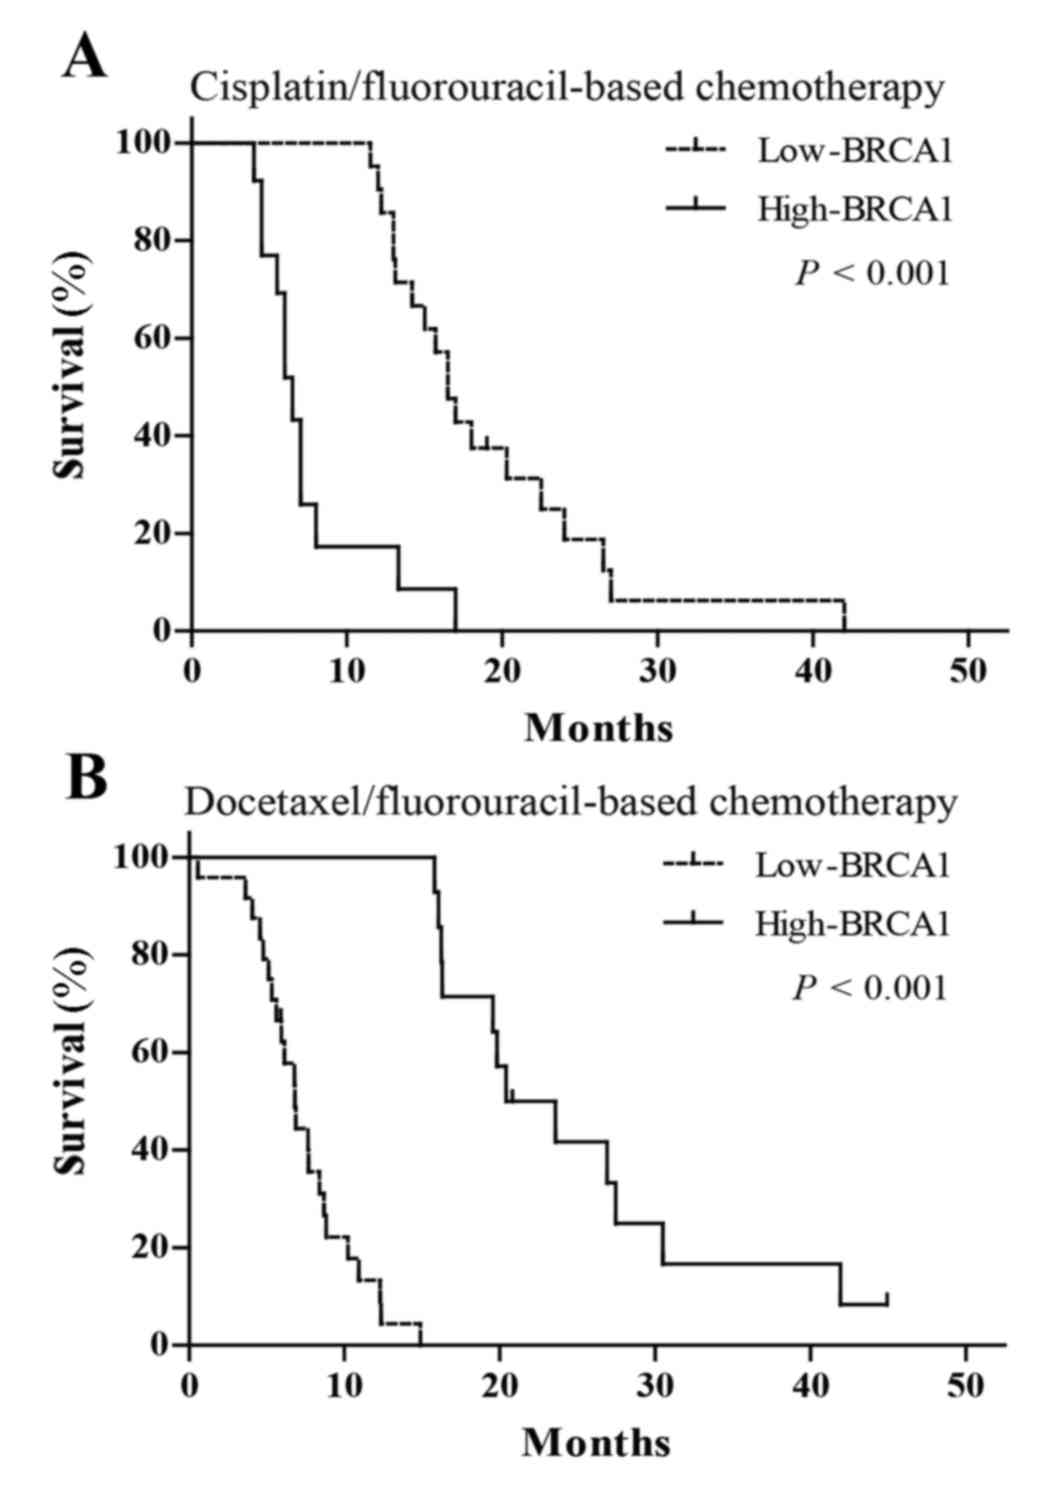
Association between BRCA1 expression
and clinical outcomes in patients treated with chemotherapy
In order to verify whether the predictive effects of
screened biomarkers in personalized chemotherapy is consistent with
in vitro chemosensitivity, the authors of the present study
further investigated the associations of BRCA1 mRNA expression with
clinical outcomes in patients with advanced esophageal cancer, who
were treated with cisplatin-fluorouracil or docetaxel-fluorouracil
chemotherapy. The findings indicated that patients treated with
cisplatin-fluorouracil chemotherapy with low BRCA1 expression had
increased mOS (16.5 vs. 6.5 months; P<0.001; Fig. 3A, Table
V) and RR (38.1 vs. 7.7%; P=0.002; Table V) compared with those with high
expression. However, patients treated with docetaxel-fluorouracil
chemotherapy with high BRCA1 mRNA expression had increased mOS
(22.0 vs. 6.8 months; P<0.001; Fig.
3B, Table V) and RR (57.1 vs.
20.8%; P=0.023; Table V) compared
with those with low BRCA1 expression.
| Table V.Outcomes in different chemotherapy
groups stratified by BRCA1 expression. |
Table V.
Outcomes in different chemotherapy
groups stratified by BRCA1 expression.
|
|
|
| mOS | RR, n (%) |
|---|
|
|
|
|
|
|
|---|
| Treatments | BRCA1 | No. | Median (95%
CI) | P-value | CR + PR | SD + PD | P-value |
|---|
|
Cisplatin/fluorouracil | Low | 21 | 16.5
(14.6–18.4) |
| 38.1 | 61.9 |
|
|
| High | 13 | 6.5 (5.4–7.6) | <0.001 | 7.7 | 92.3 | 0.002 |
|
Docetaxel/fluorouracil | Low | 24 | 6.8 (5.7–7.9) |
| 20.8 | 79.2 |
|
|
| High | 14 | 22.0
(14.0–26.8) | <0.001 | 57.1 | 42.9 | 0.023 |
Discussion
Treatment options in esophageal cancer have advanced
over the last several years with the introduction of effective
chemotherapeutics. However, personalized therapy is far from being
implemented due to the lack of effective predictive biomarkers
(25). Currently, the prediction of
response to chemotherapy at the molecular level is primarily based
on data derived from in vitro experiments (26–28).
Furthermore, studies, which utilize cell culture model of tumors,
organoid cultures or xenografts currently best mimic the
characteristics of an in vivo tumor (29). An in vitro histoculture system
is able to maintain the structure of the three-dimensional tissue
and the natural tumor environment (18,19).
Despite mouse xenograft models having the advantages of being able
to mimic the micro-environmental conditions, tumor architecture,
angiogenesis and metastasis present in a real patient, the in
vitro histoculture system has relative advantages of good
availability, low cost, ease of handling and short intervention
time. Therefore, in the present study the HDRA histoculture system
was selected to determine chemosensitivity. In addition, 8 parallel
culture wells were designed to test the chemosensitivity of
different parts of tumor specimen to avoid the issue of tumor
heterogeneity.
The efficacy rate for an individual agent using HDRA
in vitro has a considerable good correlation with clinical
response rate to each agent (30,31).
Previous studies have reported that TS and DPD expression are
correlated with fluorouracil sensitivity (32–35). It
was also reported that ERCC1 expression and SULF2 methylation are
correlated with platinum sensitivity (33,36).
Furthermore, CXCR4 and TUBB3 expression are correlated with
docetaxel sensitivity (37,38). Aprataxin (APTX) expression also has
been correlated with irinotecan sensitivity (29,33), and
MET expression has been correlated with crizotinib sensitivity
(39) using HDRA. These results
suggest that HDRA can be used in predictive biomarker studies. In
addition, the qPCR method, which may be more clinically useful with
the benefits of being able to provide more quantitative and
accurate measurement compared with fluorescence in situ
hybridization and immunohistochemistry, has been widely employed to
detect the expression levels of candidate genes in the
aforementioned studies. Therefore, in the present study, a total of
8 candidate biomarkers were selected based on literature review,
and the gene expression patterns were analyzed using qPCR. A number
of potential biomarkers for chemotherapy in esophageal cancer were
identified, including BRCA1 for docetaxel or cisplatin, TS for
fluorouracil and TOP1 for irinotecan. The authors then considered
whether combining HDRA with qPCR for biomarker discovery may
provide novel opportunities for prediction of individual response
to chemotherapy. Despite the identification of a number of
candidate biomarkers for esophageal cancer in the present study,
whether the predictive functions of these genes may be reproduced
in clinical practice still requires validation.
Previous studies have evaluated the predictive value
of potential biomarkers generated from HDRA in xenograft model and
in clinical settings. Shen et al (29) established different mice models with
patient-derived gastric cancer xenografts and demonstrated that
tumor growth is significantly suppressed in the cohort with
sensitive-signature based on the expression of APTX, BRCA1 and
TOP1. Yang et al (39) have
reported that patient-derived tumor xenograft models with higher
MET expression exhibited high sensitivity to crizotinib, and tumor
shrinkage was observed in a patient with advanced gastric cancer
and MET overexpression following crizotinib treatment. However,
differences in metabolism, body size and genetic background between
the host species and humans may have an impact on the predictive
value of biomarkers.
Therefore, in the present study, a total of 72
patients with advanced esophageal cancer, who were treated with
cisplatin-fluorouracil or docetaxel-fluorouracil chemotherapy, were
recruited, and the predictive function of BRCA1 in personalized
treatment was analyzed. Fluorouracil was used in both regimens, as
the presence of BRCA1 did not confer resistance or sensitivity to
fluorouracil.
High expression of BRCA1 mRNA was negatively
associated with RR and mOS in patients treated with
cisplatin-fluorouracil chemotherapy. Conversely, high BRCA1
expression was also positively associated with clinical outcomes in
those who received docetaxel-fluorouracil chemotherapy. As a dual
predictive biomarker, the results were consistent with previous
findings by the present authors (40,41). The
findings supported the hypothesis that the use of a combination of
HDRA and qPCR is able to effectively distinguish biomarkers in
their ability to evaluate response to chemotherapy.
In summary, the present study observed that the
level of BRCA1, TS and TOP1 mRNA present make these genes suitable
as predictable biomarkers to assess the response of cisplatin,
docetaxel, fluorouracil or irinotecan in patients with esophageal
cancer. Furthermore, the combination of HDRA and qPCR may be an
effective method for screening biomarkers to assess
chemosensitivity in personalized chemotherapy for esophageal
cancer.
Acknowledgements
The present study was supported by the National
Natural Science Foundation of China (grant no. 81572421), the
Jiangsu Provincial Commission of Health and Family Planning Program
(grant no. H201555) and Huai'an Governmental Science Developing
program (grant no. HACZ2014002).
References
|
1
|
Zhang HZ, Jin GF and Shen HB:
Epidemiologic differences in esophageal cancer between Asian and
Western populations. Chin J Cancer. 31:281–286. 2012. View Article : Google Scholar : PubMed/NCBI
|
|
2
|
Ferlay J, Soerjomataram I, Dikshit R, Eser
S, Mathers C, Rebelo M, Parkin DM, Forman D and Bray F: Cancer
incidence and mortality worldwide: Sources, methods and major
patterns in GLOBOCAN 2012. Int J Cancer. 136:E359–E386. 2015.
View Article : Google Scholar : PubMed/NCBI
|
|
3
|
Ezdinli EZ, Gelber R, Desai DV, Falkson G,
Moertel CG and Hahn RG: Chemotherapy of advanced esophageal
carcinoma: Eastern Cooperative Oncology Group experience. Cancer.
46:2149–2153. 1980. View Article : Google Scholar : PubMed/NCBI
|
|
4
|
Ajani JA, Ilson DH, Daugherty K, Pazdur R,
Lynch PM and Kelsen DP: Activity of taxol in patients with squamous
cell carcinoma and adenocarcinoma of the esophagus. J Natl Cancer
Inst. 86:1086–1091. 1994. View Article : Google Scholar : PubMed/NCBI
|
|
5
|
Millar J, Scullin P, Morrison A, McClory
B, Wall L, Cameron D, Philips H, Price A, Dunlop D and Eatock M:
Phase II study of gemcitabine and cisplatin in locally
advanced/metastatic oesophageal cancer. Br J Cancer. 93:1112–1116.
2005. View Article : Google Scholar : PubMed/NCBI
|
|
6
|
Denison TA and Bae YH: Tumor heterogeneity
and its implication for drug delivery. J Control Release.
164:187–191. 2012. View Article : Google Scholar : PubMed/NCBI
|
|
7
|
O'Donnell PH and Dolan ME: Cancer
pharmacoethnicity: Ethnic differences in susceptibility to the
effects of chemotherapy. Clin Cancer Res. 15:4806–4814. 2009.
View Article : Google Scholar : PubMed/NCBI
|
|
8
|
Papadaki C, Sfakianaki M, Ioannidis G,
Lagoudaki E, Trypaki M, Tryfonidis K, Mavroudis D, Stathopoulos E,
Georgoulias V and Souglakos J: ERCC1 and BRAC1 mRNA expression
levels in the primary tumor could predict the effectiveness of the
second-line cisplatin-based chemotherapy in pretreated patients
with metastatic non-small cell lung cancer. J Thorac Oncol.
7:663–671. 2012. View Article : Google Scholar : PubMed/NCBI
|
|
9
|
Wei J, Costa C, Ding Y, Zou Z, Yu L,
Sanchez JJ, Qian X, Chen H, Gimenez-Capitan A, Meng F, et al: mRNA
expression of BRCA1, PIAS1, and PIAS4 and survival after
second-line docetaxel in advanced gastric cancer. J Natl Cancer
Inst. 103:1552–1556. 2011. View Article : Google Scholar : PubMed/NCBI
|
|
10
|
Wertz IE, Kusam S, Lam C, Okamoto T,
Sandoval W, Anderson DJ, Helgason E, Ernst JA, Eby M, Liu J, et al:
Sensitivity to antitubulin chemotherapeutics is regulated by MCL1
and FBW7. Nature. 471:110–114. 2011. View Article : Google Scholar : PubMed/NCBI
|
|
11
|
Urano N, Fujiwara Y, Doki Y, Kim SJ,
Miyoshi Y, Noguchi S, Miyata H, Takiguchi S, Yasuda T, Yano M and
Monden M: Clinical significance of class III beta-tubulin
expression and its predictive value for resistance to
docetaxel-based chemotherapy in gastric cancer. Int J Oncol.
28:375–381. 2006.PubMed/NCBI
|
|
12
|
Soong R, Shah N, Salto-Tellez M, Tai BC,
Soo RA, Han HC, Ng SS, Tan WL, Zeps N, Joseph D, et al: Prognostic
significance of thymidylate synthase, dihydropyrimidine
dehydrogenase and thymidine phosphorylase protein expression in
colorectal cancer patients treated with or without
5-fluorouracil-based chemotherapy. Ann Oncol. 19:915–919. 2008.
View Article : Google Scholar : PubMed/NCBI
|
|
13
|
Souglakos J, Boukovinas I, Taron M, Mendez
P, Mavroudis D, Tripaki M, Hatzidaki D, Koutsopoulos A,
Stathopoulos E, Georgoulias V and Rosell R: Ribonucleotide
reductase subunits M1 and M2 mRNA expression levels and clinical
outcome of lung adenocarcinoma patients treated with
docetaxel/gemcitabine. Br J Cancer. 98:1710–1715. 2008. View Article : Google Scholar : PubMed/NCBI
|
|
14
|
Rodriguez-Lopez AM, Xenaki D, Eden TO,
Hickman JA and Chresta CM: MDM2 mediated nuclear exclusion of p53
attenuates etoposide-induced apoptosis in neuroblastoma cells. Mol
Pharmacol. 59:135–143. 2001.PubMed/NCBI
|
|
15
|
Tsurutani J, Nitta T, Hirashima T, Komiya
T, Uejima H, Tada H, Syunichi N, Tohda A, Fukuoka M and Nakagawa K:
Point mutations in the topoisomerase I gene in patients with
non-small cell lung cancer treated with irinotecan. Lung Cancer.
35:299–304. 2002. View Article : Google Scholar : PubMed/NCBI
|
|
16
|
Kim M, Keam B, Kim TM, Kim HG, Kim JS, Lee
SS, Shin SH, Kim MK, Park KU, Kim DW, et al: Phase II study of
irinotecan and cisplatin combination chemotherapy in metastatic,
unresectable esophageal cancer. Cancer Res Treat. 49:416–422. 2017.
View Article : Google Scholar : PubMed/NCBI
|
|
17
|
Harstrick A, Bokemeyer C, Preusser P,
Köhne-Wömpner CH, Meyer HJ, Stahl M, Knipp H, Schmoll HJ and Wilke
H: Phase II study of single-agent etoposide in patients with
metastatic squamous-cell carcinoma of the esophagus. Cancer
Chemother Pharmacol. 29:321–322. 1992. View Article : Google Scholar : PubMed/NCBI
|
|
18
|
Furukawa T, Kubota T, Tanino H, Oura S,
Yuasa S, Murate H, Morita K, Kozakai K, Yano T and Hoffman RM:
Chemosensitivity of breast cancer lymph node metastasis compared to
the primary tumor from individual patients tested in the
histoculture drug response assay. Anticancer Res. 20:3657–3658.
2000.PubMed/NCBI
|
|
19
|
Hoffman RM: To do tissue culture in two or
three dimensions? That is the question. Stem Cells. 11:105–111.
1993. View Article : Google Scholar : PubMed/NCBI
|
|
20
|
Tanino H, Oura S, Hoffman RM, Kubota T,
Furukawa T, Arimoto J, Yoshimasu T, Hirai I, Bessho T, Suzuma T, et
al: Acquisition of multidrug resistance in recurrent breast cancer
demonstrated by the histoculture drug response assay. Anticancer
Res. 21:4083–4086. 2001.PubMed/NCBI
|
|
21
|
Kim R, Emi M, Tanabe K, Uchida Y and Toge
T: Chemosensitivity testing for gastrointestinal cancer: Survival
benefit potential and limitations. Anticancer Drugs. 14:715–723.
2003. View Article : Google Scholar : PubMed/NCBI
|
|
22
|
Lee SW, Kim YM, Kim MB, Kim DY, Kim JH,
Nam JH and Kim YT: In vitro chemosensitivity using the histoculture
drug response assay in human epithelial ovarian cancer. Acta Med
Okayama. 66:271–277. 2012.PubMed/NCBI
|
|
23
|
Rosen MA and Sullivan D: Optimal lesion
number for evaluation of tumor response in response evaluation
criteria in solid tumors. J Clin Oncol. 28:e159–e161. 2010.
View Article : Google Scholar : PubMed/NCBI
|
|
24
|
Goense L, van Rossum PS, Kandioler D,
Ruurda JP, Goh KL, Luyer MD, Krasna MJ and van Hillegersberg R:
Stage-directed individualized therapy in esophageal cancer. Ann N Y
Acad Sci. 1381:50–65. 2016. View Article : Google Scholar : PubMed/NCBI
|
|
25
|
Liu Y, Xiong Z, Beasley A, D'Amico T and
Chen XL: Personalized and targeted therapy of esophageal squamous
cell carcinoma: An update. Ann N Y Acad Sci. 1381:66–73. 2016.
View Article : Google Scholar : PubMed/NCBI
|
|
26
|
Furukawa T, Kubota T, Watanabe M, Takahara
T, Yamaguchi H, Takeuchi T, Kase S, Kodaira S, Ishibiki K, Kitajima
M, et al: High in vitro-in vivo correlation of drug response using
sponge-gel-supported three-dimensional histoculture and the MTT end
point. Int J Cancer. 51:489–498. 1992. View Article : Google Scholar : PubMed/NCBI
|
|
27
|
Sevin BU, Peng ZL, Perras JP, Ganjei P,
Penalver M and Averette HE: Application of an ATP-bioluminescence
assay in human tumor chemosensitivity testing. Gynecol Oncol.
31:191–204. 1988. View Article : Google Scholar : PubMed/NCBI
|
|
28
|
Bogden AE, Cobb WR, Lepage DJ, Haskell PM,
Gulkin TA, Ward A, Kelton DE and Esber HJ: Chemotherapy
responsiveness of human tumors as first transplant generation
xenografts in the normal mouse: Six-day subrenal capsule assay.
Cancer. 48:10–20. 1981. View Article : Google Scholar : PubMed/NCBI
|
|
29
|
Shen J, Wei J, Wang H, Yue G, Yu L, Yang
Y, Xie L, Zou Z, Qian X, Ding Y, et al: A three-gene signature as
potential predictive biomarker for irinotecan sensitivity in
gastric cancer. J Transl Med. 11:732013. View Article : Google Scholar : PubMed/NCBI
|
|
30
|
Furukawa T, Kubota T and Hoffman RM:
Clinical applications of the histoculture drug response assay. Clin
Cancer Res. 1:305–311. 1995.PubMed/NCBI
|
|
31
|
Yoshimasu T, Oura S, Hirai I, Tamaki T,
Kokawa Y, Hata K, Ohta F, Nakamura R, Kawago M, Tanino H, et al:
Data acquisition for the histoculture drug response assay in lung
cancer. J Thorac Cardiovasc Surg. 133:303–308. 2007. View Article : Google Scholar : PubMed/NCBI
|
|
32
|
Zhang Q, Shen J, Wang H, Hu J, Yu L, Xie
L, Wei J, Liu B, Guan W and Qian X: TS mRNA levels can predict
pemetrexed and raltitrexed sensitivity in colorectal cancer. Cancer
Chemother Pharmacol. 73:325–333. 2014. View Article : Google Scholar : PubMed/NCBI
|
|
33
|
Yue G, Wei J, Qian X, Yu L, Zou Z, Guan W,
Wang H, Shen J and Liu B: Synergistic anticancer effects of
polyphyllin I and evodiamine on freshly-removed human gastric
tumors. PLoS One. 8:e651642013. View Article : Google Scholar : PubMed/NCBI
|
|
34
|
Kinoshita M, Kodera Y, Hibi K, Nakayama G,
Inoue T, Ohashi N, Ito Y, Koike M, Fujiwara M and Nakao A: Gene
expression profile of 5-fluorouracil metabolic enzymes in primary
colorectal cancer: Potential as predictive parameters for response
to fluorouracil-based chemotherapy. Anticancer Res. 27:851–856.
2007.PubMed/NCBI
|
|
35
|
Fakhrejahani E, Miyamoto A and Tanigawa N:
Correlation between thymidylate synthase and dihydropyrimidine
dehydrogenase mRNA level and in vitro chemosensitivity to
5-fluorouracil, in relation to differentiation in gastric cancer.
Cancer Chemother Pharmacol. 60:437–446. 2007. View Article : Google Scholar : PubMed/NCBI
|
|
36
|
Shen J, Wei J, Wang H, Yang Y, Yue G, Wang
L, Yu L, Xie L, Sun X, Bian X, et al: SULF2 methylation is
associated with in vitro cisplatin sensitivity and clinical
efficacy for gastric cancer patients treated with a modified FOLFOX
regimen. PLoS One. 8:e755642013. View Article : Google Scholar : PubMed/NCBI
|
|
37
|
Ohashi T, Yoshimasu T, Oura S, Kokawa Y,
Kawago M, Hirai Y, Miyasaka M, Aoishi Y, Kiyoi M, Nishiguchi H, et
al: Class III beta-tubulin expression in non-small cell lung
cancer: A predictive factor for paclitaxel response. Anticancer
Res. 35:2669–2674. 2015.PubMed/NCBI
|
|
38
|
Xie L, Wei J, Qian X, Chen G, Yu L, Ding Y
and Liu B: CXCR4, a potential predictive marker for docetaxel
sensitivity in gastric cancer. Anticancer Res. 30:2209–2216.
2010.PubMed/NCBI
|
|
39
|
Yang Y, Wu N, Shen J, Teixido C, Sun X,
Lin Z, Qian X, Zou Z, Guan W, Yu L, et al: MET overexpression and
amplification define a distinct molecular subgroup for targeted
therapies in gastric cancer. Gastric Cancer. 19:778–788. 2016.
View Article : Google Scholar : PubMed/NCBI
|
|
40
|
Gao Y, Zhu J, Zhang X, Wu Q, Jiang S, Liu
Y, Hu Z, Liu B and Chen X: BRCA1 mRNA expression as a predictive
and prognostic marker in advanced esophageal squamous cell
carcinoma treated with cisplatin- or docetaxel-based
chemotherapy/chemoradiotherapy. PLoS One. 8:e525892013. View Article : Google Scholar : PubMed/NCBI
|
|
41
|
Wei B, Han Q, Xu L, Zhang X, Zhu J, Wan L,
Jin Y, Qian Z, Wu J, Gao Y, et al: Effects of JWA, XRCC1 and BRCA1
mRNA expression on molecular staging for personalized therapy in
patients with advanced esophageal squamous cell carcinoma. BMC
Cancer. 15:3312015. View Article : Google Scholar : PubMed/NCBI
|