Introduction
The morbidity rate of hepatocellular carcinoma (HCC)
is the fifth highest among all types of malignant tumor and the
third leading cause of cancer-associated mortality worldwide
(1). Chronic hepatitis B virus (HBV)
infection accounts for ~50% of total cases and almost all childhood
HCC cases (2). Thus, the
identification of biomarkers to diagnose and indicate the stage of
disease in patients with HBV-associated HCC is warranted. The
Barcelona Clinic Liver Cancer (BCLC) staging system performs well
in guiding therapeutic decision making for HCC, and takes into
consideration the neoplasm, liver function and general condition of
patients combined with treatment principles (3). Thus, in the present study, BCLC was
chosen as the standard system for different stages of HCC.
Metabolomics studies small molecules (molecular
weight, <1,800 Da), which define the metabolic status of a
biological system. It has been used extensively to identify
biomarkers for HCC. The cyclic adenosine monophosphate, glutamine,
and short- and medium-chain acylcarnitines were reported as
differential metabolites of cirrhosis, and HCC (4). Zhou et al (5) reported that the proinflammatory
precursor arachidonic acid level is increased significantly in
patients with HCC compared with those with cirrhosis and healthy
controls. These studies indicate that metabolomics may be a
promising diagnostic tool for HCC.
In the present study, using the basic principles and
technology of metabolomics, the changes of small molecular
metabolites were analyzed, and monitored in patients with
HBV-associated HCC with different BCLC stages.
Materials and methods
Chemicals and instruments
All solvents were high-performance liquid
chromatography (HPLC) grade and used without modification. Formic
acid and acetonitrile (ACN) were obtained from Sigma-Aldrich; Merck
KGaA (Darmstadt, Germany). Distilled water was produced using a
Milli-Q Reagent Water system (EMD Millipore, Billerica, MA, USA).
All standard [L-phenylalanine, glycocholic acid and
lysophosphatidylcholine (LysoPC), 14:0] preparations were purchased
from Sigma-Aldrich; Merck KGaA. Ultra HPLC was performed using a
Thermo Fisher Accela system (Thermo Fisher Scientific, Inc.,
Waltham, MA, USA). Mass spectrometry (MS) was performed on a Thermo
Fisher LTQ Orbitrap XL hybrid mass spectrometer (Thermo Fisher
Scientific, Inc.). Other equipment included a Multifuge X1R
high-speed centrifuge (Thermo Fisher Scientific, Inc.).
Patients
In the present study, 75 patients with
HBV-associated HCC, 20 patients with HBV-induced cirrhosis and 20
healthy volunteers at the Tianjin Third Central Hospital (Tianjin,
China) between November 2013 and January 2015 were enrolled. The
following inclusion criteria for patients with HCC was maintained:
i) Immunologic test indicates HBV surface antigen-positive; ii) HCC
was confirmed by pathological diagnosis or multi-slice computer
tomography scan, and/or dynamic contrast-enhanced magnetic
resonance imaging; iii) patients did not receive any previous
antitumor therapy; iv) patients without secondary liver cancer or
combined with other system tumors; and v) patients without
complications of gastrointestinal bleeding or tumor rupture
hemorrhage. All 75 patients with HCC according to the Barcelona
liver cancer staging were divided to three groups: Stage A, early
stage patients who could be treated radically (including stage
A1-A4, but excluding stage A0, n=26); stage B, middle stage
patients who could be treated by arterial chemo embolization
(n=23); and stage C group, late stage patients who could only
accept symptomatic treatment (n=26). Furthermore, the inclusion
criteria for patients with HBV-induced cirrhosis were as follows:
i) HBV surface antigen-positive; ii) all 20 patients with liver
cirrhosis were at the compensated stage, child-pugh scores A-B;
iii) cirrhosis was diagnosed by abdominal ultrasonography and
transient elastography; and iv) patients without any other
malignant diseases or complications of hemorrhage. In addition, no
severe infection was detected and parenteral nutrition was used for
all patients. The dietary requirements of patients were managed by
the Nutrition Department of the Tianjin Third Central Hospital to a
relatively uniform standard, as a result, exogenous dietary
influence on metabolic profiling was limited to the lowest
level.
Serum sample collection
The clinical data of patients, including sex, age,
prothrombin time, and albumin, globulin, bilirubin, aspartate
aminotransferase, alanine aminotransferase and α-fetoprotein (AFP)
levels were collected from the medical records (Table I). No significant differences were
identified in age (result of one-way analysis of variance: F=0.395;
P=0.757) or sex (result of χ2 test: χ2=3.419;
P=0.490), ensuring comparability of data between groups. A total of
4 ml fasting venous blood samples were collected from subjects in
the early morning and placed in the separation gel tube. Blood
serum was packed and storing for analysis at −80°C following
centrifugation at 2,280 × g for 10 min. Blood samples and clinical
data were collected according to the Helsinki declarations under
the consent of patients and approved by the Ethics Committee of
Tianjin Third Central Hospital.
 | Table I.Basic characteristics of patients. |
Table I.
Basic characteristics of patients.
|
| HCC group |
|
|
|---|
|
|
|
|
|
|---|
| Characteristics | Early stage
(n=26) | Middle stage
(n=23) | Late stage
(n=26) | LC group (n=20) | Health control
(n=20) |
|---|
| Sex
(male/female) | 17/9 | 19/4 | 22/4 | 15/5 | 16/4 |
| Age (years) | 55.64±8.49 | 55.28±6.26 | 54.84±9.91 | 53.05±8.92 | 52.73±6.27 |
| PT (sec) | 14.15 | 14.00 | 14.80 | 18.00a | 13.22±0.88 |
|
| 13.43–15.40 | 13.60–14.90 | 14.20–15.40 | 15.00–19.95 |
|
| Albumin (g/l) | 42.10±3.42 | 39.90 | 36.10b | 34.15a | 47.70 |
|
| 40.35–44.55 | 34.55–43.18 | 30.88–37.50 | 26.88–38.53 | 45.4–49.40 |
| Globulin (g/l) | 27.20 | 30.40 | 31.10 | 29.60 | 26.84 |
|
| 24.30–30.30 | 24.90–33.80 | 27.45–37.10 | 27.90–42.13 | 23.96–29.84 |
| ALT (U/l) | 34.00 | 47.00 | 49.00 | 59.00 | 18.00 |
|
| 20.50–45.00 | 28.00–80.00 | 38.25–63.75 | 29.75–307.50 | 15.00–21.00 |
| AST (U/l) | 31.50 | 61.50a | 108.00 | 48.00a | 20.00 |
|
| 22.75–37.50 | 28.50–85.50 | 54.00–161.00 | 45.00–314.00 | 17.00–24.00 |
| BIL (µmol/l) | 16.00 | 13.65 | 26.90b | 41.10a | 8.57 |
|
| 12.70–19.55 | 10.38~26.20 | 19.63–39.70 | 20.40–92.35 | 6.49–11.20 |
| AFP (ng/ml) | 15.29 | 631.80a | 1210.00 | 14.86 | – |
|
| 5.75–110.00 | 34.94–1210.00 | 650.28–1210.00 | 6.56–91.37 |
|
Pretreatment
The specimens were thawed at room temperature,
methanol was added to the serum samples according to the ratio 1:3
(200:600 µl). Subsequently, samples were agitated for 30 sec using
an oscillator, then left to stand for 5 min. The samples were
centrifuged at 10,000 × g for 30 min at 4°C. The supernatant was
dried using vacuum concentration at 45°C for 3 h. A total of 400 ml
solvent was prepared for dissolving the dry powder. The mixture was
agitated for 30 sec. Lastly, samples were filtered through a
membrane with 0.22 µm apertures.
Sample analysis
Chromatography conditions were as follows:
Chromatography was performed using a Thermo Fisher Accela equipped
with a binary solvent delivery manager and a sample manager. The
analytical column was a Thermo Hypersil GOLD C18 reversed phase
column (2.1 mm ID × 50 mm, 1.9 µm; Thermo Fisher Scientific,
Inc.).
The mobile phase consisted of the following: phase A
0.1% formic acid (volume ratio), 1 ml of formic acid was added to a
1 liter bottle of HPLC-grade water; phase B 95% ACN and 0.1% formic
acid, 950 ml ACN, 50 ml HPLC-grade water and 1 ml formic acid were
combined.
Chromatographic separation was performed
isocratically within 15 min and the injection volume was 10 µl. The
flow rate was set at 200 µl/min. The sample manager and column oven
temperature were set at 4, and 20°C, respectively. The
chromatographic elution gradient was initialized at 5% phase B and
held for 3 min. In consecutive 10 min periods, phase B was
gradually increased to 50%, and then a rapid increase in phase B to
95% was completed within 3 min. After 4 min of maintaining a high
volume of organic phase gradient, phase B was immediately reduced
to 5% and this elution gradient was used to balance the analytical
column for the final 4 min.
MS was performed using a Thermo Fisher LTQ Orbitrap
XL hybrid mass spectrometer, operating in the positive ion mode
with an ion source voltage of 4.5 kV, a capillary voltage of 30 V,
cone voltage of 150 V, desolvation temperature of 350°C, sheath gas
flow of 30 arb. and assistant gas flow of 5 arb. (99.999%
nitrogen). Data were collected over 15 min in the centroid mode
over the mass range 50–1,000 m/z. The MS resolution was set at
100,000 full width half maximum and the calibration standards were
provided by Thermo Fisher Scientific, Inc. (caffeine, Ultramark
1621 and MRFA). MS/MS analysis was performed with collision-induced
dissociation with collision energy 35 (normalization collision
energy) and the collision gas was 99.999% helium.
There were 20 quality control (QC) samples
throughout the test (equal volume mixture of each analyzed sample).
Prior to analysis, eight QC samples were analyzed continuously and
the remaining 12 QC samples were inserted into the sequence after
every 10 samples were analyzed. The sequence of samples was
randomly generated by the excel function prior to and following
sample analysis (including QC), and cross-contamination was avoided
by inserting a blank between adjacent samples. The whole experiment
lasted 3,960 min.
Data treatment
MZmine software (version 2.0) was used to analyze
the original data derived from the UPLC-MS platform (6). Detailed standards were as follows: i)
The peak signal-to-noise ratio (S/N) >30; ii) retention time
interval in the range of ±0.1 min; iii) m/z deviation <±0.02.
The mode establishing method with SIMCA-P+ software (version
12.0.1; Umetrics; Sartorius AG, Göttingen, Germany) was used to
filter the variations, thus forming the orthogonal partial
least-squares discriminant analysis (OPLS-DA) model (7,8). Potential
biomarkers were preliminarily screened using visual methods in the
model, namely S figure, shared and unique structure plot figure,
variable influence on projection (VIP) and confidence interval (CI)
(9). Detailed standards were VIP
>1 and 0 not in CI.
SPSS software (version 17.0; SPSS, Inc., Chicago,
IL, USA) was used to evaluate the statistical significance of
differences of the variances between different groups. A one-way
analysis of variance with post hoc least significant difference
correction was applied for multiple comparisons between
quantitative data. Statistical differences were analyzed by a
two-tailed Mann-Whitney U test. A χ2 test was used to
compare the sex ratio between multiple groups. P<0.05 was
considered to indicate a statistically significant difference. The
receiver operating characteristic (ROC) curves were generated and
the corresponding area under the curve (AUC) was calculated. A
comparison was conduct between potential biomarkers identified, and
AFP, which is the most widely used biomarker for HCC.
The metabolites were identified according to the
following steps: i) The Human Metabolome DataBase was searched with
an accurate m/z value (10); ii) two
stage mass spectrometry of characteristic ions were obtained using
MS/MS scanning, which were combined with the physical and chemical
characteristics of metabolites to make a preliminary judgment; iii)
at least two independent and orthogonal biochemical data, including
the use of accurate mass, and retention time, were used for
identification according to Guideline for metabolite identification
(11); and iv) the retention time and
MS were compared with those of a standard product for further
identification. For those without reliable standard products,
identification was based on specific physical and chemical
properties.
Results
Data pretreatment and quality control
analysis
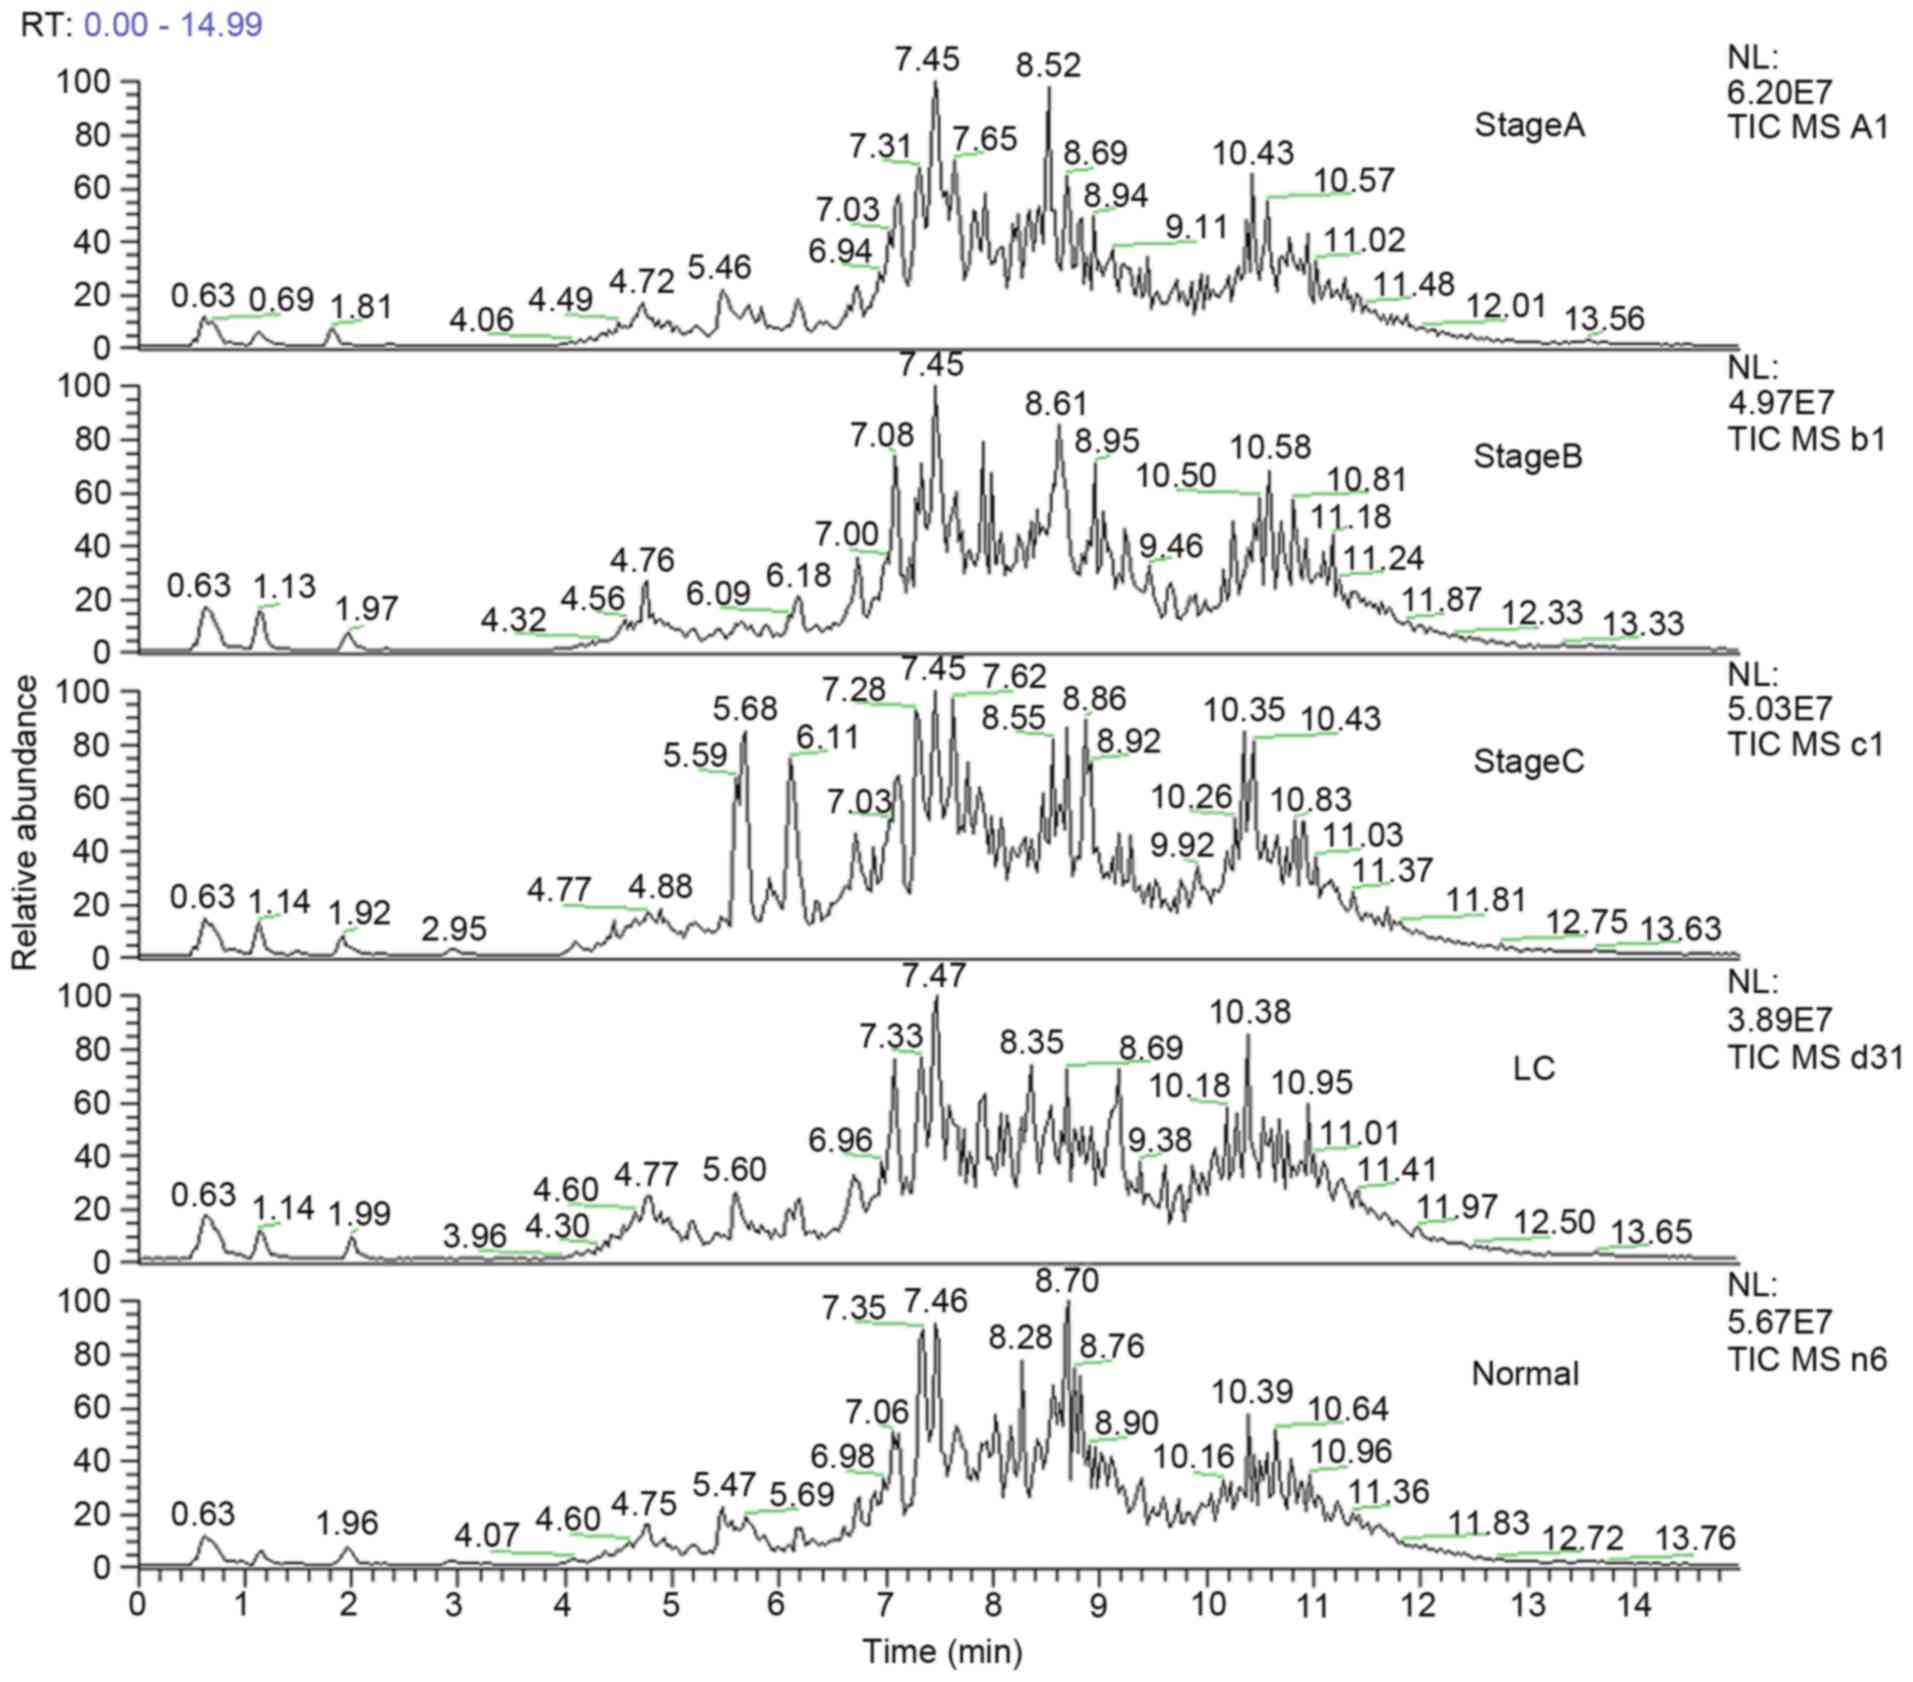
The total ion chromatogram of the early stage group
(stage A), middle stage group (stage B) and late stage group (stage
C) acquired by the UPLC-MS platform are presented in Fig. 1. Following pretreatment and
standardization using MZmine 2.0 software, 489 integral peaks
following extraction ion chromatography were detected in QC
samples, and 515 peaks in test samples.
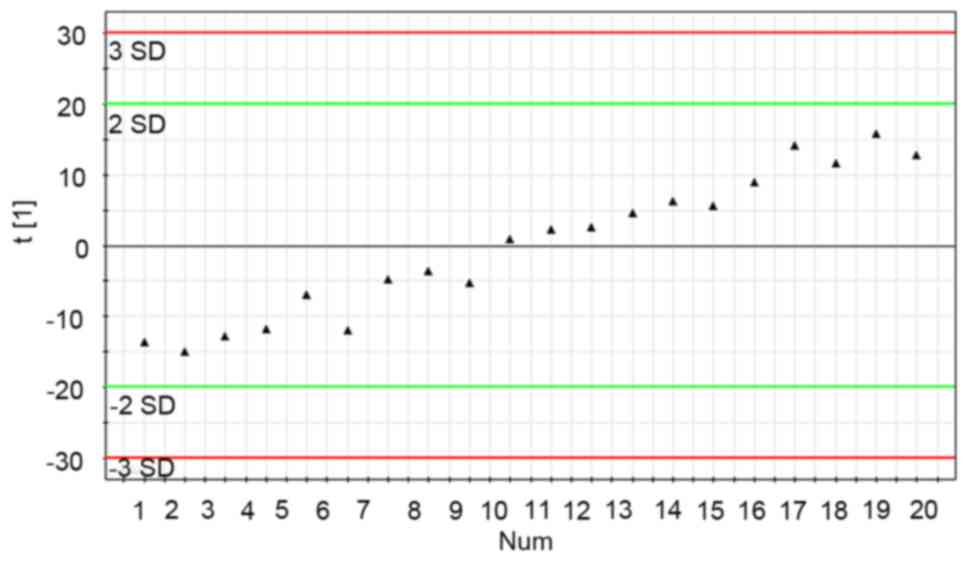
The stability of the UPLC-MS system was adequately
assessed through analysis of QC samples during the entire
experimental period. Through principal component analysis (PCA) of
20 data sets of QC samples, a PCA model with one principal
component was established (Fig. 2).
Fig. 2 demonstrates the score plot of
QC sample sequences vs. the first principal component (the most
influential factor which varied with time). From the QC principal
component score plot, it was demonstrated that the UPLS-MS system
was stable following the first eight continuous QC injections. In
the test sample sequence, a QC sample was inserted after every 10
test samples to evaluate the stability of the system during the
entire analytical process. The results revealed that the detection
system was stable throughout the experiment following the first
eight QC samples injected (no outliers exceeding ±2 standard of
deviation were detected in the QC samples). According to a previous
study (12), the QC standard was set
as follows: i) Ion peaks were defined as reliable peaks when their
intensity was in the range of ±30% average ion intensity; ii) a QC
sample qualified if its 70% ion peaks were reliable; and iii)
experimental data were accepted only when 60% QC was qualified. In
the present experiment, all the QC samples (reliable ion peaks
distributed among 80.5–89.3%) inserted into the test sample
sequence qualified and the qualified ratio was 100%, which
indicated that the analytical results were valid.
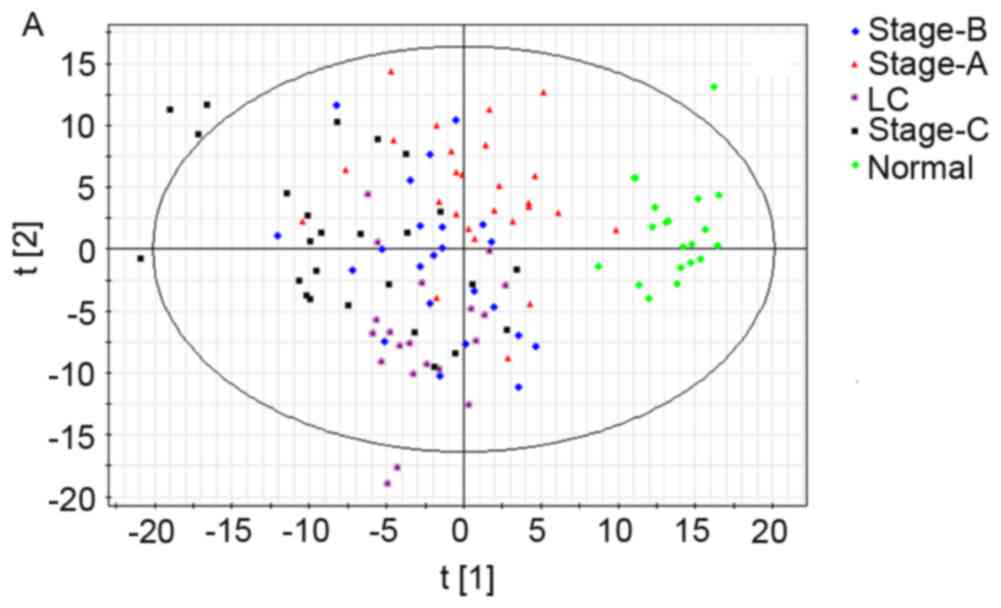
Ability of the metabolic profile to
distinguish disease states
First a PCA model having nine predictive principal
components (R2X=47.2%; Q2=26%) was
established (Fig. 3A), but the PCA
model distinguishing healthy people from the other groups, failed
to differentiate cirrhosis and different stages of HCC. Then, the
OPLS-DA model with four predictive principal components and four
orthogonal principal components (R2X=65.5%,
R2Y=75.6%; Q2Y=57.4%) was established
(Fig. 3B). In the OPLS-DA model, the
normal and late stage groups demonstrated significant clustering
tendency in the first predictive principal component, while the
cirrhosis group demonstrated significant clustering tendency in the
second predictive principal component. In addition, another OPLS-DA
model was established (Fig. 3C) with
three HCC groups and the normal group, which possessed three
predictive principal components and seven orthogonal principal
components (R2X=67.2%, R2Y=82%;
Q2Y=61.1%). In this model, the score plot of the first
predictive principal component and second predictive principal
component revealed significant clustering tendency. Different HCC
stages and healthy controls were well distinguished in this
model.
Selection and identification of
characteristic metabolites
Using the aforementioned screening steps, 20
characteristic metabolites distinguishing early stage HCC and late
stage HCC were selected (Table II).
A total of six metabolites were able to differentiate liver
cirrhosis from HCC, in addition, seven metabolites could
differentiate health controls from HCC. A total of nine metabolites
were able to distinguish early stage HCC from other stages, and
eight metabolites could distinguish late stage HCC from other
stages.
| Table II.Identification and difference of
characteristic metabolites. |
Table II.
Identification and difference of
characteristic metabolites.
|
|
|
|
|
| Contentc |
|---|
|
|
|
|
|
|
|
|---|
| No. | m/z | Retention time
(min) | Metabolite | Adductb | LC vs. HCC | Normal vs. HCC | Stage A vs. stage
B | Stage B vs. stage
C | Stage A vs. stage
C |
|---|
| 1 | 520.344 | 7.087 | LysoPC [18:2
(9Z,12Z)] | M+H[1+] | ↓* | – | ↓* | – | ↓* |
| 2 | 568.34 | 7.004 | LysoPC [22:6
(4Z,7Z, 10Z,13Z,16Z,19Z)] | M+H[1+] | – | – | – | * | ↑* |
| 3 | 188.069 | 1.928 |
L-phenylalaninea | M+Na[1+] | – | – | – | ↑ | ↑ |
| 4 | 468.304 | 6.697 | LysoPC
(14:0)a | M+H[1+] | – | – | ↑ | – | ↑ |
| 5 | 337.271 | 6.965 | Pregnanetriol | M+H[1+] | – | – | ↑ | – | ↑ |
| 6 | 214.004 | 0.702 |
L-Aspartyl-4-phosphate | M+H[1+] | ↑ | ↓ | ↓ | ↓ | ↓ |
| 7 | 248.122 | 5.690 |
Threoninyl-γ-glutamate | M+H[1+] | – | ↑ | ↑ | – | ↑ |
| 8 | 530.355 | 7.971 | LysoPC
(P-18:0) | M+Na[1+] | – | ↓ | – | ↓ | ↓ |
| 9 | 480.342 | 8.103 | LysoPC
(P-16:0) | M+H[1+] | ↓ | – | – | ↑ | ↑ |
| 10 | 270.142 | 5.694 |
Threoninyl-lysine | M+Na[1+] | – | ↑ | ↑ | – | ↑ |
| 11 | 283.261 | 7.851 | Vaccenic acid | M+H[1+] | ↑ | – | ↓ | – | ↓ |
| 12 | 274.091 | 4.042 | Deoxyadenosine | M+Na[1+] | – | – | – | ↑ | ↑ |
| 13 | 230.115 | 5.687 |
Asparaginyl-proline | M+H[1+] | ↓ | ↑ | ↑ | – | ↑ |
| 14 | 412.28 | 5.591 | LPA
(P-16:0e/0:0) | M+NH4[1+] | – | ↓ | ↓ | – | ↓ |
| 15 | 176.062 | 0.936 | Guanidinosuccinic
acid | M+H[1+] | – | – | ↑ | – | ↑ |
| 16 | 542.322 | 6.935 | LysoPC (20:5
(5Z,8Z, 11Z,14Z,17Z)) | M+H[1+] | – | – | ↑ | ↑ | ↑ |
| 17 | 488.294 | 5.589 | Glycocholic
acida | M+Na[1+] | – | ↓ | – | ↓ | ↓ |
| 18 | 370.292 | 6.721 |
cis-5-tetradecenoylcarnitine | M+H[1+] | – | – | – | ↓ | ↓ |
| 19 | 641.434 | 8.630 | Ganglioside GM3
(d18:0/25:0) | M+2H[2+] | – | – | – | ↓ | ↓ |
| 20 | 284.292 | 6.728 | Octadecanamide | M+H[1+] | ↑ | – | – | – | – |
ROC analysis
A total of six metabolites were able to
differentiate liver cirrhosis from each HCC stage group, namely
LysoPC [18:2 (9Z,12Z)], LysoPC (P-16:0), asparaginyl-proline,
vaccenic acid, L-aspartyl-4-phosphate and LysoPC [20:5
(5Z,8Z,11Z,14Z,17Z)]. The levels of first three metabolites were
significantly higher in the HCC group compared with in the
cirrhosis group, with AUC values of 0.826, 0.822 and 0.820,
respectively (Table III). The AUCs
of these metabolites differentiating between stage A HCC and
cirrhosis were 0.688, 0.858 and 0.975, respectively. Furthermore,
vaccenic acid was significantly decreased in each HCC stage
compared with in the cirrhosis group. AUCs of vaccenic acid
distinguishing between HCC with cirrhosis and stage A HCC with
cirrhosis were 0.798 and 0.869, respectively. AUC values of AFP
distinguishing between HCC from cirrhosis and stage A HCC with
cirrhosis were 0.737 and 0.519, respectively. All differences were
identified to be statistically significant (P<0.05). The serum
level of L-Aspartyl-4-phosphate in patients with HCC was
significantly decreased with the progression of disease. The serum
level of LysoPC [20:5 (5Z,8Z,11Z,14Z,17Z)] was significantly
increased with the progression of HCC. AUC values are listed in
Table III.
| Table III.Areas under receiver operating
characteristic curves of HCC grading biomarkers. |
Table III.
Areas under receiver operating
characteristic curves of HCC grading biomarkers.
|
| AUC | P-value | 95% CI |
|---|
|
|
|
|
|
|---|
| Metabolite | A/B | B/C | A/B | B/C | A/B | B/C |
|---|
|
L-Aspartyl-4-phosphate | 0.768 | 0.639 | 0.002 | 0.104 | 0.624–0.911 | 0.477–0.802 |
| LysoPC [20:5
(5Z,8Z,11Z,14Z,17Z)] | 0.828 | 0.673 | 0.000 | 0.032 | 0.700–0.956 | 0.499–0.812 |
| AFP | 0.647 | 0.704 | 0.079 | 0.017 | 0.511–0.842 | 0.550–0.858 |
Discussion
HBV can cause liver inflammation, resulting in liver
cell proliferation. The gene fragment of HBV can be combined with
the gene of liver cells, and the HBV protein interacts with the DNA
in the liver cells, resulting in HCC (13). However, the infection of HBV in a
liver carcinoma cell is influenced by various factors. The
mechanism is so complex that the optimal way to improve the
survival of patients with HCC is to diagnose and treat the disease
at an early stage.
In the present retrospective study, the healthy
control, HCC and LC group demonstrated significant clustering
tendency in the PCA model, indicating that liver damage, tumor and
other hepatitis B-associated disease factors were major factors in
the generation of model clustering. However, the LC and HCC group
were not well distinguished. The probable reason was that the
majority of patients with HCC exhibited basic cirrhosis disease.
Although no significant clustering tendency was identified between
the three different HCC stages, a clustering tendency was observed
with disease progression.
The first OPLS-DA model distinguished the healthy
control and late stage HCC group well from the other groups, but no
significant clustering tendency was identified between the LC
group, early, and middle stage HCC groups. The probable reasons are
as follows: i) Among the BCLC groups, tumor metastasis or invasion
of vascular lymph nodes was required in the diagnosis of late stage
HCC, which could be detected definitely. The boundaries were clear
in this group. However, HCC in the early and middle stages was
diagnosed by the tumor size and number, resulting in unavoidable
cross phenomenon between those two groups. As a result, those two
groups were not distinguished as well as the late stage group. ii)
Patients in the HCC group exhibited varying degrees of hepatic
fibrosis. In the present study, the majority of liver damage in
patients with LC was in the compensatory phase, which was similar
to that of patients in the early and middle stage HCC groups.
However, the majority of patients in the late stage HCC group
exhibited severe cirrhosis, and the difference was significant
compared with patients in the cirrhosis group. Thus, the
aforementioned clustering phenomenon appeared in the models.
However, on the whole, a trend of clustering was observed with
progression of the disease. Furthermore, in the second principal
component, early, middle and late stage HCC groups, and the
cirrhosis group were well distinguished. This indicated that the
OPLS-DA model constructed in the current study had good
interpretation and prediction ability for HBV-associated HCC
disease progression. Following removal of the cirrhosis group, the
second OPLS-DA model was consistent with the aforementioned model,
and HCC in early and middle stage groups could be separated in the
second principal component.
According to the metabolites identification methods,
20 metabolites associated with HCC were identified, primarily
lysophosphatidyl choline, amino acids, cholylglycine and vaccenic
acid. These metabolites are potential biomarkers for the
development of HBV-associated HCC. In the differential diagnosis of
cirrhosis and early stage HCC, the AUCs of LysoPC [18:2 (9Z,12Z)],
LysoPC (P-16:0), asparaginyl-proline and vaccenic acid were
increased compared with that of AFP. This indicates that these four
metabolites performed better compared with AFP in the diagnosis
HCC, particularly in early stage HCC.
Tan et al (14)
compared the metabolites of patients with HCC and cirrhosis, and
healthy controls. It was demonstrated that LysoPC (P-16:0) and
LysoPC (22:5) (combined sensitivity and combined specificity, 80.5
and 80.1%, respectively) performed better compared with AFP
(sensitivity and specificity, 53 and 64%, respectively) in the
diagnosis of patients with HCC with <2 cm diameter tumors
(13). Cao et al (15) revealed that the levels of LPC (P-18:0)
and LPC (P-16:0) were higher in patients with HCC compared that of
healthy controls, consistent with the current study. In addition,
the results of the present study demonstrated that levels of
certain metabolites, including LysoPC [20:5 (5Z,8Z,11Z,14Z,17Z)]
and LysoPC (14:0), decreased with the development of HCC. The
downregulation of lysoPCs may primarily result from rapid membrane
PC turnover during liver injury or malignant regeneration (16). The possible mechanism associating this
observation is that HCC development severely damages liver
function, thus reducing the number of enzymes available to produce
PC. As a result, LPC is produced. Another possible reason is that
the defensive system of body is weakened, thus PC synthesis is
reduced (17). The AUCs of
L-aspartyl-4-phosphate and LysoPC [20:5 (5Z,8Z,11Z,14Z,17Z)] were
higher compared with that of AFP when differentiating between
early, and middle stage HCC. While the AUC of AFP was increased
compared with that of the two in differentiating between middle and
late stage HCC. L-Aspartyl-4-phosphate and LysoPC [20:5
(5Z,8Z,11Z,14Z,17Z)] combined with AFP can significantly improve
the capability to predict HCC stage.
In conclusion, a metabolic profiling model was
successfully established, revealing that metabolomics is a
promising tool to identify characteristic metabolites in the serum
to diagnose different HCC stages. A total of four characteristic
metabolites were identified to differentiate between HCC and liver
cirrhosis. In addition, two metabolites performed well in
distinguishing between different HCC stages. Additional large
sample size studies are warranted to confirm the clinical value of
these metabolites.
Acknowledgements
The present study was supported by the General
Project of Application Infrastructure and Cutting-Edge Technology
Research Programs, Tianjin (grant no. 13JCYBJC22100), and the
Program Project of Health and Family Planning Commission Technology
Fund, Tianjin (grant no. 2014KY01).
References
|
1
|
Mittal S and El-Serag HB: Epidemiology of
hepatocellular carcinoma: Consider the population. J Clin
Gastroenterol. 47 Suppl:S2–S6. 2013. View Article : Google Scholar : PubMed/NCBI
|
|
2
|
El-Serag HB: Epidemiology of viral
hepatitis and hepatocellular carcinoma. Gastroenterology.
142:1264–1273. 2012. View Article : Google Scholar : PubMed/NCBI
|
|
3
|
Chapiro J and Geschwind JF: Hepatocellular
carcinoma: Have we finally found the ultimate staging system for
HCC? Nat Rev Gastroenterol Hepatol. 11:334–336. 2014. View Article : Google Scholar : PubMed/NCBI
|
|
4
|
Shao Y, Zhu B, Zheng R, Zhao X, Yin P, Lu
X, Jiao B, Xu G and Yao Z: Development of urinary pseudotargeted
LC-MS-based metabolomics method and its application in
hepatocellular carcinoma biomarker discovery. J Proteome Res.
14:906–916. 2015. View Article : Google Scholar : PubMed/NCBI
|
|
5
|
Zhou L, Ding L, Yin P, Lu X, Wang X, Niu
J, Gao P and Xu G: Serum metabolic profiling study of
hepatocellular carcinoma infected with hepatitis B or hepatitis C
virus by using liquid chromatography-mass spectrometry. J Proteome
Res. 11:5433–5442. 2012. View Article : Google Scholar : PubMed/NCBI
|
|
6
|
Steinfath M, Groth D, Lisec J and Selbig
J: Metabolite profile analysis: From raw data to regression and
classification. Physiol Plant. 132:150–161. 2008. View Article : Google Scholar : PubMed/NCBI
|
|
7
|
Pham-Tuan H, Kaskavelis L, Daykin CA and
Janssen HG: Method development in high-performance liquid
chromatography for high-throughput profiling and metabonomic
studies of biofluid samples. J Chromatogr B Analyt Technol Biomed
Life Sci. 789:283–301. 2003. View Article : Google Scholar : PubMed/NCBI
|
|
8
|
Katajamaa M and Oresic M: Processing
methods for differential analysis of LC/MS profile data. BMC
Bioinformatics. 6:1792005. View Article : Google Scholar : PubMed/NCBI
|
|
9
|
Yin P, Wan D, Zhao C, Chen J, Zhao X, Wang
W, Lu X, Yang S, Gu J and Xu G: A metabonomic study of hepatitis
B-induced liver cirrhosis and hepatocellular carcinoma by using
RP-LC and HILIC coupled with mass spectrometry. Mol Biosyst.
5:868–876. 2009. View
Article : Google Scholar : PubMed/NCBI
|
|
10
|
Chen J, Zhao X, Fritsche J, Yin P,
Schmitt-Kopplin P, Wang W, Lu X, Häring HU, Schleicher ED, Lehmann
R and Xu G: Practical approach for the identification and isomer
elucidation of biomarkers detected in a metabonomic study for the
discovery of individuals at risk for diabetes by integrating the
chromatographic and mass spectrometric information. Anal Chem.
80:1280–1289. 2008. View Article : Google Scholar : PubMed/NCBI
|
|
11
|
Sumner LW, Amberg A, Barrett D, Beale MH,
Beger R, Daykin CA, Fan TW, Fiehn O, Goodacre R, Griffin JL, et al:
Proposed minimum reporting standards for chemical analysis Chemical
Analysis Working Group (CAWG) Metabolomics Standards Initiative
(MSI). Metabolomics. 3:211–221. 2007. View Article : Google Scholar : PubMed/NCBI
|
|
12
|
Dunn WB, Broadhurst D, Brown M, Baker PN,
Redman CW, Kenny LC and Kell DB: Metabolic profiling of serum using
ultra performance liquid chromatography and the LTQ-Orbitrap mass
spectrometry system. J Chromatogr B Analyt Technol Biomed Life Sci.
871:288–298. 2008. View Article : Google Scholar : PubMed/NCBI
|
|
13
|
Funk ML, Rosenberg DM and Lok AS:
World-wide epidemiology of HBeAg-negative chronic hepatitis B and
associated precore and core promoter variants. J Viral Hepat.
9:52–61. 2002. View Article : Google Scholar : PubMed/NCBI
|
|
14
|
Tan Y, Yin P, Tang L, Xing W, Huang Q, Cao
D, Zhao X, Wang W, Lu X, Xu Z, et al: Metabolomics study of
stepwise hepatocarcinogenesis from the model rats to patients:
Potential biomarkers effective for small hepatocellular carcinoma
diagnosis. Mol Cell Proteomics. 11:M111.0106942012. View Article : Google Scholar : PubMed/NCBI
|
|
15
|
Cao H, Huang H, Xu W, Chen D, Yu J, Li J
and Li L: Fecal metabolome profiling of liver cirrhosis and
hepatocellular carcinoma patients by ultra performance liquid
chromatography-mass spectrometry. Anal Chim Acta. 691:68–75. 2011.
View Article : Google Scholar : PubMed/NCBI
|
|
16
|
Taylor LA, Arends J, Hodina AK, Unger C
and Massing U: Plasma lyso-phosphatidylcholine concentration is
decreased in cancer patients with weight loss and activated
inflammatory status. Lipids Health Dis. 6:172007. View Article : Google Scholar : PubMed/NCBI
|
|
17
|
Yan JJ, Jung JS, Lee JE, Lee J, Huh SO,
Kim HS, Jung KC, Cho JY, Nam JS, Suh HW, et al: Therapeutic effects
of lysophosphatidylcholine in experimental sepsis. Nat Med.
10:161–167. 2004. View
Article : Google Scholar : PubMed/NCBI
|