Introduction
In February 2014, the World Health Organization
(WHO) released the 2014 World Cancer Report (1). The report included the estimation that
in 2012, there were 14 million new cases of cancer and 8.2 million
cancer-associated mortalities worldwide, of which 21.9 and 26.8%,
respectively, occurred in China. Gastric cancer (GC) is the fourth
most common type of malignant tumor worldwide and causes the second
largest number of mortalities (2).
Every year, ~1 million individuals are diagnosed with GC, including
~42% of patients with cancer in China (3). According to the WHO data, there were
404,996 newly diagnosed patients with GC in China in 2012. The
number of relatively young patients with GC is gradually increasing
(3). According to clinical and
epidemiological studies, the incidence of GC is as high as 6–11%
among 35-year-olds, as much as three times higher than rates
reported in other countries (3).
GC-associated mortality rates appear to be trending downwards;
however, the GC 5-year survival rate is 30–57.1% in China, causing
~300,000 lives to be lost every year (2,4,5).
Gastric tumorigenesis is a multistep and
multifactorial process involving genetic, regional, environmental
and dietary factors. The International Agency for Research on
Cancer confirmed that Helicobacter pylori infection was the
most significant risk factor for GC in 2012 (6). H. pylori-mediated GC progression
is dependent on the bacterial components expressed, including
urease enzymes, adhesins, cytotoxin-associated gene A (CagA) and
vacuolating cytotoxin A. CagA-positive H. pylori strains
contain a functional type IV secretion system (TFSS) to facilitate
the transfer of bacterial products into host cells (7). Inside the host cell, CagA localizes to
the inner surface of the plasma membrane, disrupts cell-cell
junctions and undergoes tyrosine phosphorylation interactions from
a number of host proteins (8,9). CagA is the only identified protein to be
delivered through the TFSS into epithelial cells (5). Previous studies have demonstrated that
individuals infected with CagA-positive H. pylori strains
present increased inflammation and have a higher risk of developing
peptic ulcer disease and GC (10–12).
The receptor for hepatocyte growth factor/scatter
factor, c-Met, is a receptor tyrosine kinase with a well-documented
participation in cell invasion (13–16). H.
pylori induces an invasive phenotype in gastric epithelial
cells through a mechanism that requires the TFSS and the
phosphorylation of c-Met. Churin et al (17) reported that c-Met was phosphorylated
in response to co-culture with CagA-positive H. pylori;
however, the study did not elucidate the mechanism for c-Met
activation. The phosphorylation of c-Met can activate the
phosphatidylinositol-4,5-bisphosphate 3-kinase (PI3K)/Akt
serine/threonine kinase signaling pathway, which suppress
autophagy, and promotes tumor cell invasion and the expression of
oncogenes. Akt-mediated regulation of autophagy and tumorigenesis
is achieved through Beclin-1 phosphorylation (18). Previous studies have suggested that
the c-Met/PI3K signaling pathway is particularly active in tumors
of the salivary glands, osteosarcoma, ovarian cancer and cervical
cancer (19–22). Whether the c-Met/PI3K signaling
pathway and the associated suppression of autophagy are involved in
CagA-positive H. pylori infection-associated GC has yet to
be established.
In the present study, a systematic
immunohistochemical analysis of CagA, c-Met, PI3K and Beclin-1
expression in GC tissues was performed. Subsequently, the
association between c-Met, PI3K and Beclin-1 expression with
clinicopathological factors and CagA-positive H. pylori
infection-associated GC was assessed. Disease-free survival (DFS)
and overall survival (OS) time data were analyzed to describe the
prognostic implications of c-Met, PI3K, Beclin-1 and CagA
expression.
Materials and methods
Tissue specimens
A total of 121 patients with GC were included in the
study, including 71 males and 50 females; the patients were aged
34–79 years, with a mean age of 61 years. An additional 120 healthy
individuals, to provide normal tissue controls acquired by
gastroscopy, were enrolled in the present study. The healthy
individuals included 60 male and 60 female volunteers aged between
30 and 66 years. The GC tissue specimens (≥5 cm from the tumor
tissue) were collected from resective surgery in the Affiliated
Hospital of Xuzhou Medical College (Xuzhou, China) from June 2008
to June 2010. Tissue specimens were formalin-fixed and
paraffin-embedded. Patients who had received preoperative
chemotherapy, radiotherapy or other treatments were excluded from
inclusion in the study, as were those with a family history of GC,
or associated inflammatory disease.
All specimens were pathologically verified by the
Department of Pathology at Xuzhou Medical College. Tumor staging
was classified according to the American Joint Committee on Cancer
GC TNM staging system (7th edition) (23). DFS was defined as the period between
surgery and the day that GC recurrence was first detected. When
there was no detected recurrence, the date of patient mortality or
last follow-up was used. OS was defined as the period between
surgery and the date of patient mortality. The total follow-up
period was 5 years after the surgery for the primary lesion. Data
including gender, age, histological grade and stage were retrieved
from surgical and pathological records.
Informed consent was obtained from all individuals
enrolled in the study, and the Xuzhou Medical College Ethics
Committee provided ethical approval for the study.
Tissue microarray and
immunohistochemistry
The formalin-fixed, paraffin-embedded 4 µm-thick
tissue samples were deparaffinized in xylene (twice for 10 min),
rehydrated in a graded series of ethanol (100, 95, 90, 80 and 75%
for 5 min each) and rinsed with tap water.
To produce a tissue microarray, hematoxylin and
eosin staining was performed to differentiate carcinoma tissue from
the surrounding tissue. A total of 3 sites, which were considered
typical cancerous gland tissues, were selected by two pathologists
of Xuzhou Medical College (Xuzhou, China) from each sample for
inclusion in the tissue microarray. The tissue microarray
preparation instrument was the MiniCore Tissue Arrayer (ALPHELYS,
Plaisir, France), which was used with a 1.0 mm sampling needle
diameter and 2.0 mm core spacing in a 10×7 organization of 70
sites, in each of 9 tissue chip wax blocks. Each tissue array block
was incubated at 52°C to integrate for 2 h, then stored at 4°C
until later use.
Immunohistochemical studies for CagA, c-Met, PI3K
and Beclin-1 were performed on 4 µm-thick tissue sections by
machine (Roche Benchmark XT) using the streptavidin-peroxidase
method. Antigen retrieval was performed in a microwave at pH 6 for
3 min at 80°C and 3 min at 50°C. The activity of endogenous
peroxidases was blocked through incubation with 3% hydrogen
peroxidase at room temperature for 20 min. Primary antibodies,
consisting of rabbit monoclonal antibodies against CagA (dilution,
1:50; cat. no., sc-25766; Santa Cruz Biotechnology, Inc., Dallas,
TX, USA), c-Met (dilution, 1:100; cat. no., ab51067; Abcam,
Shanghai, China), PI3K (dilution, 1:25; cat. no., ab86714; Abcam)
and Beclin-1 (dilution, 1:100; cat. no., ab55878; Abcam), were
incubated with the tissue sections at 4°C overnight. Incubation
with the alkaline phosphatase-conjugated goat anti-rabbit IgG
secondary antibody (dilution, 1:500; cat. no. ZB-2308; ZSGB-BIO
Technology, CO., Ltd., Beijing, China) was performed for 15 min at
37°C. The sections were developed with 3,3′-diaminobenzidine
solution (Maxim Biotech, Inc., Rockville, MD, USA) for 2 min at
room temperature and counterstained with hematoxylin. The tissues
were then rinsed with PBS for 5 min and differentiated with 0.1%
HCl in alcohol at room temperature for 10 sec. Finally, the
sections were dehydrated, cleared and mounted.
Immunohistochemical scoring
Sections were observed with a light microscope at
×200 magnification (DM2500; Leica Biosystems, Wetzlar, Germany) and
representative images were captured. Immunostaining was classified
according to its location (membrane, cytoplasm or nucleus).
Immunoreactivity for CagA, c-Met, PI3K or Beclin-1 were defined by
the presence of yellow cytoplasm staining. No evaluation of
staining intensity was used in the present study; only the
percentage of tumor cells was assessed (0–100%) for each sample, by
counting the frequency of stained cells in five high-power fields
(magnification, ×400), each containing ~100 cells. The percentage
of immunoreactive tumor cells was scored on a scale of 0–4: 0, no
staining; 1+, 1–10%; 2+, 11–30%; 3+, 31–50%; 4+, ≥50%). The
expression levels for each protein were divided into two groups,
according to score: Low (1+, 2+) and high (3+, 4+). The slides were
assessed independently by two pathologists who were blinded to the
clinical and outcome data. In the case of divergent results, the
two pathologists worked together to review the slides until a
consensus was reached.
Statistical analysis
Statistical analysis was performed with SPSS 19.0
software (IBM Corp., Armonk, NY, USA). The association between the
expression of CagA, c-Met, PI3K and Beclin-1 with the
clinicopathological variables of patients was analyzed by Pearson's
χ2 test or Fisher's exact test. The Kaplan-Meier method
was used to estimate the DFS and OS rate. Differences in DFS and OS
rate were analyzed with the log-rank test. OS and DFS time were
analyzed with the Cox proportional hazards model, including hazard
ratios (HRs) between prognostic groups, and the associated 95%
confidence intervals (CIs). Correlation between CagA expression
with the expression of c-Met, PI3K and Beclin-1 were analyzed by
Spearman's rank correlation coefficient (Rs). P<0.05
was considered to indicate a statistically significant
difference.
Results
C-Met, PI3K, Beclin-1 and CagA
expression in normal gastric mucosae and GC tissues
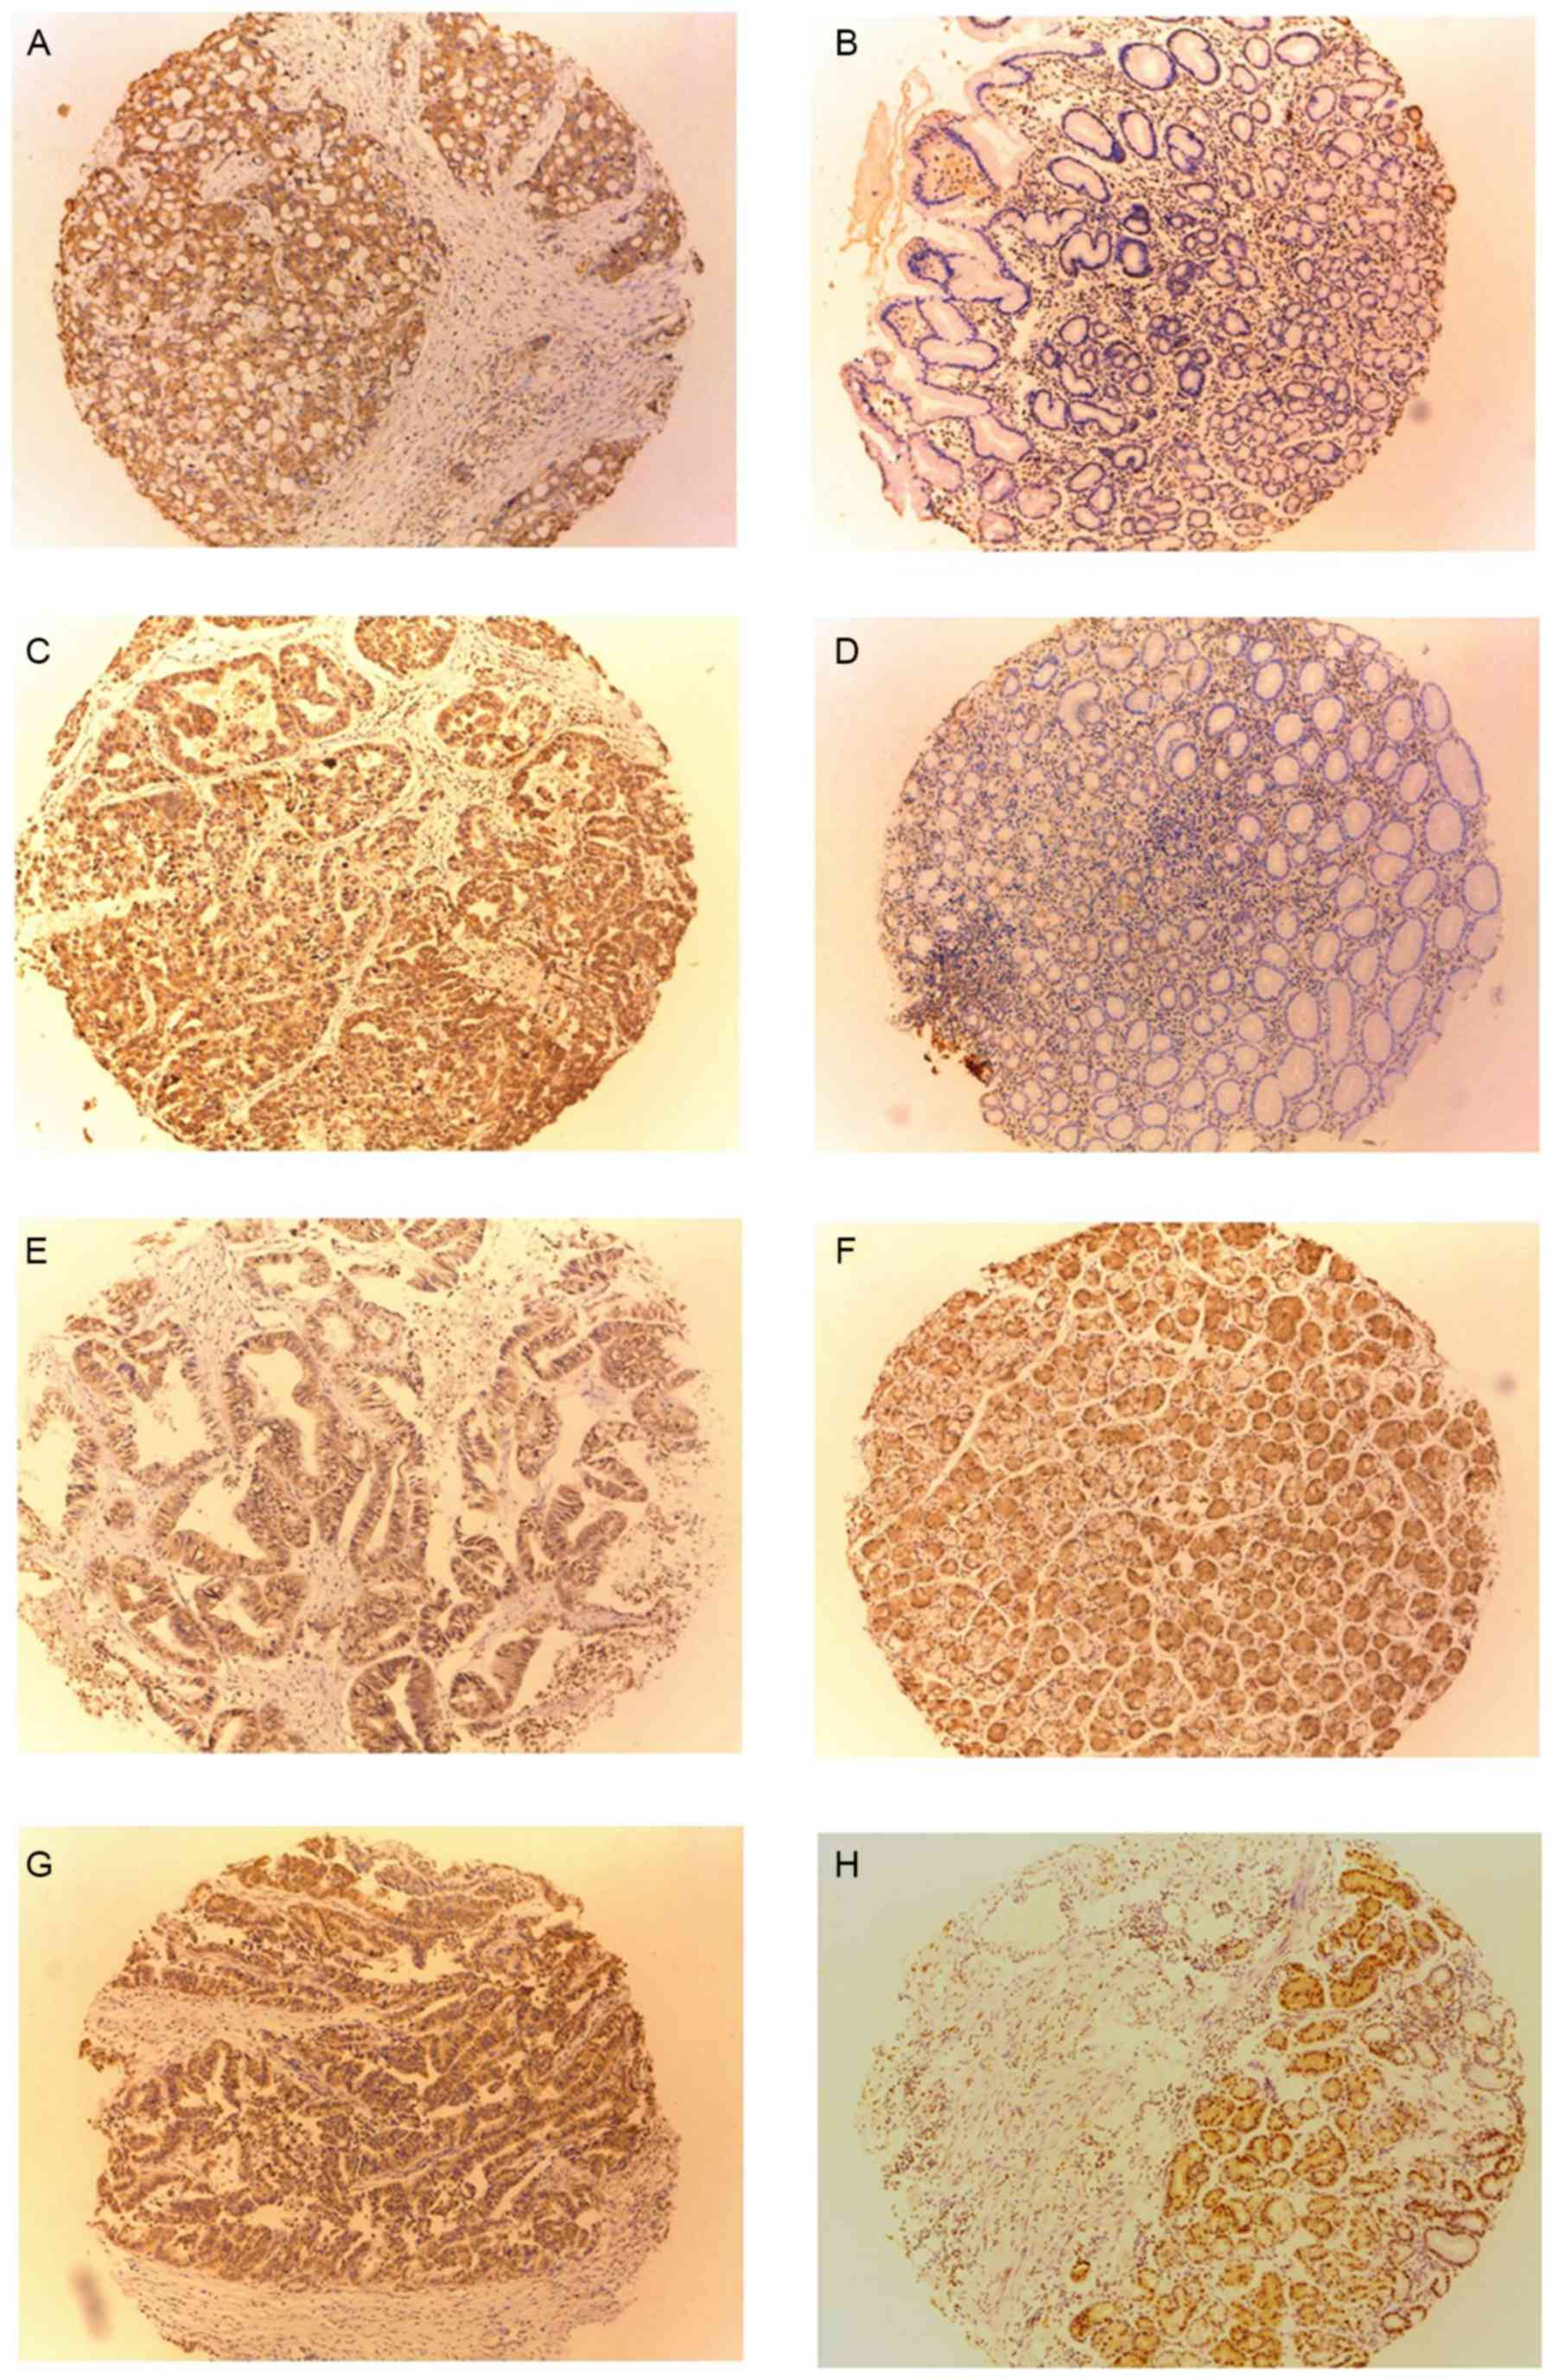
In general, absent or weak staining of c-Met was
indicated in the gastric mucosa of the 120 non-tumor control
samples, compared with relatively high immunoreactivity in the 121
GC samples. A total of 82 of the 121 GC samples (67.8%) exhibited
positive c-Met expression, including 21 with high expression (4+,
7; 3+, 14) and 61 with low expression (2+, 28; 1+, 33), whereas
there were 20 positive samples in non-tumor controls, including 11
with low expression (2+, 6; 1+, 5) and 9 with high expression (4+,
4; 3+, 5; 16.7%; P<0.001; Table I;
Fig. 1A and B).
 | Table I.Expression of c-Met, PI3K, Beclin-1
and CagA in gastric cancer and normal gastric mucosa tissues. |
Table I.
Expression of c-Met, PI3K, Beclin-1
and CagA in gastric cancer and normal gastric mucosa tissues.
|
|
| c-Met | PI3K | Beclin-1 | CagA |
|---|
|
|
|
|
|
|
|
|---|
| Tissue type | Cases, n | n (%) | P-valuea | n (%) | P-valuea | n (%) | P-valuea | n (%) | P-valuea |
|---|
| Tumor | 121 | 82 (67.8) | <0.001 | 90 (74.4) | <0.001 | 53 (43.8) | 0.001 | 86 (71.1) | <0.001 |
| Normal | 120 | 20 (16.7) |
| 32 (26.7) |
| 96 (80.0) |
| 54 (45.0) |
|
Similar to c-Met, PI3K expression was generally
absent or extremely weak in normal gastric mucosae and relatively
high in GC tissue. PI3K expression was identified in 90 of 121 GC
samples (74.4%) and 32 of 120 normal samples (26.7%). High levels
of PI3K expression were detected in 29 cases of GC (24.0%; 4+, 12;
3+, 17) and low levels in 61 cases (2+, 23; 1+, 38; P<0.001;
Table I; Fig. 1C and D). High levels of PI3K
expression were detected in 20 cases of normal samples (62.5%; 4+,
8; 3+, 12) and low levels were observed in 12 cases (2+, 7; 1+,
5).
Compared with normal mucosa tissues (96/120, 80%),
of which 45 exhibited a high level of Beclin-1 expression (4+, 19;
3+, 26) and 51 demonstrated a low level of Beclin-1 expression (2+,
29; 1+, 22), the expression of Beclin-1 was detected in a low
proportion of GC samples (53/121, 43.8%; P=0.001). A total of 23
cases in GC exhibited a high level of Beclin-1 expression (4+, 9;
3+, 14) and low expression was exhibited in 30 cases (2+, 17; 1+,
13; Table I; Fig. 1E and F).
CagA expression was significantly more likely in GC
tissue, as 86 of the 121 GC tissue samples (71.1%) exhibited
positive CagA expression, including 27 with high expression (4+, 9;
3+, 18) and 59 with low expression (2+, 30; 1+, 29), whereas 54
normal gastric mucosa tissue samples exhibited positive expression,
including 27 with high expression (4+, 10; 3+, 17) and 27 with low
expression (2+, 19; 1+, 8; 45%; P<0.001; Table I; Fig. 1G
and H).
Clinicopathological significance of
c-Met/PI3K/Beclin-1/CagA expression
The associations between the levels of c-Met, PI3K,
Beclin-1 and CagA expression and clinicopathological
characteristics are reported in Table
II. The high expression of c-Met was associated with lymphatic
metastasis (P=0.011) and the TNM stage of GC (P=0.011). High levels
of CagA and PI3K were associated with the depth of tumor invasion
(P=0.004 and P=0.037, respectively), lymphatic metastasis
(P<0.001 and P=0.001, respectively) and the TNM stage (both
P<0.001). Low Beclin-1 expression was associated with the degree
of differentiation (P=0.015), lymph node metastasis (P=0.029) and
the TNM stage (P=0.027). The data may indicate that c-Met, PI3K and
Beclin-1 expression, and CagA-positive H. pylori infection are all
involved in the molecular mechanisms for the progression of GC.
| Table II.Association between the
characteristics of patients with gastric cancer and the expression
of c-Met, PI3K, Beclin-1 and CagA. |
Table II.
Association between the
characteristics of patients with gastric cancer and the expression
of c-Met, PI3K, Beclin-1 and CagA.
|
|
| c-Met | PI3K | Beclin-1 | CagA |
|---|
|
|
|
|
|
|
|
|---|
| Clinicopathological
factor | Cases, n (%) | n (%) |
P-valuea | n (%) |
P-valuea | n (%) |
P-valuea | n (%) |
P-valuea |
|---|
| Sex |
|
|
|
|
|
|
|
|
|
|
Male | 71 (58.7) | 52 (73.2) | 0.167 | 55 (77.5) | 0.401 | 30 (42.3) | 0.713 | 51 (71.8) | 0.841 |
|
Female | 50 (41.3) | 30 (60.0) |
| 35 (70.0) |
| 23 (46.0) |
| 35 (70.0) |
|
| Age |
|
|
|
|
|
|
|
|
|
| <56
years | 56 (46.3) | 36 (64.3) | 0.559 | 39 (69.6) | 0.301 | 27 (48.2) | 0.463 | 38 (67.9) | 0.548 |
| ≥56
years | 65 (53.7) | 46 (70.8) |
| 51 (78.5) |
| 26 (40.0) |
| 48 (73.8) |
|
| Tumor size |
|
|
|
|
|
|
|
|
|
| <5
cm | 60 (49.6) | 36 (60.0) | 0.082 | 43 (71.7) | 0.537 | 27 (45.0) | 0.855 | 42 (70.0) | 0.843 |
| ≥5
cm | 61 (50.4) | 46 (75.4) |
| 47 (77.0) |
| 26 (42.6) |
| 44 (72.1) |
|
| Depth of
invasion |
|
|
|
|
|
|
|
|
|
|
Uninvolved serosa | 35 (28.9) | 21 (60.0) | 0.286 | 21 (60.0) | 0.037 | 17 (48.6) | 0.548 | 18 (51.4) | 0.004 |
| Serosal
invasion | 86 (71.1) | 61 (70.9) |
| 69 (80.2) |
| 36 (41.9) |
| 68 (79.1) |
|
|
Differentiation |
|
|
|
|
|
|
|
|
|
| Well or
moderate | 100 (82.6) | 65 (65.0) | 0.203 | 72 (72.0) | 0.237 | 49 (49.0) | 0.015 | 72 (72.0) | 0.607 |
|
Poor | 21 (17.4) | 17 (81.0) |
| 18 (85.7) |
| 4 (19.0) |
| 14 (66.7) |
|
| Lymph node invasion
status |
|
|
|
|
|
|
|
|
|
|
Negative | 66 (54.5) | 38 (57.6) | 0.011 | 41 (62.1) | 0.001 | 35 (53.0) | 0.029 | 36 (54.5) | <0.001 |
|
Positive | 55 (45.5) | 44 (80.0) |
| 49 (89.1) |
| 18 (32.7) |
| 50 (90.9) |
|
| TNM stage |
|
|
|
|
|
|
|
|
|
| I or
II | 63 (52.1) | 36 (57.1) | 0.011 | 38 (60.3) | <0.001 | 34 (54.0) | 0.027 | 34 (53.9) | <0.001 |
| III or
IV | 58 (47.9) | 46 (79.3) |
| 52 (89.7) |
| 19 (32.8) |
| 52 (89.7) |
|
Association between CagA, c-Met, PI3K
and Beclin-1 expression
As included in Table
III, the data suggested an association between CagA and c-Met
or Beclin-1 expression in 121 GC tissue samples. There were 64
c-Met/CagA-positive and 17 c-Met/CagA-negative tumors
(Rs=0.223, P=0.014), and 32 Beclin-1/CagA-positive and
14 Beclin-1/CagA-negative tumors (Rs=−0.245, P=0.007).
No significant correlation between PI3K and CagA positivity was
identified (Rs=0.127, P=0.164). In all 121 gastric
cancer patients, 86 patients had high expression of CagA (positive
rate, 71.1%). In the CagA-positive group, 32 patients had low
expression of Beclin-1 (32/86; 37.2%; P=0.007) and 64 patients had
high levels of c-Met (P=0.014). However, CagA was not associated
with high expression of PI3K (P=0.164) (Table III).
| Table III.Correlation between CagA expression
with the expression of c-Met, PI3K and Beclin-1. |
Table III.
Correlation between CagA expression
with the expression of c-Met, PI3K and Beclin-1.
|
| c-Met |
|
| PI3K |
|
| Beclin-1 |
|
|
|---|
|
|
|
|
|
|
|
|
|
|
|
|---|
| CagA | − | + | Rs | P-value | − | + | Rs | P-value | − | + | Rs | P-value |
|---|
| Negative | 17 | 18 | 0.223 | 0.014 | 12 | 23 | 0.127 | 0.164 | 14 | 21 | −0.245 | 0.007 |
| Positive | 22 | 64 |
|
| 19 | 67 |
|
| 54 | 32 |
|
|
| Total | 39 | 82 |
|
| 31 | 90 |
|
| 68 | 53 |
|
|
c-Met, PI3K, Beclin-1 and CagA
expression association with patient survival
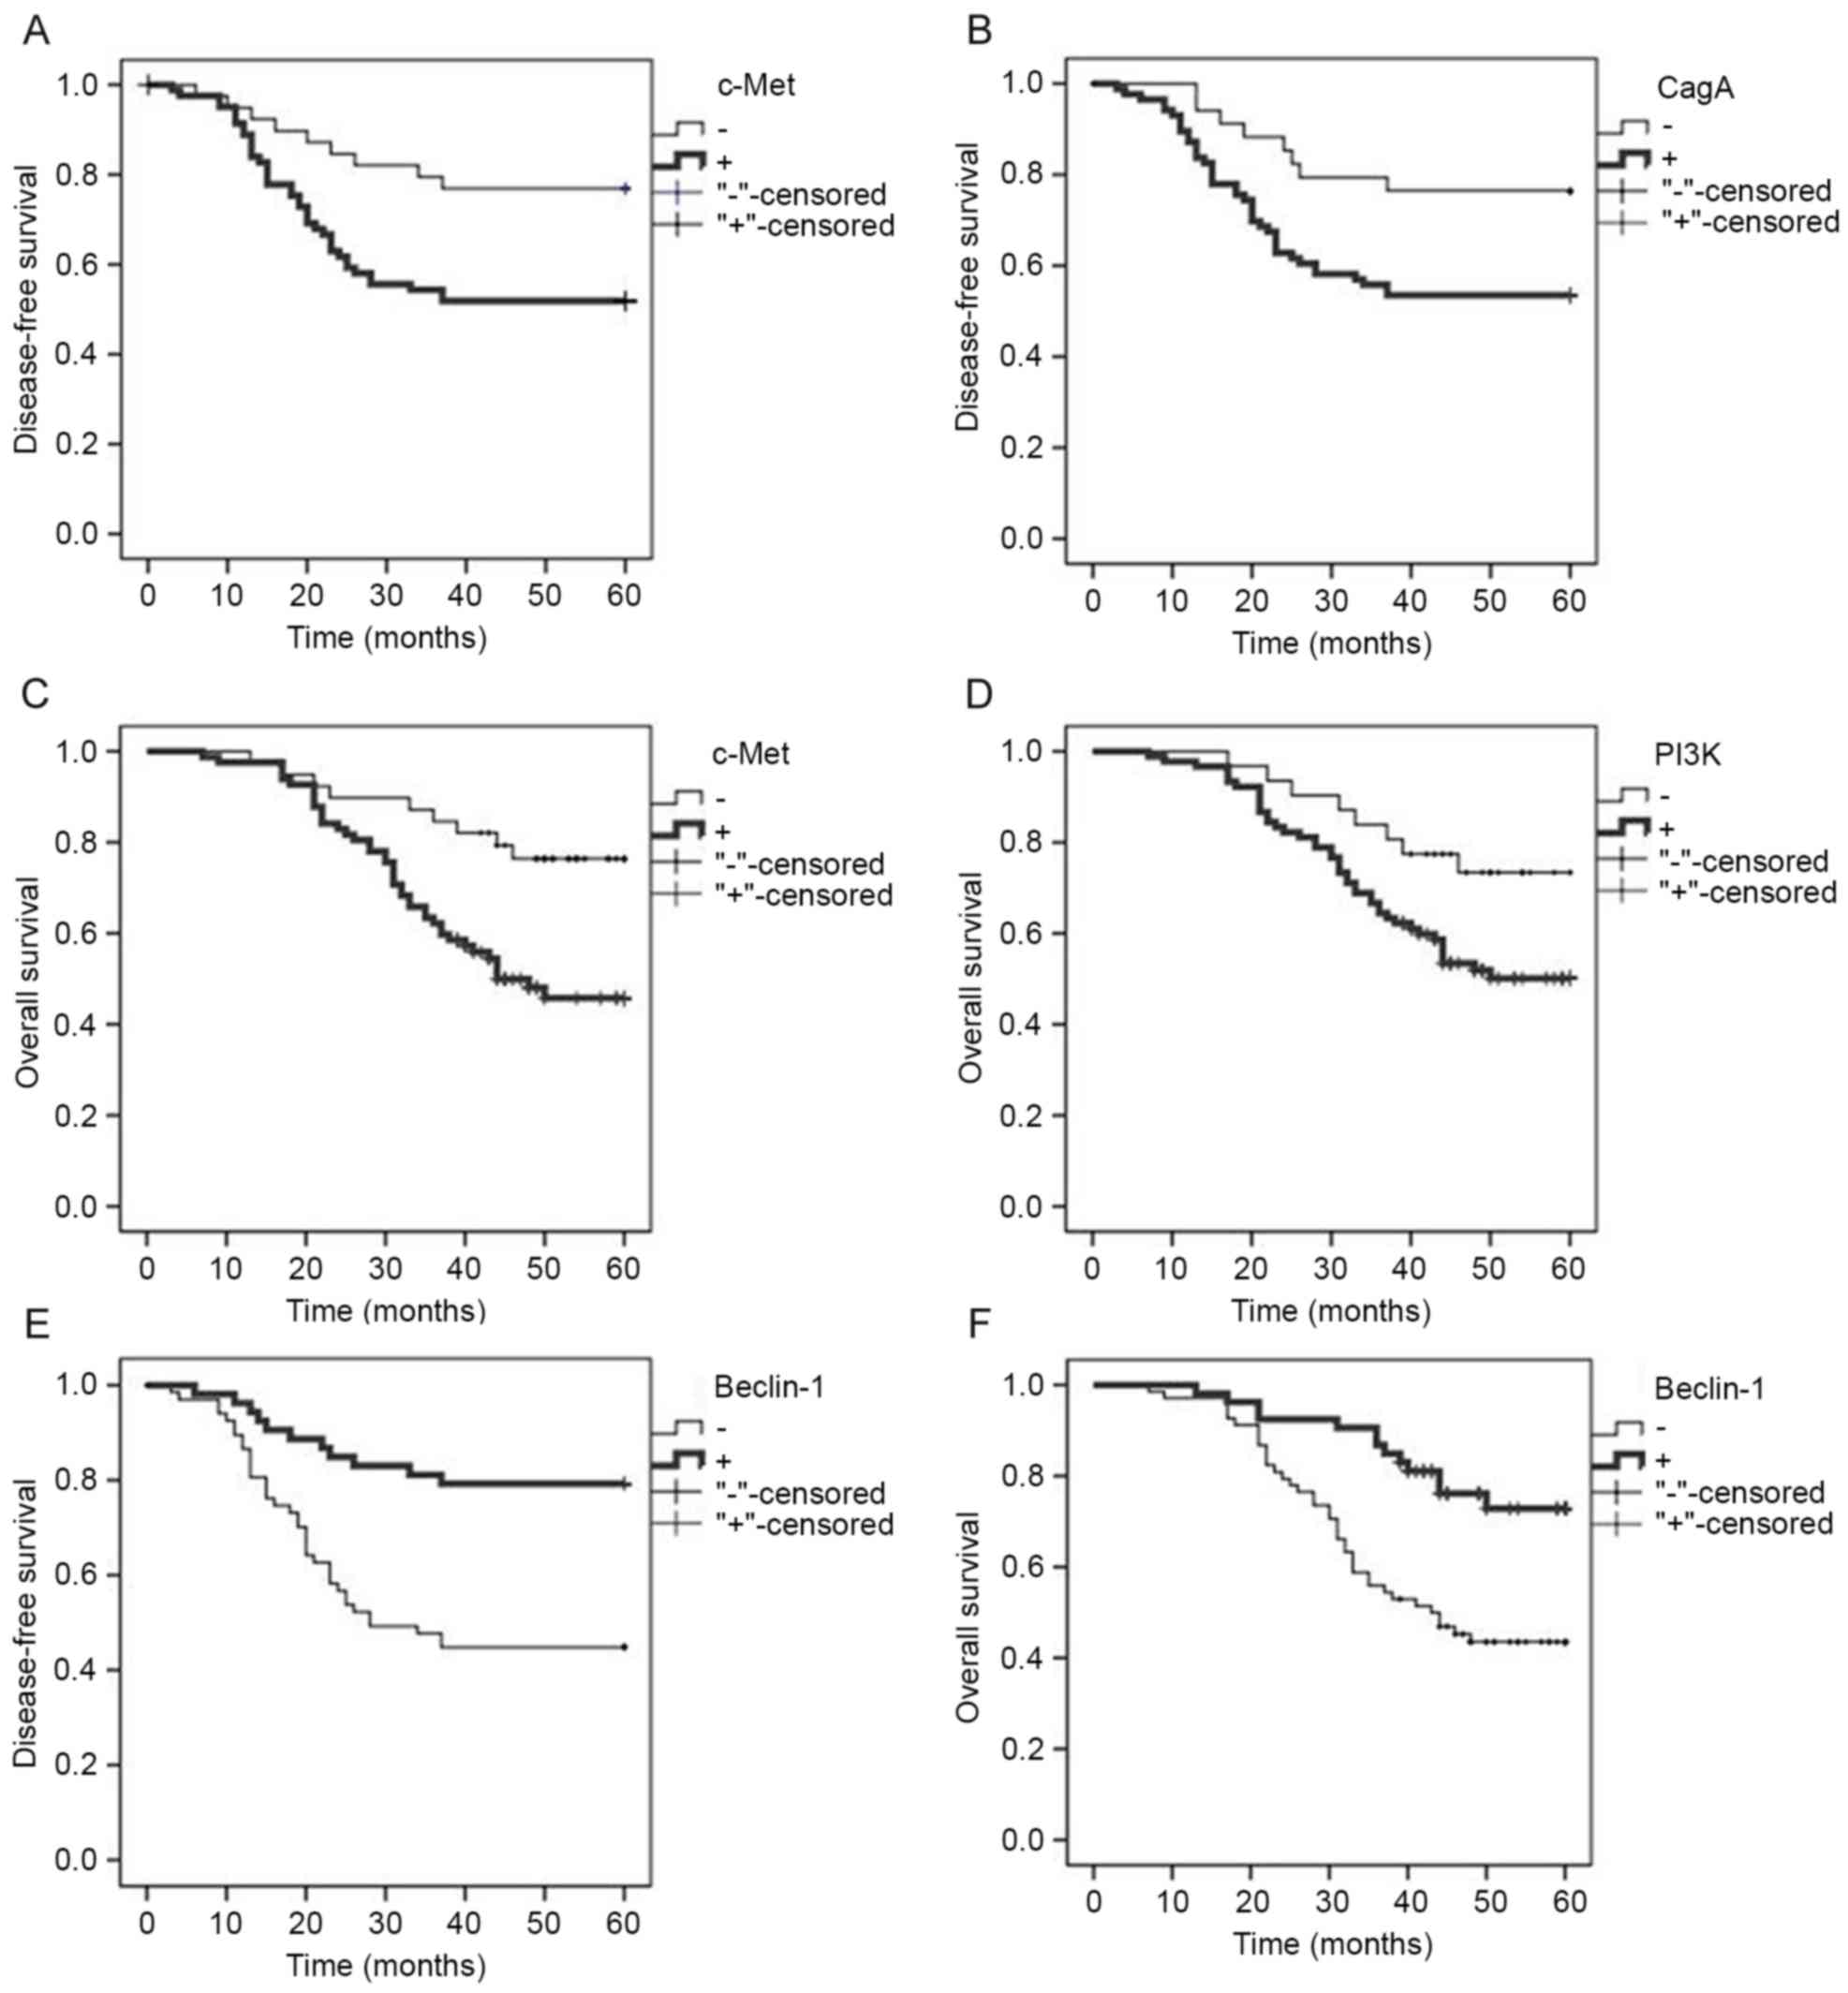
The association between c-Met, PI3K, Beclin-1 and
CagA expression and the survival rate of patients with GC was
assessed (Table IV; Fig. 2). The high expression of c-Met and
CagA in tissues were significantly associated with poor DFS rate
(log-rank P=0.010 and P=0.020, respectively; Fig. 2A and B). Furthermore, the high
expression of c-Met and PI3K were significantly associated with a
poor OS rate (log-rank P=0.003 and P=0.035, respectively; Fig. 2C and D). Low expression of Beclin-1
was also significantly associated with a poor DFS and OS rate
(log-rank P<0.001 and P=0.001, respectively; Fig. 2E and F). However, the expression of
PI3K was not significantly associated with the DFS rate (log-rank
P=0.152; data not shown) and CagA was not associated with the OS
rate (log-rank P=0.072; data not shown).
| Table IV.Univariate analysis of the
association between 5-year DFS and OS and clinicopathological
factors, including the expression of c-Met, PI3K and Beclin-1. |
Table IV.
Univariate analysis of the
association between 5-year DFS and OS and clinicopathological
factors, including the expression of c-Met, PI3K and Beclin-1.
|
|
| 5-year DFS | 5-year OS |
|---|
|
|
|
|
|
|---|
| Clinicopathological
factors | Cases, n | n (%) |
P-valuea | n (%) |
P-valuea |
|---|
| Sex |
|
|
|
|
|
|
Male | 71 | 40 (56.3) | 0.321 | 39 (54.9) | 0.488 |
|
Female | 50 | 33 (66.0) |
| 31 (62.0) |
|
| Age |
|
|
|
|
|
| <56
years | 56 | 38 (67.9) | 0.101 | 39 (69.6) | 0.017 |
| ≥56
years | 65 | 35 (53.8) |
| 31 (47.7) |
|
| Tumor size |
|
|
|
|
|
| <5
cm | 60 | 43 (71.7) | 0.009 | 43 (71.7) | 0.002 |
| ≥5
cm | 61 | 30 (49.2) |
| 27 (44.3) |
|
| Depth of
invasion |
|
|
|
|
|
|
Uninvolved serosa | 35 | 25 (71.4) | 0.120 | 24 (68.6) | 0.095 |
| Serosal
invasion | 86 | 48 (55.8) |
| 46 (53.5) |
|
|
Differentiation |
|
|
|
|
|
| Well or
moderate | 100 | 66 (66.0) | 0.003 | 64 (64.0) | 0.001 |
|
Poor | 21 | 7 (33.3) |
| 6 (28.6) |
|
| Lymph node invasion
status |
|
|
|
|
|
|
Negative | 66 | 47 (71.2) | 0.005 | 49 (74.2) | <0.001 |
|
Positive | 55 | 26 (47.3) |
| 21 (38.2) |
|
| TNM stage |
|
|
|
|
|
| I or
II | 63 | 47 (74.6) | <0.001 | 49 (77.8) | <0.001 |
| III or
IV | 58 | 26 (44.8) |
| 21 (36.2) |
|
| c-Met |
|
|
|
|
|
|
Negative | 39 | 30 (76.9) | 0.010 | 31 (79.5) | 0.003 |
|
Positive | 82 | 43 (52.4) |
| 39 (47.6) |
|
| PI3K |
|
|
|
|
|
|
Negative | 31 | 22 (70.9) | 0.152 | 22 (70.9) | 0.035 |
|
Positive | 90 | 51 (56.7) |
| 48 (53.3) |
|
| Beclin-1 |
|
|
|
|
|
|
Negative | 68 | 31 (45.6) | <0.001 | 30 (44.1) | 0.001 |
|
Positive | 53 | 42 (79.2) |
| 40 (75.5) |
|
| CagA |
|
|
|
|
|
|
Negative | 35 | 27 (77.1) | 0.020 | 25 (71.4) | 0.072 |
|
Positive | 86 | 46 (53.5) |
| 45 (52.3) |
|
In a univariate analysis, the high expression of
c-Met (HR, 2.502; 95% CI, 1.211–5.171; P=0.013) or CagA (HR, 2.384;
95% CI, 1.115–5.095; P=0.025) were associated with a poor DFS rate.
In addition, the high expression of c-Met (HR, 2.825; 95% CI,
1.371–5.820; P=0.005) or PI3K (HR, 2.193; 95% CI, 1.030–4.666;
P=0.042) were associated with a poor OS rate. The low expression of
Beclin-1 was also significantly associated with a poor DFS (HR,
0.296; 95% CI, 0.151–0.581; P<0.001) and OS rate (HR, 0.35; 95%
CI, 0.186–0.658; P=0.001). However, the high expression of PI3K was
not significantly associated with the DFS rate (P=0.16) and the
expression of CagA was not significantly associated with the OS
rate (P=0.079; Table V).
| Table V.Univariate and multivariate analysis
of the association between DFS and OS and clinicopathological
factors, including the expression of c-Met, PI3K, Beclin-1 and
CagA. |
Table V.
Univariate and multivariate analysis
of the association between DFS and OS and clinicopathological
factors, including the expression of c-Met, PI3K, Beclin-1 and
CagA.
| A, Association with
5-year DFS |
|---|
|
|---|
|
| Univariate
analysis | Multivariate
analysis |
|---|
|
|
|
|
|---|
| Variable | P-value | HR (95% CI) | P-value | HR (95% CI) |
|---|
| Sex
(male/female) | 0.298 | 0.730
(0.404–1.320) | – | – |
| Age (≥56/<56
years) | 0.124 | 1.583
(0.882–2.840) | – | – |
| Tumor size
(≥5/<5 cm) | 0.013 | 2.117
(1.170–3.829) | 0.014 | 2.108
(1.163–3.820) |
| Serosal invasion
status | 0.117 | 1.745
(0.870–3.503) | – | – |
| Differentiation
(moderate and well/poor) | 0.002 | 2.659
(1.424–4.966) | – | – |
| Lymph node invasion
status | 0.008 | 2.199
(1.232–3.928) | 0.031 | 1.725
(0.954–2.541) |
| TNM stage (I and
II/III and IV) | 0.001 | 2.759
(1.511–5.037) | 0.002 | 2.423
(1.159–4.152) |
| c-Met expression
status | 0.013 | 2.502
(1.211–5.171) | 0.049 | 2.083
(1.004–4.322) |
| PI3K expression
status | 0.016 | 1.681
(0.814–3.472) | – | – |
| Beclin-1 expression
status | <0.001 | 0.296
(0.151–0.581) | 0.001 | 0.312
(0.158–0.616) |
| CagA expression
status | 0.025 | 2.384
(1.115–5.095) | – | – |
|
| B, Association
with 5-year OS |
|
|
| Univariate
analysis | Multivariate
analysis |
|
|
|
|
|
Variable | P-value | HR (95%
CI) | P-value | HR (95%
CI) |
|
| Sex
(male/female) | 0.492 | 0.819
(0.464–1.446) | – | – |
| Age (≥56/<56
years) | 0.020 | 2.001
(1.116–3.586) | 0.020 | 2.018
(1.119–3.642) |
| Tumor size
(≥5/<5 cm) | 0.003 | 2.445
(1.363–4.389) | 0.015 | 2.121
(1.160–3.879) |
| Serosal invasion
status | 0.102 | 1.746
(0.895–3.406) | – | – |
| Differentiation
(moderate and well/poor) | 0.002 | 2.595
(1.419–4.747) | 0.022 | 0.740
(1.123–3.828) |
| Lymph node invasion
status | <0.001 | 3.062
(1.708–5.491) | 0.015 | 0.217
(0.064–0.742) |
| TNM stage (I and
II/III and IV) | <0.001 | 3.898
(2.102–7.226) | <0.001 | 13.580
(3.739–49.330) |
| c-Met expression
status | 0.005 | 2.825
(1.371–5.820) | – | – |
| PI3K expression
status | 0.042 | 2.193
(1.030–4.666) | – | – |
| Beclin-1 expression
status | 0.001 | 0.350
(0.186–0.658) | – | – |
| CagA expression
status | 0.079 | 0.857
(0.930–3.710) | – | – |
In multivariate analysis of Table V, the high expression of c-Met and low
expression of Beclin-1 were associated with a poor DFS rate
(adjusted HR, 2.083; 95% CI, 1.004–4.322; P=0.049; adjusted HR,
0.312; 95% CI, 0.158–0.616; P=0.001, respectively).
Discussion
Cancer is a considerable burden on global health.
Within the next twenty years, new cancer cases and mortalities
worldwide annually will reach 22 million and 13 million,
respectively (1). GC is the second
most common cause for cancer-associated mortality (2). An estimated 20–25% of all cases of
cancer worldwide are associated with inflammation induced by
microbial infection (24).
CagA-positive H. pylori infection is a severe risk factor
for the initiation and development of human GC (17). In the present study, the CagA-positive
rate in GC tissues was determined to be significantly higher than
in normal tissues. The expression of CagA was significantly
associated with the depth of tumor invasion, lymph node metastasis
and the TNM tumor stage of GC. Tumor CagA-positivity was negatively
associated with the likelihood of 5-year DFS. CagA is implicated in
the neoplasia, invasion and metastasis of GC (10–12). Thus,
it was demonstrated that the eradication of CagA-positive H.
pylori infection may reduce the rate of GC incidence, and may
also prolong the DFS period of patients with GC.
c-Met protein is a transmembrane protein derived
from a 170-kDa precursor (25). c-Met
function is normally associated with embryonic development and
damage repair; however, deregulation of the protein induces
tumorigenesis (26). Churin et
al (17) demonstrated that H.
pylori CagA protein targets the c-Met receptor to invoke a
mitogenic response. Yang et al (12) verified that interactions between genes
affected by CagA and c-Met significantly intensified the risk of
GC. In solid tumors, aberrant c-Met phosphorylation can facilitate
the epithelial-mesenchymal transition, a key step in tumor
progression to metastatic disease (20,22,24).
Churin et al (17)
demonstrated that CagA interacts with c-Met in cells co-cultured
with H. pylori. Oliveira et al also suggest that
H. pylori-induced cell invasion requires c-Met activity
(27). These reports revealed that
H. pylori may not only have a role in gastric
carcinogenesis, but also in the progression of the tumor to
invasion and metastasis through the CagA-dependent activation of
the c-Met receptor (17,27,28). The
data of the present study demonstrated that the expression of c-Met
was higher in GC tissue than in normal gastric mucosa. The
expression of c-Met was significantly associated with lymphatic
metastasis and the TNM stage of GC. The expression of c-Met was
significantly negatively associated with the likelihood of 5-year
DFS and OS. There was additionally a statistically significant
association between c-Met- and CagA-positivity. This result
indicates that CagA-positive H. pylori infection was
associated with the c-Met-dependent signaling pathway in GC
genesis, progression and metastasis.
H. pylori infection stimulates c-Met
phosphorylation via interaction with CagA, which promotes H.
pylori-induced cancer cell motility and invasion. The
interaction of c-Met with CagA may lead to PI3K activation.
Activated PI3K stimulates the phosphorylation of Akt. The
phosphorylation of Akt promotes tumor cell invasion and the
expression of oncogenes through the PI3K/Akt signaling pathway. The
activated Akt stimulates the phosphorylation of downstream target
proteins, suppresses autophagy and increases the resistance to
apoptosis. These events promote gastric tumor cell proliferation
and invasion (19–22,29). The
results of the present study demonstrated that the expression of
PI3K was higher in GC tissues than in normal gastric mucosa. The
expression of PI3K was significantly associated with the depth of
tumor invasion, lymphatic metastasis and TNM tumor stage of GC. The
expression of PI3K was significantly negatively associated with the
likelihood of 5-year OS. There was no observed association between
PI3K and CagA-positivity, although this association may be
observable in a larger study cohort. The expression of Beclin-1 was
significantly lower in GC tissue, particularly in CagA-positive GC
cases. The data have demonstrated that CagA-positive H.
pylori infection was associated with the suppression of
autophagy in the neoplasia and metastasis of GC. Once the
underlying oncogenic mechanisms have been confirmed, it may be
possible to classify tumors and develop targeted therapies for
individual tumors. An additional study with a larger sample size
will be performed in the near future.
To conclude, the findings of the present study
indicate that CagA-positive H. pylori infection, and the
expression of c-Met, PI3K and Beclin-1 may have major roles in the
oncogenesis, invasive growth and lymph node metastasis of GC. The
DFS rate was significantly negatively associated with the
expression of c-Met and CagA in GC tissue whereas it was positively
associated with Beclin-1 expression. OS was also negatively
associated with expression of c-Met and PI3K, whereas it was
positively associated with Beclin-1. Furthermore, c-Met and
Beclin-1 could be an independent and efficient biomarker for
predicting the DFS of GC patients. In CagA-positive H.
pylori infection-associated GC, c-Met expression was
upregulated, and Beclin-1 expression was downregulated,
significantly. CagA-positive H. pylori infection was closely
associated with the c-Met-dependent signaling pathway and the
suppression of autophagy in the neoplasia, invasion and metastasis
of GC. The investigation indicated that modulators targeting c-Met
or promoting Beclin-1 may be suitable for development as agents for
treating GC, particularly CagA-positive H. pylori
infection-associated GC.
References
|
1
|
Stewart BW and Wild CP: World Cancer
Report 2014. Geneva: World Health Organization, International
Agency for Research on Cancer, WHO Press; 2015
|
|
2
|
Zhang S, Chen P, Huang Z, Hu X, Chen M, Hu
S, Hu Y and Cai T: Sirt7 promotes gastric cancer growth and
inhibits apoptosis by epigenetically inhibiting miR-34a. Sci Rep.
10:97872015. View Article : Google Scholar
|
|
3
|
WHO, . A Survey of Cancer 2014[DB/OL].
http://www.who.int/cancer/country-profiles/en/2014
|
|
4
|
Siegel R, Naishadham D and Jemal A: Cancer
statistics for Hispanics/Latinos. CA Cancer J Clin. 62:283–298.
2012. View Article : Google Scholar : PubMed/NCBI
|
|
5
|
Li ZX and Kaminishi MA: Comparison of
gastric cancer between Japan and China. Gastric Cancer. 12:52–53.
2009. View Article : Google Scholar : PubMed/NCBI
|
|
6
|
International Agency for Research on
Cancer, . Helicobatcer pylori Eradication as a Strategy for
Preventing Gastric Cancer, IARC Working Group Reports. 8. Lyon:
IARC; 2013, http://www.iarc.fr/en/publications/pdfs-online/wrk/wrk8/Helicobacter_pylori_Eradication.pdfJune
14–2016
|
|
7
|
Odenbreit S, Püls J, Sedlmaier B, Gerland
E, Fischer W and Haas R: Translocation of Helicobacter pylori CagA
into gastric epithelial cells by type IV secretion. Science.
287:1497–1500. 2000. View Article : Google Scholar : PubMed/NCBI
|
|
8
|
Higashi H, Tsutsumi R, Muto S, Sugiyama T,
Azuma T, Asaka M and Hatakeyama M: SHP-2 tyrosine phosphatase as an
intracellular target of Helicobacter pylori CagA protein. Science.
295:683–686. 2002. View Article : Google Scholar : PubMed/NCBI
|
|
9
|
Higashi H, Yokoyama K, Fujii Y, Ren S,
Yuasa H, Saadat I, Murata-Kamiya N, Azuma T and Hatakeyama M: EPIYA
motif is a membrane-targeting signal of Helicobacter pylori
virulence factor CagA in mammalian cells. J Biol Chem.
280:23130–23137. 2005. View Article : Google Scholar : PubMed/NCBI
|
|
10
|
Peek RM Jr and Blaser MJ: Helicobacter
pylori and gastrointestinal tract adenocarcinomas. Nat Rev Cancer.
2:28–37. 2002. View
Article : Google Scholar : PubMed/NCBI
|
|
11
|
Blaser MJ, Perez-Perez GI, Kleanthous H,
Cover TL, Peek RM, Chyou PH, Stemmermann GN and Nomura A: Infection
with Helicobacter pylori strains possessing cagA is associated with
an increased risk of developing adenocarcinoma of the stomach.
Cancer Res. 55:2111–2115. 1995.PubMed/NCBI
|
|
12
|
Yang JJ, Yang JH, Kim J, Ma SH, Cho LY, Ko
KP, Shin A, Choi BY, Kim HJ, Han DS, et al: Soluble c-Met protein
as a susceptible biomarker for gastric cancer risk: A nested
case-control study within the Korean Multicenter Cancer Cohort. Int
J Cancer. 132:2148–2156. 2013. View Article : Google Scholar : PubMed/NCBI
|
|
13
|
Taniguchi K, Yonemura Y, Nojima N, Hirono
Y, Fushida S, Fujimura T, Miwa K, Endo Y, Yamamoto H and Watanabe
H: The relation between the growth patterns of gastric carcinoma
and the expression of hepatocyte growth factor receptor (c-met),
autocrine motility factor receptor, and urokinase-type plasminogen
activator receptor. Cancer. 82:2112–2122. 1998. View Article : Google Scholar : PubMed/NCBI
|
|
14
|
Toiyama Y, Yasuda H, Saigusa S, Matushita
K, Fujikawa H, Tanaka K, Mohri Y, Inoue Y, Goel A and Kusunoki M:
Co-expression of hepatocyte growth factor and c-Met predicts
peritoneal dissemination established by autocrine hepatocyte growth
factor/c-Met signaling in gastric cancer. Int J Cancer.
130:2912–2921. 2012. View Article : Google Scholar : PubMed/NCBI
|
|
15
|
Li Y, Chen CQ, He YL, Cai SR, Yang DJ, He
WL, Xu JB and Zan WH: Abnormal expression of E-cadherin in tumor
cells is associated with poor prognosis of gastric carcinoma. J
Surg Oncol. 106:304–310. 2012. View Article : Google Scholar : PubMed/NCBI
|
|
16
|
Yıldız Y, Sokmensuer C and Yalcin S:
Evaluation of c-Met, HGF, and HER-2 expressions in gastric
carcinoma and their association with other clinicopathological
factors. Onco Targets Ther. 9:5809–5817. 2016. View Article : Google Scholar : PubMed/NCBI
|
|
17
|
Churin Y, Al-Ghoul L, Kepp O, Meyer TF,
Birchmeier W and Naumann M: Helicobacter pylori CagA protein
targets the c-Met receptor and enhances the motogenic response. J
Cell Biol. 161:249–255. 2003. View Article : Google Scholar : PubMed/NCBI
|
|
18
|
Wang RC, Wei Y, An Z, Zou Z, Xiao G,
Bhagat G, White M, Reichelt J and Levine B: Akt-mediated regulation
of autophagy and tumorigenesis through Beclin 1 phosphorylation.
Science. 338:956–959. 2012. View Article : Google Scholar : PubMed/NCBI
|
|
19
|
Vasconcelos AC, Wagner VP, Meurer L,
Vargas PA, de Souza LB, Fonseca FP, Squarize CH, Castilho RM and
Martins MD: Immunoprofile of c-MET/PI3K signaling in human salivary
gland tumors. Oral Surg Oral Med Oral Pathol Oral Radiol.
120:238–247. 2015. View Article : Google Scholar : PubMed/NCBI
|
|
20
|
Zhuo B, Li Y, Li Z, Qin H, Sun Q, Zhang F,
Shen Y, Shi Y and Wang R: PI3K/Akt signaling mediated Hexokinase-2
expression inhibits cell apoptosis and promotes tumor growth in
pediatric osteosarcoma. Biochem Biophys Res Commun. 464:401–406.
2015. View Article : Google Scholar : PubMed/NCBI
|
|
21
|
Jung KA, Choi BH and Kwak MK: The
c-MET/PI3K signaling is associated with cancer resistance to
doxorubicin and photodynamic therapy by elevating BCRP/ABCG2
expression. Mol Pharmacol. 87:465–476. 2015. View Article : Google Scholar : PubMed/NCBI
|
|
22
|
Wu J, Chen C and Zhao KN:
Phosphatidylinositol 3-kinase signaling as a therapeutic target for
cervical cancer. Curr Cancer Drug Targets. 13:143–156. 2013.
View Article : Google Scholar : PubMed/NCBI
|
|
23
|
Edge SB, Byrd DR, Compton CC, Fritz AG,
Greene FL and Trotti A: AJCC Cancer Staging Manual. 7th. Springer;
New York: pp. 191–200. 2010
|
|
24
|
Okada F: Inflammation-related
carcinogenesis: Current findings in epidemiological trends, causes
and mechanisms. Yonago Acta Med. 57:65–72. 2014.PubMed/NCBI
|
|
25
|
Wajih N, Walter J and Sane DC: Vascular
origin of a soluble truncated form of the hepatocyte growth factor
receptor (c-met). Circ Res. 90:46–52. 2002. View Article : Google Scholar : PubMed/NCBI
|
|
26
|
Porter J: Small molecule c-Met kinase
inhibitors: A review of recent patents. Expert Opin Ther Pat.
20:159–177. 2010. View Article : Google Scholar : PubMed/NCBI
|
|
27
|
Oliveira MJ, Costa AC, Costa AM, Henriques
L, Suriano G, Atherton JC, Machado JC, Carneiro F, Seruca R, Mareel
M, et al: Helicobacter pylori induces gastric epithelial cell
invasion in a c-Met and type IV secretion system-dependent manner.
J Biol Chem. 281:34888–34896. 2006. View Article : Google Scholar : PubMed/NCBI
|
|
28
|
Snider JL and Cardelli JA: Helicobacter
pylori induces cancer cell motility independent of the c-Met
receptor. J Carcinog. 8:72009. View Article : Google Scholar : PubMed/NCBI
|
|
29
|
Hu Y, Li L, Yin W, Shen L, You B and Gao
H: Protective effect of proanthocyanidins on anoxia-reoxygenation
injury of myocardial cells mediated by the PI3K/Akt/GSK-3β pathway
and mitochondrial ATP-sensitive potassium channel. Mol Med Rep.
10:2051–2058. 2014. View Article : Google Scholar : PubMed/NCBI
|