Introduction
Lung cancer is the leading cause of
cancer-associated mortality globally (1,2). The
discovery and application of epidermal growth factor receptor
(EGFR)-tyrosine kinase inhibitors (TKIs) have proved beneficial to
patients with sensitive EGFR mutations compared with
chemotherapy (3–5). However, ~10% of patients with activated
EGFR mutations demonstrate primary resistance to EGFR-TKI.
Another group of patients with an immediate initial response
inevitably developed acquired resistance to TKIs in an average time
of ~8 months (6,7). Although, much is known about acquired
resistance, only very few primary resistance cases have been
elucidated, which involve de novo T790M mutations and Bcl-2-L11
(BIM) deletion polymorphisms (6,8,9). Thus, further study is still required to
gain an improved understanding of EGFR-TKI resistance.
A previous study conducted by our group validated
the inferior response to EGFR-TKIs in patients carrying the
BIM deletion polymorphism (10). BIM is a pro-apoptotic protein that
belongs to the B-cell lymphoma-2 (Bcl-2) family (11). Via the BH3 domain, BIM activates
downstream pro-apoptotic proteins, including Bcl-2 homologous
antagonist killer (BAK) and Bcl-2 associated X protein (BAX) and
antagonizes anti-apoptotic proteins, including B-cell lymphoma 2
(Bcl-2). The stimulation of BAK and BAX induces the release of
cytochrome c into the cytoplasm and consequently triggers the
caspase cascade. Thus, BIM is involved in the mitochondrial
apoptotic pathway (12). In EGFR TKI
therapy, BIM is pivotal in apoptosis. The BIM deletion
polymorphism impairs the expression of BH3-containing BIM
isoforms and leads to primary resistance to TKIs (9,10).
Epigenetic silencing of BIM, including promoter methylation
and histone-deacetylation, has also been reported in hematological
malignances; including Burkitt's lymphoma, non-Hodgkin lymphoma,
chronic myeloid leukemia (12–14) and
solid tumors, including renal carcinoma (15).
DNA promoter hyper-methylation and histone
deacetylation are two major, closely associated epigenetic
regulatory mechanisms. Histone deacetylation enhances the
methylation-induced inhibition of transcription, by forming the
transcription-inhibitory complex. The capacity of histone
deacetylation depends on the number of methylated CpG islands
(16). In cases where the gene
promoter region was lacking in methylated CpGs to inhibit
transcription, histone deacetylation acted as the major inhibitor
in the transcription process. Conversely, methylated CpGs increased
the activity of histone deacetylase (HDAC), which further
contracted the chromatin and thus inhibited transcription (17). The aim of the present study was to
investigate the impact of promoter methylation and histone
deacetylation of BIM in NSCLC cell lines and patients with
NSCLC, to identify an association with EGFR-TKI resistance.
Materials and methods
Cell culture and in vitro
treatment
A total of 8 human NSCLC cell lines were used in the
present study. PC9, A549, H1299, H292, H1975 and H520 were obtained
from the American Type Culture Collection (Manassas, VA, USA) and 2
gefitinib-resistant PC9 cell lines, PC9/R and PC9/G2, were induced
in the laboratory. The culture methods for each cell line have been
previously reported in multiple publications and were employed in
the present study (18,19). Cultured PC-9 cells were exposed to 2.5
µg/ml N-methyl-N'-nitro-N-nitrosoguanidine (MNNG) for 24 h and then
washed and cultured in medium containing 0.2 µM gefitinib for 7
days. Following exposure to gefitinib, cells were washed and
cultured in drug-free medium for 14 days. When variable cells had
grown, they were seeded in medium containing 0.3–0.5 µM of
gefitinib on 96-well cultured plates for subcloning. After 21–28
days, the colonies were harvested and a single clone was obtained.
The subcloned cells exhibited an 182-fold increase in resistance to
the growth-inhibitory effect of gefitinib as determined by MTT
assay, and the resistant phenotype has been stable for at least 6
months under drug-free conditions. H520 cells were cultured in
RPMI-1640 medium (Thermo Fisher Scientific, Inc., Waltham, MA, USA)
and the remaining cell lines were cultured in Dulbecco's modified
Eagle's medium (Thermo Fisher Scientific, Inc.), each supplemented
with 10% fetal bovine serum (Gibco; Thermo Fisher Scientific, Inc.)
and penicillin/streptomycin (100 U/ml). All cells were passaged
within 3 months from their renewal from frozen or early-passage
stocks. A commonly used de-methylating agent,
5-aza-2′-deoxycytidine (AZA; Sigma-Aldrich; Merck KGaA, Darmstadt,
Germany) which inhibits DNA methyltransferase and Trichostatin A
(TSA; Sigma-Aldrich; Merck KGaA), an HDAC inhibitor (HDACi) were
used as cell culture supplements. All six cell lines (PC9, A549,
H1299, H292, H1975 and H520) were respectively seeded at a density
of 2×10⁵ cells/cm2 in 6- or 12-well plates
and treated with the following reagents prior to further
procedures. Group A cells were treated with 4 µm AZA or 0.01 µm
DMSO for 96 h, then 3 µm gefitinib or continued 0.01 µm DMSO
(Meilun, Dalian, Liaoning, China) for 72 h. Therefore, four
subgroups were produced: Negative control, which received DMSO
twice, gefitinib group, received only gefitinib treatment, AZA
group, which only received AZA and a combination group, received
AZA and subsequently geftinib treatment. Group B cells received
0.02 µm TSA or 0.01 µm DMSO treatment for 16 h, followed by 72 h of
3 µm gefitinib or continued 0.01 µm DMSO, generating four similar
subgroups as aforementioned.
Reverse transcription
quantitative-polymerase chain reaction (RT-qPCR.)
BIM RNA expression levels were quantified by
RT-qPCR. PC9, PC9/R, and PC9/G2 cell lines were randomly assigned
into groups A and B and treated as aforementioned. Total RNA was
extracted using an RNAiso Plus kit (Takara, Bio, Inc., Otsu, Japan)
according to the manufacturer's protocol. Reverse transcription was
performed with 1 µg total RNA using the RevertAid First Strand cDNA
Synthesis kit (Fermentas; Thermo Fisher Scientific, Inc.) according
to the manufacturer's protocol. Gene quantification was analyzed by
qPCR, run with 2 µl cDNA and SYBR Premix Ex Taq (Takara,
Bio, Inc.), on an Mx3000P qPCR system (Agilent Technologies, Santa
Clara, CA, USA). GAPDH was used as the reference gene. The
primer sequences were as follows: Bim forward,
5′-AGTGGGTATTTCTCTTTTGACACAG-3′ and reverse:
5′-TCAATGCCTTCTCCATACCAGACG-3′; GAP DH forward,
5′-TCGACAGTCAGCCGCATCTTCTTT-3′ and reverse,
5′-ACCAAATCCGTTGACTCCGACCTT-3′. The reaction conditions were as
follows: 94°C for 30 sec, followed by 40 cycles of 95°C for 5 sec,
62°C for 20 sec, with a final extension of 72°C for 10 min. Gene
quantification was performed by automatic calculation using
LightCycler software (version 1.5; Roche Applied Science, Penzberg,
Germany) and BIM expression in the PC9 cell line was
considered the base line, as this was the only cell line harboring
activated EGFR mutations.
Cell cytotoxicity assay
Cells were seeded at a density of 4,000 cells/well
in 96-well plates and treated as aforementioned prior to performing
the cytotoxicity assay. Cells in each well were incubated with 100
µl medium and 10 µl Cell Counting Kit-8 reagent (CCK-8; Dojindo
Molecular Technologies, Inc., Kumamoto, Japan) at 37°C for 1 h.
Following this, the absorbance was measured at 450 nm using a
microplate reader. Data were calculated as the percentage of the
total absorbance of treated cells/absorbance of non-treated cells
and were expressed as the mean ± standard error of the mean.
Methylation analysis
DNA was extracted from every cell line using DNeasy
Blood & Tissue kit or QIAamp DNA FFPE Tissue kit (Qiagen GmbH,
Hilden, Germany) according to the manufacturer's protocol. A total
of 500 ng extracted cell line or plasma DNA was converted and
purified using an EZ DNA Methylation-Gold kit (Zymo Research,
Corp., Irvine, CA, USA), according to the manufacturer's protocol.
The EpiTect PCR Control DNA set (Qiagen, Inc., Valencia, CA, USA)
was used for methylated and unmethylated controls. Bisulfite
converted DNA was analyzed by Methylation-Specific PCR (MSP),
nested quantitative methylation specific PCR (nested q-MSP), and
direct bisulfite pyrosequencing. For MSP, PCR amplification was
performed in a total volume of 25 µl with an ExTaq
Polymerase premix PCR kit (Takara, Bio, Inc.), according to the
manufacturer's protocol. Primer sequences for methylated and
unmethylated BIM promoters from the research of Eneriz et
al (12) were used. Reaction
conditions were as follows: 95°C for 10 min, followed by 30 cycles
of 94°C for 30 sec, 60°C for 30 sec, 72°C for 60 sec, and a final
extension of 72°C for 10 min. PCR products were then separated by
electrophoresis on 3% agarose gel with ethidium bromide dye.
Nested q-MSP
DNA samples were amplified twice as in the
aforementioned MSP protocol to amplify the signal and acquire the
second round Cq value. The EpiTect PCR Control DNA Set was used to
generate a standard curve to correct the different amplification
efficacy of methylated and unmethylated promoters. Bisulfite
converted DNA samples were subjected to the same protocol as
control DNA mix, and the methylation index (MI) was calculated with
the following formula: MI=M/(M+U)=1/[1+
(U/M)]=1/(1+2CtM-CtU).
Direct pyrosequencing
A total of 50 ng converted DNA was amplified using
the PyroMark PCR kit (Qiagen GmbH, Hilden, Germany) and the
reaction conditions were 95°C for 15 min, followed by 45 cycles of
94°C for 30 sec, 56°C for 30 sec, 72°C for 60 sec, and a final
extension of 72°C for 10 min. The primers used for pyrosequencing
were: Forward primer, 5′-ATAATGGGGTAGGAGTAGGGAA-3′ and reverse
primer, 5′-ATACTCTTTACCCAAAACAAACTT-3′. The specific PCR products
were subjected to quantitative pyrosequencing analysis using a
Biotage PyroMark Q96 system (Qiagen GmbH) according to the
manufacturer's protocol. The results were analyzed using Pyro Q-CpG
1.0.9 software (Qiagen GmbH).
Patient details and EGFR-TKI
treatment
This section of the present study was conducted
retrospectively. Eligible patients were recruited if the following
criteria were met: NSCLC histologically confirmed; received EGFR
mutation status analysis; received EGFR-TKI therapy and regular
follow up. A total of 32 patients were consecutively identified
from the Shanghai Pulmonary Hospital (Shanghai, China) database
according to the aforementioned criteria, from November 2011 to
September 2012. Patients gave written informed consent for the
scientific use of blood samples upon the first occasion of
hospitalization. A complete medical history interview, p hysical
examination, laboratory test and radiology examination were
performed for each case prior to starting treatment. All patients
received 250 mg gefitinib (Astrazeneca, Cambridge, UK) or 150 mg
erlotinib (Roche Applied Science, Penzberg, Germany) daily until
disease progression or the appropriate toxic effect was observed.
Tumor response was evaluated every 6 weeks according to the
Response Evaluation Criteria in Solid Tumors (RECIST) version 1.1
(20), and progression free survival
was the primary endpoint of the present study.
The present study was approved by the Ethics
Committee of Shanghai Pulmonary Hospital Affiliated to Tongji
University (Shanghai, China) and was performed in accordance with
the World Medical Association's Declaration of Helsinki. Written
informed consent was obtained from each patient prior to initiation
of any study-associated procedure.
Statistical analysis
All analyses were carried out using PASW 18.0 (SPSS
Statistics; IBM Corp., Armonk, NY, USA). Statistical analyses were
conducted using one-way analysis of variance to determine
statistical significance between RNA expression levels groups in
the in vitro studies and Bonferroni method was adopted as
post-hoc test. The Kaplan-Meier method was used to plot the PFS
curves and a log-rank test was used to compare the differences
between groups in clinical data. χ2 test was used to
determine the difference in the BIM methylation distribution
pattern in the baseline characteristics of patients. P<0.05 was
considered to indicate a statistically significant difference.
Results
BIM methylation status of NSCLC cell
lines
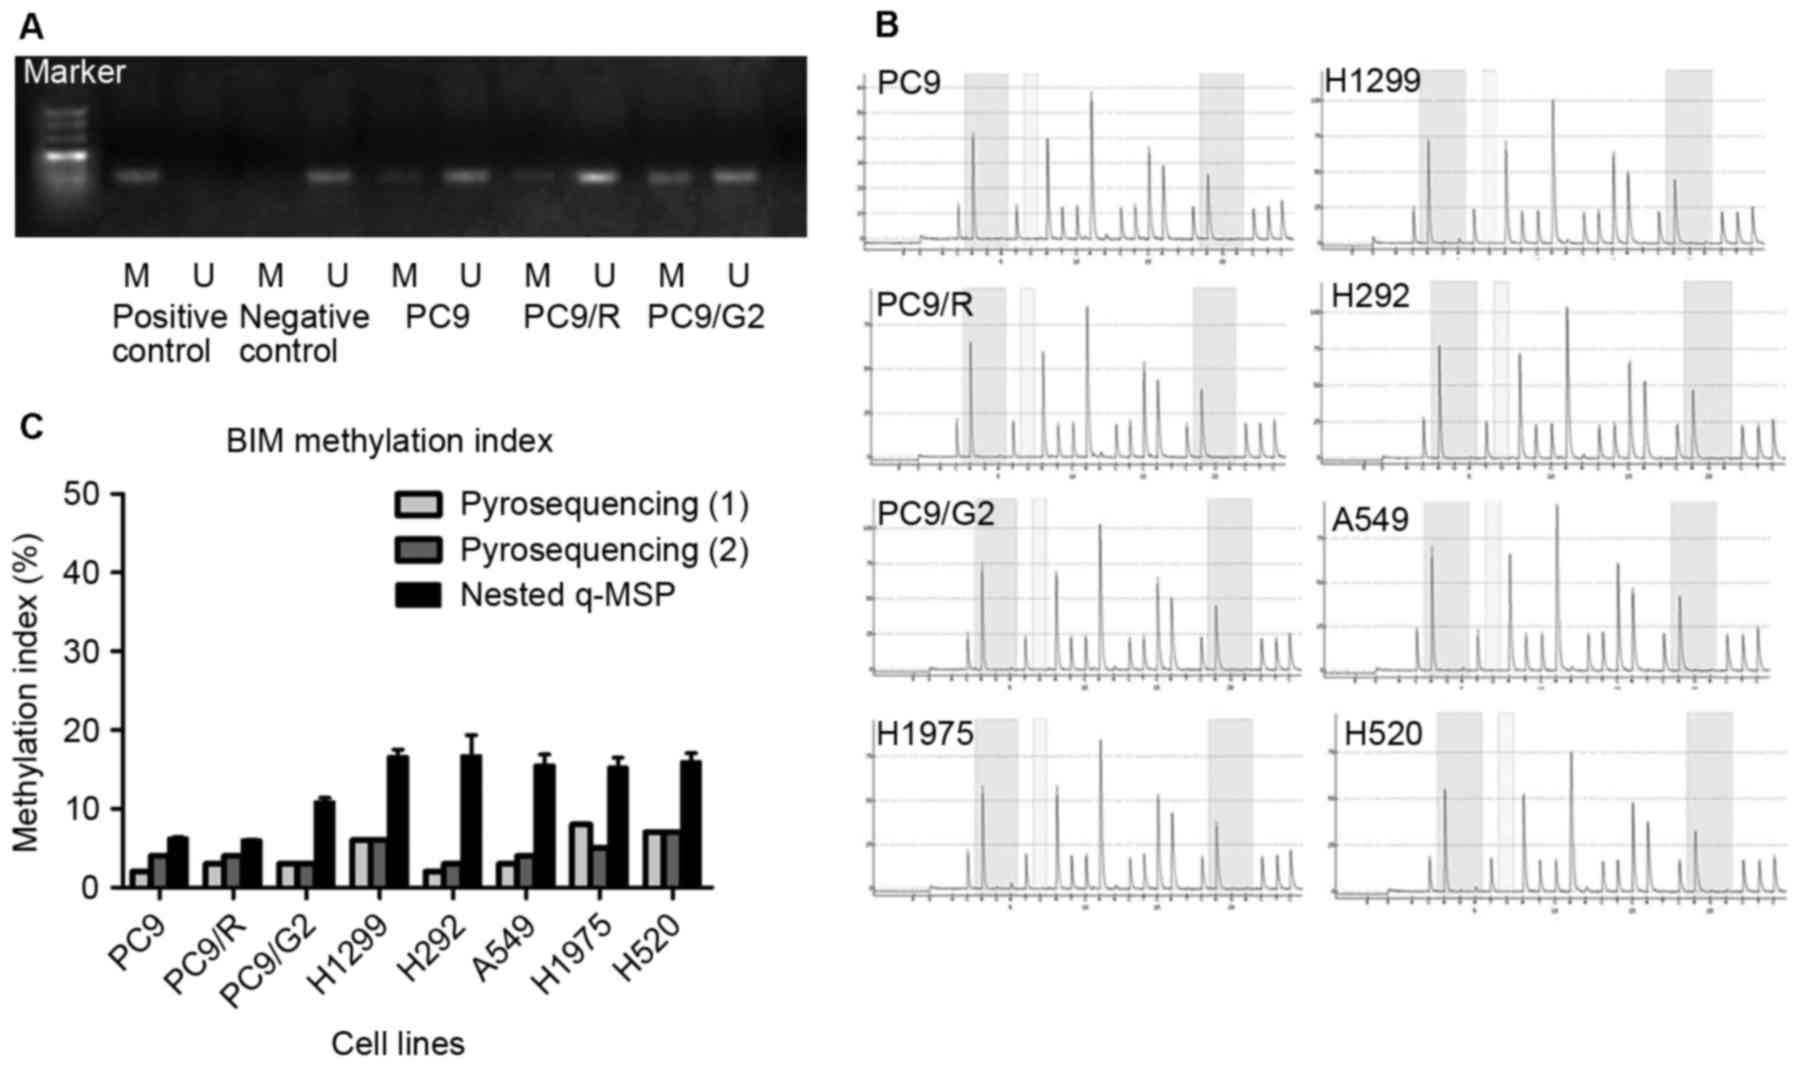
The methylation status of the BIM promoter of
PC9, PC9/R, and PC9/G2 cell lines using MSP was investigated
(Fig. 1). PC9, PC9/R, and PC9/G2 cell
lines all demonstrated hypo-methylation in BIM promoters.
Pyrosequencing and nested q-MSP were used to further confirm the
BIM promoter methylation status in the 8 cell lines. The CpG
islands analyzed were selected based on the results from a previous
study (12). The resulting
methylation index (MI) of pyrosequencing is listed in Table I. According to a previous study on
quantitative methylation analysis (12), DNA samples with MI≥50% were identified
as hyper-methylated; those with MI≥20% were identified as partially
methylated and MI<20% were considered hypo-methylated. Taken
together, the results from MSP, pyrosequencing and nested q-MSP
indicated that the hypo-methylated status of BIM existed in
all tested cell lines; including gefitinib sensitive PC9; gefitinib
induced drug-resistance cell lines PC9/R and PC9/G2; EGFR
TKI-primary resistance adenocarcinoma cell lines H292, A549, H1975;
large-cell carcinoma H1299 and squamous carcinoma H520 (Table I and Fig.
1C). The two quantitative testing methods resulted in different
methylation indexes. The divergence may reflect the difference
between global and regional methylation status of the BIM
promoter region.
 | Table I.MI of tested cell lines by
pyrosequencing and q-MSP. |
Table I.
MI of tested cell lines by
pyrosequencing and q-MSP.
|
| MI (by
pyrosequencing) |
|
|---|
|
|
|
|
|---|
| Cell lines | Position 1 (%) | Position 2 (%) | MI (by q-MSP)
(%) |
|---|
| PC9 | 2 | 4 | 6.22±0.16 |
| PC9/R | 3 | 4 | 5.99±0.06 |
| PC9/G2 | 3 | 3 | 10.85±0.56 |
| H1299 | 6 | 6 | 16.59±0.93 |
| H292 | 2 | 3 | 16.70±2.64 |
| A549 | 3 | 4 | 15.52±1.37 |
| H1975 | 8 | 5 | 15.21±1.25 |
| H520 | 7 | 7 | 15.94±1.14 |
BIM RNA expression level changes
following treatment with AZA or TSA
In response to gefitinib treatment, two gefitinib
resistant cell lines presented with reduced BIM mRNA levels
compared with PC9 cells. Following AZA treatment, three cell lines
demonstrated increased BIM transcript levels (Fig. 2A), although no significant differences
were observed. Conversely, cell lines receiving TSA treatment
demonstrated markedly elevated BIM mRNA levels compared with
cells with no prior TSA stimulation (P<0.01; Fig. 2B).
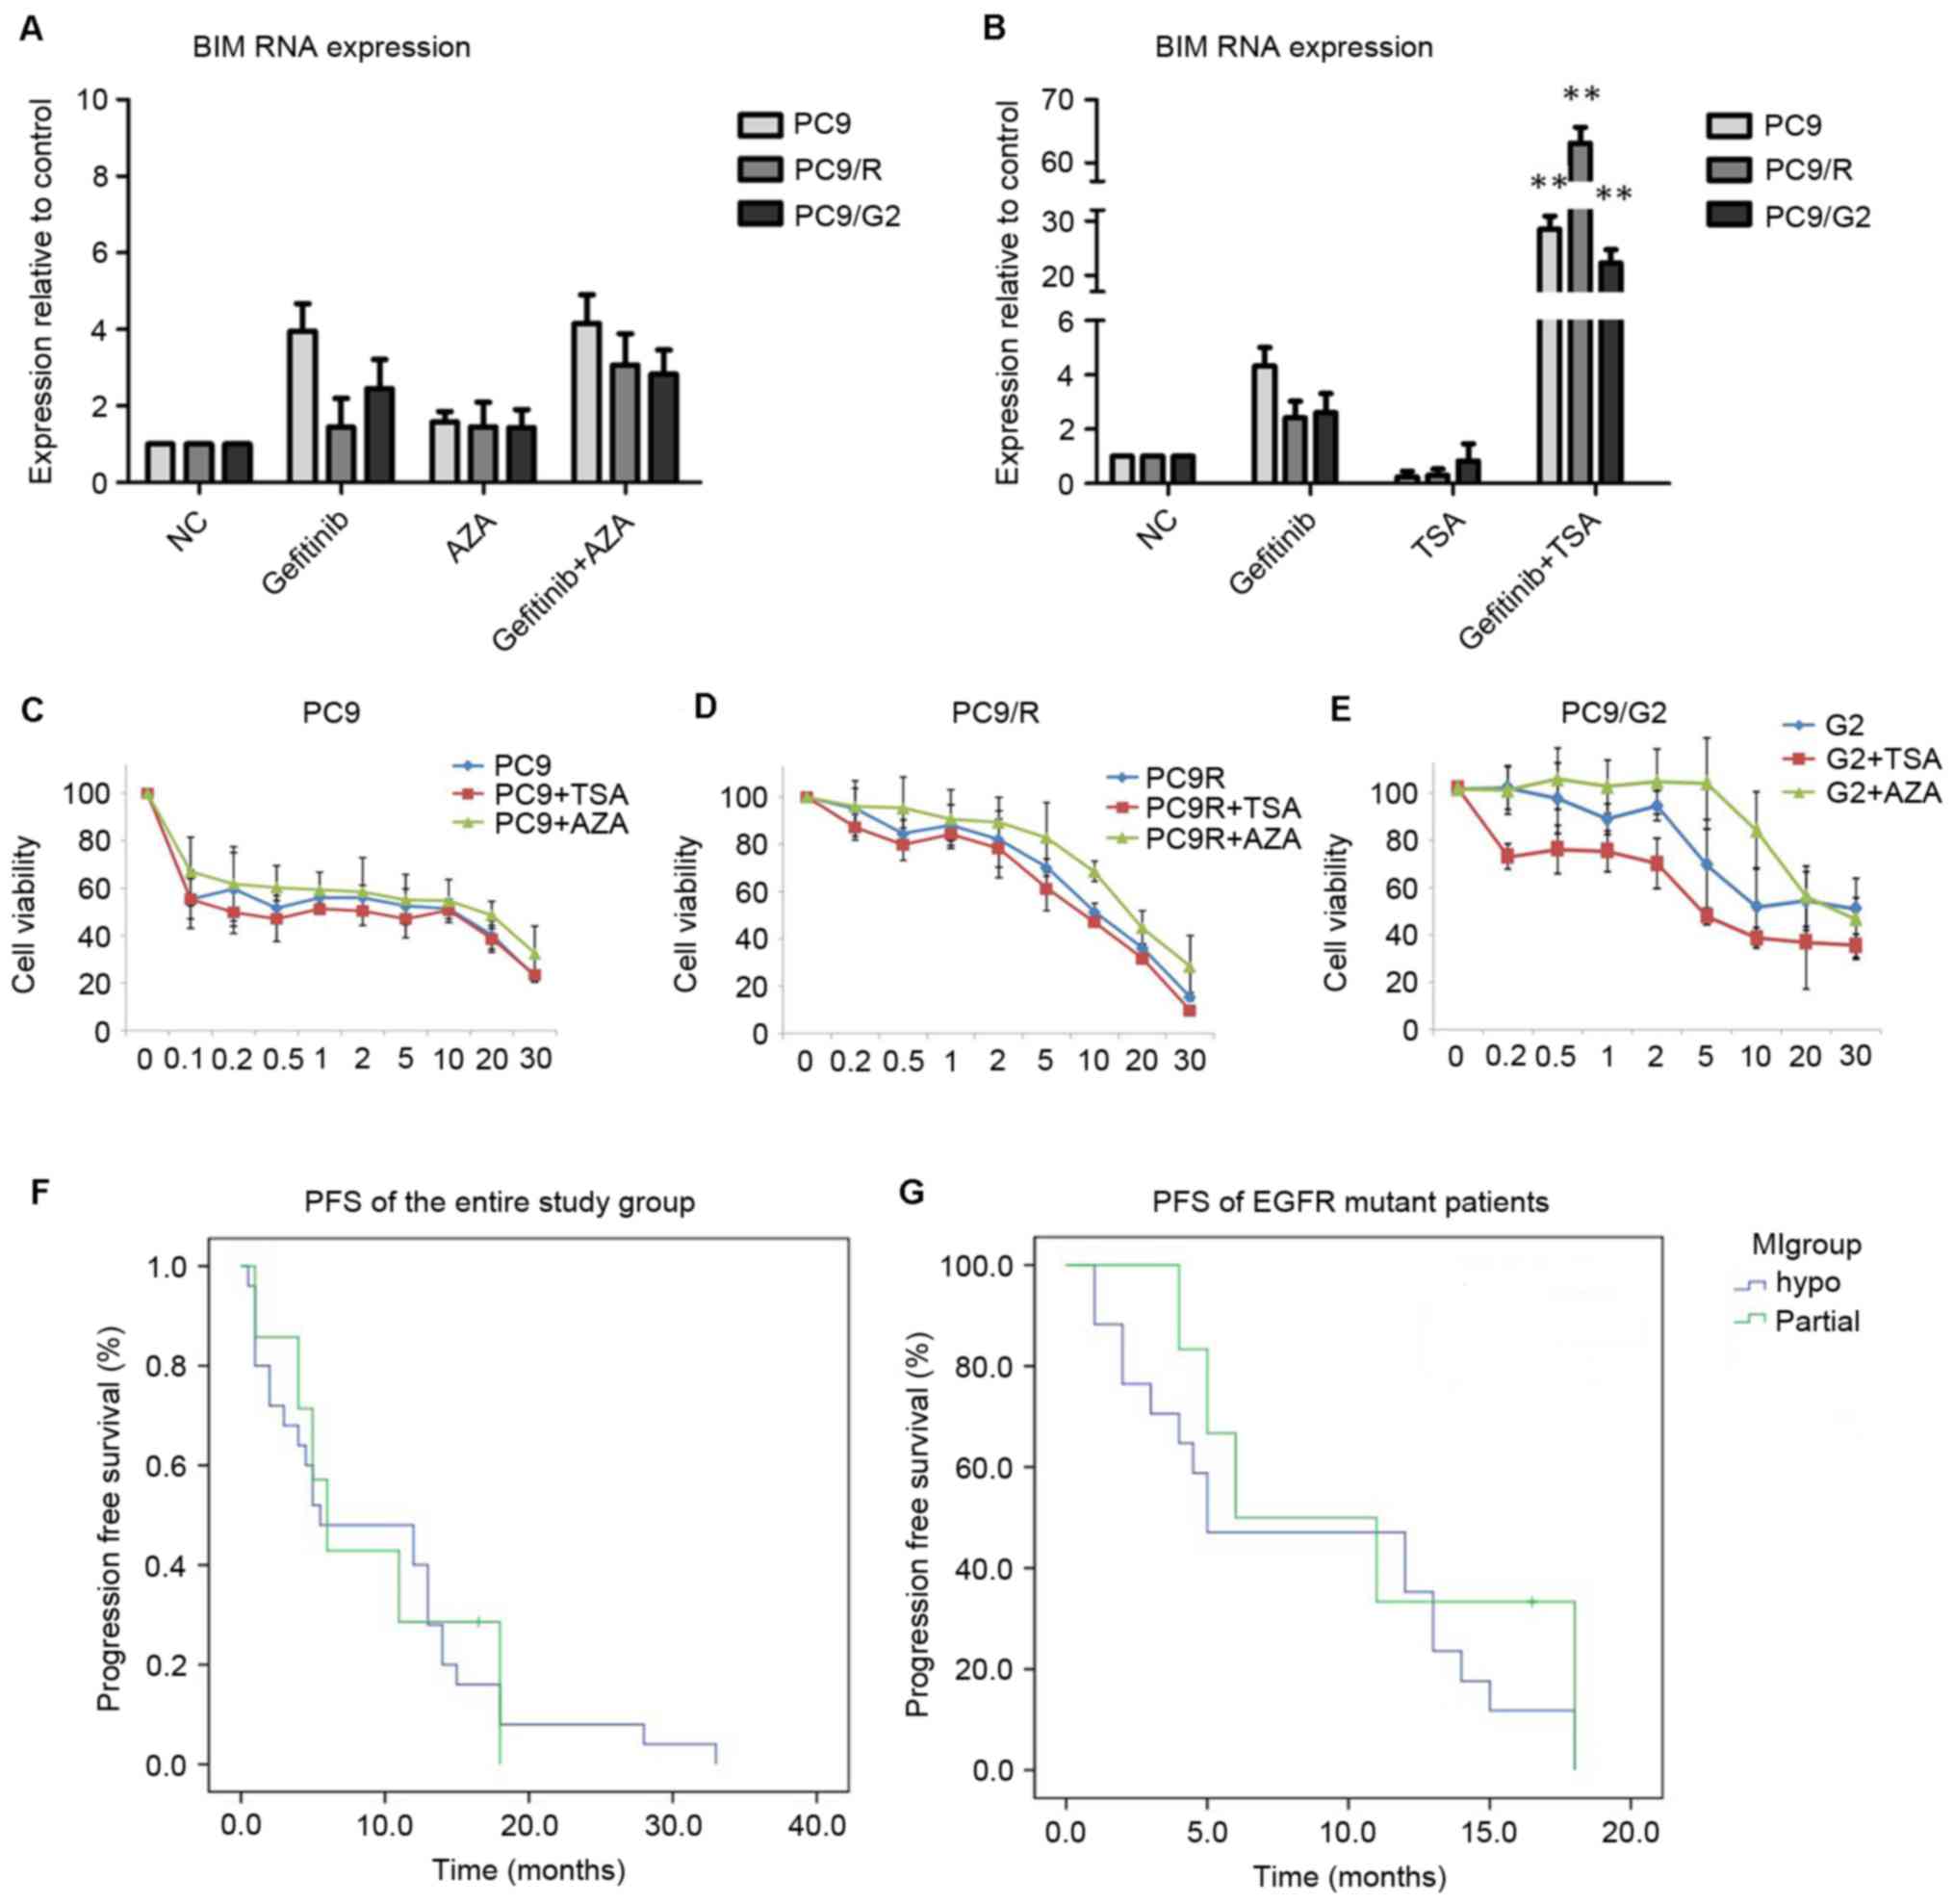 | Figure 2.In vitro assays. BIM
gene expression levels in PC-9 cell lines following (A) AZA or (B)
TSA treatments. Analysis of (C) PC9, (D) PC9/R and (E) PC9/G2 cell
viability, following pre-treatments with TSA or AZA prior to
gefitinib treatment. Cells pre-treated with TSA demonstrated lower
tolerance to gefitinib compared with those that received gefitinib
treatment alone. AZA pre-treatment, however, resulted in higher
cell line resistance. Progression free survival curves of (F) the
entire study group and (G) EGFR mutant groups. **P<0.01 vs.
cells treated with DMSO and gefitinib. BIM, bcl-2-like protein 11;
AZA, 5-Aza-2′-deoxycytidine; TSA, Trichostatin A; EGFR, epidermal
growth factor receptor; PFS, progression free survival; NC,
negative control. |
Cell cytotoxicity analysis
PC9, PC9/R and PC9/G2 cells were treated with the
same treatment regime as described in the previous section.
Following treatments, Cell Counting Kit-8 (CCK-8) was utilized to
test cell toxicity (Fig. 2C-E). In
all three cell lines, cells pre-treated with TSA presented with a
lower tolerance to gefitinib compared with cells that received
gefitinib treatment alone. The effects of AZA pre-treatment,
however, resulted in a higher resistance in all three tested cell
lines.
Distribution of BIM methylation
indexes in patients with NSCLC
The clinicopathological characteristics of the 32
patients with NSCLC recruited into the present study are listed in
Table II. Amongst the 32 patients,
the lowest methylated BIM index identified was 5.88, whilst the
highest was 106.58. Patients were divided into three groups
according to standards described in the ‘BIM methylation status of
NSCLC cell lines’ section, and the subsequent associated data are
listed in Table III. Patients with
low BIM MI comprised the majority of the study group (78.1%),
whilst those with medium and high MI accounted for 15.6 and 6.3% of
all patients, respectively. Data from the latter two groups were
merged into one group (methylated group, group M) in the following
analysis due to the small identified sample size, and patients with
low BIM were named the non-methylated group (group N) in the
subsequent analysis. The distribution between the M and N groups
revealed no significant difference when assessed using a
χ2 test assessing multiple clinicopathological
characteristics, including gender (P=0.96), smoking status
(P=0.98), performance status (P=0.96), histological type (P=0.80)
and EGFR mutant status (P=0.24).
| Table II.Clinical characteristics and MI
distribution of patients with NSCLC with a median age of 56 (range,
32–78). |
Table II.
Clinical characteristics and MI
distribution of patients with NSCLC with a median age of 56 (range,
32–78).
|
|
| MI |
|
|---|
|
|
|
|
|
|---|
| Clinicopathological
characteristics | Case (%) | M | N | P-value |
|---|
| Sex |
|
|
| 0.96 |
|
Male | 14 (43.8) | 3 | 11 |
|
|
Female | 18 (56.3) | 4 | 14 |
|
| Smoking status |
|
|
| 0.98 |
|
Smoker | 9 (28.1) | 5 | 18 |
|
|
Non-smoker | 23 (71.9) | 2 | 7 |
|
| PS |
|
|
| 0.96 |
| 1 | 18 (56.3) | 4 | 14 |
|
| 2 | 14 (43.8) | 3 | 11 |
|
| Histological cell
type |
|
|
| 0.80a |
|
Adenocarcinoma | 24 (75) | 5 | 19 |
|
|
Squamous cell | 3 (9.4) | 1 | 2 |
|
|
Adenosquamocarcinoma | 2 (6.3) | 0 | 2 |
|
|
Othersb | 3 (9.4) | 1 | 2 |
|
| EGFR status |
|
|
| 0.23c |
| Wild
type | 9 (28.1) | 3 | 6 |
|
|
19Del | 12 (37.5) | 6 | 6 |
|
|
L858R | 9 (28.1) | 6 | 3 |
|
|
Others | 2 (6.3) | 1 | 1 |
|
| Table III.BIM promoter methylation
status in patients with non small cell lung carcinoma. |
Table III.
BIM promoter methylation
status in patients with non small cell lung carcinoma.
| Variable |
Hypo-methylated |
Partially-methylated |
Hyper-methylated |
|---|
| Case (%) | 25 (78.1) | 5 (15.6) | 2 (6.3) |
| Mean MI (%) | 9.08 | 22.67 | 80.48 |
| (95% CI) | (7.32–10.84) | (19.69–25.66) |
(−251.23–412.18) |
| Minimum-maximum MI
(%) | 5.88–18.11 | 20.81–26.41 | 54.37–106.58 |
| Median MI (%) | 6.32 | 21.17 | 80.48 |
Analysis of BIM MI and EGFR TKI
efficacy
All 32 patients received EGFR TKI, either gefitinib
or erlotinib. By the cut-off point of the present study, none of
the patients had stopped taking the medication due to intolerable
toxicity prior to progression of the disease (PD). Of those
patients, 31 (96.9%) experienced PD, and 1 still had a stable
disease (SD). The median PFS (mPFS) for the entire group was 5.75
months, with the shortest 0.5 months and longest 38 months. The
EGFR TKI efficacy in the entire group and EGFR mutant subgroup with
different BIM MI is listed in Table
IV. In both the entire study population and EGFR mutant
patients, PFS did not significantly differ between the M and N
groups (Table IV, Fig. 2F-G).
| Table IV.Efficacy of EGFR-tyrosine kinase
inhibitor treatment in patients with non small cell lung
cancer. |
Table IV.
Efficacy of EGFR-tyrosine kinase
inhibitor treatment in patients with non small cell lung
cancer.
| Group | Median PFS (95%
CI) |
|
|---|
|
| Study
population | EGFR
mutants |
| N | 5.500
(0.000–12.844) | 5.000
(0.000–12.563) |
| M | 6.000
(3.434–8.566) | 6.000
(0.000–13.201) |
| Total | 5.500
(0.000–11.506) | 6.000
(0.000–12.104) |
Discussion
The aim of the present study was to investigate the
impact of BIM promoter methylation and histone deacetylation
on EGFR TKI resistance. In all NSCLC cell lines examined, and
samples from the majority of patients with NSCLC, BIM gene
promoter regions were hypo-methylated. The demethylating agent,
AZA, did not affect BIM mRNA expression in EGFR
TKI-resistant cell lines. HDACi, TSA significantly increased
BIM mRNA levels and reversed the TKI resistance of PC9/R and
PC9/G2 cell lines.
Epigenetic BIM silencing has been previously
reported to be associated with various malignancies (12,13).
Furthermore, abnormal methylation has been identified as a hallmark
of cancer (21,22). In previous years, the involvment of
epigenetic regulation in the acquisition of drug resistance has
been addressed due to development of cancer genome charts (23). In NSCLC, genes including multiple
tumor suppressor 1 (p16), adenomatous polyposis coli
(APC) and death associated protein kinase 1 were proven to
be hyper-methylated in the promoter region (24,25).
In the present study, BIM was observed to be
hypo-methylated in NSCLC, as evaluated by various methods,
indicating the difference between NSCLC and hematological
malignancies or renal carcinoma. Despite the heterogeneity in the
tumorigenesis and development of NSCLC, due to the discrepancies
observed, it was not possible to exclude epigenetic alteration of
cell lines following in vitro culture. However, further
exploratory research using circulating free DNA from patients with
NSCLC confirmed that the hypo-methylated status of BIM was
observed in the majority of patients (78.1%). The collective in
vitro and in vivo results suggested that BIM was
hypo-methylated in the majority of NSCLC cases and that promoter
methylation did not contribute to EGFR TKI resistance. Increased
resistance to gefitinib following the AZA-induced treatment in PC9,
PC9/R, and PC9/G2 cell lines revealed AZA's protection of cell
lines from gefitinib. Such protection suggested that anti-apoptotic
and/or cell cycle regulating genes may be switched on following AZA
treatment, thereby rescuing epigenetic silencing.
The two PC9 gefitinib-resistant cell lines presented
with impaired BIM mRNA expression, indicating that
epigenetic factors may still regulate BIM. Thus, histone
deacetylation, another epigenetic regulating mechanism associated
with methylation, was further investigated. TSA pre-treatment led
to a marked upregulation of BIM and gefitinib tolerance
reduction in PC9 gefitinib-resistant cell lines, indicating that
histone deacetylation, as opposed to methylation may be involved in
the epigenetic BIM silencing. Another HDACi, verinostat, has
been demonstrated to increase BIM expression in EGFR mutant
NSCLC cell lines, harboring either wild type or deletion
polymorphism BIM under TKI treatment (26). However, BIM methylation and histone
deacetylation status were not directly detected in the
aforementioned study. A previous study conducted on Burkitt
lymphoma revealed the co-existence of promoter methylation and
histone deacetylation of BIM in cell lines; and demonstrated
that verinostat was able to reverse chemotherapy resistance by
overcoming epigenetic silencing (13). However, in a clinical trial comparing
erlotinib, with or without HDACi entinostat in patients with
advanced stage NSCLC (27), the
combined regime did not prove to be beneficial, which may highlight
the importance of patient selection. Another previous study
analyzed the single and combined effects of AZA and TSA on a
multi-drug resistant cell line, and demonstrated that the
anti-resistant effect of each single drug is not additive but
interactive (28), offering a new
viewpoint for our follow-up study on the investigation of combined
AZA and TSA to treat NSCLC.
To the best of our knowledge, the present study is
the first to use a quantitative method to analyze methylation
status using circulating free DNA (cfDNA). Over previous decades,
researchers have identified the existence of cfDNA (29,30).
Tumor-specific changes including point mutation, DNA methylation,
and microsatellite instability revealed that these cfDNAs
originated from tumors (31,32). Since peripheral blood is considerably
easier to acquire compared with tissue samples, the use of cfDNA
may be beneficial to detect and/or monitor the methylation profile
of genes of interest. Multiple studies have been conducted which
detect methylation using cfDNA, including APC, RAS, and the Ras
association domain family 1A gene in ovarian cancer (33); tumor suppressor gene BLU, Cadherin 13,
fragile histidine triad and p16 in lung cancer (34). MSP, which provides qualitative
results, is a commonly used method in such studies, and the
incidence of methylated DNA detected in serum is commonly reduced
compared with that in tumor tissue. In the present study, the aim
was to combine nested PCR with quantitative MSP in order to acquire
precise methylation information, using cfDNA.
In the present study, the small proportion (6.3%) of
patients with hyper-methylated BIM indicated that patients
with NSCLC often present with hypo-methylated BIM. These
observations are consistent with the results presented from the
in vitro study cell lines. PFS analyses revealed that no
significant differences were observed between the M and N patient
groups in the entire study group (P=0.859) and EGFR mutant subgroup
(P=0.395); indicating that there was no existing association
between BIM methylation and EGFR TKI efficacy in patients
with NSCLC. There are several potential explanations for the
results presented here. As previously stated, BIM
methylation status may not influence EGFR TKI efficacy in patients
with NSCLC. In addition, the BIM methylation index detected
in cfDNA may not reflect the in vivo tumor tissue status,
since the phenomenon of methylated DNA detected in serum was
reduced compared with that in tumor tissue, which was also observed
in several previous studies (25,33,34).
Furthermore, although the present study was exploratory, the
population size was small and the test efficiency weak. Hence, a
paired study comparing methylation profiles in cfDNA and tissue
with increased case numbers may reflect the function of BIM
methylation in NSCLC target therapy more accurately.
In conclusion, the present study detected the
BIM methylation profile in NSCLC cell lines and patients
with NSCLC, and the cell lines and patients collectively presented
with hypo-methylated BIM. The histone deacetylation
inhibitor, TSA, but not the methylation inhibitor, AZA, reversed
the resistance to EGFR TKI in acquired resistance cell lines PC9/R
and PC9/G2. Thus, histone deacetylation as opposed to promoter
methylation, may contribute in the epigenetic silencing of
BIM and lead to EGFR-TKI resistance in NSCLC.
Acknowledgements
The authors would like to thank Amoy Diagnostics
Company, Ltd., for technical support. The abstract was presented at
Annual Meeting of The European Society for Medical Oncology,
September 27th 2014 in Madrid, Spain and published as abstract no.
1320P in Annals of Oncology 25 (supplement 4): 2014.
References
|
1
|
Jemal A, Bray F, Center MM, Ferlay J, Ward
E and Forman D: Global cancer statistics. CA Cancer J Clin.
61:69–90. 2011. View Article : Google Scholar : PubMed/NCBI
|
|
2
|
Ferlay J, Shin HR, Bray F, Forman D,
Mathers C and Parkin DM: Estimates of worldwide burden of cancer in
2008: GLOBOCAN 2008. Int J Cancer. 127:2893–2917. 2010. View Article : Google Scholar : PubMed/NCBI
|
|
3
|
Rosell R, Moran T, Queralt C, Porta R,
Cardenal F, Camps C, Majem M, Lopez-Vivanco G, Isla D, Provencio M,
et al: Screening for epidermal growth factor receptor mutations in
lung cancer. N Engl J Med. 361:958–967. 2009. View Article : Google Scholar : PubMed/NCBI
|
|
4
|
Giaccone G, Gallegos Ruiz M, Le Chevalier
T, Thatcher N, Smit E, Rodriguez JA, Janne P, Oulid-Aissa D and
Soria JC: Erlotinib for frontline treatment of advanced non-small
cell lung cancer: A phase II study. Clin Cancer Res. 12:6049–6055.
2006. View Article : Google Scholar : PubMed/NCBI
|
|
5
|
Zhou C, Wu YL, Chen G, Feng J, Liu XQ,
Wang C, Zhang S, Wang J, Zhou S, Ren S, et al: Erlotinib versus
chemotherapy as first-line treatment for patients with advanced
EGFR mutation-positive non-small-cell lung cancer (OPTIMAL,
CTONG-0802): A multicentre, open-label, randomised, phase 3 study.
Lancet Oncol. 12:735–742. 2011. View Article : Google Scholar : PubMed/NCBI
|
|
6
|
Kobayashi S, Boggon TJ, Dayaram T, Jänne
PA, Kocher O, Meyerson M, Johnson BE, Eck MJ, Tenen DG and Halmos
B: EGFR mutation and resistance of non-small-cell lung cancer to
gefitinib. N Engl J Med. 352:786–792. 2005. View Article : Google Scholar : PubMed/NCBI
|
|
7
|
Nakazawa Y, Saha S, Galvan DL, Huye L,
Rollins L, Rooney CM and Wilson MH: Evaluation of long-term
transgene expression in piggyBac-modified human T lymphocytes. J
Immunother. 36:3–10. 2013. View Article : Google Scholar : PubMed/NCBI
|
|
8
|
Riely GJ, Kris MG, Zhao B, Akhurst T,
Milton DT, Moore E, Tyson L, Pao W, Rizvi NA, Schwartz LH and
Miller VA: Prospective assessment of discontinuation and
reinitiation of erlotinib or gefitinib in patients with acquired
resistance to erlotinib or gefitinib followed by the addition of
everolimus. Clin Cancer Res. 13:5150–5155. 2007. View Article : Google Scholar : PubMed/NCBI
|
|
9
|
Ng KP, Hillmer AM, Chuah CT, Juan WC, Ko
TK, Teo AS, Ariyaratne PN, Takahashi N, Sawada K, Fei Y, et al: A
common BIM deletion polymorphism mediates intrinsic resistance and
inferior responses to tyrosine kinase inhibitors in cancer. Nat
Med. 18:521–528. 2012. View
Article : Google Scholar : PubMed/NCBI
|
|
10
|
Zhao M, Zhang Y, Cai W, Li J, Zhou F,
Cheng N, Ren R, Zhao C, Li X, Ren S, et al: The Bim deletion
polymorphism clinical profile and its relation with tyrosine kinase
inhibitor resistance in Chinese patients with non-small cell lung
cancer. Cancer. 120:2299–2307. 2014. View Article : Google Scholar : PubMed/NCBI
|
|
11
|
O'Connor L, Strasser A, O'Reilly LA,
Hausmann G, Adams JM, Cory S and Huang DC: Bim: A novel member of
the Bcl-2 family that promotes apoptosis. EMBO J. 17:384–395. 1998.
View Article : Google Scholar : PubMed/NCBI
|
|
12
|
San José-Eneriz E, Agirre X,
Jiménez-Velasco A, Cordeu L, Martín V, Arqueros V, Gárate L,
Fresquet V, Cervantes F, Martínez-Climent JA, et al: Epigenetic
down-regulation of BIM expression is associated with reduced
optimal responses to imatinib treatment in chronic myeloid
leukaemia. Eur J Cancer. 45:1877–1889. 2009. View Article : Google Scholar : PubMed/NCBI
|
|
13
|
Richter-Larrea JA, Robles EF, Fresquet V,
Beltran E, Rullan AJ, Agirre X, Calasanz MJ, Panizo C, Richter JA,
Hernandez JM, et al: Reversion of epigenetically mediated BIM
silencing overcomes chemoresistance in Burkitt lymphoma. Blood.
116:2531–2542. 2010. View Article : Google Scholar : PubMed/NCBI
|
|
14
|
Piazza R, Magistroni V, Mogavero A,
Andreoni F, Ambrogio C, Chiarle R, Mologni L, Bachmann PS, Lock RB,
Collini P, et al: Epigenetic silencing of the proapoptotic gene BIM
in anaplastic large cell lymphoma through an MeCP2/SIN3a
deacetylating complex. Neoplasia. 15:511–522. 2013. View Article : Google Scholar : PubMed/NCBI
|
|
15
|
Zantl N, Weirich G, Zall H, Seiffert BM,
Fischer SF, Kirschnek S, Hartmann C, Fritsch RM, Gillissen B,
Daniel PT and Häcker G: Frequent loss of expression of the
pro-apoptotic protein Bim in renal cell carcinoma: Evidence for
contribution to apoptosis resistance. Oncogene. 26:7038–7048. 2007.
View Article : Google Scholar : PubMed/NCBI
|
|
16
|
Singal R and Ginder GD: DNA methylation.
Blood. 93:4059–4070. 1999.PubMed/NCBI
|
|
17
|
Fuks F, Burgers WA, Brehm A, Hughes-Davies
L and Kouzarides T: DNA methyltransferase Dnmt1 associates with
histone deacetylase activity. Nat Genet. 24:88–91. 2000. View Article : Google Scholar : PubMed/NCBI
|
|
18
|
Ju L, Zhou C, Li W and Yan L: Integrin
beta1 over-expression associates with resistance to tyrosine kinase
inhibitor gefitinib in non-small cell lung cancer. J Cell Biochem.
111:1565–1574. 2010. View Article : Google Scholar : PubMed/NCBI
|
|
19
|
Li B, Ren S, Li X, Wang Y, Garfield D,
Zhou S, Chen X, Su C, Chen M, Kuang P, et al: MiR-21 overexpression
is associated with acquired resistance of EGFR-TKI in non-small
cell lung cancer. Lung Cancer. 83:146–153. 2014. View Article : Google Scholar : PubMed/NCBI
|
|
20
|
Eisenhauer EA, Therasse P, Bogaerts J,
Schwartz LH, Sargent D, Ford R, Dancey J, Arbuck S, Gwyther S,
Mooney M, et al: New response evaluation criteria in solid tumours:
Revised RECIST guideline (version 1.1). Eur J Cancer. 45:228–247.
2009. View Article : Google Scholar : PubMed/NCBI
|
|
21
|
Toyooka S, Toyooka KO, Maruyama R, Virmani
AK, Girard L, Miyajima K, Harada K, Ariyoshi Y, Takahashi T, Sugio
K, et al: DNA methylation profiles of lung tumors. Mol Cancer Ther.
1:61–67. 2001.PubMed/NCBI
|
|
22
|
Zöchbauer-Müller S, Fong KM, Virmani AK,
Geradts J, Gazdar AF and Minna JD: Aberrant promoter methylation of
multiple genes in non-small cell lung cancers. Cancer Res.
61:249–255. 2001.PubMed/NCBI
|
|
23
|
Wilting RH and Dannenberg JH: Epigenetic
mechanisms in tumorigenesis, tumor cell heterogeneity and drug
resistance. Drug Resist Updat. 15:21–38. 2012. View Article : Google Scholar : PubMed/NCBI
|
|
24
|
Yang Y, Takeuchi S, Hofmann WK, Ikezoe T,
van Dongen JJ, Szczepański T, Bartram CR, Yoshino N, Taguchi H and
Koeffler HP: Aberrant methylation in promoter-associated CpG
islands of multiple genes in acute lymphoblastic leukemia. Leuk
Res. 30:98–102. 2006. View Article : Google Scholar : PubMed/NCBI
|
|
25
|
Fujiwara K, Fujimoto N, Tabata M, Nishii
K, Matsuo K, Hotta K, Kozuki T, Aoe M, Kiura K, Ueoka H and
Tanimoto M: Identification of epigenetic aberrant promoter
methylation in serum DNA is useful for early detection of lung
cancer. Clin Cancer Res. 11:1219–1257. 2005.PubMed/NCBI
|
|
26
|
Nakagawa T, Takeuchi S, Yamada T, Ebi H,
Sano T, Nanjo S, Ishikawa D, Sato M, Hasegawa Y, Sekido Y and Yano
S: EGFR-TKI resistance due to BIM polymorphism can be circumvented
in combination with HDAC inhibition. Cancer Res. 73:2428–2434.
2013. View Article : Google Scholar : PubMed/NCBI
|
|
27
|
Witta SE, Jotte RM, Konduri K, Neubauer
MA, Spira AI, Ruxer RL, Varella-Garcia M, Bunn PA Jr and Hirsch FR:
Randomized phase II trial of erlotinib with and without entinostat
in patients with advanced non-small-cell lung cancer who progressed
on prior chemotherapy. J Clin Oncol. 30:2248–2255. 2012. View Article : Google Scholar : PubMed/NCBI
|
|
28
|
Capobianco E, Mora A, La Sala D, Roberti
A, Zaki N, Badidi E, Taranta M and Cinti C: Separate and combined
effects of DNMT and HDAC inhibitors in treating human multi-drug
resistant osteosarcoma HosDXR150 cell line. PLoS One. 9:e955962014.
View Article : Google Scholar : PubMed/NCBI
|
|
29
|
Leon SA, Shapiro B, Sklaroff DM and Yaros
MJ: Free DNA in the serum of cancer patients and the effect of
therapy. Cancer Res. 37:646–650. 1977.PubMed/NCBI
|
|
30
|
Stroun M, Anker P, Maurice P, Lyautey J,
Lederrey C and Beljanski M: Neoplastic characteristics of the DNA
found in the plasma of cancer patients. Oncology. 46:318–322. 1989.
View Article : Google Scholar : PubMed/NCBI
|
|
31
|
Nawroz H, Koch W, Anker P, Stroun M and
Sidransky D: Microsatellite alterations in serum DNA of head and
neck cancer patients. Nat Med. 2:1035–1037. 1996. View Article : Google Scholar : PubMed/NCBI
|
|
32
|
Mulcahy HE, Lyautey J, Lederrey C, qi Chen
X, Anker P, Alstead EM, Ballinger A, Farthing MJ and Stroun M: A
prospective study of K-ras mutations in the plasma of pancreatic
cancer patients. Clin Cancer Res. 4:271–275. 1998.PubMed/NCBI
|
|
33
|
Ibanez de Caceres I, Battagli C, Esteller
M, Herman JG, Dulaimi E, Edelson MI, Bergman C, Ehya H, Eisenberg
BL and Cairns P: Tumor Cell-Specific BRCA1 and RASSF1A
Hypermethylation in Serum, Plasma, and Peritoneal Fluid from
Ovarian Cancer Patients. Cancer Res. 64:6476–6481. 2004. View Article : Google Scholar : PubMed/NCBI
|
|
34
|
Hsu HS, Chen TP, Hung CH, Wen CK, Lin RK,
Lee HC and Wang YC: Characterization of a multiple epigenetic
marker panel for lung cancer detection and risk assessment in
plasma. Cancer. 110:2019–2026. 2007. View Article : Google Scholar : PubMed/NCBI
|