Introduction
Renal cell carcinoma (RCC) is the most common form
of kidney cancer to affect adult populations in Western countries
in 2013 (1). There are three common
forms of RCC: Clear cell renal cell carcinoma (ccRCC), papillary
renal cell carcinoma (of which there are types 1 and 2) and
chromophobe renal cell carcinomas (1,2). According
to the World Health Organization (2004), ccRCC accounts for 70–85%
of all cases of kidney cancer (1,2). Surgical
resection of the primary tumor is often performed in patients with
ccRCC; however, it is only effective for patients diagnosed at an
earlier stage of ccRCC (3). ccRCC
develops and progresses asymptomatically at the early stage of the
disease, which results in a low rate of early detection (4). Furthermore, the benefit of a
chemotherapeutic approach is limited owing to drug resistance
(3). Therefore, the development of
novel approaches for early diagnostic biomarkers and improvement of
treatment for patients with late stage ccRCC is critical. A
promising strategy for the development of anticancer agents is
targeting cancer metabolism (5).
Metabolic changes serve a key function in the
progression of ccRCC (6–9). For example, Linehan et al
(6) considered kidney cancer a
metabolic disease rather than a single disease. Shayman et
al (7) and others reported that
targeting glycosphingolipid metabolism, hormone signaling pathways
or vitamin D metabolism may be novel therapeutic approaches for
treating RCC (8,9). However, to the best of our knowledge, no
previous study has identified the alteration of
metabolism-associated genes in ccRCC. A total of 1,603 available
metabolism-associated genes involving 99 metabolic pathways from
Recon2 model were extracted in the present study. Recon2 is the
most comprehensive representation of human metabolism to date
(10). The present study investigated
changes from the view of metabolism-associated gene expression
between control samples and those at different stages of ccRCC.
These results will offer information to aid further research into
early diagnostic biomarkers and therapeutic targets.
Materials and methods
Data collection
RNA-sequencing gene expression data for cohorts of
72 healthy controls and 532 patients with ccRCC (including clinical
data) were extracted from The Cancer Genome Atlas (TCGA; https://cancergenome.nih.gov/) in April 2016 (11). The ccRCC group included 267 stage I,
57 stage II, 124 stage III and 84 stage IV patients based on the
tumor-node-metastasis classification system (12). Table I
shows the clinical characteristics of patients by stage. As
presented in Table I, as ccRCC
progressed, the survival rate of patients decreased. In addition,
it is noteworthy that the number of male patients with ccRCC was
increased compared with that of female patients.
 | Table I.Clinical characteristics of patients
by disease stage. |
Table I.
Clinical characteristics of patients
by disease stage.
|
|
|
| Sex |
| Ethnicity |
|---|
|
|
|
|
|
|
|
|---|
| Stages | Patients, n | Age,
yearsa | Male | Female | Survival time,
monthsb | Asian | African
descent | Caucasian | No record |
|---|
| Stage I | 267 | 59.6 (25–90) | 162 | 105 | 45.0 | 4 | 40 | 221 | 2 |
| Stage II | 57 | 59.7 (39–86) | 43 | 14 | 49.0 | 1 | 5 | 49 | 2 |
| Stage III | 124 | 63.4 (32–88) | 81 | 43 | 42.1 | 3 | 6 | 112 | 3 |
| Stage IV | 84 | 59.9 (33–84) | 59 | 25 | 34.1 | 0 | 5 | 79 | 0 |
| Total | 532 | 60.6 (26–90) | 345 | 187 | 44.3 | 8 | 56 | 461 | 7 |
Overall metabolic gene expression
profile
Each sample included 20,501 genes in the data from
TCGA. A total of 1,638 metabolic genes were extracted from the
Recon2 model. There are 1,603 common genes between the Recon2 model
and data from TCGA. A comparison of the expression of these 1,603
metabolic genes expression between control and ccRCC cases with a
heat map (generated using the ‘pheatmap’ function in R) (13). All gene expression values were scaled
prior to plotting. Clustering was unsupervised.
Analysis of differential
metabolism-associated gene expression
Genes with a fold change >2 and a false discovery
rate (FDR) <0.05 were considered to be differentially expressed
genes. This study was performed using the limma package (14) in R (version 3.2.3). Four comparisons
were executed: Control vs. stage I disease samples, control vs.
stage II, control vs. stage III and control vs. stage IV. The
number of differentially expressed metabolism-associated genes
between control and ccRCC samples of multiple stages were
represented using a Venn diagram. A total of 4 heat maps were
produced to visualize the differentially expressed
metabolism-associated genes in each comparison. Gene expression
values were scaled prior to plotting. Clustering was
unsupervised.
Enrichment analysis of metabolic
pathways
In total, there are 99 metabolic pathways in Recon2
model and each pathway includes specific metabolic genes. The
present study used the following method of hypergenometric
distribution for enrichment analysis of metabolic pathways:
P(X=k)=CMkCN–Mn–kCNn
Where N is the total number of metabolic genes, n is
the total number of differential metabolic genes, M is the number
of genes of a specific pathway, k is the number of differential
metabolic genes of a specific pathway.
Results
Metabolism-associated gene expression
profiles are separated between control and case
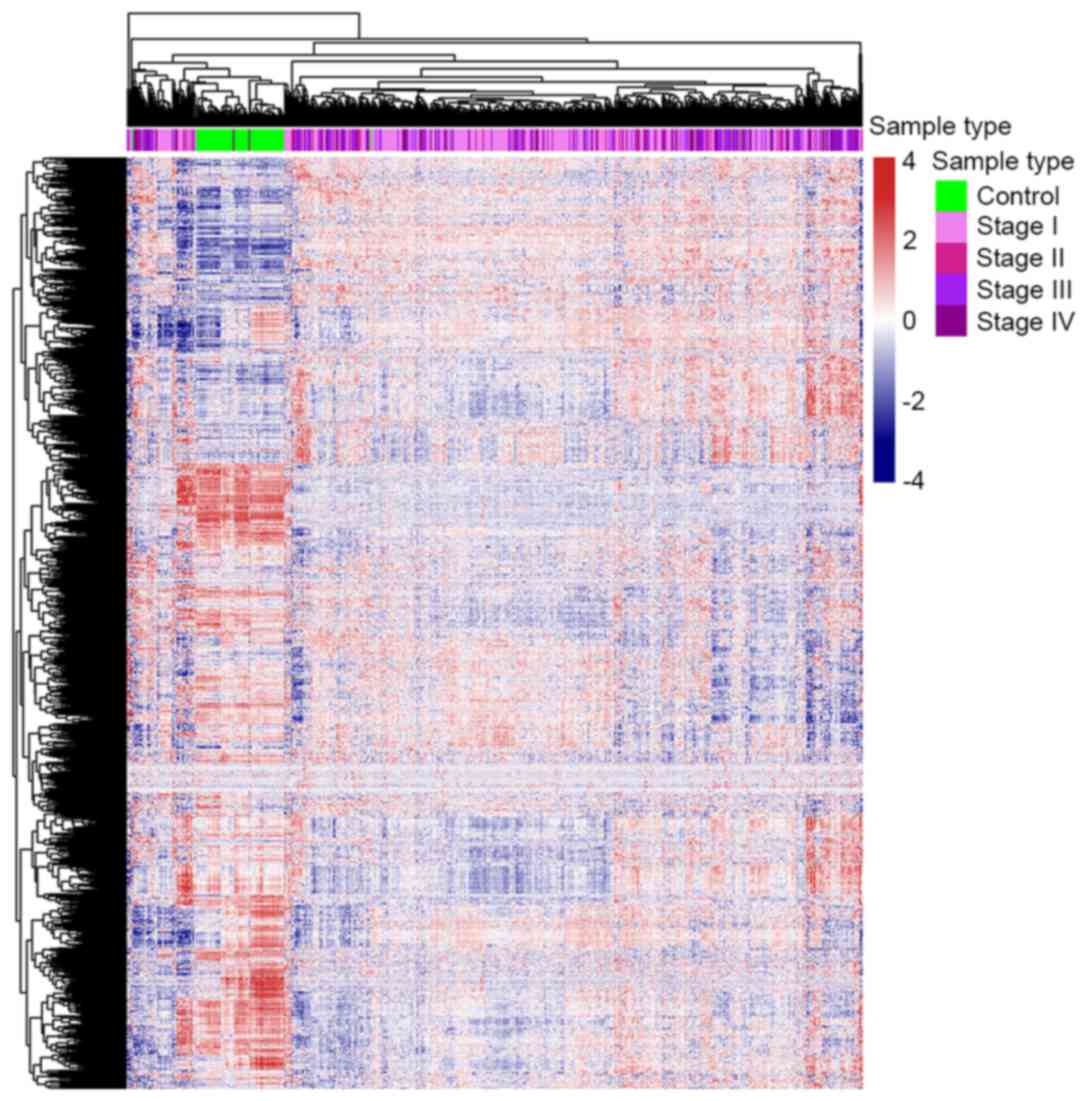
The gene expression profile of metabolism-associated
genes was different between ccRCC and control samples (Fig. 1). Approximately 1/3 of the metabolic
genes were upregulated and 2/3 were downregulated in ccRCC cases
compared with the control samples. These results revealed that
almost all metabolic genes were overexpressed or underexpressed in
patients with ccRCC, which supports the results of numerous
previous studies (6–9), which found that metabolic changes are
significantly associated with ccRCC. This result also indicates
that further research concerning the function that
metabolism-associated genes serve in ccRCC is warranted.
Differential metabolism-associated
gene expression
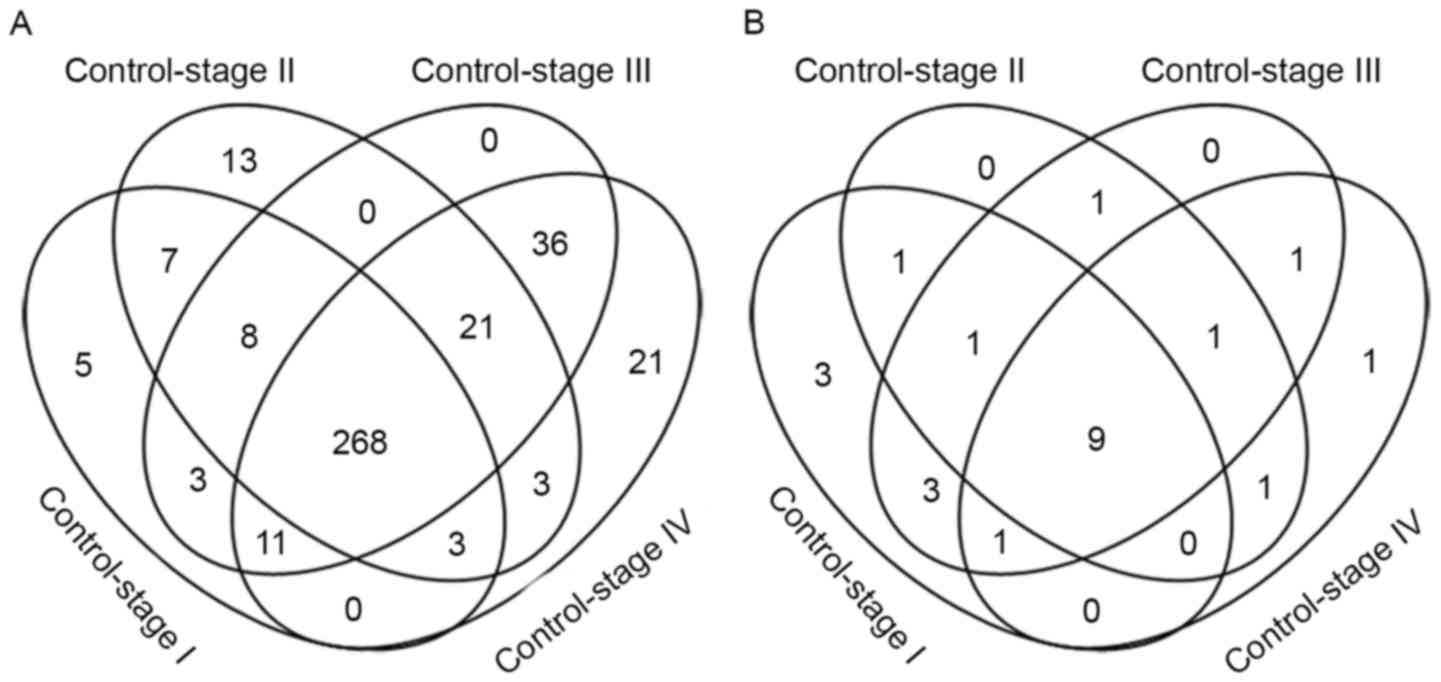
Metabolic genes were differentially expressed (FDR
<0.05; fold change >2) in each comparison: 305 metabolic
genes were differentially expressed between control and stage I
samples, 323 metabolic genes differed between control and stage II
samples, 355 metabolic genes differed between control and stage III
samples and 363 metabolic genes differed between control and stage
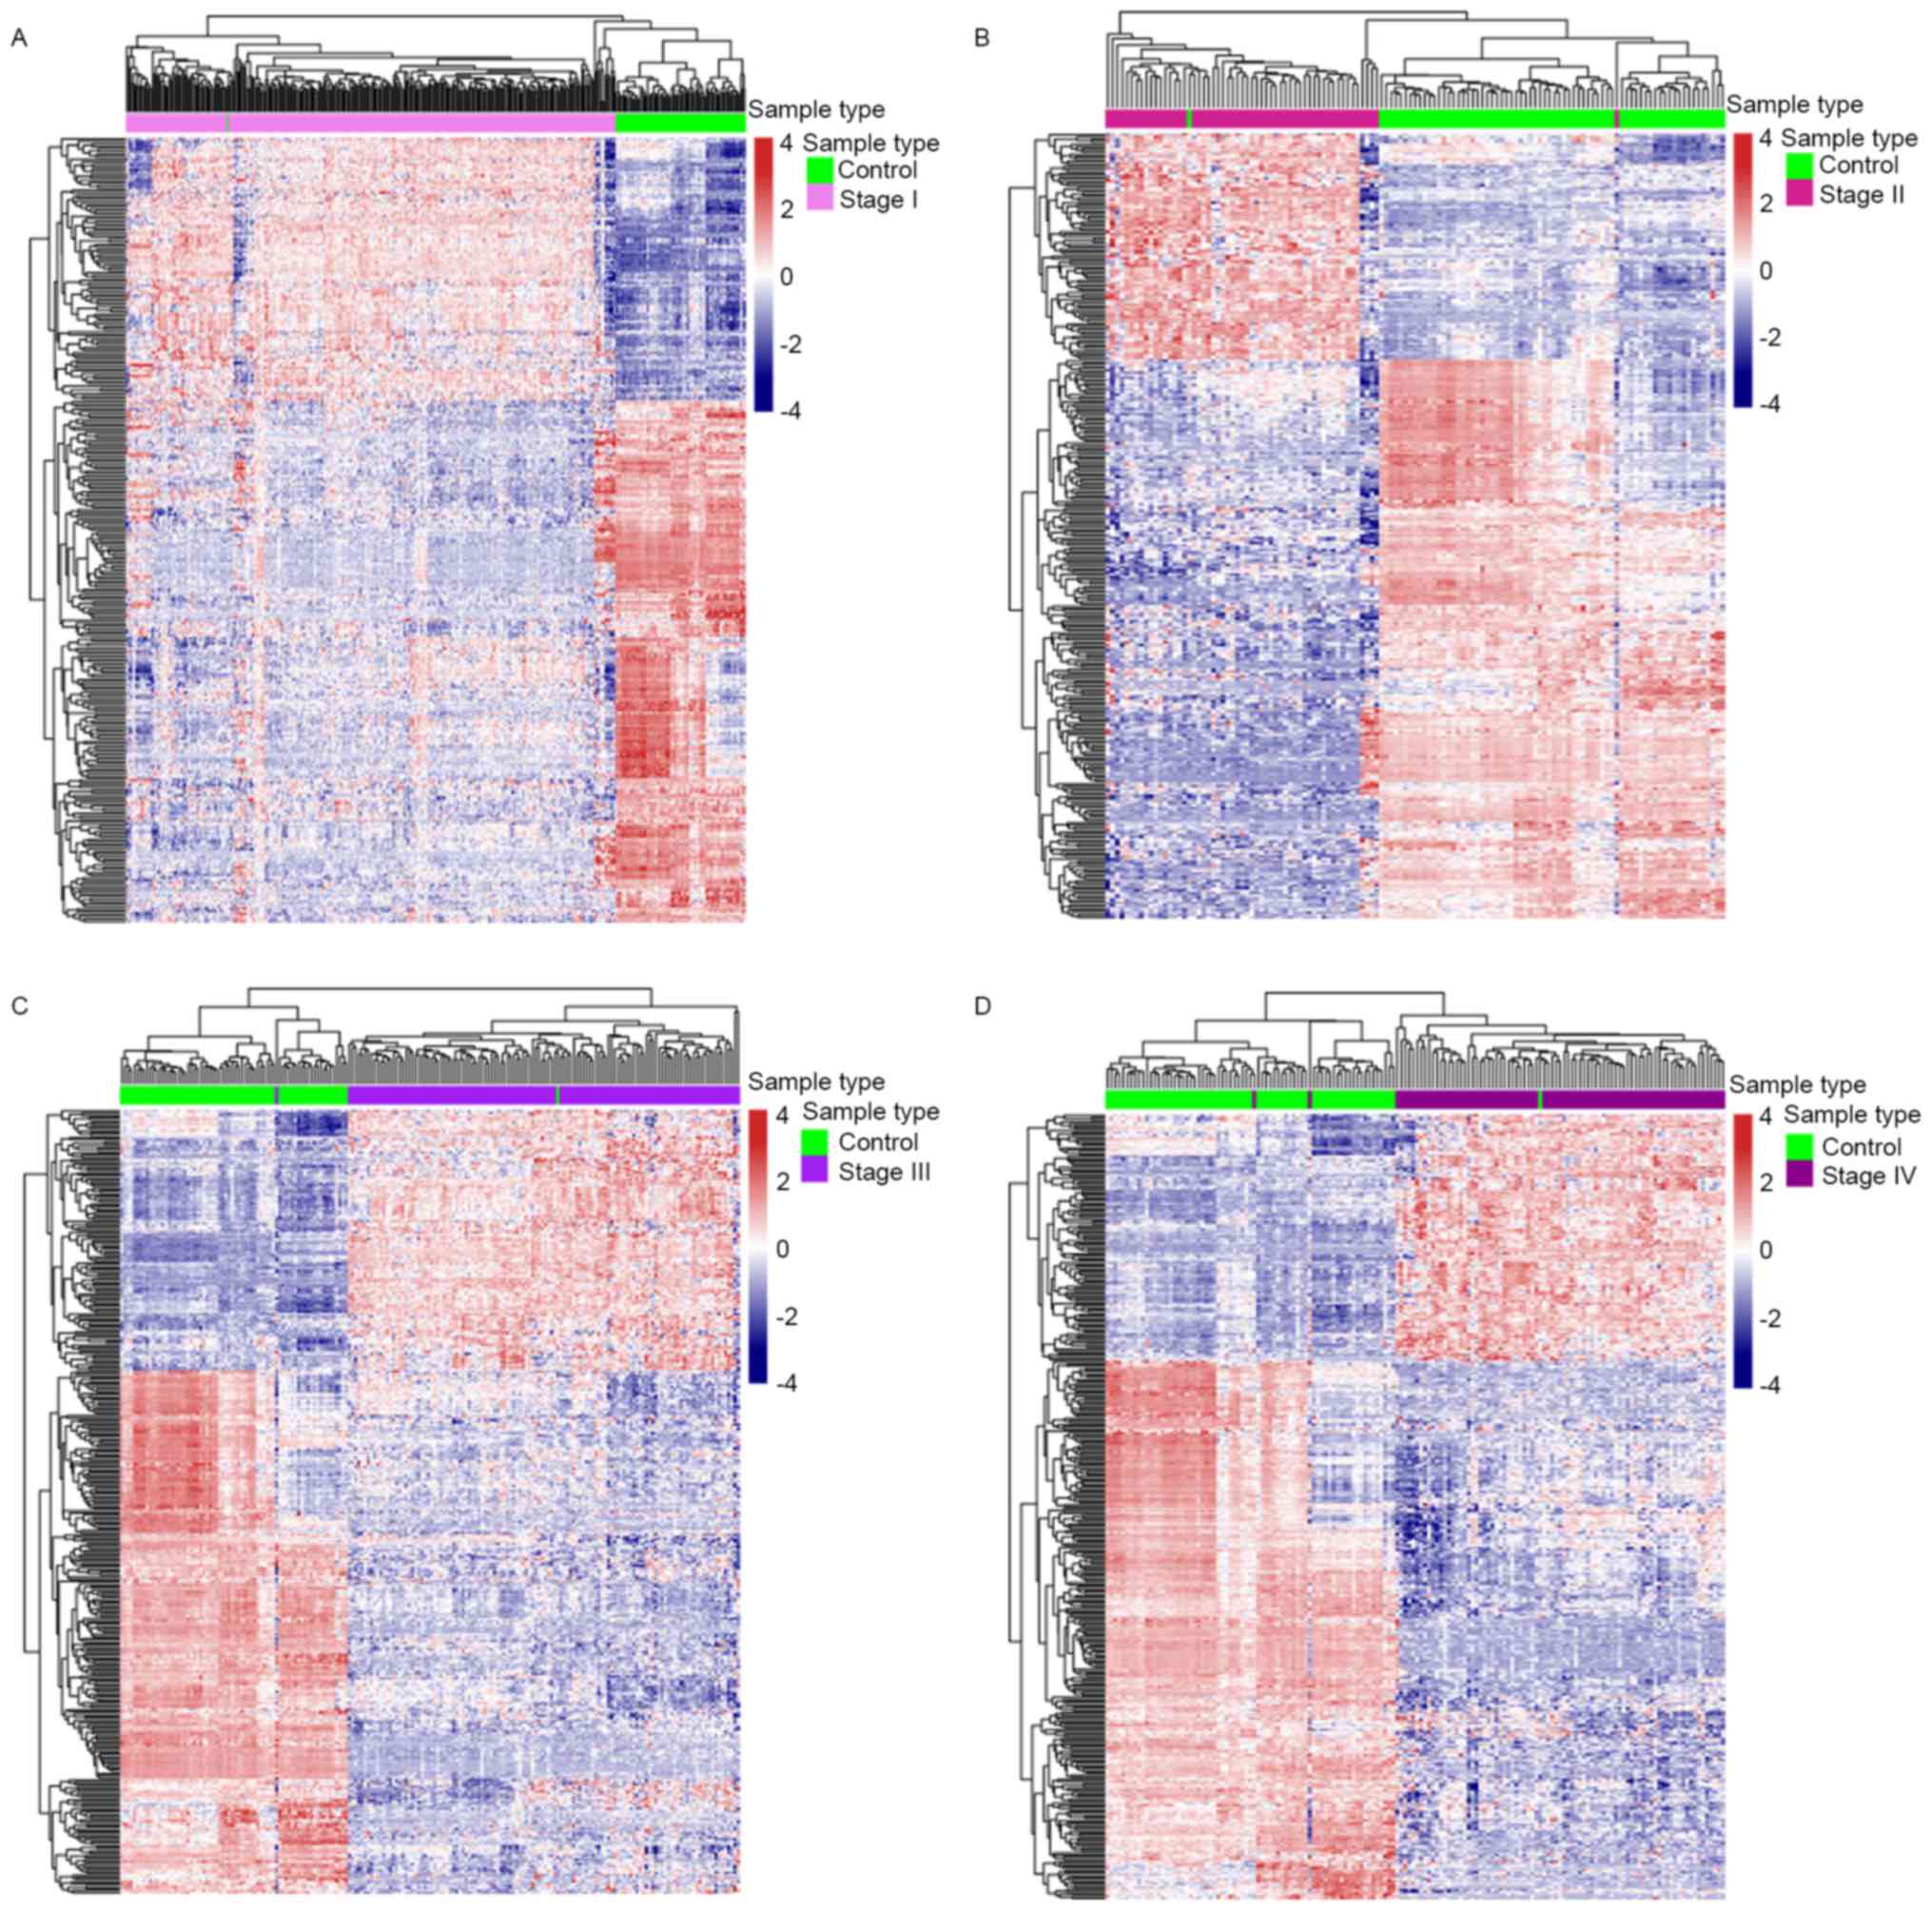
IV disease (Fig. 2A). Heat maps of
the differentially expressed metabolic genes in each comparison
were provided (Fig. 3). There were a
total of 407 differential metabolism-associated genes in the 4
comparisons. With more advanced disease stage, there were more
differentially expressed metabolic genes between ccRCC and control
samples.
There were 12 differentially expressed metabolic
genes that only appeared at the initial stage of the disease, stage
I or stage II, including: β-1,3-N-acetylglucosaminyltransferase 8
(B3GNT8), hydroxysteroid 11-β dehydrogenase 1 (HSD11B1), hyaluronan
synthase 2 (HAS2), adenylate cyclase 8 (ADCY8), ADCY2,
phosphodiesterase 6G (PDE6G), ectonucleotide
pyrophosphatase/phosphodiesterase 1 (ENPP1), 3-hydroxyacyl-CoA
dehydratase 1 (PTPLA), solute carrier family 5 member 1 (SLC5A1),
SLC18A2, SLC10A2, SLC22A1. Seven of these genes (B3GNT8, HSD11B1,
HAS2, ADCY2, ADCY8, PDE6G, ENPP1) have been reported to be
associated with cancer. Multiple studies have revealed that
increased expression of B3GNT8 and HSD11B1 is associated with
different types of cancer, including glioma and laryngeal carcinoma
(15–18). Lien et al (19) reported that HAS2 serves a function in
producing aggressive phenotypes in primary breast carcinoma. Single
nucleotide polymorphisms in ADCY2 and ADCY8 are associated with
glioma risk (20). The differential
expression of PDE6 G and ENPP1 occurs in breast cancer (19,21).
However, the association between the other 5 genes (PTPLA, SLC5A1,
SLC18A2, SLC10A2, SLC22A1) and ccRCC has not yet been reported.
According to the present study, the solute carrier family genes
(SLC5A1, SLC18A2, SLC10A2, SLC22A1) exhibited an increased
expression in patients with early ccRCC. The present study
demonstrates that abnormalities in the expression of these genes
disappear in the late stage of ccRCC.
There were 268 differentially expressed metabolic
genes shared by each disease stage. Cytochrome P450 family genes
are worthy of substantial attention since 19 of them were
differentially expressed in every ccRCC disease stage, including
cytochrome P450 family 2 subfamily B member 6 (CYP2B6), CYP4F2,
CYP17A1, CYP2J2, CYP24A1, CYP27B1, CYP4F3, CYP1A1, CYP3A5, CYP39A1,
CYP1B1, CYP11A1, CYP26B1, CYP21A2, CYP1A2, CYP2C18, CYP4A22,
CYP4B1, CYP3A4. The expression of CYP2J2, CYP3A5 and CYP21A2 was
downregulated in ccRCC samples; the remaining 16 genes were
significantly upregulated, particularly CYP2B6, CYP17A1, CYP4F2,
CYP1A1 and CYP39A1, the expression of which was >4 times that in
the control. This gene family encodes the proteins that localize to
the endoplasmic reticulum and catalyze multiple reactions
associated with drug metabolism. The US Food and Drug Association
has approved drugs that target 4 of these genes: CYP51A1, CYP19A1,
CYP17A1 and CYP11B1 (22).
A total of 89 metabolic genes were expressed
differentially at the late stages of the disease (stages III and
IV), of which 21 only appeared in stage IV disease, including
SLC5A8, pyrroline-5-carboxylate reductase 1 (PYCR1), acyl-CoA
synthetase short chain family member 3 (ACSS3), SLC22A2, ATPase
Na+/K+ transporting subunit β1 (ATP1B1),
B3GNTL1, ST6 N-acetylgalactosaminide α-2,6-sialyltransferase 3
(ST6GALNAC3), ADCY1, procollagen-lysine, 2-oxoglutarate
5-dioxygenase 3 (PLOD3), SLC27A2, PDE7B, thymidine kinase 1 (TK1),
aldo-keto reductase family 1 member C1 (AKR1C1), superoxide
dismutase 2 (SOD2), glucosylceramidase β3 (gBA3), ADCY10, PLOD1,
methylmalonyl-CoA mutase (MUT), asparaginase like 1 (ASRGL1),
dimethylglycine dehydrogenase (DMGDH) and SLC6A12. A total of 14 of
these genes (PYCR1, ATP1B1, PLOD3, PDE7B, TK1, AKR1C1, SOD2, GBA3,
PLOD1, MUT, ASRGL1, DMGDH, ADCY1, ADCY10) have been reported to be
associated with cancer (23–30). According to the Recon2 model (10), the majority of these genes participate
in nucleic acid and amino acid metabolism: ADCY1, PDE7B, TK1 and
ADCY10 participate in nucleic acid metabolism; PYCR1 participates
in arginine and proline metabolism; ACSS3 participates in
tryptophan metabolism; PLOD3 participates in lysine metabolism; MUT
participates in valine, leucine, and isoleucine metabolism; ASRGL1
participates in alanine and aspartate metabolism; and DMGDH
participates in glycine, serine, alanine and threonine
metabolism.
Enrichment of metabolic pathways
A total of 22 metabolic pathways were enriched by 4
groups of differential metabolic genes (FDR <0.05; Fig. 2B and Table
II). Associations between the majority of these pathways and
ccRCC have been previously reported (7–9,31–36);
however, few of these studies investigated alterations to these
metabolic pathways in different stages of the disease. These
changes are presented in Table
II.
| Table II.Metabolic pathways containing
differentially expressed genes enriched in the 4 stages of clear
cell renal cell carcinoma compared with control samples. |
Table II.
Metabolic pathways containing
differentially expressed genes enriched in the 4 stages of clear
cell renal cell carcinoma compared with control samples.
| Pathway | Control vs. stage
I | Control vs. stage
II | Control vs. stage
III | Control vs. stage
IV |
|---|
| Androgen and
estrogen synthesis and metabolism | X |
|
|
|
| Propanoate
metabolism | X |
|
|
|
| Cytochrome
metabolism | X |
|
|
|
| Chondroitin
synthesis | X | X |
|
|
| Arachidonic acid
metabolism | X |
| X |
|
| Eicosanoid
metabolism | X |
| X |
|
| Vitamin A
metabolism | X |
| X |
|
| Exchange/demand
reaction | X | X | X |
|
| Blood group
synthesis | X |
| X | X |
| D-alanine
metabolism | X | X | X | X |
| Transport,
extracellular | X | X | X | X |
| Glyoxylate and
dicarboxylate metabolism | X | X | X | X |
| Xenobiotics
metabolism | X | X | X | X |
| Vitamin E
metabolism | X | X | X | X |
| Vitamin D
metabolism | X | X | X | X |
| Pyruvate
metabolism | X | X | X | X |
| Glycosphingolipid
metabolism | X | X | X | X |
| Phenylalanine
metabolism |
| X | X |
|
| Glycine, serine,
alanine and threonine metabolism |
| X |
| X |
|
Glycolysis/gluconeogenesis |
| X | X | X |
| Reactive oxygen
species detoxification |
|
| X | X |
| Valine, leucine and
isoleucine metabolism |
|
|
| X |
The xenobiotic metabolic pathway contains 23
cytochrome P450 family genes, of which 9 were expressed abnormally
in each ccRCC disease stage: CYP2B6, CYP2J2, CYP1A1, CYP3A5,
CYP3A4, CYP4B1, CYP2C18, CYP1A2 and CYP1B1. As aforementioned, the
majority of enzymes that are encoded by these genes are known to
metabolize xenobiotics, including the anticancer drugs
cyclophosphamide and ifosphamide. Drug resistance induced by
dysregulated xenobiotic metabolic pathways may be a major cause of
chemotherapy resistance for patients with ccRCC (34,35).
From Table II,
pathways that appear disordered in the early ccRCC disease stages
are mainly associated with hormone, vitamin, glucose and lipid
metabolism. Disorders of reactive oxygen species (ROS)
detoxification and amino acid metabolism begin at the late stages
of ccRCC. The valine, leucine and isoleucine metabolic pathway
contains 35 genes (10) and the
number of differentially expressed genes in this pathway increases
significantly in the late stages of disease: Seven differentially
expressed genes were observed in stage I disease, 6 in stage II, 10
in stage III and 13 in stage IV.
Discussion
Previously, studies of metabolic genes and pathways
have attracted great interest in cancer research, to aid
understanding of the molecular mechanisms in the process of
carcinogenesis (37–39). Monteiro et al (40) revealed the important function that a
metabolomic approach could serve in the study of biomarkers in RCC.
Kim et al (41) identified
potential biomarkers and pathogenic pathways in kidney cancer with
urine metabolomic analysis. Shim et al (42) reported that L-2-hydroxyglutarate
functions as an epigenetic modifier and putative oncometabolite in
renal cancer. Armitage et al (43) analyzed the current trends and future
perspectives of metabolomics in cancer biomarker identification.
However, owing to the technical challenges in identifying
metabolites, the advances in metabolomics have not been as great as
those in genomics or transcriptomics (44). The present study used
metabolism-associated gene expression to analyze metabolic changes
at different disease stages. Although the heterogeneity between the
expression of these genes should not be ignored (45), changes to the expression of these
genes may not be consistent with changes in metabolite levels for a
specific pathway. Previous studies revealed a positive association
between mRNA expression and protein levels (46,47) and
the metabolic pathway must disorder when a certain proportion of
metabolic genes are differentially expressed within a specific
pathway. Metabolism-associated gene expression was anomalous in
patients with ccRCC.
To solve the issues surrounding early diagnosis and
treatment for patients with ccRCC, an analysis of differentiation
between control and case with each stage of the disease is
necessary. Alterations to metabolic pathways differ at different
stages of ccRCC. Abnormalities in hormone, vitamin, glucose and
lipid metabolism start with the early stage of the disease and ROS
detoxification and amino acid metabolism are aggravating with
disease duration, particularly valine, leucine and isoleucine
metabolism, which is badly damaged in stage IV. Shayman (7) revealed that eliglustat or associated
analogues that inhibit glucosylceramide synthase reversed the
disease phenotype and may be a potential treatment strategy for
kidney disease. Recently, Czarnecka et al (8) summarized the function that hormonal
signaling serves in RCC and hypothesized that inhibitors of this
pathway could be used as therapeutics against this cancer. The
association between circulating vitamin D and kidney cancer risk
has been reported by multiple research teams (9,32).
Trachootham et al (36)
demonstrated that the increased generation of ROS could be
exploited for therapeutic benefits to decrease drug resistance,
based on the biochemical properties of cancer cells.
Whether the altered signal molecules or metabolites
in stage I or II ccRCC may be biomarkers, permitting the early
diagnosis of ccRCC, depends on future research. Drug resistance is
a major barrier for treating advanced disease, rendering the
xenobiotic metabolism pathway, associated with multiple cytochrome
P450 family genes, worthy of substantial attention. Previous
studies have revealed that abnormalities in CYP1B1, CYP1A1, CYP3A4
or CYP3A5 expression are associated with ccRCC, particularly drug
resistance (34,48–54). The
present study demonstrated that the overall disorder of the
cytochrome P450 family genes may be the primary cause of marked
drug resistance in patients with ccRCC. In addition to CYP1B1,
CYP1A1, CYP3A4 and CYP3A5, the importance of other genes in this
family requires further study. These genes may serve as therapeutic
targets of ccRCC. Further studies on early diagnostic markers may
focus on the metabolites in hormone, vitamin, glucose and lipid
metabolic pathways.
Acknowledgements
The present study was supported by the National
Basic Research Program of China (grant no. 2013CB835100) and the
National Natural Science Foundation of China (grant nos. 31401142
and 31401137).
References
|
1
|
Bhatt JR and Finelli A: Landmarks in the
diagnosis and treatment of renal cell carcinoma. Nat Rev Urol.
11:517–525. 2014. View Article : Google Scholar : PubMed/NCBI
|
|
2
|
Shuch B, Amin A, Armstrong AJ, Eble JN,
Ficarra V, Lopez-Beltran A, Martignoni G, Rini BI and Kutikov A:
Understanding pathologic variants of renal cell carcinoma:
Distilling therapeutic opportunities from biologic complexity. Eur
Urol. 67:85–97. 2015. View Article : Google Scholar : PubMed/NCBI
|
|
3
|
Escudier B, Porta C, Schmidinger M, Algaba
F, Patard JJ, Khoo V, Eisen T and Horwich A; ESMO Guidelines
Working Group, : Renal cell carcinoma: ESMO clinical practice
guidelines for diagnosis, treatment and follow-up. Ann Oncol. 25
Suppl 3:iii49–iii56. 2014. View Article : Google Scholar : PubMed/NCBI
|
|
4
|
Abe H and Kamai T: Recent advances in the
treatment of metastatic renal cell carcinoma. Int J Urol.
20:944–955. 2013.PubMed/NCBI
|
|
5
|
Rahman M and Hasan MR: Cancer metabolism
and drug resistance. Metabolites. 5:571–600. 2015. View Article : Google Scholar : PubMed/NCBI
|
|
6
|
Linehan WM, Srinivasan R and Schmidt LS:
The genetic basis of kidney cancer: A metabolic disease. Nat Rev
Urol. 7:277–285. 2010. View Article : Google Scholar : PubMed/NCBI
|
|
7
|
Shayman JA: Targeting glycosphingolipid
metabolism to treat kidney disease. Nephron. 134:37–42. 2016.
View Article : Google Scholar : PubMed/NCBI
|
|
8
|
Czarnecka AM, Niedzwiedzka M, Porta C and
Szczylik C: Hormone signaling pathways as treatment targets in
renal cell cancer (Review). Int J Oncol. 48:2221–2235. 2016.
View Article : Google Scholar : PubMed/NCBI
|
|
9
|
Mondul AM, Weinstein SJ, Moy KA, Männistö
S and Albanes D: Vitamin D-binding protein, circulating vitamin D
and risk of renal cell carcinoma. Int J Cancer. 134:2699–2706.
2014. View Article : Google Scholar : PubMed/NCBI
|
|
10
|
Thiele I, Swainston N, Fleming RM, Hoppe
A, Sahoo S, Aurich MK, Haraldsdottir H, Mo ML, Rolfsson O, Stobbe
MD, et al: A community-driven global reconstruction of human
metabolism. Nat Biotechnol. 31:419–425. 2013. View Article : Google Scholar : PubMed/NCBI
|
|
11
|
Cancer genome atlas research, .
Comprehensive molecular characterization of clear cell renal cell
carcinoma. Nature. 499:43–49. 2013. View Article : Google Scholar : PubMed/NCBI
|
|
12
|
Wittekind C: 2010 TNM system: On the 7th
edition of TNM classification of malignant tumors. Pathologe.
31:331–332. 2010.(In German). View Article : Google Scholar : PubMed/NCBI
|
|
13
|
Kolde R: Pheatmap: Pretty Heatmaps. R
package version 1.0.8. 2015, https://CRAN.R-project.org/package=pheatmap
|
|
14
|
Ritchie ME, Phipson B, Wu D, Hu Y, Law CW,
Shi W and Smyth GK: limma powers differential expressionanalyses
for RNA-sequencing and microarray studies. Nucleic Acids Res.
43:e472015. View Article : Google Scholar : PubMed/NCBI
|
|
15
|
Jiang Z, Hu S, Hua D, Ni J, Xu L, Ge Y,
Zhou Y, Cheng Z and Wu S: β3GnT8 plays an important role in CD147
signal transduction as an upstream modulator of MMP production in
tumor cells. Oncol Rep. 32:1156–1162. 2014. View Article : Google Scholar : PubMed/NCBI
|
|
16
|
Shen L, Yu M, Xu X, Gao L, Ni J, Luo Z and
Wu S: Knockdown of β3GnT8 reverses 5-fluorouracil resistance in
human colorectal cancer cells via inhibition the biosynthesis of
polylactosamine-type N-glycans. Int J Oncol. 45:2560–2568. 2014.
View Article : Google Scholar : PubMed/NCBI
|
|
17
|
Liu J, Shen L, Yang L, Hu S, Xu L and Wu
S: High expression of β3GnT8 is associated with the metastatic
potential of human glioma. Int J Mol Med. 33:1459–1468. 2014.
View Article : Google Scholar : PubMed/NCBI
|
|
18
|
Hua D, Qin F, Shen L, Jiang Z, Zou ST, Xu
L, Cheng ZH and Wu SL: β3GnT8 regulates laryngeal carcinoma cell
proliferation via targeting MMPs/TIMPs and TGF-β1. Asian Pac J
Cancer Prev. 13:2087–2093. 2012. View Article : Google Scholar : PubMed/NCBI
|
|
19
|
Lien HC, Lee YH, Jeng YM, Lin CH, Lu YS
and Yao YT: Differential expression of hyaluronan synthase 2 in
breast carcinoma and its biological significance. Histopathology.
65:328–339. 2014. View Article : Google Scholar : PubMed/NCBI
|
|
20
|
Warrington NM, Sun T and Rubin JB:
Targeting brain tumor cAMP: The case for sex-specific therapeutics.
Front Pharmacol. 6:1532015. View Article : Google Scholar : PubMed/NCBI
|
|
21
|
Dong H, Claffey KP, Brocke S and Epstein
PM: Expression of phosphodiesterase 6 (PDE6) in human breast cancer
cells. SpringerPlus. 2:6802013. View Article : Google Scholar : PubMed/NCBI
|
|
22
|
Law V, Knox C, Djoumbou Y, Jewison T, Guo
AC, Liu Y, Maciejewski A, Arndt D, Wilson M, Neveu V, et al:
DrugBank 4.0: Shedding new light on drug metabolism. Nucleic Acids
Res. 42:D1091–D1097. 2014. View Article : Google Scholar : PubMed/NCBI
|
|
23
|
Hong Y, Kim WJ, Bang CY, Lee JC and Oh YM:
Identification of alternative splicing and fusion transcripts in
non-small cell lung cancer by RNA sequencing. Tuberc Respir Dis
(Seoul). 79:85–90. 2016. View Article : Google Scholar : PubMed/NCBI
|
|
24
|
Nicastri A, Gaspari M, Sacco R, Elia L,
Gabriele C, Romano R, Rizzuto A and Cuda G: N-glycoprotein analysis
discovers new up-regulated glycoproteins in colorectal cancer
tissue. J Proteome Res. 13:4932–4941. 2014. View Article : Google Scholar : PubMed/NCBI
|
|
25
|
Nisman B, Appelbaum L, Yutkin V,
Nechushtan H, Hubert A, Uziely B, Pode D and Peretz T: Serum
thymidine kinase 1 activity following nephrectomy for renal cell
carcinoma and radiofrequency ablation of metastases to lung and
liver. Anticancer Res. 36:1791–1797. 2016.PubMed/NCBI
|
|
26
|
Wenners A, Hartmann F, Jochens A, Roemer
AM, Alkatout I, Klapper W, van Mackelenbergh M, Mundhenke C, Jonat
W and Bauer M: Stromal markers AKR1C1 and AKR1C2 are prognostic
factors in primary human breast cancer. Int J Clin Oncol.
21:548–556. 2016. View Article : Google Scholar : PubMed/NCBI
|
|
27
|
Wang L, Seino J, Tomotake H, Funakoshi Y,
Hirayama H and Suzuki T: Co-Expression of NEU2 and GBA3 causes a
drastic reduction in cytosolic sialyl free N-glycans in human MKN45
stomach cancer cells-evidence for the physical interaction of NEU2
and GBA3. Biomolecules. 5:1499–1514. 2015. View Article : Google Scholar : PubMed/NCBI
|
|
28
|
Gilkes DM, Bajpai S, Wong CC, Chaturvedi
P, Hubbi ME, Wirtz D and Semenza GL: Procollagen lysyl hydroxylase
2 is essential for hypoxia-induced breast cancer metastasis. Mol
Cancer Res. 11:456–466. 2013. View Article : Google Scholar : PubMed/NCBI
|
|
29
|
Edqvist PH, Huvila J, Forsström B, Talve
L, Carpén O, Salvesen HB, Krakstad C, Grénman S, Johannesson H,
Ljungqvist O, et al: Loss of ASRGL1 expression is an independent
biomarker for disease-specific survival in endometrioid endometrial
carcinoma. Gynecol Oncol. 137:529–537. 2015. View Article : Google Scholar : PubMed/NCBI
|
|
30
|
Liu G, Hou G, Li L, Li Y, Zhou W and Liu
L: Potential diagnostic and prognostic marker dimethylglycine
dehydrogenase (DMGDH) suppresses hepatocellular carcinoma
metastasis in vitro and in vivo. Oncotarget. 7:32607–32616. 2016.
View Article : Google Scholar : PubMed/NCBI
|
|
31
|
Lu Z, Yao Y, Song Q, Yang J, Zhao X, Yang
P and Kang J: Metabolism-related enzyme alterations identified by
proteomic analysis in human renal cell carcinoma. Onco Targets
Ther. 9:1327–1337. 2016.PubMed/NCBI
|
|
32
|
Joh HK, Giovannucci EL, Bertrand KA, Lim S
and Cho E: Predicted plasma 25-hydroxyvitamin D and risk of renal
cell cancer. J Natl Cancer Inst. 105:726–732. 2013. View Article : Google Scholar : PubMed/NCBI
|
|
33
|
Shang Y, Yi S, Cui D, Han G and Liu C:
Vitamin E Intake and risk of renal cell carcinoma: A meta-analysis
of 7 case-control studies. J Ren Nutr. 25:339–344. 2015. View Article : Google Scholar : PubMed/NCBI
|
|
34
|
Mitsui Y, Chang I, Fukuhara S, Hiraki M,
Arichi N, Yasumoto H, Hirata H, Yamamura S, Shahryari V, Deng G, et
al: CYP1B1 promotes tumorigenesis via altered expression of CDC20
and DAPK1 genes in renal cell carcinoma. BMC Cancer. 15:9422015.
View Article : Google Scholar : PubMed/NCBI
|
|
35
|
Narjoz C, Favre A, McMullen J, Kiehl P,
Montemurro M, Figg WD, Beaune P, de Waziers I and Rochat B:
Important role of CYP2J2 in protein kinase inhibitor degradation: A
possible role in intratumor drug disposition and resistance. PLoS
One. 9:e955322014. View Article : Google Scholar : PubMed/NCBI
|
|
36
|
Trachootham D, Alexandre J and Huang P:
Targeting cancer cells by ROS-mediated mechanisms: A radical
therapeutic approach? Nat Rev Drug Discov. 8:579–591. 2009.
View Article : Google Scholar : PubMed/NCBI
|
|
37
|
Rodrigues D, Monteiro M, Jeronimo C,
Henrique R, Belo L, Bastos ML, de Pinho P Guedes and Carvalho M:
Renal cell carcinoma: A critical analysis of metabolomic biomarkers
emerging from current model systems. Transl Res. 180:1–11. 2017.
View Article : Google Scholar : PubMed/NCBI
|
|
38
|
Masui K, Cavenee WK and Mischel PS: Cancer
metabolism as a central driving force of glioma pathogenesis. Brain
Tumor Pathol. 33:161–168. 2016. View Article : Google Scholar : PubMed/NCBI
|
|
39
|
Johnson C, Warmoes MO, Shen X and Locasale
JW: Epigenetics and cancer metabolism. Cancer Lett. 356:309–314.
2015. View Article : Google Scholar : PubMed/NCBI
|
|
40
|
Monteiro MS, Carvalho M, de Lourdes Bastos
M and de Pinho PG: Biomarkers in renal cell carcinoma: A
metabolomics approach. Metabolomics. 10:1210–1222. 2014. View Article : Google Scholar
|
|
41
|
Kim K, Taylor SL, Ganti S, Guo L, Osier MV
and Weiss RH: Urine metabolomic analysis identifies potential
biomarkers and pathogenic pathways in kidney cancer. OMICS.
15:293–303. 2011. View Article : Google Scholar : PubMed/NCBI
|
|
42
|
Shim EH, Livi CB, Rakheja D, Tan J, Benson
D, Parekh V, Kho EY, Ghosh AP, Kirkman R, Velu S, et al:
L-2-Hydroxyglutarate: An epigenetic modifier and putative
oncometabolite in renal cancer. Cancer discov. 4:1290–1298. 2014.
View Article : Google Scholar : PubMed/NCBI
|
|
43
|
Armitage EG and Barbas C: Metabolomics in
cancer biomarker discovery: Current trends and future perspectives.
J Pharm Biomed Anal. 87:1–11. 2014. View Article : Google Scholar : PubMed/NCBI
|
|
44
|
You L, Zhang B and Tang YJ: Application of
stable isotope-assisted metabolomics for cell metabolism studies.
Metabolites. 4:142–165. 2014. View Article : Google Scholar : PubMed/NCBI
|
|
45
|
Hakimi AA, Reznik E, Lee CH, Creighton CJ,
Brannon AR, Luna A, Aksoy BA, Liu EM, Shen R, Lee W, et al: An
integrated metabolic atlas of clear cell renal cell carcinoma.
Cancer Cell. 29:104–116. 2016. View Article : Google Scholar : PubMed/NCBI
|
|
46
|
Schwanhausser B, Busse D, Li N, Dittmar G,
Schuchhardt J, Wolf J, Chen W and Selbach M: Global quantification
of mammalian gene expression control. Nature. 473:337–342. 2011.
View Article : Google Scholar : PubMed/NCBI
|
|
47
|
Nagaraj N, Wisniewski JR, Geiger T, Cox J,
Kircher M, Kelso J, Pääbo S and Mann M: Deep proteome and
transcriptome mapping of a human cancer cell line. Mol Syst Biol.
7:5482011. View Article : Google Scholar : PubMed/NCBI
|
|
48
|
Meng FD, Ma P, Sui CG, Tian X and Jiang
YH: Association between cytochrome P450 1A1 (CYP1A1) gene
polymorphisms and the risk of renal cell carcinoma: A
meta-analysis. Sci Rep. 5:81082015. View Article : Google Scholar : PubMed/NCBI
|
|
49
|
Chang I, Fukuhara S, Wong DK, Gill A,
Mitsui Y, Majid S, Saini S, Yamamura S, Chiyomaru T, Hirata H, et
al: Cytochrome P450 1B1 polymorphisms and risk of renal cell
carcinoma in men. Tumour Biol. 35:10223–10230. 2014. View Article : Google Scholar : PubMed/NCBI
|
|
50
|
Quivy A, Daste A, Harbaoui A, Duc S,
Bernhard JC, Gross-Goupil M and Ravaud A: Optimal management of
renal cell carcinoma in the elderly: A review. Clin Interv Aging.
8:433–442. 2013.PubMed/NCBI
|
|
51
|
Wang G, Hou J, Ma L, Xie J, Yin J, Xu D,
Chang W, Tan X, Su T, Zhang H and Cao G: Risk factor for clear cell
renal cell carcinoma in Chinese population: A case-control study.
Cancer epidemiol. 36:177–182. 2012. View Article : Google Scholar : PubMed/NCBI
|
|
52
|
Sverko A, Sobočanec S, Kusic B, Kušić B,
Mačak-Šafranko Z, Sarić A, Leniček T, Kraus O, Andrišić L, Korolija
M, et al: Superoxide dismutase and cytochrome P450 isoenzymes might
be associated with higher risk of renal cell carcinoma in male
patients. Int Immunopharmacol. 11:639–645. 2011. View Article : Google Scholar : PubMed/NCBI
|
|
53
|
Kollmannsberger C, Soulieres D, Wong R,
Scalera A, Gaspo R and Bjarnason G: Sunitinib therapy for
metastatic renal cell carcinoma: Recommendations for management of
side effects. Can Urol Assoc J. 1 Suppl 2:S41–S54. 2007.PubMed/NCBI
|
|
54
|
McFadyen MC, Melvin WT and Murray GI:
Cytochrome P450 CYP1B1 activity in renal cell carcinoma. Br J
Cancer. 91:966–971. 2004. View Article : Google Scholar : PubMed/NCBI
|