Introduction
Hepatocellular carcinoma (HCC) is the 6th most
common type of primary malignant neoplasm and the third leading
cause of cancer-associated mortality worldwide. The morbidity and
mortality rates of the disease increase annually (1–3). HCC forms
heterogeneous tumors and its development is driven by numerous
factors. Chronic hepatitis B virus (HBV) infection and
HBV-associated cirrhosis account for the majority of cases of HCC,
which constitutes 70–90% of liver cancer cases according to
histological examination (4). The
efficacies of existing key HCC therapies, including hepatectomy,
percutaneous ethanol injection, radio frequency ablation and liver
transplantation, have improved in recent years. However, the
disease often progresses or recurs despite appropriate treatment
regimes, and the overall survival (OS) of HCC patients remains poor
(5). Therefore, novel molecular
markers that contribute to the development of effective treatment
strategies and the improved prognosis of patients with HCC are
urgently required.
FXYD domain-containing ion transport regulator 3
(FXYD3), also known as mammary tumor 8, belongs to the FXYD protein
family and is localized in the cell membrane and cytoplasm. It has
been reported that FXYD3 acts as a regulator of sodium-potassium
(Na+-K+) ATPase (6,7). One study
demonstrated that this integral cell membrane protein was
differentially expressed between tumor cells and normal cells,
regulated cell proliferation, cell apoptosis and tumor metastasis,
influenced the cell cycle, and participated in tumor angiogenesis
and progression (8). However, the
association between the expression of FXYD3 and tumor occurrence
and development remains poorly understood. FXYD3 is expressed in
numerous healthy tissues, including the uterus, stomach, colon and
skin (9,10). However, FXYD3 expression has also been
identified in various types of cancer, including breast cancer
(7), prostate cancer (11,12),
colorectal cancer (CRC) (13),
pancreatic cancer (14–16), esophageal squamous carcinoma (ESCC)
(17), lung cancer (18,19) and
glioma (20). Furthermore, FXYD3 was
demonstrated to be associated with the clinical prognoses of these
types of cancer. To the best of our knowledge, the association
between FXYD3 expression and HCC prognosis has not been previously
evaluated. In the present study, the expression of FXYD3 in HCC
tissues was investigated using reverse transcription-quantitative
polymerase chain reaction (RT-qPCR), western blotting and
immunohistochemical (IHC) staining analyses to determine the
prognostic value of FXYD3 for patients with HCC.
Materials and methods
Study population
The present study was approved by the Research
Ethics Committee of the Sun Yat-sen University Cancer Center
(Guangzhou, China). All patients provided informed consent for
study participation prior to undergoing tumor resection. Tissue
samples were obtained from 217 patients diagnosed with HCC who had
undergone curative resection at the Sun Yat-Sen University Cancer
Center between August 2002 and November 2011. Among them, 193 were
males and 24 were females, with age ranging from 20–75 years
(median, 49 years). A total of 137 paraffin-embedded primary HCC
tumor samples were selected (collected between January 2002 and
June 2008). Furthermore, 80 pairs of HCC tissues and adjacent
non-cancerous liver tissues were also selected from the Sun Yat-sen
University Cancer Center specimen repository (originally collected
between January 2009 and November 2011). A total of 6
paraffin-embedded breast cancer tissue samples from the Sun Yat-sen
University Cancer Center specimen repository were also used in the
present study as a positive control.
The following inclusion criteria were applied to the
present study: Histologically verified primary HCC, no previous
adjuvant chemotherapy, no diagnosis of distant metastases prior to
surgery and access to complete follow-up data. Patient tissues were
excluded from the study when there was evidence of Child-Pugh class
B or C liver disease. Postoperative follow-up included regular
recurrence and metastasis surveillance testing by measuring patient
serum α-fetoprotein levels, abdominal ultrasonography, chest
radiography, computed tomography, hepatic angiography and biopsies
at 2–4-month intervals. Patients with confirmed disease recurrence
received further treatment, including a second surgical resection.
The median follow-up time was 43.9 months (range, 1–131 months). A
total of 99 mortalities occurred during the follow-up period
(45.6%) and 118 patients (54.4%) survived. OS was defined as the
time from the date of surgery to the date of mortality from any
cause, including HCC. Disease-free survival was defined as the time
from the date of surgery to the date of regional relapse or distant
metastasis, and was determined among the remaining patients on the
date of their last follow-up appointment.
RNA extraction and RT-qPCR
Total RNA was extracted from 80 pairs of HCC tissues
and matched non-cancerous liver tissues, using TRIzol solution
(Invitrogen; Thermo Fisher Scientific, Inc., Waltham, MA, USA)
according to the manufacturer's instructions. RNA concentrations
were determined using a NanoDrop 2000 Spectrophotometer (Thermo
Fisher Scientific, Inc.). RNA with an absorbance ratio from 1.8 to
2.0 at 260 and 280 nm was considered as pure. Each cDNA sequence
was synthesized from 2 µg total RNA using a RevertAid First Strand
cDNA Synthesis kit (Toyobo Life Science, Osaka, Japan). The
resulting cDNA was processed by RT-qPCR to determine the relative
FXYD3 mRNA expression levels. GAPDH served as an internal control.
RT-qPCR was performed in triplicate at a final volume of 10 µl,
consisting of 5 µl 2X SYBR Green master mix (Toyobo Life Science),
0.4 µl 20 mmol/l forward primer, 0.4 µl reverse primer, 0.75 µl
sample cDNA and 3.45 µl RNase-free water. The reaction mixture was
preheated to 95°C for 10 min, followed by 45 cycles of 95°C for 30
sec and 60°C for 60 sec. The following primers were used for
RT-qPCR: FXYD3 forward, 5′-GGACGCCAATGACCTAGAAG-3′ and reverse,
5′-GGGTGATGAGAGGTGGAGTC-3′; and GAPDH forward,
5′-GGAGCGAGATCCCTCCAAAAT-3′ and reverse,
5′-GGCTGTTGTCATACTTCTCATGG-3′. The data were analyzed using the
quantification cycle (2−ΔΔCq) method (21) and the results were averaged and
expressed in relative expression units after normalization.
Protein extraction and western
blotting
Western blotting was performed to analyze the FXYD3
protein expression levels in the clinical specimens from patients
with HCC and the matched control tissues. Total protein was
extracted from the fresh-frozen tissue samples using
radioimmunoprecipitation assay lysis buffer (Beyotime Institute for
Biotechnology, Haimen, China) according to the manufacturer's
instructions. Protein concentrations were determined using a
Bicinchoninic Acid medProtein Assay kit (Thermo Fisher Scientific,
Inc.). A total of 30 µg protein per sample was separated by 12%
SDS-PAGE and electro-transferred onto polyvinylidene fluoride
membranes (Sigma-Aldrich; Merck KGaA, Darmstadt, Germany). The
membranes were blocked in 5% skim milk in Tris-buffered
saline-Tween for 60 min at room temperature. Subsequently, the
membranes were incubated overnight at 4°C with a rabbit anti-FXYD3
monoclonal antibody (cat. no. ab205534; dilution 1:1,000; Abcam,
Cambridge, UK) (22) and GAPDH (cat.
no. 10494-1-AP; dilution 1:5,000; ProteinTech Group, Inc., Chicago,
IL, USA). Subsequently, the membranes were incubated with
appropriate horseradish peroxidase (HRP)-conjugated anti-rabbit IgG
(cat. no. 7074; dilution 1:2,000; Cell Signaling Technology, Inc.,
Danvers, MA, USA) for 60 min at room temperature. The membranes
were washed with TBS with 20% Tween-3 times and peroxidase activity
was detected on X-ray films using an enhanced chemiluminescence
detection system (Cell Signaling Technology, Inc.). The band
intensities were measured by densitometry using Quantity One
software v4.6.9 (Bio-Rad Laboratories, Inc., Hercules, CA, USA).
The size of the FXYD3 band was consistent with the predicted
molecular weight of the FXYD3 protein and was normalized to GAPDH
protein levels.
IHC
Paraffin-embedded tissue sections, 4-µm thick, were
cut and mounted on glass slides. The samples were subsequently
deparaffinized in dimethylbenzene and rehydrated using 100, 95, 90,
80 and 70% ethanol solutions. Endogenous peroxidase activity was
blocked using 0.3% hydrogen peroxide at room temperature for 10
min. For antigen retrieval, the slides were boiled in
citrate-hydrochloric acid (pH 6.0) (cat. no. ZLI-9065; OriGene
Technologies, Inc.) for 20 min in a pressure cooker. Subsequent to
washing in PBS, the slides were treated with 5% sheep serum albumin
(cat. no. ab7481; Abcam) at room temperature for 15 min to prevent
non-specific binding. The tissue sections were then incubated with
rabbit anti-FXYD3 (cat. no. ab205534; dilution 1:400; Abcam)
overnight at 4°C. Following the primary antibody incubation, the
tissue sections were incubated with an HRP-conjugated secondary
antibody (Dako; Agilent Technologies, Inc., Santa Clara, CA, USA)
for 30 min at room temperature. The slides were then incubated with
3,3′-diaminobenzidine tetrahydrochloride for 10 min at room
temperature, all sections were counterstained with hematoxylin for
~2 min at room temperature. For the negative control, the primary
antibody was replaced with rabbit IgG (cat. no. 3900; dilution
1:400; Cell Signaling Technology, Inc.) (data not shown). A
positive control was provided by breast cancer tissue samples. The
semi-quantitative FXYD3 expression score was calculated as the sum
of the score for the proportion of positively stained tumor cells
and the score for staining intensity. These scores were determined
by two pathologists blinded to the clinical characteristics of the
patients. The proportions of positively stained tumor cells were
scored as follows: 0, <5% (negative); 1, 5–25% (sporadic); 2,
25–50% (focal); and 3, >50% (diffuse). Staining intensity was
graded according to the following scale: 0, no staining; 1, weak
staining (light yellow); 2, moderate staining (yellow-brown); and
3, strong staining (brown). The total immunostaining score was
calculated by multiplying the proportion of positively stained
cells by the staining intensity score, yielding a value ranging
from 0–9.
Statistical analysis
Statistical analysis was performed using SPSS 20.0
software (IBM Corp., Armonk, NY, USA). Scatterplots and bar graphs
were created using GraphPad Prism version 6.0 (GraphPad Software,
Inc., La Jolla, CA, USA). The distributions of the baseline
characteristics of the two groups, which were separated according
to a cutoff FXYD3 level of 1.285, were compared using χ2
or Fisher's exact tests. The Kaplan-Meier method and log-rank test
were used to plot survival curves and to calculate the difference
in survival between the groups. Parameters found to be significant
by univariate analysis were further evaluated by multivariate Cox
regression analysis. P<0.05 was considered to indicate a
statistically significant difference.
Results
Patients and clinicopathological
data
The expression of FXYD3 was analyzed in each tissue
sample at the mRNA and protein levels. FXYD3 expression in the 80
pairs of HCC tissues and matched non-cancerous liver tissues was
analyzed by RT-qPCR, and 24 pairs were also evaluated by western
blotting. Furthermore, 137 paraffin-embedded primary HCC tumor
samples were analyzed by IHC analysis. The associations between
patient clinicopathological data and FXYD3 expression levels in
patients with HCC are summarized in Table
I. χ2 tests demonstrated that FXYD3 expression
levels were significantly different between patients with one vs.
multiple tumors (P=0.011).
 | Table I.Clinicopathological data of patients
with hepatocellular carcinoma. |
Table I.
Clinicopathological data of patients
with hepatocellular carcinoma.
|
|
| FXYD3 protein
expression |
|
|---|
|
|
|
|
|
|---|
| Variables | Cases, n | Low, n (%) | High, n (%) |
P-valuea |
|---|
| Age, years |
|
|
|
|
|
≤50 | 70 | 43 (61.4) | 27 (38.6) | 0.231 |
|
>50 | 67 | 34 (50.7) | 33 (49.3) |
|
| Sex |
|
|
|
|
|
Male | 124 | 69 (55.6) | 55 (44.4) | 0.775 |
|
Female | 13 | 8
(61.5) | 5
(38.5) |
|
| Hepatitis B surface
antigen |
|
|
|
|
|
Negative | 69 | 39 (56.5) | 30 (43.5) | 0.604 |
|
Positive | 68 | 38 (55.9) | 30 (44.1) |
|
| Serum AFP,
µg/ml |
|
|
|
|
|
≤400 | 86 | 47 (54.7) | 39 (45.3) | 0.722 |
|
>400 | 51 | 30 (58.8) | 21 (41.2) |
|
| Tumor size, cm |
|
|
|
|
| ≤5 | 60 | 37 (61.7) | 23 (38.3) | 0.299 |
|
>5 | 77 | 40 (51.9) | 37 (48.1) |
|
| Tumor no. |
|
|
|
|
|
Single | 100 | 63 (63.0) | 37 (37.0) | 0.011b |
|
Multiple | 37 | 14 (37.8) | 23 (62.2) |
|
| Microvascular
invasion |
|
|
|
|
| No | 123 | 66 (53.7) | 57 (46.3) | 0.092 |
|
Yes | 14 | 11 (78.6) | 3
(21.4) |
|
| Liver
cirrhosis |
|
|
|
|
| No | 90 | 48 (53.9) | 41 (46.1) | 0.591 |
|
Yes | 47 | 28 (59.6) | 19 (40.4) |
|
| Differentiation
grade |
|
|
|
|
|
I+II | 74 | 41 (55.4) | 33 (44.6) | 0.864 |
|
III+IV | 63 | 36 (57.1) | 27 (42.9) |
|
| TNM stage |
|
|
|
|
| I | 88 | 55 (62.5) | 33 (37.5) | 0.051 |
|
II+III+IV | 49 | 22 (44.9) | 27 (55.1) |
|
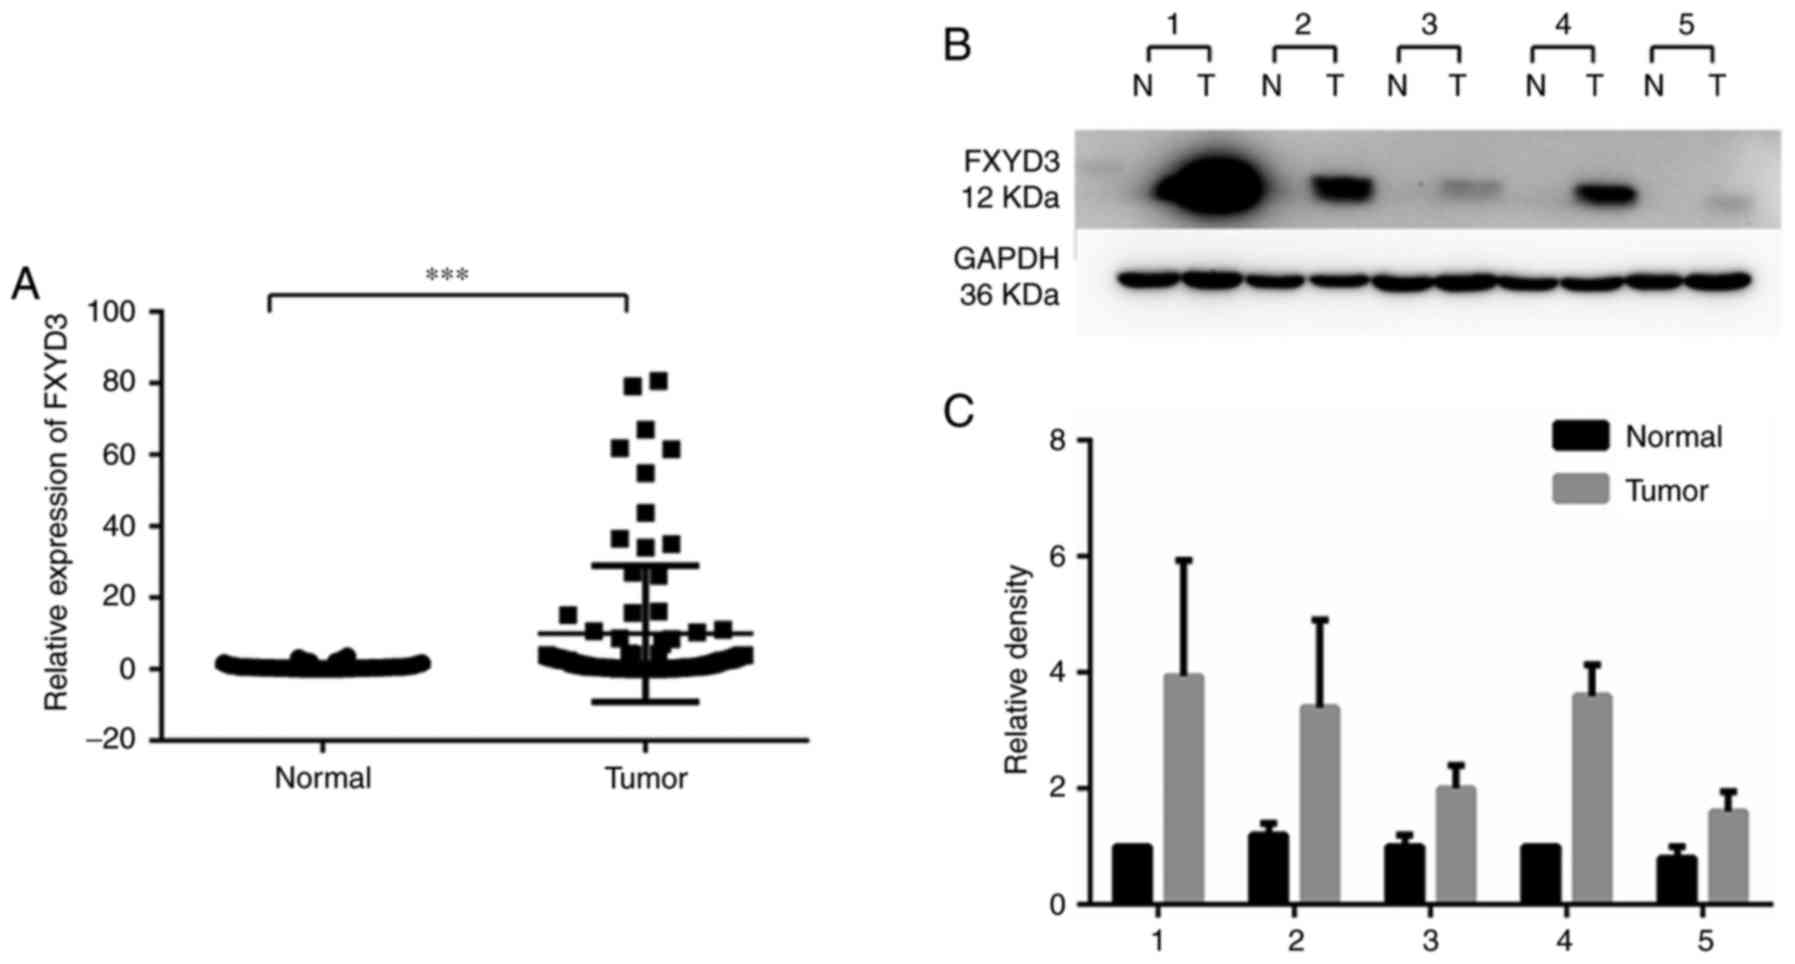
FXYD3 overexpression in HCC
RT-qPCR and western blotting were performed to
analyze the expression of FXYD3 in HCC and non-cancerous liver
tissue samples. This revealed that FXYD3 expression was
significantly elevated in the HCC tissues compared with non-tumor
tissues at the mRNA and protein levels (Fig. 1). Fig.
1B is a representative image of 3 replicates. The western blots
of 5 paired samples (20.8%) showed significant protein expression
and the remaining samples (79.2%) did not exhibit visible
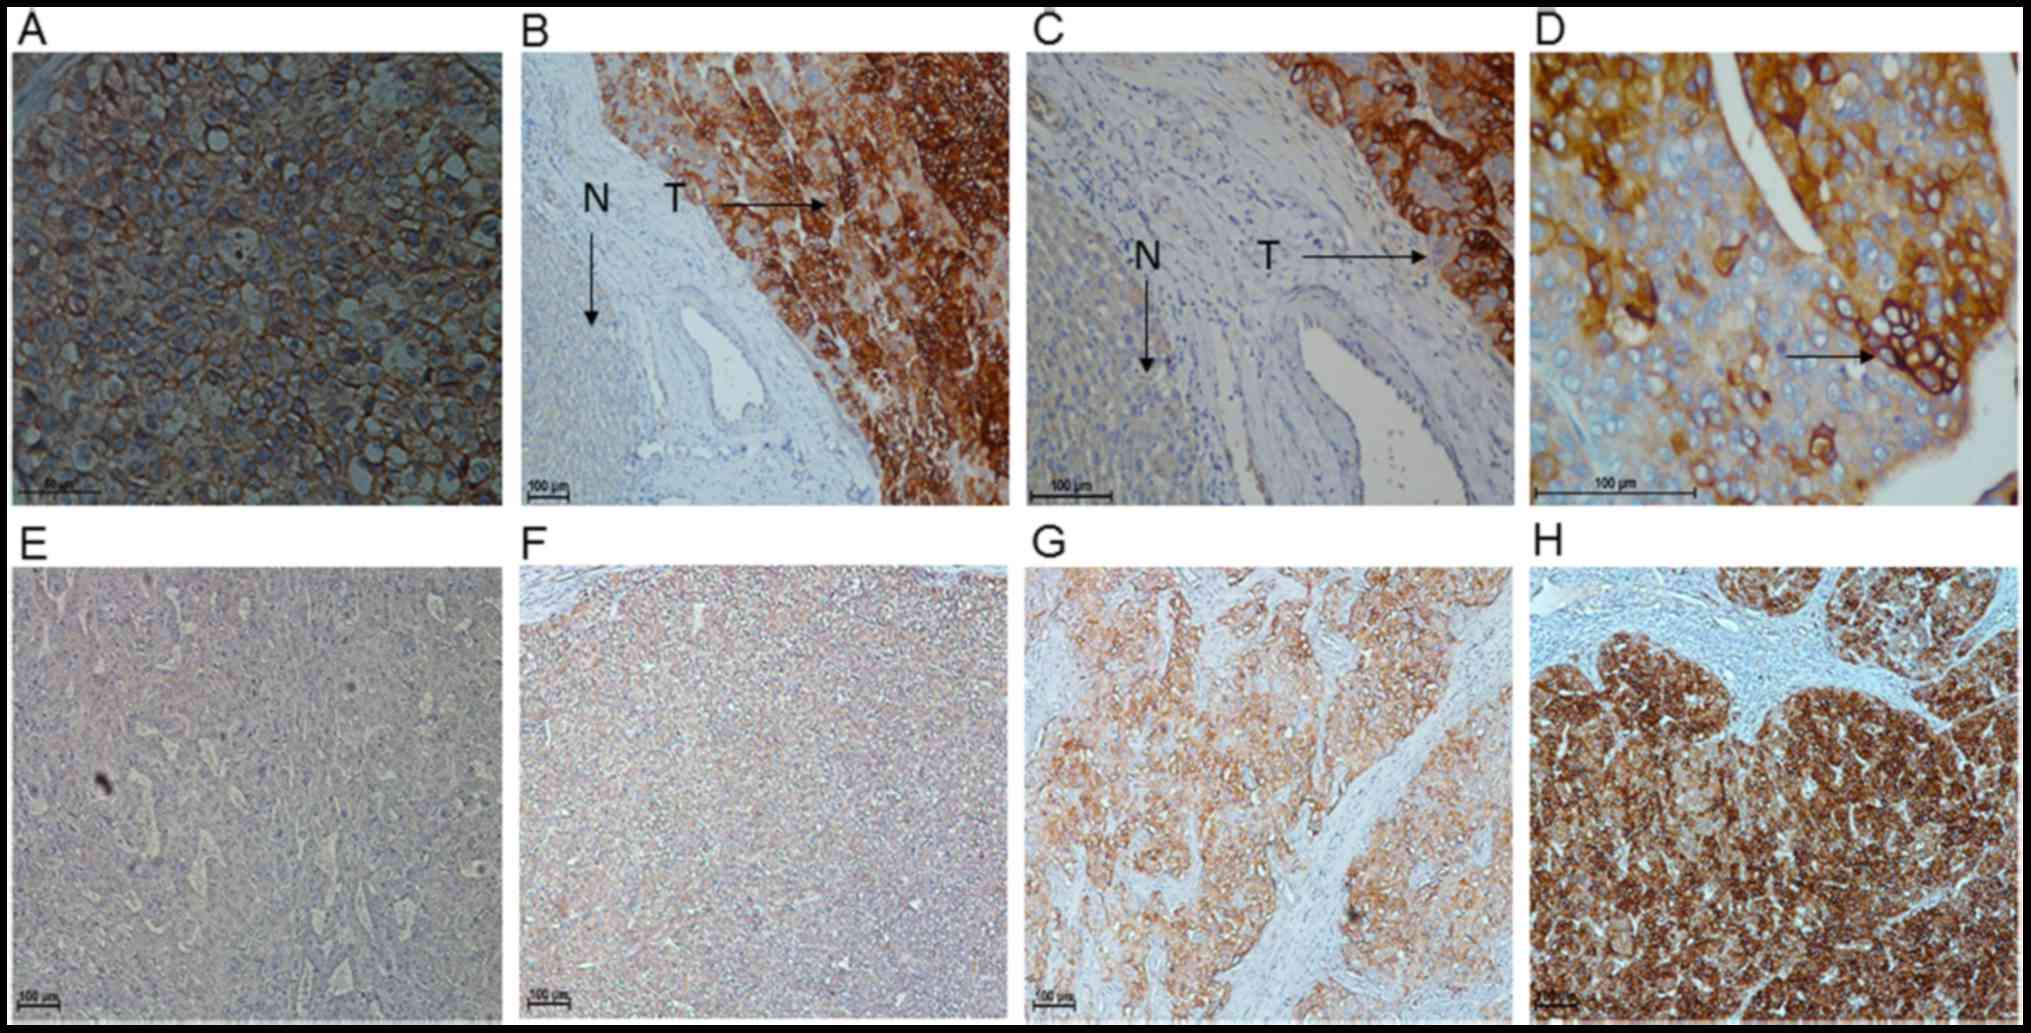
expression. IHC analysis of 137 HCC tissues was used to assess the
function and prognostic significance of FXYD3 in HCC. Positive
staining for FXYD3 was indicated by the presence of brown granules
in the cell membrane and cytoplasm. The specimens were divided into
a high FXYD3 expression group (n=60; 43.8%) and a low FXYD3
expression group (n=77; 56.2%), which exhibited staining ranging
from strongly and moderately positive to weakly positive and
negative, respectively (Fig. 2).
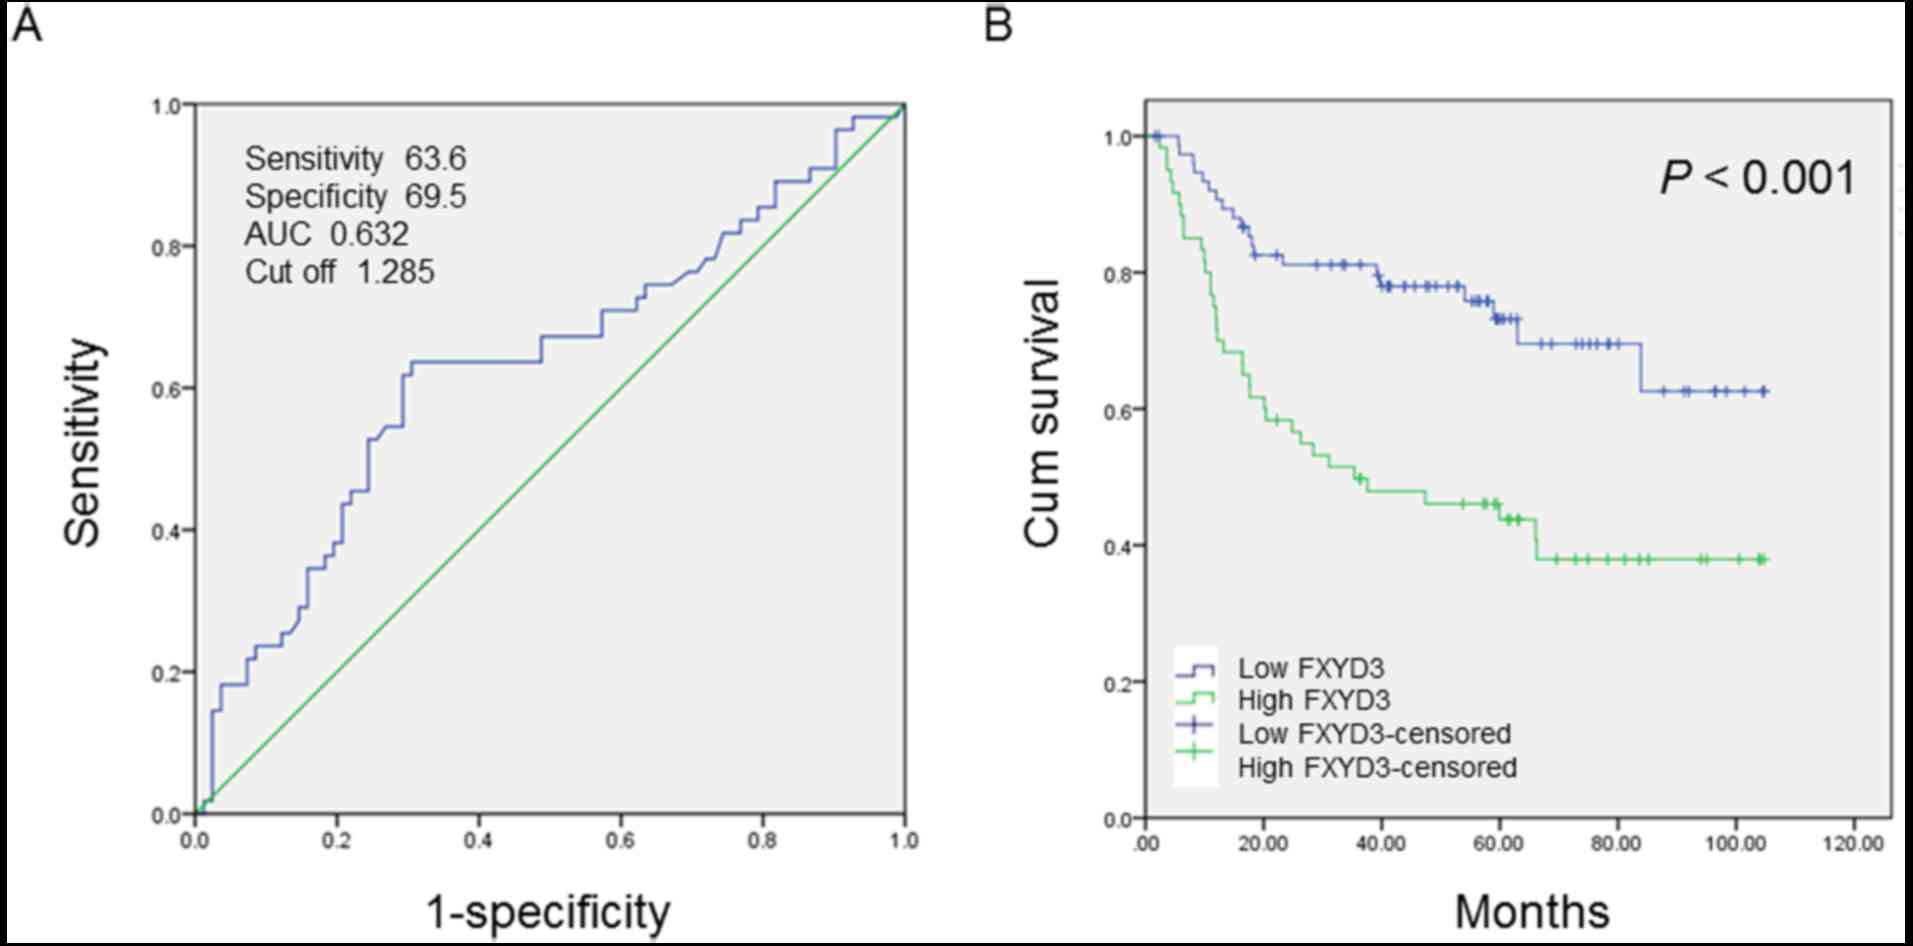
Prognostic significance of FXYD3
protein expression in HCC patients
Receiver operating characteristic (ROC) curve
analysis was performed to determine the cutoff score for FXYD3
protein expression. The score closest to the point at which maximum
sensitivity and specificity were displayed was selected as the
cutoff score. The area under the ROC curve was calculated to
estimate the power of FXYD3 to predict the OS rate over the entire
range of scores. According to the ROC curve analysis results
(Fig. 3A), the cohort was classified
into a high expression group and a low expression group to evaluate
the prognostic value of the FXYD3 in HCC patients.
The IHC results were used to evaluate the
association between HCC clinicopathological parameters and FXYD3
expression. The cutoff score (1.285) generated by ROC curve
analysis, was used for classification by high and low FXYD3
expression. Kaplan-Meier analysis and the log-rank test were
performed to analyze the association between FXYD3 protein
expression and OS. OS time was significantly higher in the group
with low FXYD3 expression levels than in the group with high FXYD3
expression levels (P<0.001; Fig.
3B).
Univariate Cox regression analysis demonstrated that
FXYD3 expression (P=0.001), tumor size (P=0.007), tumor number
(P<0.001) and tumor stage (TNM) (P<0.001) were significant
risk factors for OS (Table II).
Multivariate Cox regression analysis indicated that FXYD3
expression (P=0.008), tumor size (P=0.027), and tumor number
(P<0.001) were independent prognostic factors in patients with
HCC (Table II).
| Table II.Prognostic significance of FXYD3
protein in hepatocellular carcinoma patients. |
Table II.
Prognostic significance of FXYD3
protein in hepatocellular carcinoma patients.
|
| Univariate
analysis | Multivariate
analysis |
|---|
|
|
|
|
|---|
| Variables | HR | 95% CI | P-value | HR | 95% CI | P-value |
|---|
| FXYD3 | 2.643 | 1.524–4.582 | 0.001a | 2.137 | 1.224–3.732 | 0.008a |
| Age (years) | 1.146 | 0.673–1.952 | 0.615 |
|
|
|
| Sex | 1.127 | 0.483–2.632 | 0.782 |
|
|
|
| Hepatitis B surface
antigen | 1.013 | 0.434–2.368 | 0.976 |
|
|
|
| Serum AFP | 1.397 | 0.814–2.397 | 0.226 |
|
|
|
| Tumor size | 2.232 | 1.246–3.998 | 0.007a | 1.935 | 1.076–3.480 | 0.027a |
| Tumor number | 5.077 | 2.968–8.683 |
<0.001a | 4.131 | 2.401–7.109 |
<0.001a |
| Microvascular
invasion | 1.996 | 0.901–4.425 | 0.089 |
|
|
|
| Liver
cirrhosis | 1.311 | 0.761–2.260 | 0.330 |
|
|
|
| Differentiation
grade | 1.222 | 1.720–2.074 | 0.457 |
|
|
|
| TNM stage | 4.535 | 2.619–7.855 |
<0.001a |
|
| 0.237 |
Discussion
The predominant clinical staging system for liver
cancer is the Barcelona Clinic Liver Cancer system, which is useful
for predicting prognoses and stratifying patients for treatment
(23). A series of predictive
biomarkers, including meprin A subunit α, vascular endothelial
growth factor and insulin-like growth factor-1, have facilitated
improvements in the OS and prognosis for patients with HCC in the
early and advanced stages of the disease when used in combination
with the aforementioned staging system (24–26). The
identification of additional novel predictive markers may
significantly improve patient clinical outcomes.
A series of studies have reported that FXYD3 is
expressed in numerous types of cancer. FXYD3 expression was
initially described in breast cancer (7), and subsequently detected in prostate
cancer, CRC, pancreatic cancer and ESCC, in which FXYD3 was
reported to be significantly upregulated in tumor tissues compared
with normal adjacent mucosal tissues (11–17).
However, in lung cancer and glioma, FXYD3 was demonstrated to be
expressed at low levels compared with healthy paracancerous tissues
(18–20). FXYD3 was originally identified in
murine mammary tumors. Morrison and Leder (6) determined that FXYD3 expression was
induced by the Neu and Ras genes rather than the c-Myc and Int-2
genes. In human mammary epithelial cells, transforming growth
factor-β has been demonstrated to cause downregulation of FXYD3
expression through the zinc finger E-box binding homeobox 1 pathway
(27,28). In CRC, FXYD3 expression is
hypothesized to be associated with p53 expression, as the FXYD3
promoter contains the p53 binding site. Increased CRC cell
apoptosis, despite p53 mutations, has been demonstrated to be
associated with small interfering FXYD3 (29,30).
However, there is little knowledge regarding the association
between FXYD3 expression and the clinical prognosis of HCC
patients.
The Na+-K+ ATPase is composed
of tetramers of α and β subunits and is located in the plasma
membrane. The channel transports three Na+ ions out of
the cell and two K+ ions into the cell to maintain
cellular homeostasis (31). The
Na+-K+ ATPase has been demonstrated to be
associated with cancer initiation, growth, development and
metastasis (32). It has also been
demonstrated to function in the p38 mitogen-activated protein
kinase/extracellular signal-regulated kinase signaling cascade, Src
kinase activity, phosphoinositide 3-kinase/Akt/mechanistic target
of rapamycin signaling and the epithelial-mesenchymal transition,
all of which are important pathways in tumorigenesis and tumor
progression (32). Furthermore, it
has been reported that cardiac steroids (cardiac glycosides), which
are potent Na+-K+ pump inhibitors, can
postpone tumor recurrence and metastasis, prolong survival times
and increase survival rates of post-surgical patients with HCC
(33–36). FXYD3 can function as a β-subunit of
the Na+-K+ ATPase and modulate certain cell
functions. However, FXYD3 can also affect glycosylation of the
β-subunit of X, K-ATPase when co-expressed in Xenopus
oocytes (33–35). Glycosylation is closely associated
with tumorigenesis (36,37); however, whether FXYD3-mediated
glycosylation of Na+-K+ ATPase contributes to
HCC growth, invasion and/or metastasis requires investigation in
future studies.
FXYD3 expression was examined at the transcriptional
and translational levels by RT-qPCR, western blotting and IHC.
Using RT-qPCR, it was demonstrated that FXYD3 expression was
significantly elevated in HCC tumor tissues compared with that in
non-cancerous liver tissues. These results were supported by those
achieved through western blotting. It is important to note that
microvascular invasion is a key determinant of prognosis in
patients with HCC. However, the present study indicated no
significant association between FXYD3 expression and microvascular
invasion using χ2 analysis. ROC curve analysis was
performed to identify a cutoff value with which to classify
patients into high or low FXYD3 expression groups. Using
Kaplan-Meier analysis and the log-rank test, it was determined that
FXYD3 expression is associated with OS at the protein level
(P<0.001) and that high FXYD3 expression was predictive of a
poor prognosis in patients with HCC. Univariate and multivariate
Cox regression analyses indicated that FXYD3 protein expression
level was an independent prognostic factor (P=0.008) in patients
with HCC. However, it is possible that bias may have resulted in
group-group differences in survival.
In conclusion, elevated FXYD3 mRNA and protein
expression levels are predictive of poor survival. The present
study partially clarifies the role of FXYD3 in HCC, however, the
precise mechanism underlying the association between the expression
of FXYD3 and HCC remains to be elucidated. Further large
multicenter studies are required to achieve this.
Acknowledgements
This study was supported by the National Natural
Science Foundation of China (grant nos. 81625017 and 81572385) and
the Fundamental Research Funds for the Central Universities of
China (grant no. 16ykjc36).
References
|
1
|
Forner A, Llovet JM and Bruix J:
Hepatocellular carcinoma. Lancet. 379:1245–1255. 2012. View Article : Google Scholar : PubMed/NCBI
|
|
2
|
He G, Dhar D, Nakagawa H, Font-Burgada J,
Ogata H, Jiang Y, Shalapour S, Seki E, Yost SE, Jepsen K, et al:
Identification of liver cancer progenitors whose malignant
progression depends on autocrine IL-6 signaling. Cell. 155:384–396.
2013. View Article : Google Scholar : PubMed/NCBI
|
|
3
|
Li Z, Tuteja G, Schug J and Kaestner KH:
Foxa1 and Foxa2 are essential for sexual dimorphism in liver
cancer. Cell. 148:72–83. 2012. View Article : Google Scholar : PubMed/NCBI
|
|
4
|
Torre LA, Bray F, Siegel RL, Ferlay J,
Lortet-Tieulent J and Jemal A: Global cancer statistics, 2012. CA
Cancer J Clin. 65:87–108. 2015. View Article : Google Scholar : PubMed/NCBI
|
|
5
|
Maluccio M and Covey A: Recent progress in
understanding, diagnosing, and treating hepatocellular carcinoma.
CA Cancer J Clin. 62:394–399. 2012. View Article : Google Scholar : PubMed/NCBI
|
|
6
|
Morrison BW and Leder P: Neu and ras
initiate murine mammary tumors that share genetic markers generally
absent in c-myc and int-2-initiated tumors. Oncogene. 9:3417–3426.
1994.PubMed/NCBI
|
|
7
|
Morrison BW, Moorman JR, Kowdley GC,
Kobayashi YM, Jones LR and Leder P: Mat-8, a novel
phospholemman-like protein expressed in human breast tumors,
induces a chloride conductance in Xenopus oocytes. J Biol Chem.
270:2176–2182. 1995. View Article : Google Scholar : PubMed/NCBI
|
|
8
|
Zhuang L, Xu L, Wang P, Jiang Y, Yong P,
Zhang C, Zhang H, Meng Z and Yang P:
Na+/K+-ATPase α1 subunit, a novel therapeutic
target for hepatocellular carcinoma. Oncotarget. 6:28183–28193.
2015. View Article : Google Scholar : PubMed/NCBI
|
|
9
|
Capendeguy O and Horisberger JD:
Functional effects of Na+, K+-ATPase gene
mutations linked to familial hemiplegic migraine. Neuromolecular
Med. 6:105–116. 2004. View Article : Google Scholar : PubMed/NCBI
|
|
10
|
Capurro C, Coutry N, Bonvalet JP, Escoubet
B, Garty H and Farman N: Cellular localization and regulation of
CHIF in kidney and colon. Am J Physiol. 271:C753–C762. 1996.
View Article : Google Scholar : PubMed/NCBI
|
|
11
|
Vaarala MH, Porvari K, Kyllönen A and
Vihko P: Differentially expressed genes in two LNCaP prostate
cancer cell lines reflecting changes during prostate cancer
progression. Lab Invest. 80:1259–1268. 2000. View Article : Google Scholar : PubMed/NCBI
|
|
12
|
Grzmil M, Voigt S, Thelen P, Hemmerlein B,
Helmke K and Burfeind P: Up-regulated expression of the MAT-8 gene
in prostate cancer and its siRNA-mediated inhibition of expression
induces a decrease in proliferation of human prostate carcinoma
cells. Int J Oncol. 24:97–105. 2004.PubMed/NCBI
|
|
13
|
Widegren E, Onnesjö S, Arbman G, Kayed H,
Zentgraf H, Kleeff J, Zhang H and Sun XF: Expression of FXYD3
protein in relation to biological and clinicopathological variables
in colorectal cancers. Chemotherapy. 55:407–413. 2009. View Article : Google Scholar : PubMed/NCBI
|
|
14
|
Iacobuzio-Donahue CA, Maitra A, Olsen M,
Lowe AW, van Heek NT, Rosty C, Walter K, Sato N, Parker A, Ashfaq
R, et al: Exploration of global gene expression patterns in
pancreatic adenocarcinoma using cDNA microarrays. Am J Pathol.
162:1151–1162. 2003. View Article : Google Scholar : PubMed/NCBI
|
|
15
|
Friess H, Ding J, Kleeff J, Fenkell L,
Rosinski JA, Guweidhi A, Reidhaar-Olson JF, Korc M, Hammer J and
Büchler MW: Microarray-based identification of differentially
expressed growth- and metastasis-associated genes in pancreatic
cancer. Cell Mol Life Sci. 60:1180–1199. 2003. View Article : Google Scholar : PubMed/NCBI
|
|
16
|
Logsdon CD, Simeone DM, Binkley C,
Arumugam T, Greenson JK, Giordano TJ, Misek DE, Kuick R and Hanash
S: Molecular profiling of pancreatic adenocarcinoma and chronic
pancreatitis identifies multiple genes differentially regulated in
pancreatic cancer. Cancer Res. 63:2649–2657. 2003.PubMed/NCBI
|
|
17
|
Zhu ZL, Yan BY, Zhang Y, Yang YH, Wang MW,
Zentgraf H, Zhang XH and Sun XF: Overexpression of FXYD-3 is
involved in the tumorigenesis and development of esophageal
squamous cell carcinoma. Dis Markers. 35:195–202. 2013. View Article : Google Scholar : PubMed/NCBI
|
|
18
|
Gordon GJ, Richards WG, Sugarbaker DJ,
Jaklitsch MT and Bueno R: A prognostic test for adenocarcinoma of
the lung from gene expression profiling data. Cancer Epidemiol
Biomarkers Prev. 12:905–910. 2003.PubMed/NCBI
|
|
19
|
Okudela K, Yazawa T, Ishii J, Woo T,
Mitsui H, Bunai T, Sakaeda M, Shimoyamada H, Sato H, Tajiri M, et
al: Down-regulation of FXYD3 expression in human lung cancers: Its
mechanism and potential role in carcinogenesis. Am J Pathol.
175:2646–2656. 2009. View Article : Google Scholar : PubMed/NCBI
|
|
20
|
Wang MW, Gu P, Zhang ZY, Zhu ZL, Geng Y,
Kayed H, Zentgraf H and Sun XF: FXYD3 expression in gliomas and its
clinicopathological significance. Oncol Res. 18:133–139. 2009.
View Article : Google Scholar : PubMed/NCBI
|
|
21
|
Livak KJ and Schmittgen TD: Analysis of
relative gene expression data using real-time quantitative PCR and
the 2(-Delta Delta C(T)) method. Methods. 25:402–408. 2001.
View Article : Google Scholar : PubMed/NCBI
|
|
22
|
Instructions of the Anti-FXYD3 antibody:
Anti-FXYD3 antibody [EPR17160] ab205534. http://www.abcam.com/fxyd3-antibody-epr17160-ab205534.html
|
|
23
|
Llovet JM, Brú C and Bruix J: Prognosis of
hepatocellular carcinoma: The BCLC staging classification. Semin
Liver Dis. 19:329–338. 1999. View Article : Google Scholar : PubMed/NCBI
|
|
24
|
OuYang HY, Xu J, Luo J, Zou RH, Chen K, Le
Y, Zhang YF, Wei W, Guo RP and Shi M: MEP1A contributes to tumor
progression and predicts poor clinical outcome in human
hepatocellular carcinoma. Hepatology. 63:1227–1239. 2016.
View Article : Google Scholar : PubMed/NCBI
|
|
25
|
Kaseb AO, Hassan MM, Lin E, Xiao L, Kumar
V, Pathak P, Lozano R, Rashid A, Abbruzzese JL and Morris JS:
V-CLIP: Integrating plasma vascular endothelial growth factor into
a new scoring system to stratify patients with advanced
hepatocellular carcinoma for clinical trials. Cancer.
117:2478–2488. 2011. View Article : Google Scholar : PubMed/NCBI
|
|
26
|
Kaseb AO, Abbruzzese JL, Vauthey JN, Aloia
TA, Abdalla EK, Hassan MM, Lin E, Xiao L, El-Deeb AS, Rashid A and
Morris JS: I-CLIP: Improved stratification of advanced
hepatocellular carcinoma patients by integrating plasma IGF-1 into
CLIP score. Oncology. 80:373–381. 2011. View Article : Google Scholar : PubMed/NCBI
|
|
27
|
Yamamoto H, Mukaisho K, Sugihara H,
Hattori T and Asano S: Down-regulation of FXYD3 is induced by
transforming growth factor-β signaling via ZEB1/δEF1 in human
mammary epithelial cells. Biol Pharm Bull. 34:324–329. 2011.
View Article : Google Scholar : PubMed/NCBI
|
|
28
|
Herrmann P and Aronica SM: Estrogen and
tamoxifen up-regulate FXYD3 on breast cancer cells: Assessing the
differential roles of ER α and ZEB1. SpringerPlus. 4:2452015.
View Article : Google Scholar : PubMed/NCBI
|
|
29
|
Bibert S, Aebischer D, Desgranges F, Roy
S, Schaer D, Kharoubi-Hess S, Horisberger JD and Geering K: A link
between FXYD3 (Mat-8)-mediated Na,K-ATPase regulation and
differentiation of Caco-2 intestinal epithelial cells. Mol Biol
Cell. 20:1132–1140. 2009. View Article : Google Scholar : PubMed/NCBI
|
|
30
|
Maxwell PJ, Longley DB, Latif T, Boyer J,
Allen W, Lynch M, McDermott U, Harkin DP, Allegra CJ and Johnston
PG: Identification of 5-fluorouracil-inducible target genes using
cDNA microarray profiling. Cancer Res. 63:4602–4606.
2003.PubMed/NCBI
|
|
31
|
Kanai R, Ogawa H, Vilsen B, Cornelius F
and Toyoshima C: Crystal structure of a Na+-bound
Na+,K+-ATPase preceding the E1P state.
Nature. 502:201–206. 2013. View Article : Google Scholar : PubMed/NCBI
|
|
32
|
Durlacher CT, Chow K, Chen XW, He ZX,
Zhang X, Yang T and Zhou SF: Targeting
Na+/K+-translocating adenosine triphosphatase
in cancer treatment. Clin Exp Pharmacol Physiol. 42:427–443. 2015.
View Article : Google Scholar : PubMed/NCBI
|
|
33
|
Crambert G, Li C, Claeys D and Geering K:
FXYD3 (Mat-8), a new regulator of Na, K-ATPase. Mol Biol Cell.
16:2363–2371. 2005. View Article : Google Scholar : PubMed/NCBI
|
|
34
|
Yue Q, Zhen H, Huang M, Zheng X, Feng L,
Jiang B, Yang M, Wu W, Liu X and Guo D: Proteasome inhibition
contributed to the cytotoxicity of arenobufagin after its binding
with Na, K-ATPase in human cervical carcinoma HeLa cells. PLoS One.
11:e01590342016. View Article : Google Scholar : PubMed/NCBI
|
|
35
|
Chen Z, Chen HY, Lang QB, Li B, Zhai XF,
Guo YY, Yue XQ and Ling CQ: Preventive effects of jiedu granules
combined with cinobufacini injection versus transcatheter arterial
chemoembolization in post-surgical patients with hepatocellular
carcinoma: A case-control trial. Chin J Integr Med. 18:339–344.
2012. View Article : Google Scholar : PubMed/NCBI
|
|
36
|
Hart GW and Copeland RJ: Glycomics hits
the big time. Cell. 143:672–676. 2010. View Article : Google Scholar : PubMed/NCBI
|
|
37
|
Dalziel M, Crispin M, Scanlan CN, Zitzmann
N and Dwek RA: Emerging principles for the therapeutic exploitation
of glycosylation. Science. 343:12356812014. View Article : Google Scholar : PubMed/NCBI
|