Introduction
Monolayer cell cultures have been used extensively
as investigative tools before proceeding to animal studies.
However, despite their simplicity, the results obtained from such
cell models cannot always be replicated in subsequent animal
studies (1,2). Thus, there is a need to use a
multi-cellular model that better mimics the tumor mass in
vivo. Three-dimensional cell culture has therefore been
developed and optimized during the past forty years to create a
feasible cellular model that surrogates non-vascularized
micrometastases in vivo (3).
Three-dimensional spheroids can be generated through a number of
different methods either by allowing the cells to cluster through
altering the adhesive properties of surface of cell culture dishes
or environment, or by preventing aggregation through continuous
agitation (4,5). The latter, most commonly through the use
of spinner flasks or gyrating vessels, form spheroids in variable
sizes as they are formed from an uncertain and indecipherable
number of cells in an uncontrolled manner (4). On the other hand, hanging drop
techniques or liquid overlay using agarose, ensures near-equal
spheroid sizes through the seeding of identical cell concentrations
in each sample. Obtaining near-equal sizes is of importance when
comparing results of various treatments over time as well as when
comparing several sample cell lines. Therefore, liquid overlay was
the chosen method in this study. Spheroids allow the tumor cells to
aggregate and grow in a concentric way, creating an outer
proliferative cell-layer (P-cells), an inner layer with mainly
quiescent cells (Q-cells), and a central necrotic area, i.e., a
geometric relationship between the cells similar to that of tumor
micrometastases in vivo (6).
This cellular organization gives heterogeneous distribution of
oxygen, pH, nutrients, growth factors and cell signaling and a cell
matrix organization that might be similar to that of in vivo
tumor nodules (6–8). Moreover, the spatial configuration can
allow the cellular receptors to be distributed in a reasonably
realistic way. Accordingly, this might affect intracellular
signaling that makes the model more similar to an in vivo
tumor (1,6). Consequently, studies have indicated that
the cells returned to their original phenotype and functional
activity when grown as spheroids, in comparison to monolayer
cultures (9,10).
The spheroid model is a suitable tool to investigate
effects of radiation since it harbors parameters that influence
cellular responses to ionizing radiation such as hypoxia, local
variations in cell signaling and cell proliferation as well as
local pH variations and nutrient gradients (8,11). Oxygen
is responsible for approximately 65% of DNA damage caused by
irradiation. Thus, in case of hypoxia, a substantial part of the
radiation damaging effect can be lost. Cell signaling also
contributes to radioresistance of the tumor, since it aids the
cells in exchanging materials and agents for cellular repair in
order to overcome damage caused by radiation (12). Nutrient gradients determine the
proliferating and metabolic states of the tumor cells, providing
metabolically active and proliferating cells (P-cells) in the outer
cell layers, necrotic and apoptotic cells in the center of the
spheroids and Q-cells in between (8,9,13). Cells in the P- and Q-layers are known
to have different responses to radiation due to differences in
proliferation and oxygenation. While ionizing radiation instigates
a plethora of cellular responses, the cell cycle arrest in
G2, along with apoptosis and senescence, are of
particular interest in regard to the efficacy of radiotherapy.
Spheroid models have more physiological similarities of in
vivo tumor masses compared to monolayer cultures, providing an
intermediate situation to evaluate the effects of both radiotherapy
and therapeutic cancer (6). Thus,
spheroids are likely to facilitate knowledge translation when
planning animal and clinical trials.
To date, there are limited radiobiological studies
that have examined the effects of radiation on human spheroids on a
molecular level. This study was performed to investigate some
molecular effects and to assess the feasibility of the spheroid
model in combination with immunohistochemical stainings as tools to
evaluate the tumor radiobiological response in relation to
different irradiation doses. The pancreatic neuroendocrine BON1
cell line and the colonic adenocarcinoma HCT116 cell line were used
as model systems.
Materials and methods
Cell lines and culture conditions
The pancreatic neuroendocrine tumor BON1 cell line
was kindly provided by Professor Townsend (University of Texas
Medical Branch, Texas University, Galveston, TX, USA). BON1 cells
were cultured in 1:1 mixture of Dulbecco's modified Eagle's medium
(DMEM) and Ham's F12 (Biochrom GmBH, Berlin, Germany), supplemented
with 10% FBS fetal bovine serum (Sigma-Aldrich, St. Louis, MO,
USA), 1% L-glutamine (Biochrom GmBH), 1% combined antibiotics: 100
IU penicillin and 100 µg/ml streptomycin (Biochrom GmBH). The BON1
cell line has a doubling time in monolayer cell culture of
approximately 34 h (14). The
adenocarcinoma cell line HCT116 (purchased from ATCF/LGC Standard)
was cultured in McCoy's 5A medium (Biochrom GmBH), supplemented as
above. The HCT116 cell line has a doubling time in monolayer cell
culture of approximately 21 h according the product sheet of
ATCC/LGC Standard. Cells were incubated in 37°C in humidified
atmosphere containing 5% CO2.
Tumor spheroid culture
Spheroids were cultured in 96-well plates coated
with agarose (Sigma-Aldrich, St. Louis, MO, USA). Agarose was first
dissolved in a mixture composed of 95% phosphate-buffered saline
(PBS; Medicago AB, Uppsala, Sweden), 5% incomplete medium and 1%
combined antibiotics (100 IU penicillin and 100 µg/ml
streptomycin). The dissolving process was conducted with continuous
heating and stirring under aseptic conditions. The agarose-coated
96-well plates were left in room temperature until the agarose had
solidified prior to seeding. Tumor cell lines HCT116 and BON1 were
detached by trypsin/EDTA solution (Biochrom GmBH) and seeded in
previously defined concentrations in the agarose-coated 96-well
plates, then incubated in 37°C in humidified atmosphere and 5%
CO2.
Four 96-well plates were seeded for each cell line,
2,000 and 10,000 cells per well for HCT116 and BON1, respectively.
Plates were irradiated by 0, 2, 4, or 6 Gy as described below.
Spheroid growth was followed over time through image analysis as
described below. Medium was added to wells every 4–5 days. At the
end of the assay, spheroids were collected and were rinsed with PBS
5–6 times followed by immunohistochemistry (IHC) staining
(described below). HCT116 spheroids were collected at 14 days after
seeding, while BON1 spheroids were collected 12 days after
seeding.
Irradiation
Irradiation of the spheroids was performed 5 days
after seeding, using a 137Cs gamma-ray irradiator (Best
Theratronics Gammacell® Exactor; Best Theratronics Ltd.,
Springfield, VA, USA) at a dose rate of 1 Gy/min at room
temperature, at doses of 0, 2, 4 or 6 Gy.
Image analysis
Photographs of spheroids were taken by a Canon EOS
digital camera (version 700D; Canon, Inc., Tokyo, Japan) mounted on
an inverted microscope type Nikon Diaphot (phase contrast-2, ELWD
0.3; Nikon Corporation, Tokyo, Japan). Images were taken every 4–5
days until the end of the assay. The diameters of tumor spheroids
were measured manually by Image J software version 1.50i (Wayne
Rasband, NIH, Bethesda, MD, USA).
IHC. The spheroids were fixated in 4% neutral buffer
formalin (NBF) overnight, followed by centrifugation (1,000 rpm) in
Eppendorf tubes for 5 min. The supernatant was removed and 70% EtOH
added, and the spheroids were incubated for one hour. This
procedure was repeated with 95% EtOH, 100% EtOH and xylene, which
was exchanged by paraffin. Thereafter the spheroids were incubated
overnight at 65°C. The paraffin was then replaced by paraplast and
the spheroids incubated overnight at 65°C. The Eppendorf tubes
tips, where the spheroids were located, were then cut off and
embedded in the paraplast. Three µm thick sections were prepared
for IHC stainings. Spheroids were stained with primary antibodies:
Anti-caspase-3 (Abcam, Cambridge, UK), anti-galactosidase beta1
(anti-GLB1; Sigma-Aldrich, Darmstadt, Germany), or anti-cyclin B1
(Abcam). Automated IHC stainings were performed using intelliPATH™
(Biocare Medical, Concord, CA, USA) and the primary antibodies were
visualized using the MACH 1 Universal HRP-polymer kit (Biocare
Medical). The spheroid sections were counterstained with
intelliPATH™ hematoxylin (Biocare Medical), and finally the slides
were scanned by Aperio AT2 scanner (Leica Biosystems Inc., Buffalo
Grove, IL, USA). Semi-automatic grading for all Brightfield
spheroid images was obtained using ImageJ distribution Fiji (NIH)
analysis. In short, spheroids were identified through the color
deconvolution plugin (hematoxylin/DAB vectors), and pre-processing
the images with Gaussian blur (sigma=5), thresholding and
segmentation by the Watershed algorithm. Only detected regions of
interest above 50 px area were registered to exclude noise and cell
debris. A duplicate image was preprocessed with rolling ball
background subtraction (size 50) and then thresholded to show only
stained areas of spheroids, and masked over the regions of
interest. The stain coverage over the image was calculated as
follows: Average [sum (ROIstain/ROIarea)/255x100]=stain
coverage in %. ROIarea is the area of a spheroid, and ROIstain is
the stain fraction from 0–255.
Statistical analysis and graph
plotting
Microsoft® Excel 2016 for Mac (version
15.20; Microsoft Corporation, Redmond, WA, USA) and GraphPad Prism
(version 7.0a; GraphPad Software, Inc., La Jolla, CA, USA) for Mac
OS X were used for analyzing the data collected and for graph
plotting. Average spheroid diameters were calculated, and
normalized in percentage to the average diameter of non-irradiated
control spheroids. The doubling times of the spheroids were
calculated using GraphPad Prism, where the measured diameters were
used to calculate the volumes of each spheroid, before using a
linear regression equation to estimate doubling times. Two-way
ANOVA, followed by Tukey's multiple comparisons test was used to
assess statistical differences in spheroid size between groups at
0, 4 and 7 days after treatment. Differences were considered to be
statistically significant if P<0.05. For IHC quantifications,
GraphPad Prism was used to analyze obtained data. Unpaired t-tests
were used to analyze significant differences between two groups,
and were considered to be statistically significant if
P<0.05.
Results
Spheroid growth analysis
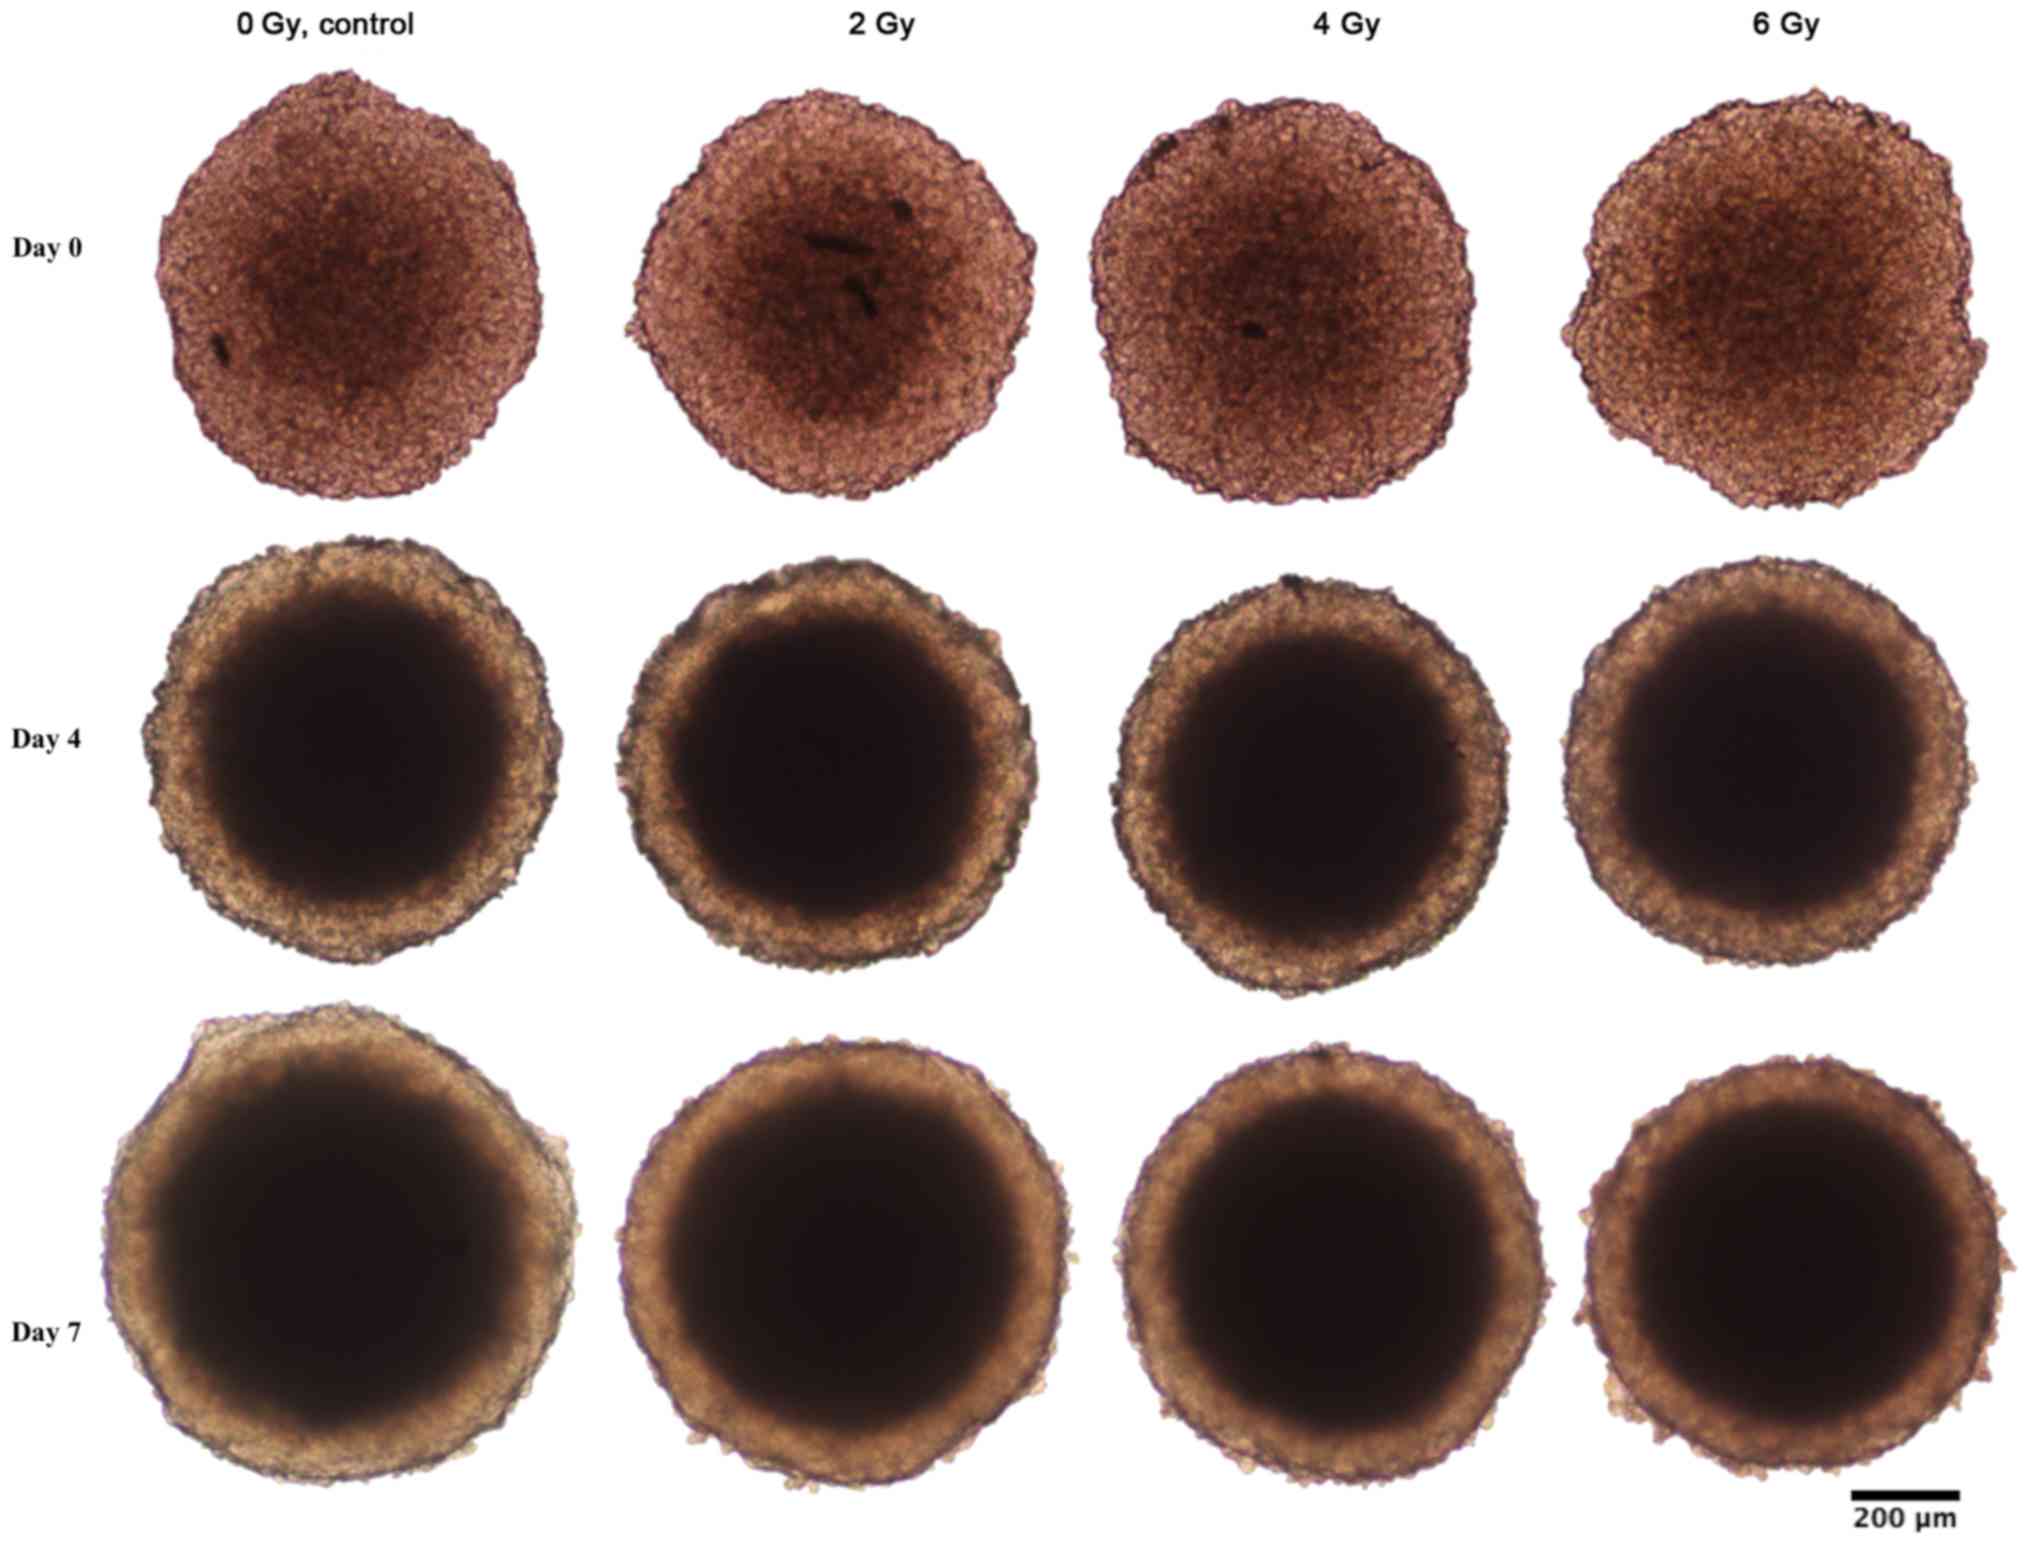
Spheroid growth response to radiation differed
between BON1 and HCT116 spheroids. As seen in Figs. 1–3, and
Table I, BON1 spheroids were less
affected by radiation, both in growth rate and spheroid appearance,
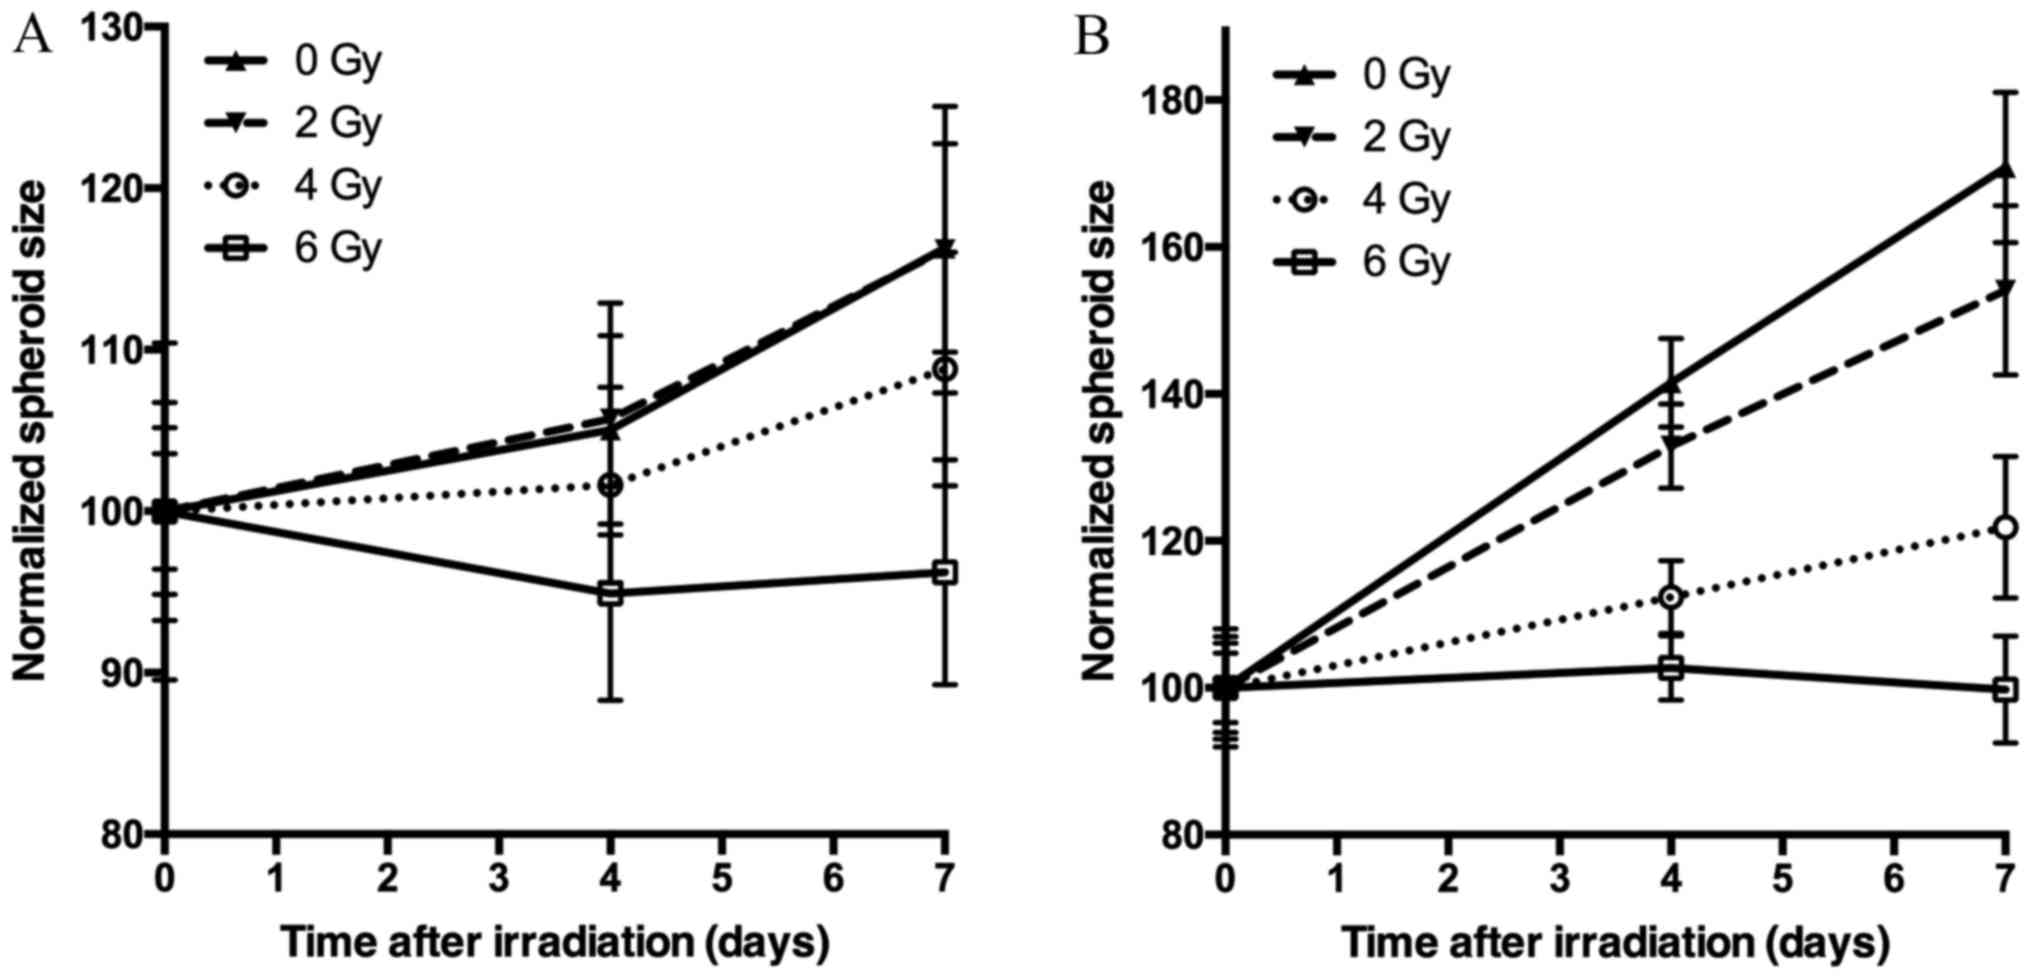
than HCT116 spheroids. Furthermore, for BON1 spheroids the growth
of control (unirradiated) spheroids and 2 Gy irradiated spheroids
did not differ significantly from each other at any assessed time
point (Fig. 3A). Four days after
treatment, 6 Gy irradiated BON1 spheroids differed significantly in
size from both 0 and 2 Gy BON1 spheroids, and seven days after
treatment, all groups of BON1 spheroids differed significantly in
size from each other, with the exception of 0 vs. 2 Gy. The growth
rate of non-irradiated BON1 spheroids was also slower than for
HCT116 spheroids. One week after treatment, unirradiated BON1
spheroids had on average an increased spheroid diameter of 16±6%
(SD), whereas the average increase in diameter was 71±10% for
unirradiated HCT116 spheroids (Fig.
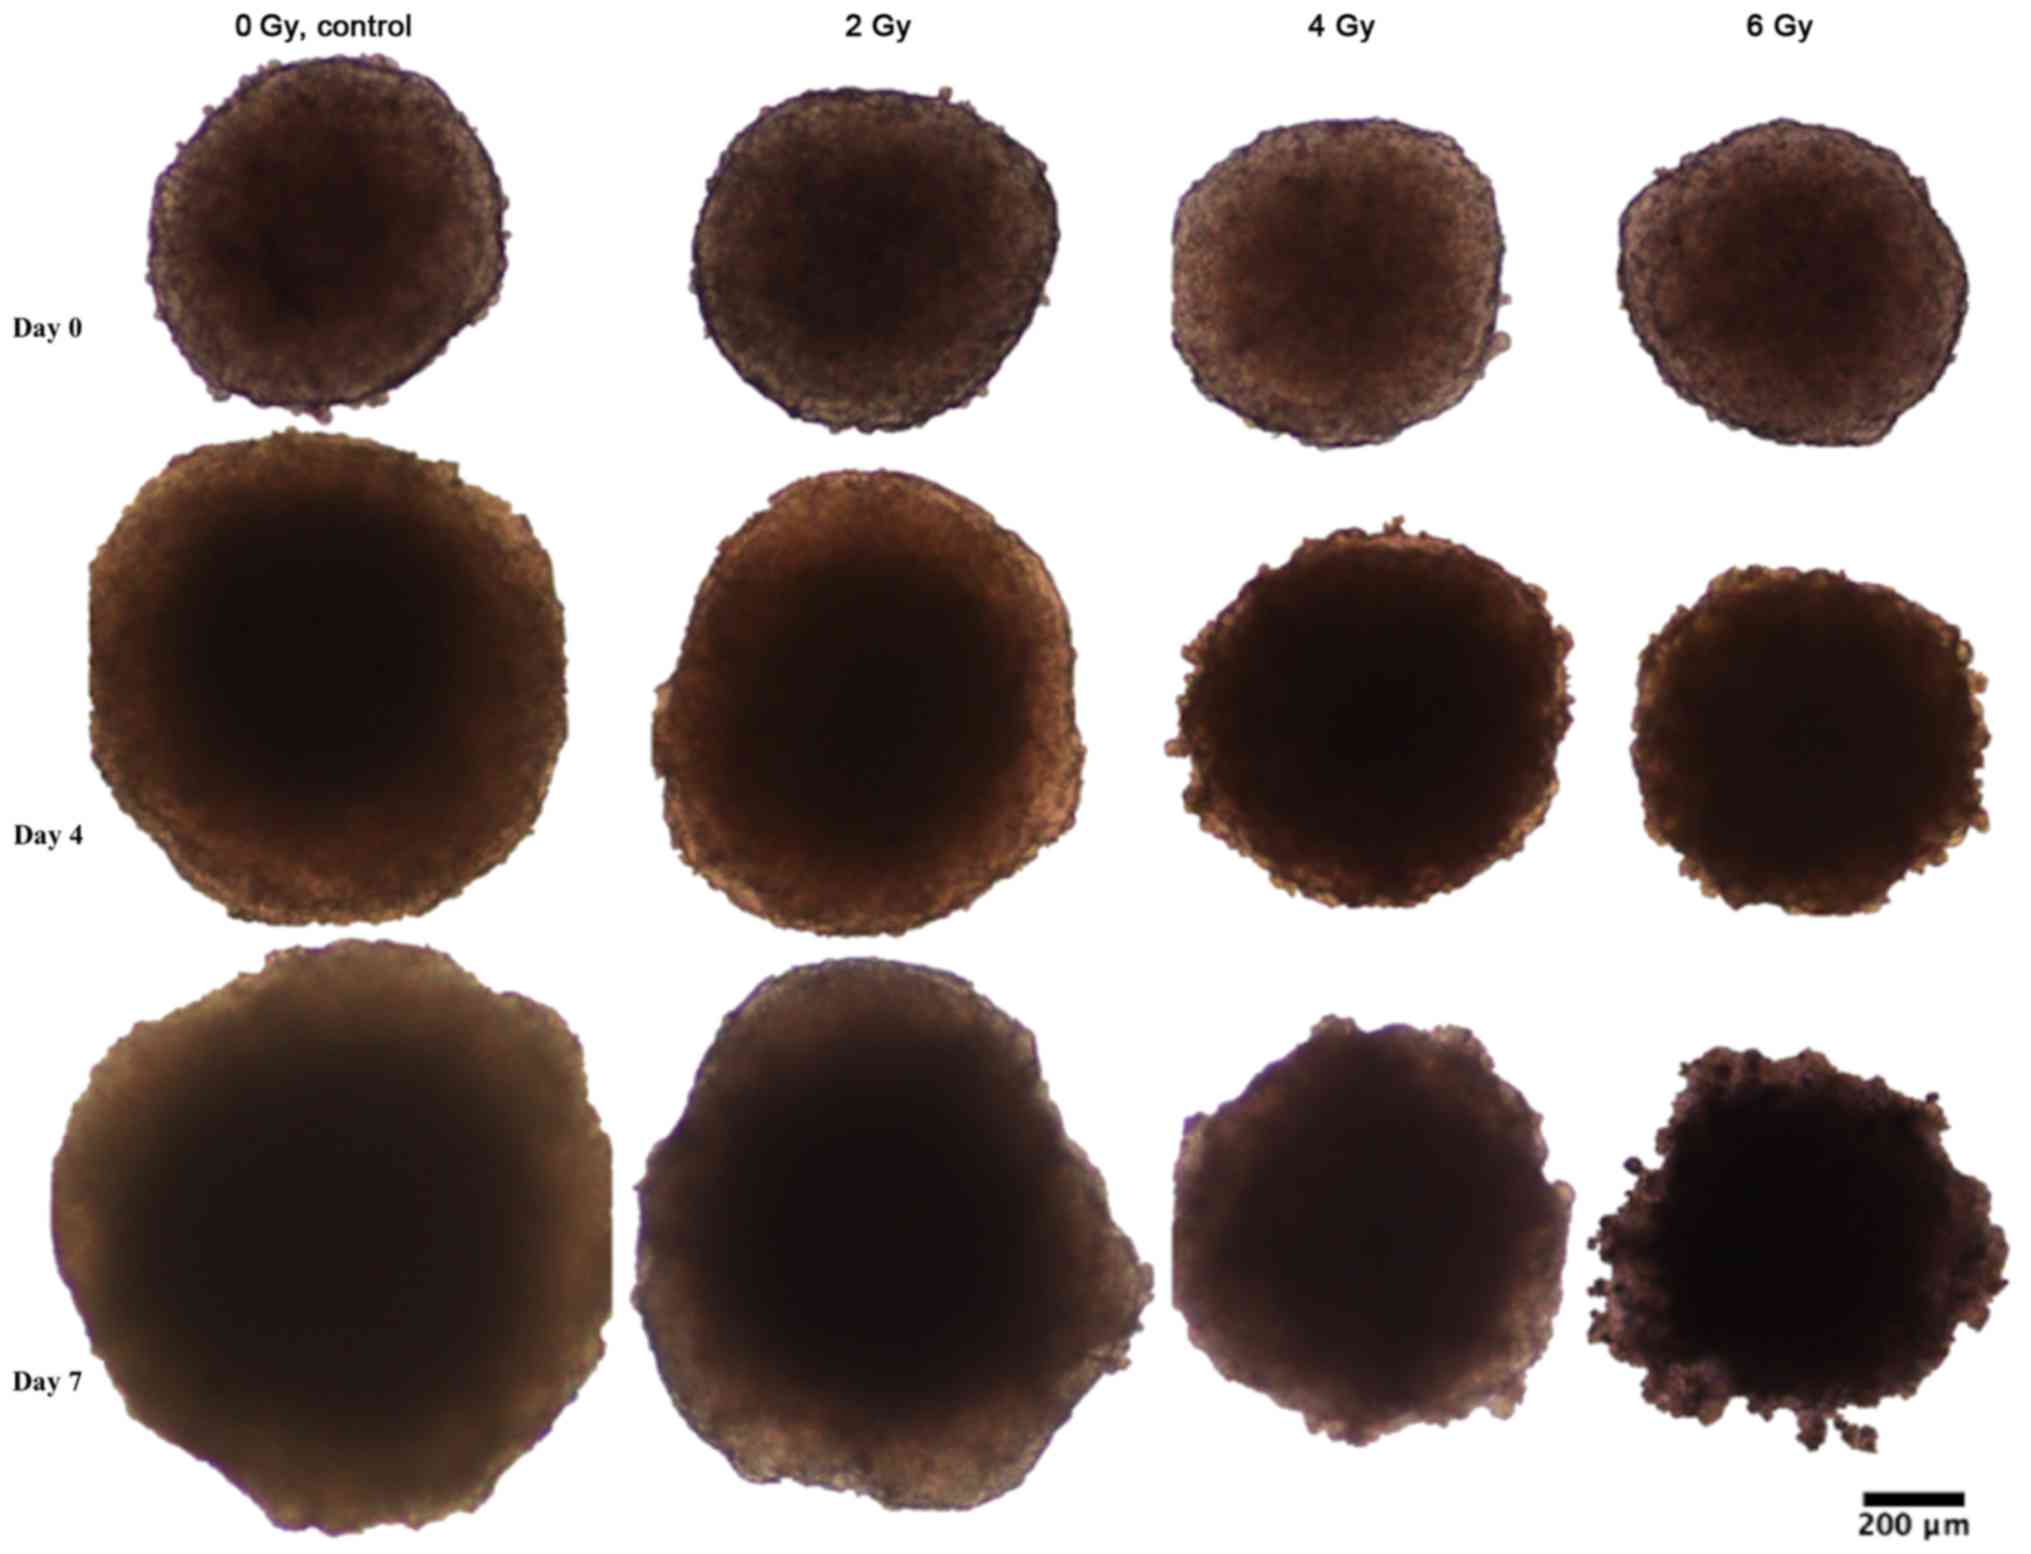
3). As seen in Figs. 1–3, the colonic adenocarcinoma HCT116
spheroids demonstrated a more clear response to radiation in both
reduced growth rate as well as shape of the spheroids, with clear
deformations of the HCT116 spheroids after 6 Gy exposure (Fig. 2) compared to BON1 (Fig. 1). For HCT116 spheroids, all groups
differed significantly in size from each other at both four and
seven days after treatment (Fig.
3B).
 | Table I.Development of average diameters (µm)
over time of BON1 and HCT116 spheroids irradiated with 0, 2, 4, or
6 Gy. |
Table I.
Development of average diameters (µm)
over time of BON1 and HCT116 spheroids irradiated with 0, 2, 4, or
6 Gy.
| A, BON1
spheroids |
|---|
|
|---|
| Time post
treatment | 0 Gy | 2 Gy | 4 Gy | 6 Gy |
|---|
| Average diameter at
day 0 (µm) |
697.99±25 |
669.32±34.5 |
680.55±46.1 |
791.31±82.6 |
| Average diameter at
day 4 (µm) |
733.17±40.8 |
707.68±48.1 |
691.55±41.1 |
750.91±52.4 |
| Average diameter at
day 7 (µm) |
811.67±45.1 |
777.79±59.4 |
740.56±49.1 |
761.48±55.2 |
|
| B, HCT116
spheroids |
|
| Time post
treatment | 0 Gy | 2 Gy | 4 Gy | 6 Gy |
|
| Average diameter at
day 0 (µm) |
484.38±29.6 |
421.59±34.1 |
465.56±32.6 |
469.49±22.4 |
| Average diameter at
day 4 (µm) |
685.39±29.4 |
560.41±24.2 |
523.11±23.1 |
482.15±20.5 |
| Average diameter at
day 7 (µm) |
827.38±49.5 |
649.69±48.6 |
567.29±44.8 |
468.31±34.4 |
IHC stainings
Staining selections
All stainings were carefully evaluated for quality
of staining and sectioning by three of the authors. Only spheroid
sections that were clearly cut at the center of the spheroids were
evaluated, since e.g., sections at the top of a spheroid would
mainly display cells with superior nutrition and oxygen access and
smaller necrotic regions than sections cut through the center of
the spheroids. Consequently, stained central sections from BON1
spheroids irradiated with 0, 2 or 4 Gy, as well as stained central
sections from HCT116 spheroids irradiated with 0, 2 or 6 Gy were
chosen for further evaluations.
General spheroid observations
In general, both spheroid models consisted of a
viable outer cellular layer and central necrosis. In both spheroid
models, different sizes of the necrotic areas could be observed,
with 6 Gy irradiated HCT116 spheroids displaying the smallest
necrotic cores and control HCT116 spheroids having the largest
necrotic cores. Furthermore, necrotic areas in BON1 cells
consisted, to a larger part, of pyknotic cells as compared to
HCT116 spheroids (Figs. 4–6).
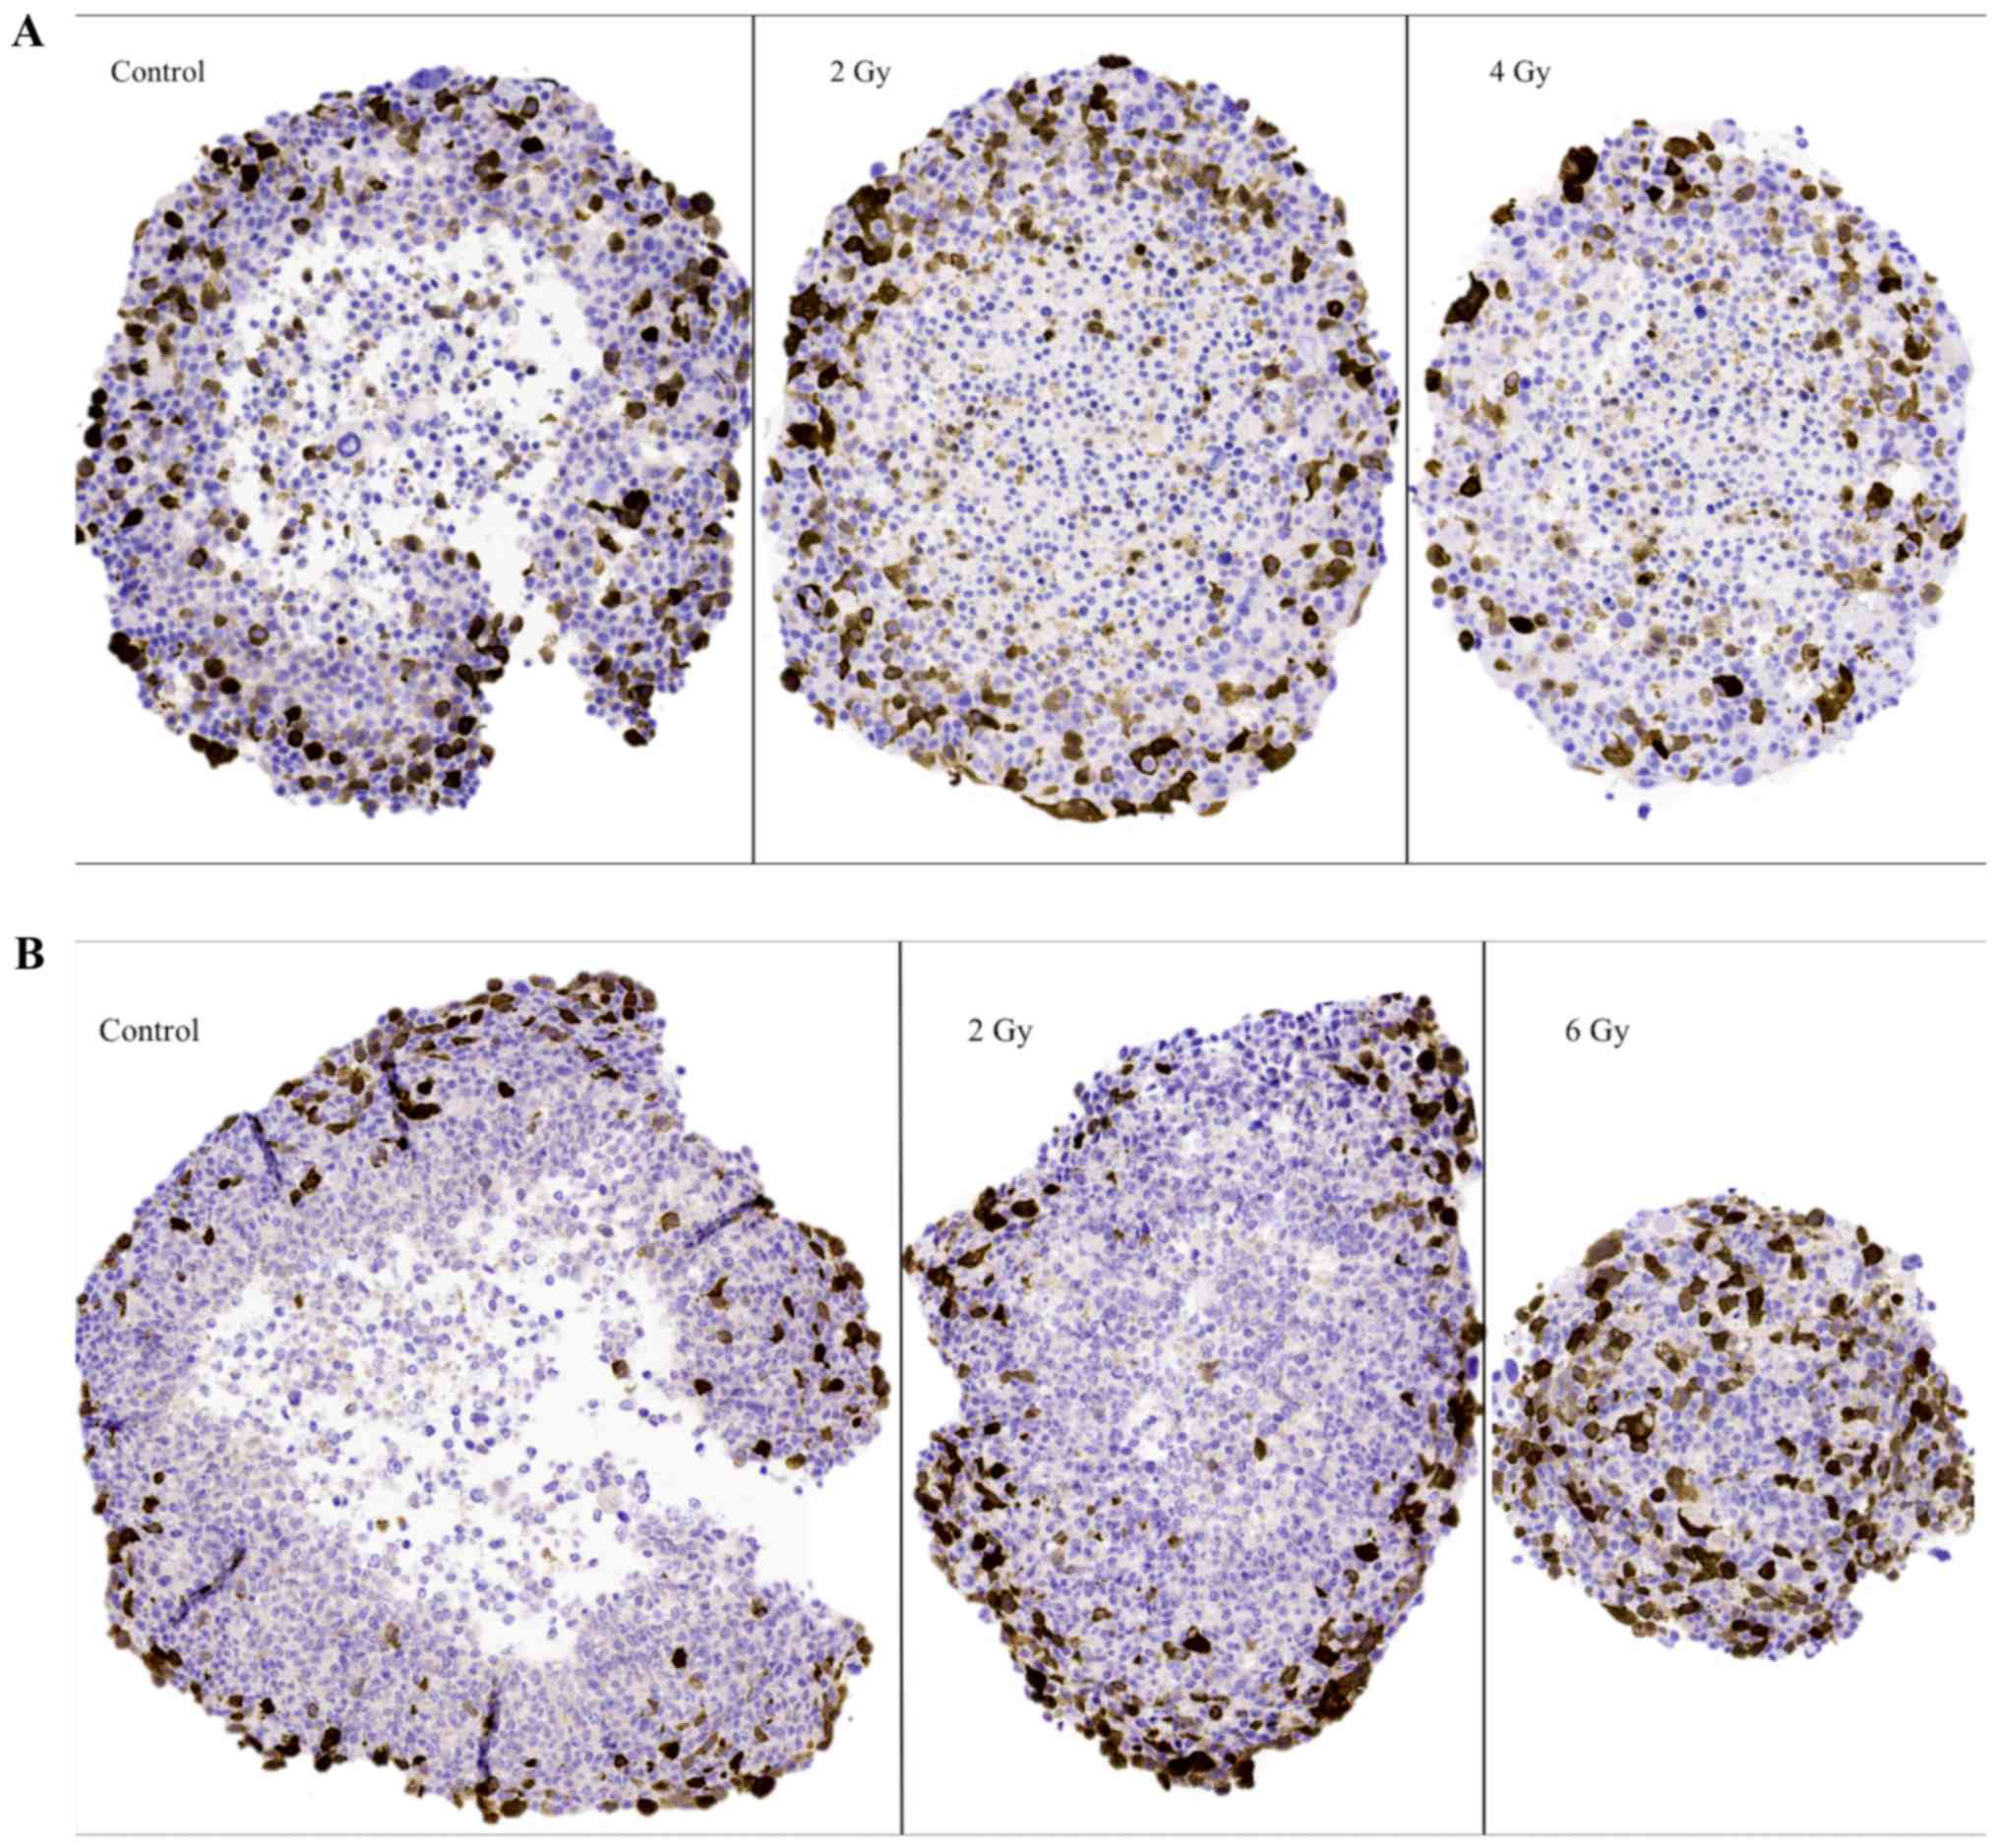
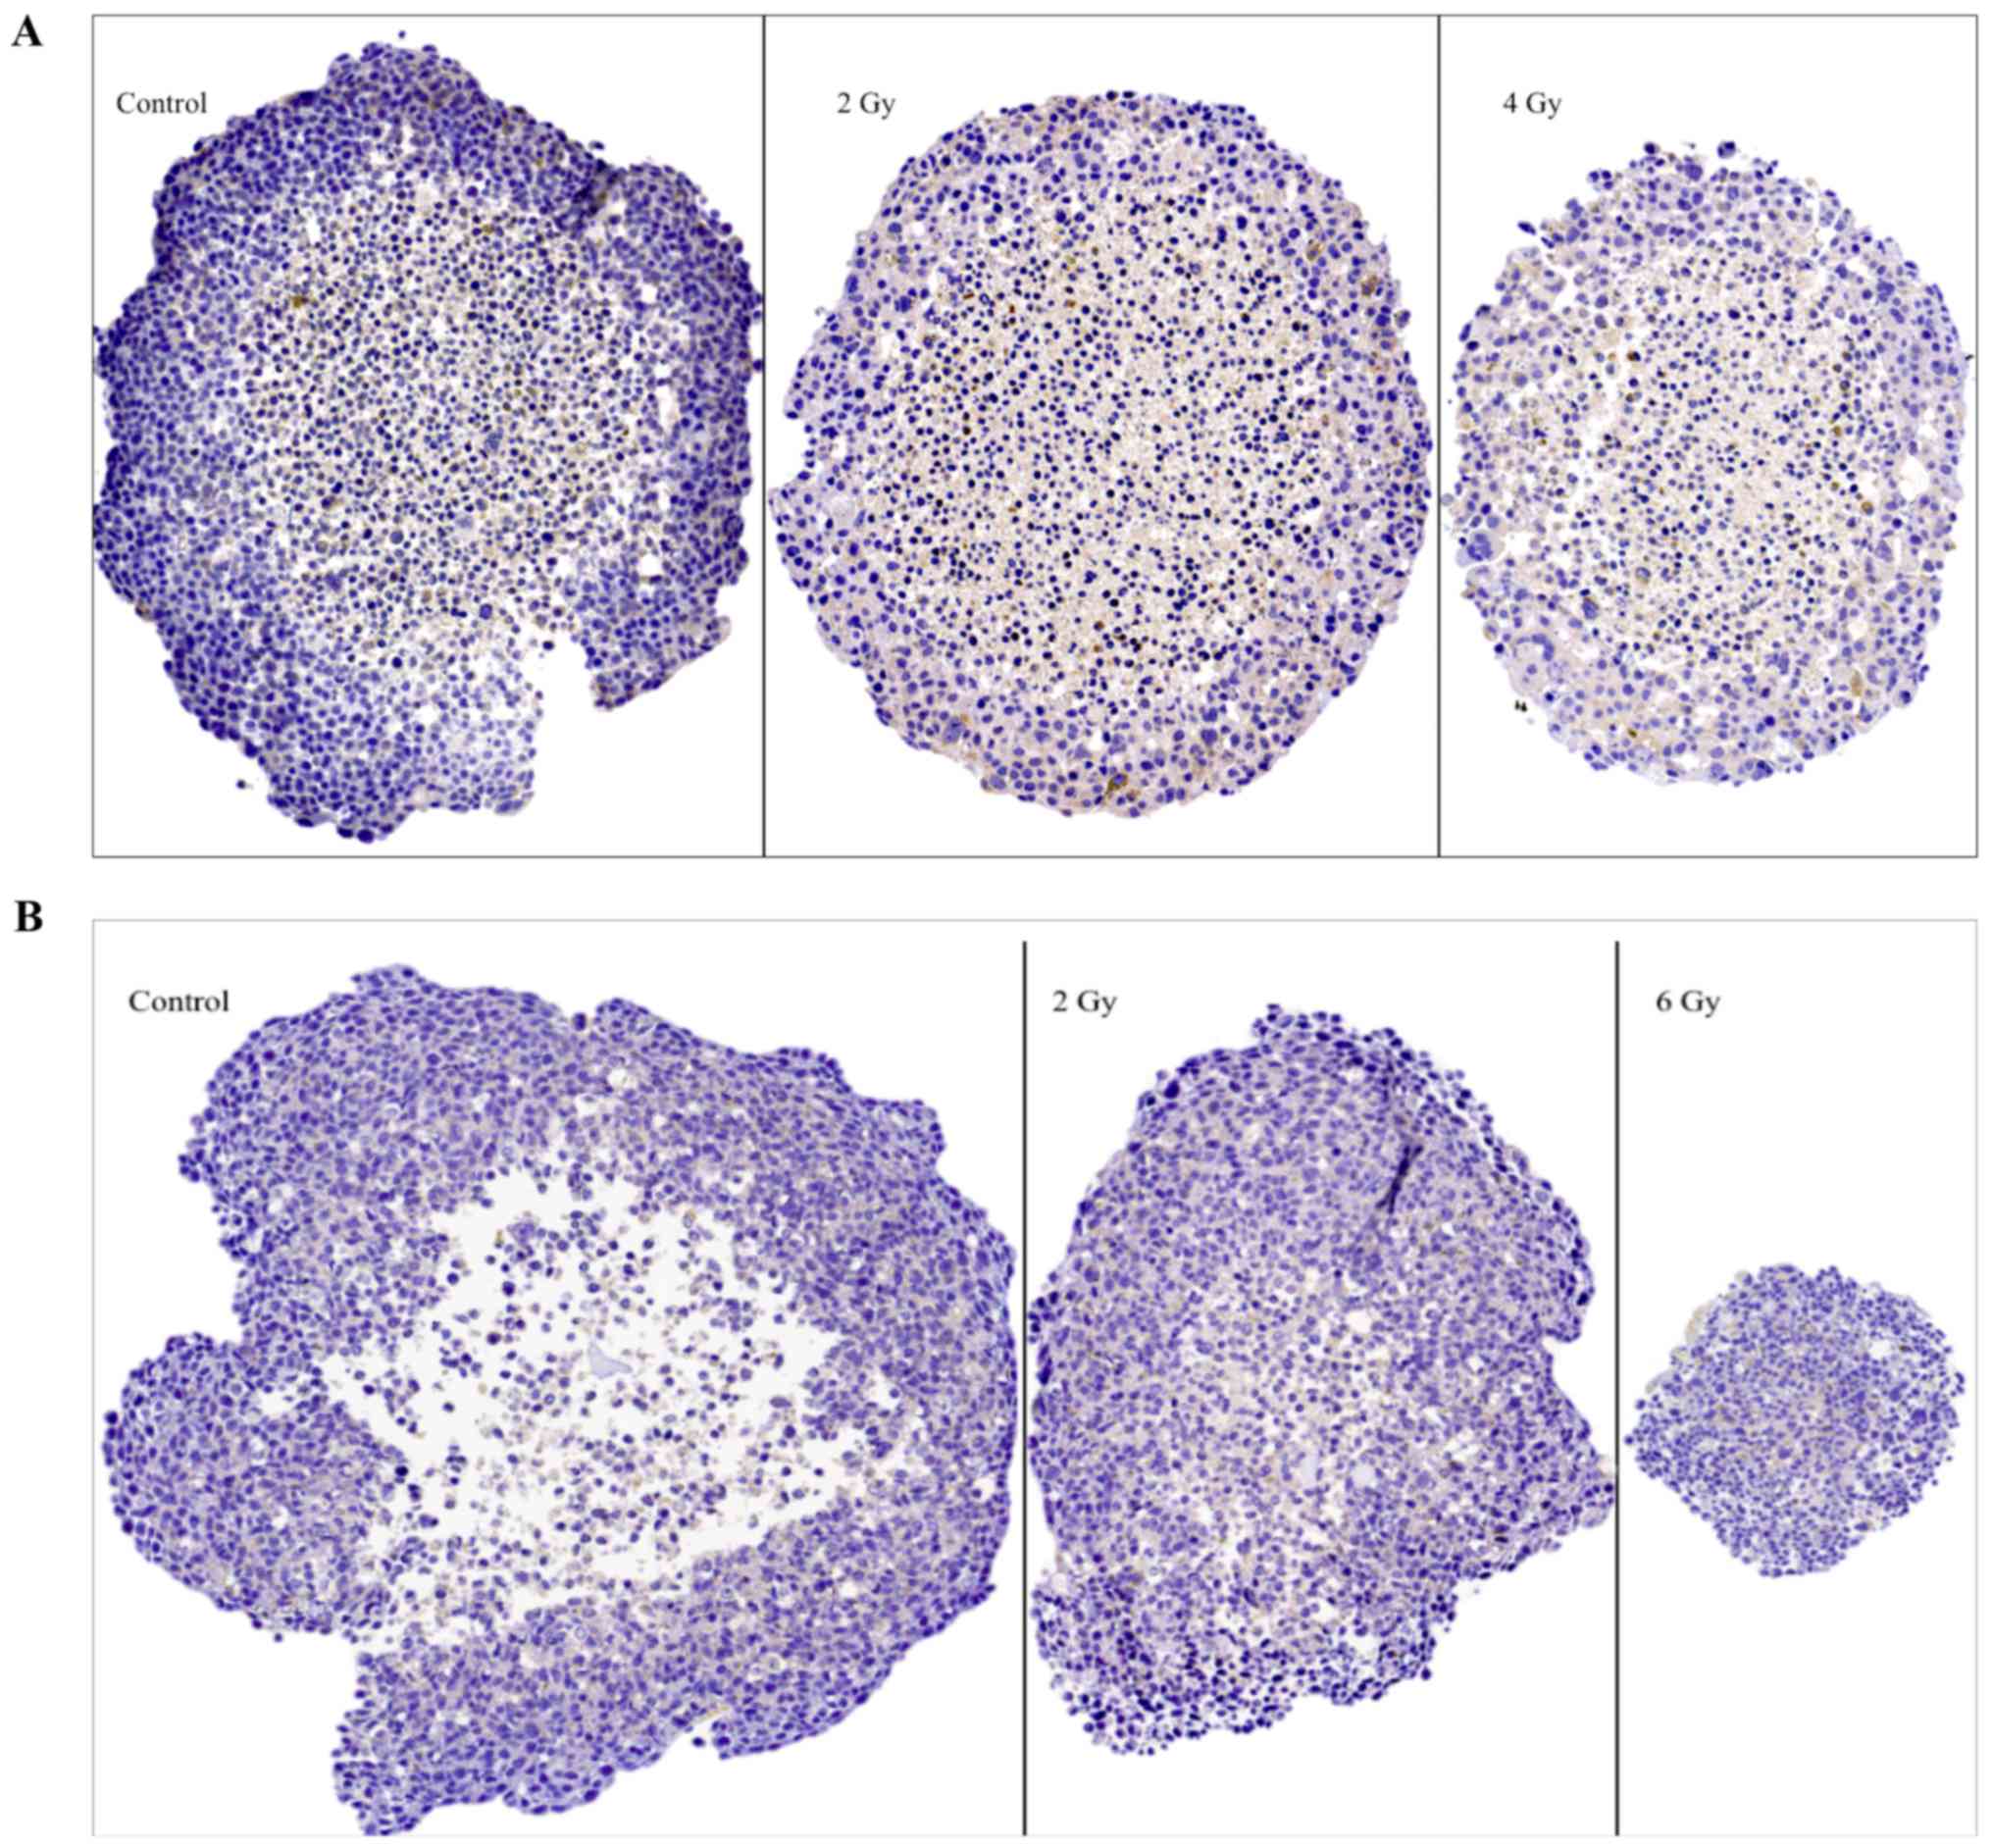
The G2-phase marker (cyclin
B1)
Representative images of cyclin B1 IHC stainings on
sectioned BON1 and HCT116 spheroids can be seen in Fig. 4A and B, respectively, and quantitative
assessments can be seen in Table II.
Stainings for cyclin B1 were mainly observed in the outer viable
P-cell layers. Especially notable were the stainings in the 6 Gy
HCT116 spheroids, where high levels of staining indicated radiation
induced G2-phase arrest. Similar G2-phase
arrest was also indicated after 2 Gy.
| Table II.Semi-automated quantification of IHC
stainings of BON1 and HCT116 spheroids irradiated with 0, 2, 4, or
6 Gy. |
Table II.
Semi-automated quantification of IHC
stainings of BON1 and HCT116 spheroids irradiated with 0, 2, 4, or
6 Gy.
| A, BON1
spheroids |
|---|
|
|---|
| IHC Stain | 0 Gy | 2 Gy | 4 Gy |
|---|
| Cyclin B1-positive
staining (%) |
23.2±3.2 |
20.4±2.6 |
19.7±2.5 |
| Caspase-3-positive
staining (%) |
7.7±1.2 |
11.3±1.8 |
20.1±3.4 |
| β1
galactosidase-positive staining (%) |
18.9±5.9 |
6.7±2.7 |
10.5±1.0 |
|
| B, HCT116
spheroids |
|
| IHC
Stain | 0 Gy | 2 Gy | 6 Gy |
|
| Cyclin B1-positive
staining (%) |
20.1±4.0 |
25.2±1.7 |
39.0±5.8 |
| Caspase-3-positive
staining (%) |
10.8±1.3 |
16.2±0.7 |
40.9±2.5 |
| β1 galactosidase
-positive staining (%) |
17.0±3.6 |
19.5±4.0 |
12.1±1.3 |
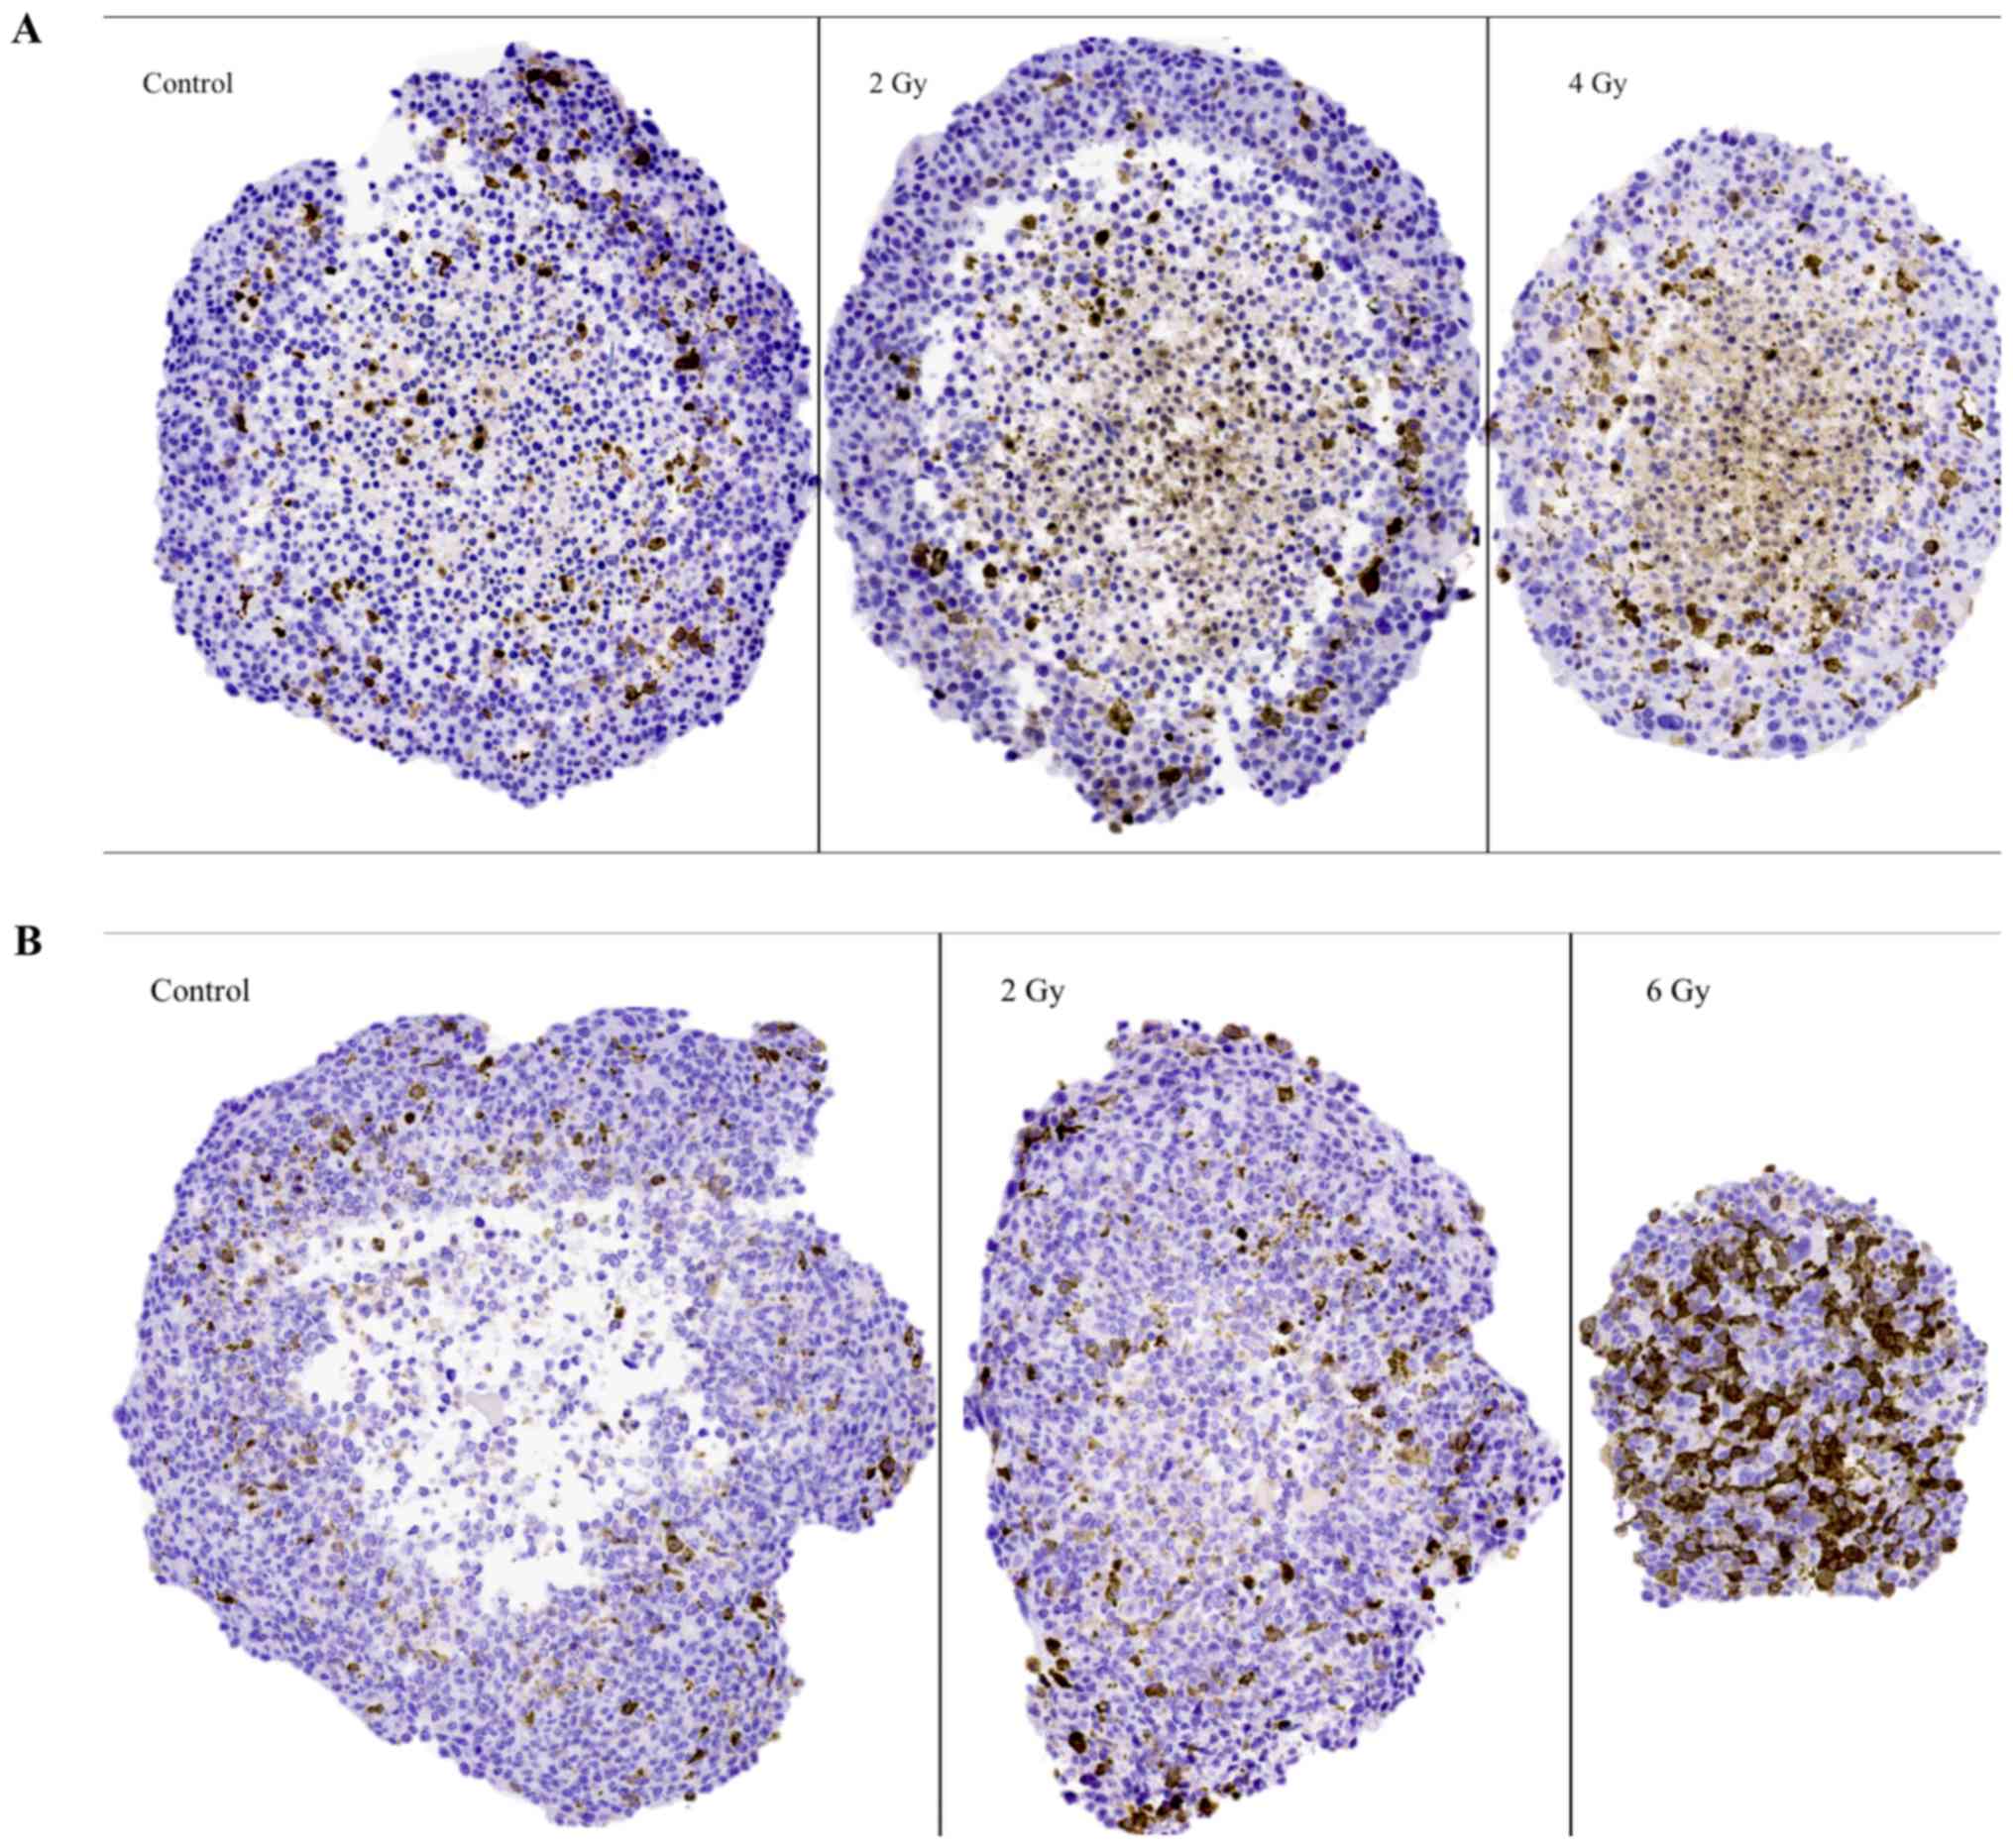
The apoptosis marker (caspase-3)
Representative images of caspase-3 IHC stainings in
sectioned BON1 and HCT116 spheroids can be seen in Fig. 5A and B, and quantitative assessments
can be seen in Table II. In both
spheroid models, increased caspase-3 stainings with increasing
radiation doses was observed. For BON1 spheroids, caspase-3
stainings were mainly observed in the Q-cell layers, compared to
both P- and Q-cell layers in the HCT116 spheroids. Particularly
notable were the strong stainings in the 6 Gy HCT116 spheroids,
evenly distributed throughout the large viable cell layer, similar
to the cyclin B1 stainings described above.
The senescence marker (β1
galactosidase, glb-1)
Representative images of glb-1 IHC stainings on
sectioned BON1 and HCT116 spheroids can be seen in Fig. 6A and B, and quantitative assessments
can be seen in Table II. In both
spheroid models cytoplasmic staining for glb-1 was observed, albeit
with no clear correlation to spheroid irradiation dose.
Discussion
Current understanding of the mechanisms in play
during irradiation of human tumors is somewhat limited due to
differences in proliferation, hypoxia, and nutrition supply in
different tumor regions as well as unpredictable genomic
instability dependent changes. The aim of this study was to
evaluate spheroids for radiobiological responses, exemplified in
spheroids from two tumor types, and to study selected IHC markers
expressed by these spheroids after irradiation. Thus, results from
the IHC stainings in this study should be viewed as descriptive, to
be followed by larger cohorts and more markers over time. To the
best of our knowledge, there are few radiobiological studies that
examine the impact of radiation on various IHC-detected molecular
structures in various multicellular human spheroids. As a result,
only limited comparative data currently exists in the
literature.
Spheroid growth analysis revealed pancreatic
neuroendocrine BON1 spheroids to be more slowly growing and less
affected by radiation compared to colonic adenocarcinoma HCT116
spheroids (Figs. 1–3; Table I).
Whereas BON1 spheroids kept the smooth spheroid appearance after
irradiation, HCT116 spheroids were clearly deformed in a time- and
dose dependent manner (Figs. 1 and
2). Interestingly, the original
reasoning behind comparing BON1 and HCT116 spheroids was due to
their difference in doubling time in both monolayer and 3D
cultures. From a clinical perspective, pancreatic neuroendocrine
tumors are often considered slow growing and more radioresistant
than other cancer types, including colonic adenocarcinoma. The
radiosensitivity of HCT116 has been thoroughly investigated and
represents as a fairly radiosensitive cell line, making the
comparison to the more radioresistant BON1 cell line relevant
(15–17). One potential explanation for the
different radiosensitivities observed for the two spheroid models
could be that the slow growing spheroids harbor a lower percentage
of cells in radiosensitive cell cycle phases, such as the M-phase
and G2-phase, at the time of irradiation, which could
result in a greater therapeutic effect of radiation (18). Furthermore, when examining spheroid
sections (Figs. 4–6), it could be noted that the less
radiosensitive BON1 spheroids displayed approximately the same
proportions of viable outer cell layers and necrotic cores after
the applied radiation doses. For HCT116 spheroids however, the
large unirradiated control HCT116 spheroids consisted of large
necrotic areas while the 6 Gy irradiated spheroids were small
(<500 µm diameter) with nearly no visible necrotic area. This is
in line with previous studies, demonstrating that larger spheroids
result in larger necrotic areas and that spheroids often have to
reach a size of more than 500 µm in diameter to develop a necrotic
core (4,19). Thus, the 6 Gy irradiated HCT116
spheroids were not expected to have a necrotic core.
The G2-stainings using cyclin B1 are
expected to reflect viability, proliferation and
G2-phase arrest after irradiation. The
G2-stainings were predominantly distributed in the
viable cell layers in both spheroid models (Fig. 4; Table
II). For BON1 spheroids, the extent of stainings did not vary
with irradiation exposure. In the more radiosensitive
HCT116-spheroids however, stainings increased with radiation dose,
with 6 Gy spheroids demonstrating significantly increased stainings
from both 2 and 0 Gy spheroids (Table
II). Variations in G2-stainings after irradiation
could indicate radiation-induced G2-arrest and/or
regeneration of surviving cells (20). A possible explanation for the abundant
G2-stainings in 6 Gy irradiated HCT116 spheroids could be that the
small size of these spheroids allows nutrients and oxygen to reach
a larger cell population, and thus even the cells in the central
areas of these spheroids, can express a G2-related
signal. However, in order to verify radiation-induced
G2-arrest, further experiments using methods such as
flow cytometry, are planned in future studies.
Stainings of high intensity with the apoptosis
marker caspase-3 were predominantly found in the viable cell layers
for both spheroid models (Fig. 5;
Table II). This could possibly
indicate that G2-arrest may initiate apoptotic processes
but this has to be analyzed in more detail through additional
detection methods (i.e., flow cytometry and western blot analysis)
in future studies. Furthermore, significantly increased apoptotic
staining with increasing radiation doses was observed in both
spheroid models. Especially notable was the strong staining in the
6 Gy HCT116 spheroids, which was evenly distributed throughout the
large viable cell layer. Radiation induced apoptosis has previously
been described in human breast cancer spheroids, demonstrating
similar patterns (21).
The spheroids were also stained for senescence using
the marker glb-1 (β1 galactosidase) (22,23)
(Fig. 6; Table II). According to literature,
irradiation can cause cells to pass into senescence by alterations
in certain metabolic mechanisms (24). However, in both spheroid models no
clear correlation between stainings for glb-1 and irradiation could
be observed at the assessed time point. Lack of senescence might be
expected since it is known that malignant cells often have infinite
life spans, whereas detected glb-1 stainings may also be related to
apoptotic processes exposing senescence epitopes. This has to be
analyzed in more detail in further studies.
In conclusion, the 3D in vitro human tumor
spheroids assessed in this study presented distinct responses to
radiation, both regarding spheroid growth and appearance as well as
responses on the molecular level. The pancreatic neuroendocrine
BON1 spheroids were, during the current observation period, less
radiosensitive than the colonic adenocarcinoma HCT116 spheroids.
IHC analyses for radiation induced G2-phase and
apoptotic changes demonstrated different staining patterns between
the two models, as well as between unirradiated and irradiated
spheroids. Thus, the results indicate feasibility to use spheroids
of human origin in combination with IHC analyses to unravel
radiobiological responses on the molecular level. The results also
inspire to further investigations, including other relevant
IHC-detectable molecular processes such as changes in intracellular
MAPK signal transduction and radiation induced DNA damage and
repair, both in time- and radiation dose-dependent settings,
offering a deeper knowledge of radiation effects.
Acknowledgements
The authors would like to thank Diana Spiegelberg
for help with IHC quantifications, Christina Atterby for help with
spheroid assays and Tor Halle for IHC stainings.
References
|
1
|
Birgersdotter A, Sandberg R and Ernberg I:
Gene expression perturbation in vitro-a growing case for
three-dimensional (3D) culture systems. Semin Cancer Biol.
15:405–412. 2005. View Article : Google Scholar : PubMed/NCBI
|
|
2
|
Nelson CM and Bissell MJ: Modeling dynamic
reciprocity: Engineering three-dimensional culture models of breast
architecture, function and neoplastic transformation. Semin in
Cancer Biol. 15:342–352. 2005. View Article : Google Scholar
|
|
3
|
Inch WR, Credie JA and Sutherland RM:
Growth of nodular carcinomas in rodents compared with multi-cell
spheroids in tissue culture. Growth. 34:271–282. 1970.PubMed/NCBI
|
|
4
|
Gong X, Lin C, Cheng J, Su J, Zhao H, Liu
T, Wen X and Zhao P: Generation of multicellular tumor spheroids
with microwell-based agarose scaffolds for drug testing. PLoS One.
10:e01303482015. View Article : Google Scholar : PubMed/NCBI
|
|
5
|
Lao Z, Kelly CJ, Yang XY, Jenkins WT,
Toorens E, Ganguly T, Evans SM and Koch CJ: Improved methods to
generate spheroid cultures from tumor cells, tumor cells &
fibroblasts or tumor-fragments: Microenvironment, microvesicles and
MiRNA. PLoS One. 10:e01338952015. View Article : Google Scholar : PubMed/NCBI
|
|
6
|
Hirschhaeuser F, Menne H, Dittfeld C, West
J, Mueller-Klieser W and Kunz-Schughart LA: Multicellular tumor
spheroids: An underestimated tool is catching up again. J
Biotechnol. 148:3–15. 2010. View Article : Google Scholar : PubMed/NCBI
|
|
7
|
Nederman T, Norling B, Glimelius B,
Carlsson J and Brunk U: Demonstration of an extracellular matrix in
multicellular tumor spheroids. Cancer Res. 44:3090–3097.
1984.PubMed/NCBI
|
|
8
|
Helmut A and Carlsson J: The
micrenvironment in multicellular spheroidsSpheroid Culture in
Cancer Research. Bjerkvig R: CRC Press; London: pp. 135–156.
1992
|
|
9
|
Mayer B, Klement G, Kaneko M, Man S, Jothy
S, Rak J and Kerbel RS: Multicellular gastric cancer spheroids
recapitulate growth pattern and differentiation phenotype of human
gastric carcinomas. Gastroenterology. 121:839–852. 2001. View Article : Google Scholar : PubMed/NCBI
|
|
10
|
Baharvand H, Hashemi SM, Kazemi Ashtiani S
and Farrokhi A: Differentiation of human embryonic stem cells into
hepatocytes in 2D and 3D culture systems in vitro. Int J Dev Biol.
50:645–652. 2006. View Article : Google Scholar : PubMed/NCBI
|
|
11
|
Dubessy C, Merlin JM, Marchal C and
Guillemin F: Spheroids in radiobiology and photodynamic therapy.
Crit Rev Oncol Hematol. 36:179–192. 2000. View Article : Google Scholar : PubMed/NCBI
|
|
12
|
Awwad KH: Radiation Oncology:
Radiobiological and Physiological PerspectivesThe boundary-zone
between clinical radiotherapy and fundamental radiobiological and
physiology. 1st. Kluwer Academic Publishers; Egypt: 1990
|
|
13
|
Ivascu A and Kubbies M: Rapid Generation
of single-tumor spheroids for high-throughput cell function and
toxicity analysis. J Biomol Screen. 11:922–932. 2006. View Article : Google Scholar : PubMed/NCBI
|
|
14
|
Höpfner M, Sutter AP, Gerst B, Zeitz M and
Scherübl H: A novel approach in the treatment of neuroendocrine
gastrointestinal tumours. Targeting the epidermal growth factor
receptor by gefitinib (ZD1839). Br J Cancer. 89:1766–1775. 2003.
View Article : Google Scholar : PubMed/NCBI
|
|
15
|
Ludmir EB, McCall SJ, Czito BG and Palta
M: Radiosensitive orbital metastasis as presentation of occult
colonic adenocarcinoma. BMJ Case Rep. 2014:bcr20142064072014.
View Article : Google Scholar : PubMed/NCBI
|
|
16
|
Hallet J, How C, Law L, Cukier M, Saskin R
and Liu N: Exploring the rising incidence of neuroendocrine tumors:
A population-based analysis of epidemiology, metastatic
presentation and outcomes. Cancer. 121:589–597. 2015. View Article : Google Scholar : PubMed/NCBI
|
|
17
|
Kim JH, Hyun CL and Han SH: Intramedullary
spinal cord metastasis from pancreatic neuroendocrine tumor. World
J Gastroenterol. 20:14063–14067. 2014. View Article : Google Scholar : PubMed/NCBI
|
|
18
|
Pawlik TM and Keyomarsi K: Role of cell
cycle in mediating sensitivity to radiotherapy. Int J Radiat Oncol
Biol Phys. 59:928–942. 2004. View Article : Google Scholar : PubMed/NCBI
|
|
19
|
Groebe K and Muller-Klieser W: On the
relation between size of necrosis and diameter of tumor spheroids.
Int J Radiat Oncol Biol. Phys. 34:395–401. 1996.
|
|
20
|
Kaida A and Miura M: Biochemical and
biophysical research communications visualizing the effect of tumor
microenvironments on radiation-induced cell kinetics in
multicellular spheroids consisting of HeLa cells. Biochem Biophys
Res Commun. 439:453–458. 2013. View Article : Google Scholar : PubMed/NCBI
|
|
21
|
Qvarnström OF, Simonsson M, Eriksson V,
Turesson I and Carlsson J: γH2AX and cleaved PARP-1 as apoptotic
markers in irradiated breast cancer BT474 cellular spheroid. Int J
Oncol. 35:41–47. 2009. View Article : Google Scholar : PubMed/NCBI
|
|
22
|
Bernardes de Jesus B and Blasco MA:
Assessing cell and organ senescence biomarkers. Circ Res.
111:97–109. 2012. View Article : Google Scholar : PubMed/NCBI
|
|
23
|
Wagner J, Damaschke N, Yang B, Truong M,
Guenther C, McCormick J, Huang W and Jarrard D: Overexpression of
the novel senescence marker β-galactosidase (GLB1) in prostate
cancer predicts reduced PSA recurrence. PLoS One. 10:e01243662015.
View Article : Google Scholar : PubMed/NCBI
|
|
24
|
Liao EC, Hsu YT, Chuah QY, Lee YJ, Hu JY,
Huang TC, Yang PM and Chiu SJ: Radiation induces senescence and a
bystander effect through metabolic alterations. Cell death Dis.
5:e12552014. View Article : Google Scholar : PubMed/NCBI
|