Introduction
Gallbladder carcinoma (GBC) is a relatively rare,
yet highly lethal neoplasm of the digestive tract. The most common
histotype of GBC is adenocarcinoma (AC), while squamous cell
carcinoma (SCC) and adenosquamous cell carcinoma (ASC) are
relatively rare entities, accounting for 1.4–10.6% of all GBC cases
(1). The biological and
clinicopathological characteristics of SCC and ASC of the
gallbladder are not well-characterized owing to their low
incidence. Squamous metaplasia of the gallbladder mucosa or of the
pluripotent basal cells in the gallbladder mucus membrane in
response to chronic inflammation caused by gallstones has been
suggested as the initial event in tumorigenesis (2–4). In
addition, another study observed that SCC and ASC of the
gallbladder may result from the exposure to certain carcinogens,
including cholanthrene and methylanthracene (5). In addition, the histomorphology and
biological characteristics of SCC and ASC differ from those of AC,
in that the former two types of cancer exhibit a greater
proliferation capacity and aggressive invasion of anatomically
contiguous structures, while demonstrating a lower propensity for
distant metastasis and involvement of regional lymph nodes
(6). Notably, there are no detectable
symptoms in the early stages of SCC and ASC of the gallbladder,
with the exception of right upper abdominal pain and discomfort
(7). The clinical outcomes of
surgical resection in patients with advanced SCC or ASC of the
gallbladder are typically poor (8).
Therefore, early diagnosis and radical surgery may significantly
improve the prognosis of these patients.
Prothymosin-α (PTMA), a member of the α-thymosin
family, is a transcription factor that consists of 110
highly-conserved acidic amino acids in mammalian cells (9). Previous studies have indicated that PTMA
may be associated with cell proliferation, apoptosis and the
regulation of cell cycle progression in tumor cells (10,11). In
addition, abnormal expression of PTMA has been reported in several
malignant tumors, including gastric, colorectal and thyroid cancer,
and upper urinary tract transitional cell carcinoma (12–15).
Similarly, parathymosin (PTMS) is another homologue of PTMA
(16,17), which was first isolated from the mouse
thymus in 1985 (18) and was found to
promote cell proliferation by downregulating the level of
glucocorticoids (19). PTMA has been
demonstrated to be associated with RNA synthesis and processing,
while PTMS is involved in early DNA replication (20). Furthermore, the expression levels of
PTMA and PTMS were reported to be closely correlated with malignant
growth, metastasis and prognosis in the context of several tumors
(19). Thus, it is hypothesized that
high expression levels of PTMA and PTMS may be useful as potential
prognostic biomarkers in patients with SCC and ASC of the
gallbladder.
PTMA and PTMS are known to be involved in DNA
transcription and replication, respectively. Previous studies have
indicated the positive expression levels of PTMA/PTMS in gastric
adenocarcinoma (14), colorectal
cancer (15), and human upper urinary
tract transitional cell carcinoma (12), and their expression levels have been
demonstrated to be associated with tumor migration, tumor
malignancy, and prognosis. However, the expression levels of
PTMA/PTMS were still unknown in gallbaladder carcinoma. In this
present study, the association between PTMA/PTMS expression and the
prognosis in SCC/ASC and AC of the gallbladder was
investigated.
Materials and methods
Patients
In the present study, patients with SCC and ASC were
treated as a single experimental group since SCC and ASC are the
minor types of GBC. A total of 46 patients with SCC or ASC of the
gallbladder who were hospitalized between January 1995 and December
2009 were included into the present study. These 46 cases accounted
for 4.34% of the total of 1,060 patients with GBC admitted to the
Second Xiangya Hospital of Central South University (16/370;
Changsha, China), the Xiangya Hospital of Central South University
(14/325; Changsha, China), the Third Xiangya Hospital of Central
South University (5/110; Changsha, China), the Hunan Provincial
People's Hospital, The First Affiliated Hospital of Hunan Normal
University (5/105; Changsha, China), The Hunan Cancer Hospital, The
Affiliated Cancer Hospital of Xiangya School of Medicine, Central
South University (4/100; Changsha, China), the Central Hospital of
Changde (1/50; Changde, China) and the Central Hospital of Loudi
(1/50; Loudi, China). The inclusion criterion was patients
pathologically diagnosed with ACC, ASC, and SCC, whereas the
exclusion criterion was patients pathologically diagnosed with
neither GBC nor other types of ACC/ASC/SCC (21). All of the tumor samples were obtained
by intraopherative biopsy, and none of the patients received any
other treatment.
In addition, the pathological specimens of 80
patients with AC of the gallbladder, who received surgical
treatment at the Second Xiangya Hospital of Central South
University and the Central Hospital of Loudi between January 2000
and December 2009, were included in the present study. The clinical
features of the selected patient samples, including the age, sex,
histopathological subtype, TNM stage, lymph node invasion, distant
metastasis, resection methods, tumor stages and survival rates, in
the SCC/ASC and AC groups were embedded in paraffin and
pathologically analyzed (Table I)
(22,23). The present retrospective study was
approved by the Medical Ethics Committee of Second Xiangya Hospital
of Central South University. All the patients signed a written
informed consent form prior to participation.
 | Table I.Clinicopathological characteristics of
patients with SCC/ASC and AC of the gallbladder. |
Table I.
Clinicopathological characteristics of
patients with SCC/ASC and AC of the gallbladder.
| Characteristic | SCC/ASC (n=46),
% | AC (n=80), % | χ2 | P-value |
|---|
| Sex |
|
| 0.986 | 0.352 |
| Male | 19 (41.3) | 26 (32.5) |
|
|
|
Female | 27 (58.7) | 54 (67.5) |
|
|
| Age |
|
| 4.143 | 0.042 |
| ≤45
years | 3 (6.5) | 16 (20.0) |
|
|
| >45
years | 43 (93.5) | 64 (80.0) |
|
|
| Differentiation |
|
| 8.515 | 0.014 |
|
Well-differentiated | 16 (34.8) | 27 (33.8) |
|
|
|
Moderately differentiated | 24 (52.2) | 25 (31.3) |
|
|
| Poorly
differentiated | 6 (13.0) | 28 (35.0) |
|
|
| Tumor diameter |
|
| 4.280 | 0.039 |
| ≤3
cm | 20 (43.5) | 50 (62.5) |
|
|
| >3
cm | 26 (56.5) | 30 (37.5) |
|
|
| Gallstones |
|
| 2.093 | 0.148 |
|
Negative | 18 (39.1) | 42 (52.5) |
|
|
|
Positive | 28 (60.9) | 38 (47.5) |
|
|
| TNM stages |
|
| 0.287 | 0.866 |
| I/II | 12 (26.1) | 21 (26.3) |
|
|
| III | 20 (33.5) | 38 (47.5) |
|
|
| IV | 14 (30.4) | 21 (26.3) |
|
|
| Lymph node
invasion |
|
| 0.004 | 0.952 |
|
Negative | 17 (37.0) | 30 (37.5) |
|
|
|
Positive | 29 (63.0) | 50 (62.5) |
|
|
| Invasion of
adjacent organs |
|
| 0.197 | 0.658 |
|
Negative | 16 (34.8) | 31 (38.8) |
|
|
|
Positive | 30 (62.5) | 49 (61.3) |
|
|
| Resection |
|
| 0.215 | 0.898 |
|
Curative resection | 14 (30.4) | 26 (32.5) |
|
|
|
Non-curative resection | 18 (39.1) | 28 (35.0) |
|
|
| No
resection | 14 (30.4) | 26 (32.5) |
|
|
| Survival period,
months | 10.07 (4–25) | 10.34 (3–27) | 0.014 | 0.906 |
| Prothymosin-α |
|
| 0.147 | 0.724 |
| − | 24 (52.2) | 33 (41.2) |
|
|
| + | 22 (47.8) | 47 (58.8) |
|
|
| Parathymosin |
|
| 1.100 | 0.321 |
| − | 24 (52.2) | 34 (42.5) |
|
|
| + | 22 (47.8) | 46 (57.5) |
|
|
Immunohistochemical analysis
Immunohistochemical examination to determine the
PTMA and PTMS expression levels was performed with the standard
protocol recommended for the EnVision™ Detection kit (Dako; Agilent
Technologies, Inc., Glostrup, Denmark). Briefly, fresh pathological
specimens were fixed in formalin, embedded in paraffin and
sectioned at 3 µm thick. Next, the sections were incubated with
anti-PTMA or anti-PTMA polyclonal antibody (1:200; ALS12216 and
AT3490a; both purchased from Abgent, Inc., San Diego, CA, USA) for
2 hrs at 37°C, followed by visualization with DAB. Subsequent to
dehydration and mounting of the specimens, the areas stained with
PTMA or PTMA (appearing as brown spots) were reviewed and scored
under a light microscope. The proportion of positively stained
cells was counted at ×400 magnification. Specimens with >25% of
positive cells were regarded as positive cases, whereas those with
<25% positive cells were regarded as negative cases.
Statistical analysis
Statistical analysis was conducted with SPSS
software (version 13 for Windows; SPSS Inc., Chicago, IL, USA).
Data are presented as frequencies or as the mean ± standard error
of the mean. Clinical variables were compared by χ2 test
or Fisher's exact test. Survival curves were prepared with the
Kaplan-Meier method and compared statistically by the log-rank
test. Cox proportional hazards model was used for multivariate
analysis. A value of P<0.05 was regarded to indicate a
statistically significant difference. Data from patients who
succumbed to the disease, or changed their home address or contact
information was censored.
Results
Clinicopathological characteristics of
patients with SCC/ASC and AC
The clinicopathological characteristics of 46
patients with ASC (n=20) or SCC (n=26) of the gallbladder, as well
as 80 patients with AC of the gallbladder, are summarized in
Table I. The SCC/ASC group included
19 men and 27 women, with a mean age of 55.8±9.6 years and age
range of 35–82 years. Tumor staging revealed that 16 patients were
at stage pT4 of the disease, 24 patients at pT3 and the remaining 6
patients at pT1/2. In the SCC/ASC group, 29 cases demonstrated
positive lymph node invasion, and 28 cases were reported to have
gallstones. TNM staging in the 46 patients with SCC/ASC indicated
that 5 patients suffered from TNM stage I disease, 7 patients from
TNM stage II, 20 patients from TNM stage III and 14 patients from
TNM stage IV disease. In total, 14 patients underwent curative
resection and 18 underwent non-curative resection, while surgical
resection was not performed in 14 patients. All of the tumor
samples were obtained by intraopherative biopsy, and none of the
patients received any other treatment.
Patients in the AC group comprised 26 men and 54
women, with a mean age of 53.8±9.9 years and an age range of 33–80
years. In these cases, the tumor stage was classified as pT4 in 27
patients, pT3 in 25 patients and pT1/2 in 28 patients. Upon
pathological analysis, 50 patients demonstrated positive lymph node
invasion. Gallstones were detected in 38 patients. The TNM
classification was stage I in 8 patients, stage II in 13 patients,
stage III in 38 patients and stage IV in 21 patients. In total, 26
patients with AC underwent curative resection and 28 underwent
non-curative resection, while surgical resection was not performed
in 26 patients.
Patients were closely followed-up in the first 2
years after surgery. The mean overall survival in the SCC/ASC group
was 10.07±0.78 months, while the <1-year and >1-year overall
survival rates were 71.7 and 28.3%, respectively. Similarly, the
mean overall survival in the AC group was 10.34±0.63 months, with a
<1-year and >1-year overall survival rate in this group being
71.2 and 28.8%, respectively. No obvious difference was observed
between lymph node invasion and survival period, however, a
significant difference was identified in age, tumor
differentiation, tumor diameter, TNM stage, and PTMA/PTMS
expression between the SCC/ASC and AC groups (Table I).
Expression characteristics of PTMA and
PTMS in SCC/ASC and AC groups
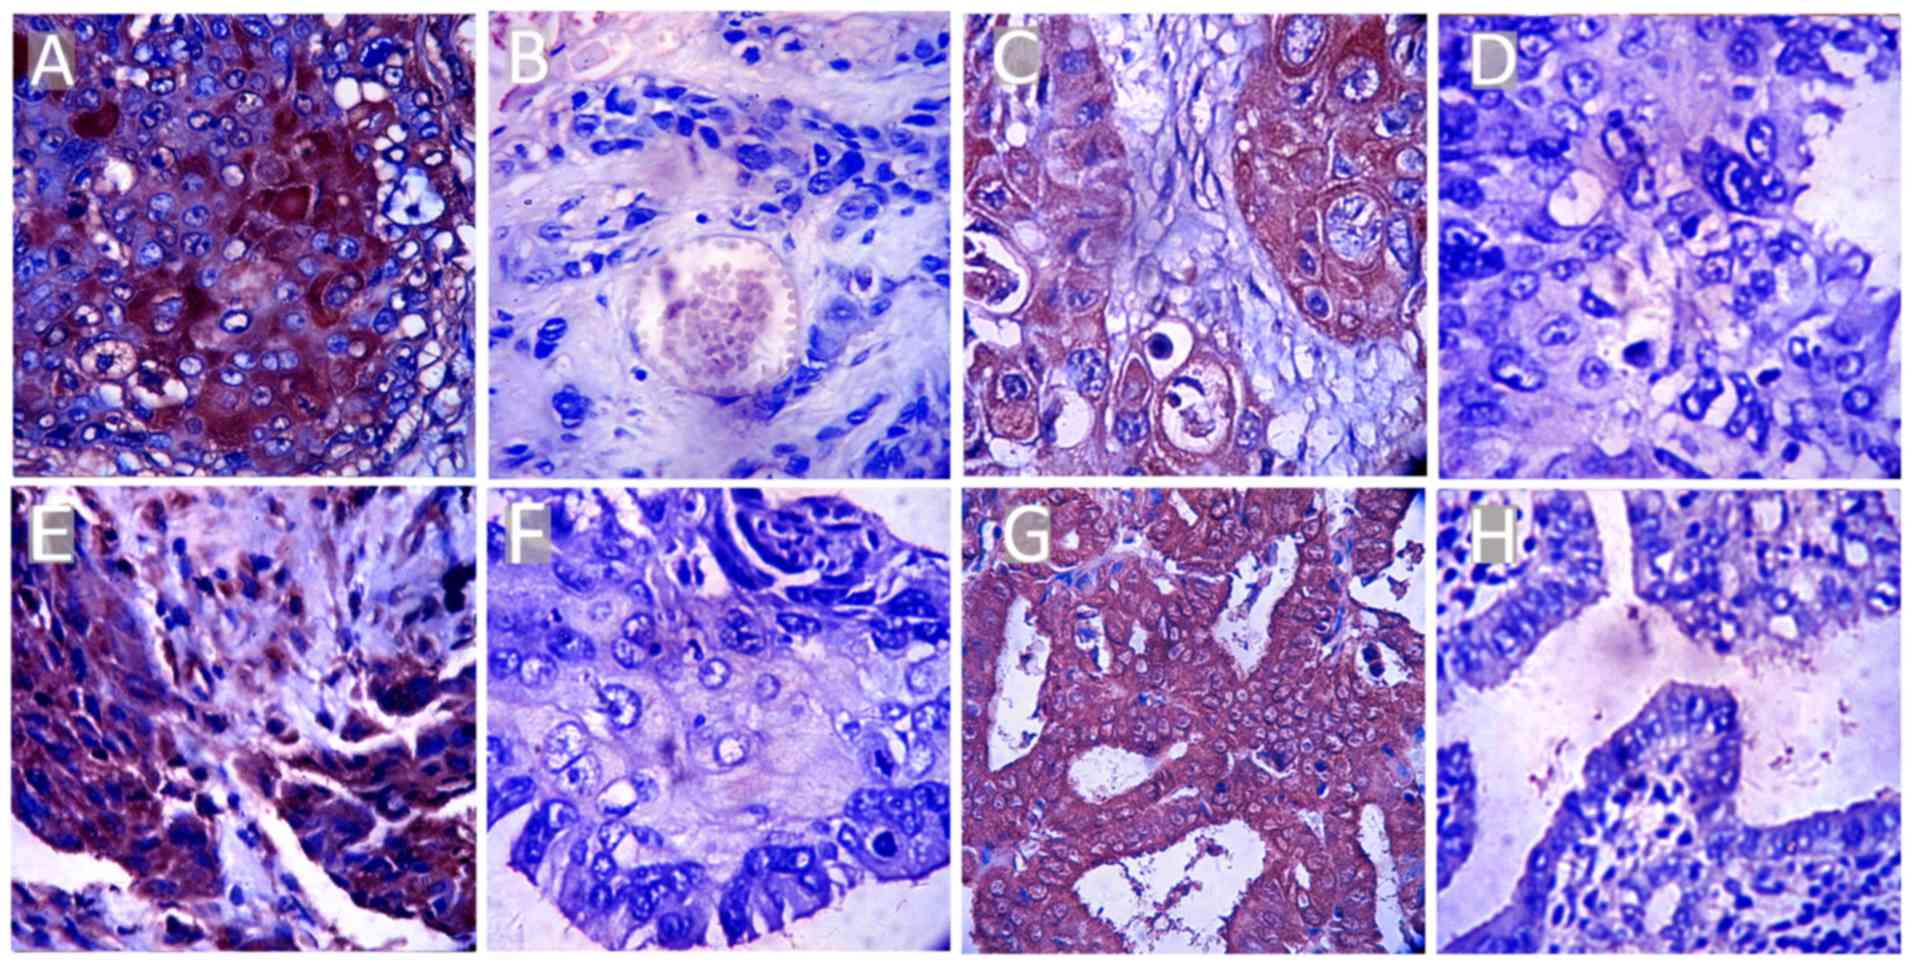
The expression levels of PTMA and PTMS were
initially assessed in the SCC/ASC and AC groups. Upon
immunohistochemical examination, the expression of PTMA and PTMS
was observed to be localized in the cytoplasm and nucleus (Fig. 1). Positive expression of PTMA and PTMS
in the SCC/ASC group was detected in 47.8% (22/46) and 47.8%
(22/46) of patients, respectively. In the AC group, positive PTMA
and PTMS expression was observed in 58.8% (47/80) and 57.5% (46/80)
of patients, respectively (Table I).
The between-group differences in this respect were not
statistically significant (P>0.05).
Correlation of PTMA and PTMS
expression levels with the clinicopathological characteristics
In the SCC/ASC group, positive expression of PTMA
and PTMS was observed in a significantly reduced number of patients
with smaller tumors (size, ≤3 cm), TNM stage I/II tumors, tumors
not associated with lymph node invasion or distance metastasis, and
tumors treated with curative resection (P<0.05 for all; Table II). A similar association of the PTMA
and PTMS expression profiles with the aforementioned
characteristics was observed in the AC group, while the tumor
differentiation degree was also correlated with PTMA and PTMS in
this group (Table III). Notably, no
significant correlation of positively expressed PTMA and PTMS was
observed with other clinicopathological characteristics, including
the patient age, sex, pathologic subtype and presence of gallstones
in the two groups (P>0.05; Tables
II and III). These findings
suggest that positive expression of PTMA and PTMS in tumor tissues
may be associated with tumor metastasis and malignancy in patients
with SCC, ASC and AC of the gallbladder.
| Table II.Correlation of PTMA and PTMS positive
expression with the clinicopathological characteristics of patients
with SCC and ASC of the gallbladder. |
Table II.
Correlation of PTMA and PTMS positive
expression with the clinicopathological characteristics of patients
with SCC and ASC of the gallbladder.
|
|
| PTMA | PTMS |
|---|
|
|
|
|
|
|---|
| Characteristic | Cases, n | Positive, n
(%) | χ2 | P-value | Positive, n
(%) | χ2 | P-value |
|---|
| Subtypes |
|
| 0.092 | 0.762 |
| 1.755 | 0.185 |
|
SCC | 26 | 18 (69.2) |
|
| 18 (69.2) |
|
|
|
ASC | 20 | 13 (65.0) |
|
| 10 (50.0) |
|
|
|
Differentiation |
|
| 5.235 | 0.073 |
| 3.579 | 0.167 |
|
Well-differentiated | 16 | 8 (50.0) |
|
| 7 (43.8) |
|
|
|
Moderately differentiated | 24 | 17 (70.8) |
|
| 16 (66.7) |
|
|
| Poorly
differentiated | 6 | 6 (100.0) |
|
| 5 (83.3) |
|
|
| Tumor diameter |
|
| 12.081 | <0.001 |
| 9.942 | <0.001 |
| ≤3
cm | 20 | 8 (40.0) |
|
| 7 (35.0) |
|
|
| >3
cm | 26 | 23 (88.5) |
|
| 21 (80.8) |
|
|
| Gallstones |
|
| 1.885 | 0.178 |
| 0.001 | 0.955 |
|
Negative | 18 | 10 (55.6) |
|
| 11 (61.1) |
|
|
|
Positive | 28 | 21 (75.0) |
|
| 17 (60.7) |
|
|
| TNM stages |
|
| 7.797 | 0.020 |
| 5.805 | 0.059 |
|
I/II | 12 | 5 (41.7) |
|
| 4 (33.3) |
|
|
|
III | 20 | 13 (65.0) |
|
| 13 (65.0) |
|
|
| IV | 14 | 13 (92.9) |
|
| 11 (78.6) |
|
|
| Lymph node
invasion |
|
| 5.073 | 0.024 |
| 7.405 | 0.007 |
|
Negative | 17 | 8 (47.1) |
|
| 6 (35.3) |
|
|
|
Positive | 29 | 23 (79.3) |
|
| 22 (75.9) |
|
|
| Adjacent organs
invasion |
|
| 6.240 | 0.012 |
| 5.625 | 0.019 |
|
Negative | 16 | 7 (43.8) |
|
| 6 (37.5) |
|
|
|
Positive | 30 | 24 (80.0) |
|
| 22 (73.3) |
|
|
| Resection |
|
| 6.165 | 0.046 |
| 7.346 | 0.025 |
|
Curative resection | 14 | 6 (42.9) |
|
| 5 (35.7) |
|
|
|
Non-curative resection | 18 | 13 (72.2) |
|
| 11 (61.1) |
|
|
| No
resection | 14 | 12 (85.7) |
|
| 12 (85.7) |
|
|
| Table III.Correlation of prothymosin-α and
parathymosin positive expression with the clinicopathological
characteristics of patients with adenocarcinoma of the
gallbladder. |
Table III.
Correlation of prothymosin-α and
parathymosin positive expression with the clinicopathological
characteristics of patients with adenocarcinoma of the
gallbladder.
|
|
| Prothymosin-α | Parathymosin |
|---|
|
|
|
|
|
|---|
| Characteristic | Cases | Positive (%) | χ2 | P-value | Positive (%) | χ2 | P-value |
|---|
|
Differentiation |
|
| 9.274 | 0.010 |
| 5.599 | 0.061 |
|
Well-differentiated | 27 | 12 (44.4) |
|
| 9 (33.3) |
|
|
|
Moderately differentiated | 25 | 18 (72.0) |
|
| 14 (56.0) |
|
|
| Poorly
differentiated | 28 | 23 (82.1) |
|
| 18 (64.3) |
|
|
| Tumor diameter |
|
| 6.265 | 0.012 |
| 15.880 | <0.001 |
| ≤3
cm | 50 | 28 (56.0) |
|
| 17 (34.0) |
|
|
| >3
cm | 30 | 25 (83.3) |
|
| 24 (80.0) |
|
|
| Gallstones |
|
| 0.007 | 0.934 |
| 0.436 | 0.509 |
|
Negative | 42 | 28 (66.7) |
|
| 23 (54.8) |
|
|
|
Positive | 38 | 25 (65.8) |
|
| 18 (47.4) |
|
|
| TNM stages |
|
| 8.778 | 0.012 |
| 10.759 | 0.005 |
|
I/II | 21 | 9 (42.9) |
|
| 7 (33.3) |
|
|
|
III | 38 | 26 (68.4) |
|
| 17 (44.7) |
|
|
| IV | 21 | 18 (85.7) |
|
| 17 (81.0) |
|
|
| Lymph node
invasion |
|
| 5.669 | 0.017 |
| 4.086 | 0.047 |
|
Negative | 30 | 15 (50.0) |
|
| 11 (36.7) |
|
|
|
Positive | 50 | 38 (76.0) |
|
| 30 (60.0) |
|
|
| Invasion of
adjacent organs |
|
| 10.067 | 0.002 |
| 7.307 | 0.007 |
|
Negative | 31 | 14 (45.2) |
|
| 10 (32.3) |
|
|
|
Positive | 49 | 39 (79.6) |
|
| 31 (63.3) |
|
|
| Resection |
|
| 12.435 | 0.002 |
| 13.032 | 0.001 |
|
Curative resection | 26 | 11 (42.3) |
|
| 7 (26.9) |
|
|
|
Non-curative resection | 28 | 19 (67.9) |
|
| 14 (50.0) |
|
|
| No
resection | 26 | 23 (88.5) |
|
| 20 (76.9) |
|
|
Prognostic value of PTMA and PTMS
expression levels
The study further investigated the prognostic value
of the expression levels of PTMA and PTMS in patients in the
SCC/ASC and AC groups. The median duration of follow-up in the
SCC/ASC (n=46) and AC (n=80) groups was 10.07±0.78 and 10.34±0.63
months, respectively (Table I). Using
Kaplan-Meier analysis, the tumor differentiation, tumor diameter,
TNM stage, lymph node invasion, invasion of adjacent organs and
resection treatment demonstrated a significant positive correlation
with the survival of patients in the two groups (P<0.05;
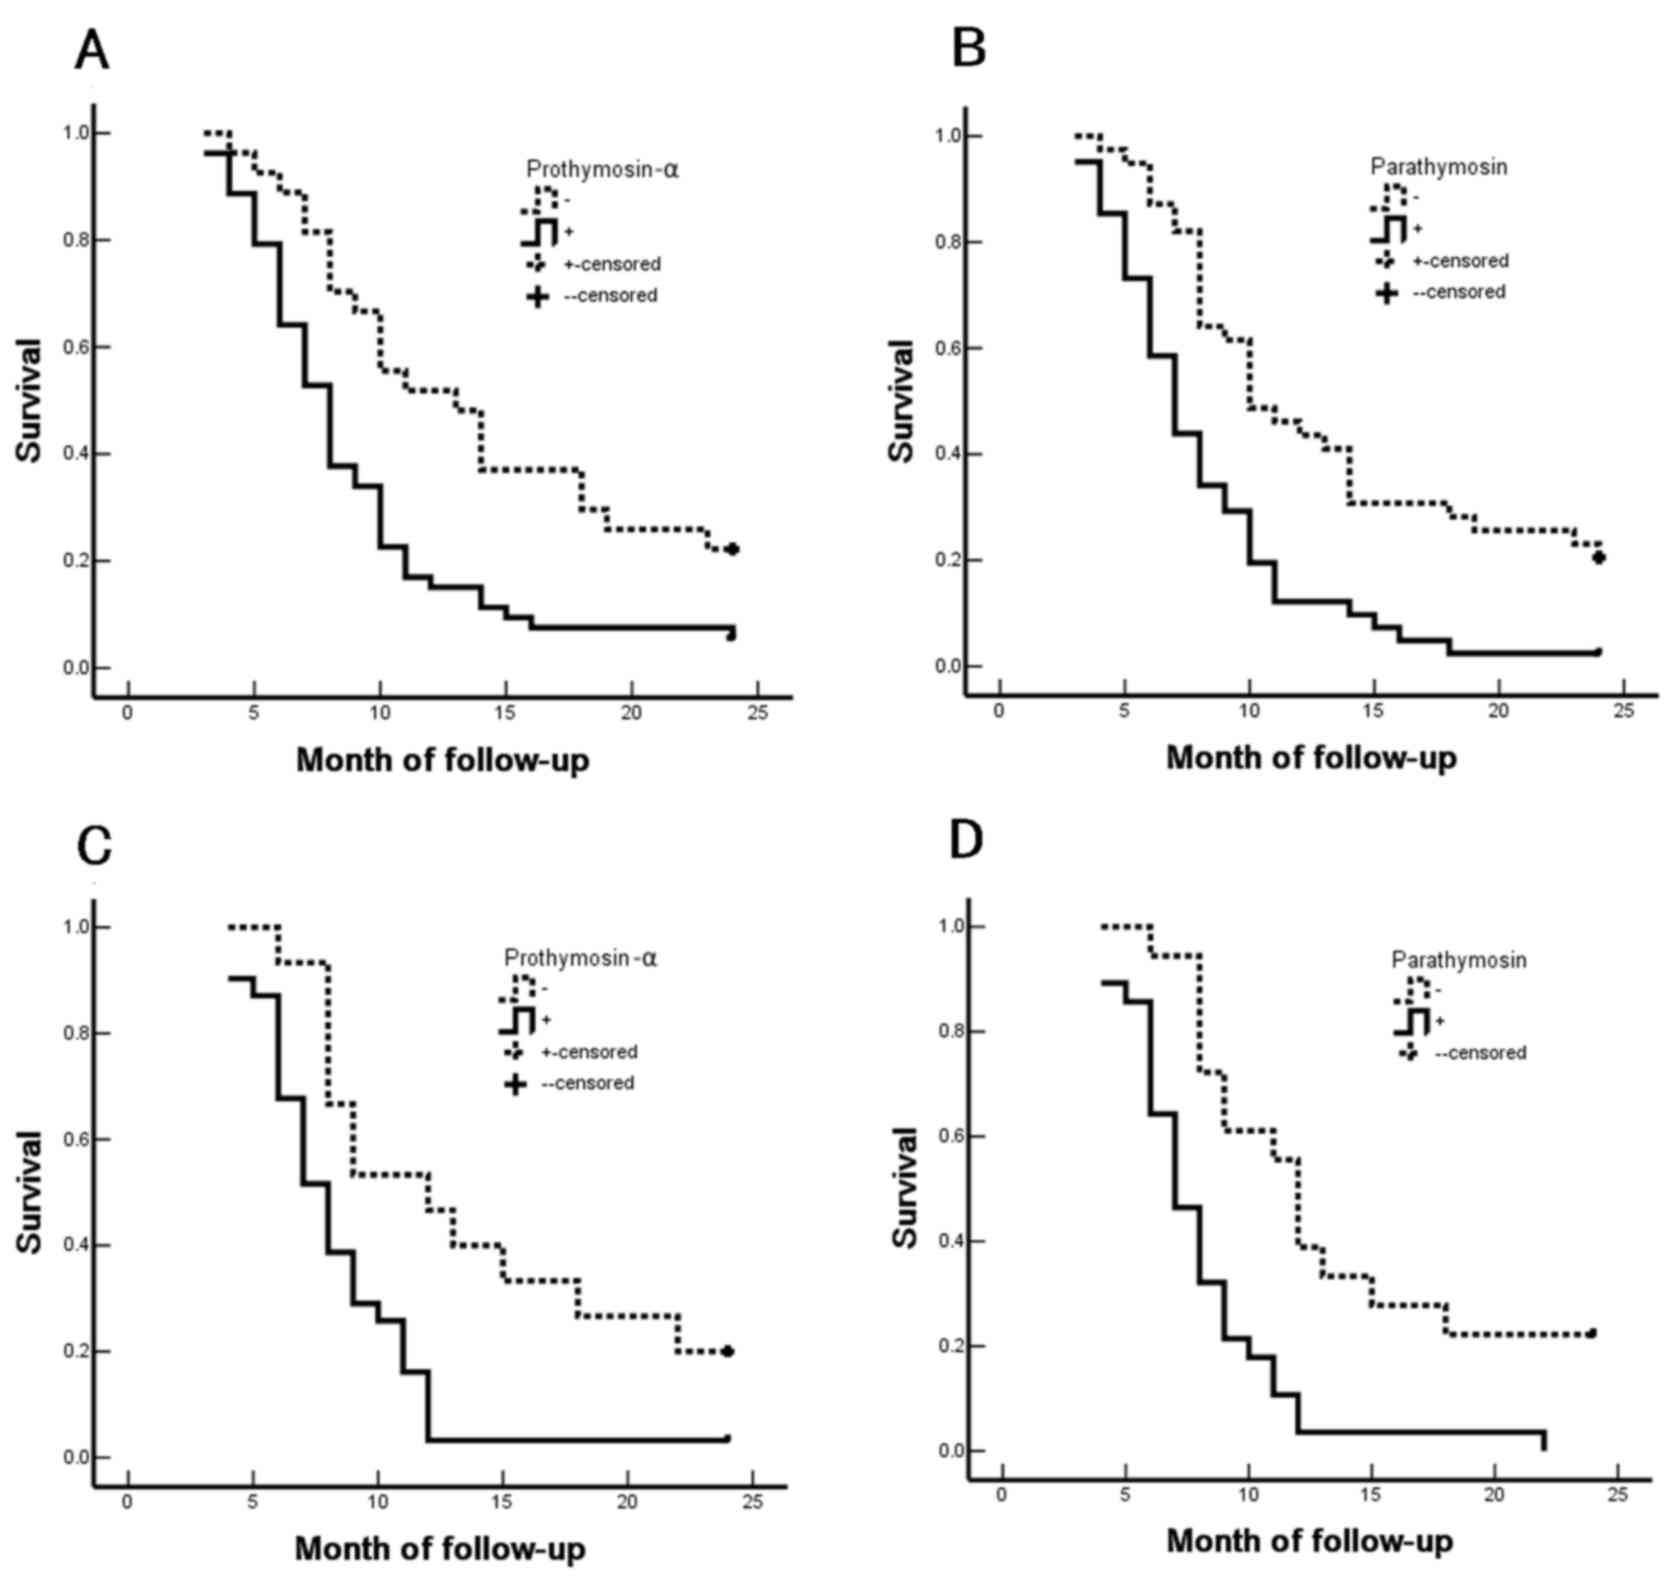
Tables IV–VII). Furthermore, in the SCC/ASC and AC
groups, the survival of patients with positive expression of PTMA
and PTMS was significantly shorter compared with that of patients
with negative expression of PTMA and PTMS (Fig. 2). Furthermore, patients who underwent
curative resection survived longer in comparison with those who
underwent non-curative resection in the SCC/ASC and AC groups,
which suggests that curative resection efficiently improved the
prognosis of patients (P<0.05 for all; Tables IV–VII). Taken together, the aforementioned
results indicated that the clinicopathological characteristics of
patients, including tumor differentiation, tumor diameter, TNM
stage, lymph node invasion, invasion of adjacent organs and
resection treatment, as well as positive expression of PTMA and
PTMS, were closely associated with the postoperative survival.
These findings suggest the diagnostic and prognostic relevance of
PTMA and PTMS expression in the management of patients with
GBC.
| Table IV.Correlation of the average survival
with the clinicopathological characteristics of patients with
squamous cell and adenosquamous carcinomas of the gallbladder. |
Table IV.
Correlation of the average survival
with the clinicopathological characteristics of patients with
squamous cell and adenosquamous carcinomas of the gallbladder.
| Groups | Cases, n | The mean survival
period (months) | χ2-value | P-value |
|---|
| Sex |
|
| 0.767 | 0.381 |
|
Male | 19 | 10.74 (6–24) |
|
|
|
Female | 27 | 9.85 (4–24) |
|
|
| Age |
|
| 2.023 | 0.155 |
| ≤45
years | 3 | 15.67 (8–24) |
|
|
| >45
years | 43 | 9.84 (4–25) |
|
|
| Subtypes |
|
| 0.223 | 0.637 |
|
Squamous cell carcinoma | 26 | 10.19 (4–24) |
|
|
|
Adenosquamous carcinoma | 20 | 10.25 (4–24) |
|
|
|
Differentiation |
|
| 19.125 | <0.001 |
|
Well-differentiated | 16 | 13.81 (5–24) |
|
|
|
Moderately differentiated | 24 | 8.92 (4–18) |
|
|
| Poorly
differentiated | 6 | 5.83 (4–9) |
|
|
| Tumor diameter |
|
| 31.337 | <0.001 |
| ≤3
cm | 20 | 14.35 (7–24) |
|
|
| >3
cm | 26 | 7.04 (4–11) |
|
|
| Gallstones |
|
| 3.730 | 0.053 |
|
Negative | 18 | 8.22 (4–12) |
|
|
|
Positive | 28 | 11.50 (4–24) |
|
|
| TNM stages |
|
| 51.139 | <0.001 |
|
I/II | 12 | 17.00 (9–24) |
|
|
|
III | 20 | 9.20 (7–15) |
|
|
| IV | 14 | 5.86 (4–8) |
|
|
| Lymph node
invasion |
|
| 16.219 | <0.001 |
|
Negative | 17 | 14.24 (4–24) |
|
|
|
Positive | 29 | 7.86 (4–15) |
|
|
| Adjacent organs
invasion |
|
| 32.271 | <0.001 |
|
Negative | 16 | 15.75 (9–24) |
|
|
|
Positive | 30 | 7.27 (4–12) |
|
|
| Resection |
|
| 50.165 | <0.001 |
|
Curative resection | 14 | 16.64 (10–24) |
|
|
|
Non-curative resection | 18 | 8.50 (6–12) |
|
|
|
Non-resection | 14 | 6.00 (4–8) |
|
|
| Prothymosin-α |
|
| 8.478 | 0.004 |
| − | 15 | 13.87 (6–24) |
|
|
| + | 31 | 8.45 (4–24) |
|
|
| Parathymosin |
|
| 13.824 | <0.001 |
| − | 18 | 13.61 (6–24) |
|
|
| + | 28 | 8.04 (4–22) |
|
|
| Table VII.Cox multivariate analysis of survival
rate for patients with adenocarcinoma of the gallbladder. |
Table VII.
Cox multivariate analysis of survival
rate for patients with adenocarcinoma of the gallbladder.
|
|
|
|
|
|
|
| 95% CI |
|---|
|
|
|
|
|
|
|
|
|
|---|
| Characteristic | Subgroups | B-value | SE | Wald | P-value | RR | Low | High |
|---|
|
Differentiation |
Well-/moderately/poorly | 1.264 | 0.494 | 6.547 | 0.011 | 3.540 | 1.344 | 9.321 |
| Tumor diameter | ≤3/>3 cm | 1.307 | 0.484 | 7.292 | 0.007 | 3.695 | 1.431 | 9.541 |
| Gallstones |
Negative/positive | 0.251 | 0.239 | 1.103 | 0.294 | 1.285 | 0.805 | 2.053 |
| TNM stages | I/II/III/IV | 1.344 | 0.469 | 8.212 | 0.004 | 3.834 | 1.529 | 9.614 |
| Lymph node
invasion |
Negative/positive | 1.409 | 0.563 | 6.263 | 0.012 | 4.092 | 1.357 | 12.335 |
| Adjacent organs
invasion |
Negative/positive | 1.586 | 0.516 | 9.447 | 0.002 | 4.884 | 1.776 | 13.428 |
| Resection |
Curative/non-curative/non-resection | 1.526 | 0.617 | 6.117 | 0.013 | 4.600 | 1.373 | 15.415 |
| Prothymosin-α | −/+ | 1.743 | 0.563 | 9.585 | 0.002 | 5.714 | 1.896 | 17.227 |
| Parathymosin | −/+ | 1.352 | 0.474 | 8.136 | 0.004 | 3.865 | 1.526 | 9.787 |
Discussion
GBC is a relatively rare tumor of the digestive
system, with AC of the gallbladder accounting for >85% of all
gallbladder tumors. The majority of cases with AC of the
gallbladder involve highly or moderately differentiated tumors.
However, as rare histotypes of GBC, the clinicopathological
features of SCC and ASC are not well-characterized. Histologically,
SCC and ASC of the gallbladder have a squamous cell component that
differs from that observed in AC. Furthermore, SCC/ASC and AC of
the gallbladder exhibit certain differences with respect to their
clinical characteristics. SCC and ASC of the gallbladder present a
greater proliferation capacity (4),
which suggests that patients with SCC or ASC may have poorer
prognosis in comparison with those with AC. Therefore, the present
study attempted to compare patients with these different
histopathological subtypes to assess the correlation between their
clinicopathological characteristics and the PTMA/PTMS expression in
SC/ASC and AC of the gallbladder.
In the present study, patients with SCC/ASC of the
gallbladder accounted for 4.34% (46/1,060) of the total patients
with carcinoma of the gallbladder treated at the participating
hospitals, which is consistent with the incidence reported in
earlier studies (2,6,20). Similar
to the clinical presentation of AC, patients with early-stage SCC
and ASC presented with no specific symptoms other than those
typically associated with chronic cholecystitis, due to which the
majority of patients were not diagnosed at an early stage. Clinical
signs and symptoms, such as persistent abdominal pain, palpable
mass and jaundice, typically occur in the advanced stages of the
disease (5). The population of the
present study mainly included patients with advanced stages of SCC,
ASC and AC.
Several previous studies have described that SCC and
ASC of the gallbladder with a squamous cell component exhibit a
greater proliferation capability, lower propensity for metastasis,
greater tendency for involvement of adjacent organs, and worse
overall prognosis, as compared with that associated with AC of the
gallbladder (2–6). In the present study, no significant
difference was observed with respect to the incidence of lymph node
metastasis, and invasion of the surrounding tissues and organs
between the SCC/ASC and AC groups. However, the number of patients
having tumors with a size of >3 cm in the SCC/ASC group was
markedly higher compared with that in the AC group.
The present study also identified that the patients
with advanced stages in the SCC/ASC and AC groups had an extremely
poor prognosis, as all patients with TNM stages III/IV succumbed to
the disease within 25–27 months. Patients with TNM stage I/II
tumors had a markedly higher survival rate, which underlines the
importance of early diagnosis in these patients (Tables IV and VI). Furthermore, the average postoperative
survival was comparable in the SCC/ASC and AC patients, which
suggested that all these histotypes were associated with a poor
prognosis (Table I). The percentage
of patients who underwent curative resection was not significantly
difference between the two study groups. However, the survival rate
of patients who underwent curative resection group was
significantly increased as compared with that of patients who
underwent non-curative resection or did not undergo resection in
the SCC/ASC and AC groups (Tables
IV–VII). This indicates that
curative resection may improve the prognosis of patients with SCC,
ASC and AC of the gallbladder.
| Table VI.Correlation of the average survival
with the clinicopathological characteristics of patients with
adenocarcinoma of the gallbladder. |
Table VI.
Correlation of the average survival
with the clinicopathological characteristics of patients with
adenocarcinoma of the gallbladder.
| Groups | Cases, n | The mean survival
period (months) | χ2 | P-value |
|---|
| Sex |
|
| 2.567 | 0.109 |
|
Male | 26 | 9.58 (3–24) |
|
|
|
Female | 54 | 11.30 (3–24) |
|
|
| Age |
|
| 0.003 | 0.956 |
| ≤45
years | 16 | 10.81 (4–24) |
|
|
| >45
years | 64 | 10.72 (3–24) |
|
|
|
Differentiation |
|
| 32.501 | <0.001 |
|
Well-differentiated | 27 | 15.07 (5–24) |
|
|
|
Moderately differentiated | 25 | 10.60 (4–24) |
|
|
| Poorly
differentiated | 28 | 6.68 (3–14) |
|
|
| Tumor diameter |
|
| 68.283 | <0.001 |
| ≤3
cm | 50 | 13.70 (6–24) |
|
|
| >3
cm | 30 | 5.80 (3–10) |
|
|
| Gallstones |
|
| 0.246 | 0.620 |
|
Negative | 42 | 10.19 (3–24) |
|
|
|
Positive | 38 | 11.34 (4–24) |
|
|
| TNM stages |
|
| 105.825 | <0.001 |
|
I/II | 21 | 18.96 (5–24) |
|
|
|
III | 38 | 9.29 (6–15) |
|
|
| IV | 21 | 5.14 (3–7) |
|
|
| Lymph node
invasion |
|
| 42.372 | <0.001 |
|
Negative | 30 | 16.27 (4–24) |
|
|
|
Positive | 50 | 7.42 (3–14) |
|
|
| Adjacent organs
invasion |
|
| 55.535 | <0.001 |
|
Negative | 31 | 16.68 (7–24) |
|
|
|
Positive | 49 | 6.98 (3–11) |
|
|
| Resection |
|
| 113.141 | <0.001 |
|
Curative resection | 26 | 18.31 (10–24) |
|
|
|
Non-curative resection | 28 | 8.64 (6–11) |
|
|
| No
resection | 26 | 5.42 (3–9) |
|
|
| Prothymosin-α |
|
| 10.079 | 0.001 |
| − | 27 | 14.07 (4–24) |
|
|
| + | 53 | 9.04 (3–24) |
|
|
| Parathymosin |
|
| 15.255 | <0.001 |
| − | 39 | 13.44 (4–24) |
|
|
| + | 41 | 8.17 (3–24) |
|
|
PTMA and PTMS, which were originally obtained by
bovine thymus extraction, are members of the α-thymosin family
(24). Previous studies have
demonstrated that PTMA and PTMS activate the immune response to
curb the viral infection in patients with human immunodeficiency
virus, hepatitis B virus or hepatitis C virus (25,26).
Elevated expression levels of PTMA and PTMS have been reported in
numerous human malignant tumor tissues (12,14,15).
However, the correlation between the expression levels of PTMA and
PTMS in SCC, ASC and AC of the gallbladder have not been addressed
in previous studies. In the present study, the percentage of
patients with positive expression of PTMA and PTMS was not
significantly between the SCC/ASC and AC of the gallbladder groups
(Tables II and III). In addition, it was observed that
positive expression of PTMA and PTMS was not associated with the
differentiation of SCC/ASC or AC of the gallbladder (Tables II and III). In the SCC/ASC and AC groups,
negative expression of PTMA and PTMS was detected in a
significantly reduced number of patients with highly-differentiated
tumors, maximal tumor diameter of ≤3 cm, TNM stage I/II tumors,
lack of lymph node metastasis, absence of invasion into the
surrounding tissues and organs, and in patients who underwent
radical resection. Similarly, positive expression of PTMA and PTMS
was reported in an increased number of patients with a maximal
tumor diameter of >3 cm, TNM stage III/IV disease, lymph node
metastasis and invasion into the surrounding tissues and organs, as
well as patients who did not undergo resection (Tables II and III).
The present study further demonstrated that the
degree of tumor differentiation, maximal tumor diameter, TNM stage,
lymph node metastasis, invasion of the surrounding tissues and
history of surgical resection were closely associated with the
average survival of patients with SCC/ASC (Table IV) and AC (Table VI) of the gallbladder. In addition,
the survival of patients with a positive expression of PTMA and
PTMS was significantly shorter when compared with that of patients
with negative expression of PTMA and PTMS (Fig. 2). Cox multivariate analysis also
revealed that poor differentiation, a maximal tumor diameter of ≥3
cm, TNM stages III or IV disease, occurrence of lymph node
metastasis, invasion of the surrounding tissues and organs, and
non-resection were negatively correlated with the postoperative
survival of patients with SCC/ASC and AC of the gallbladder
(Tables V and VII). These findings indicate that PTMA and
PTMS expression levels may be independent prognostic predictors.
Furthermore, the results suggest that PTMA and PTMS may serve an
important role in the occurrence, progression, biological behavior
and prognosis of gallbladder SCC, ASC and AC, which is consistent
with the observations of previous studies on PTMA and PTMS
expression in other malignant tumors (19,20). The
present study also identified that positive expression of PTMA and
PTMS in patients with SCC/ASC and AC of the gallbladder (Tables II and III) was associated with rapid progression,
and these patients were prone to regional lymph node metastasis
with strong invasiveness. Therefore, it is suggested that these two
factors may be important biological markers for early diagnosis of
GBC. However, the molecular mechanism underlying the effects of
PTMA and PTMS in GBC requires further exploration.
| Table V.Cox multivariate analysis of survival
rate of patients with SCC and ASC of the gallbladder. |
Table V.
Cox multivariate analysis of survival
rate of patients with SCC and ASC of the gallbladder.
|
|
|
|
|
|
|
| 95% CI |
|---|
|
|
|
|
|
|
|
|
|
|---|
|
Characteristics | Subgroups | B-value | SE | Wald | P-value | RR | Low | High |
|---|
| Subtypes | SCC/ASC | 0.308 | 0.460 | 0.448 | 0.503 | 1.361 | 0.522 | 3.352 |
|
Differentiation |
Well-/moderately/poorly | 1.317 | 0.582 | 5.121 | 0.024 | 3.732 | 1.193 | 11.678 |
| Tumor diameter | ≤3/>3 cm | 1.951 | 0.691 | 7.972 | 0.005 | 7.036 | 1.816 | 27.258 |
| Gallstones |
Negative/positive | 0.859 | 0.483 | 3.163 | 0.075 | 2.361 | 0.916 | 6.084 |
| TNM stages | I/II/III/IV | 1.352 | 0.548 | 6.087 | 0.014 | 3.865 | 1.320 | 11.314 |
| Lymph node
invasion |
Negative/positive | 1.580 | 0.673 | 5.512 | 0.019 | 4.855 | 1.298 | 18.157 |
| Invasion of
adjacent organs |
Negative/positive | 2.625 | 0.819 | 10.273 | 0.001 | 13.805 | 2.773 | 68.734 |
| Resection |
Curative/non-curative/non-resection | 1.080 | 0.467 | 5.348 | 0.021 | 2.945 | 1.179 | 7.355 |
| Prothymosin-α | −/+ | 1.736 | 0.688 | 6.367 | 0.012 | 5.675 | 1.473 | 21.856 |
| Parathymosin | −/+ | 1.563 | 0.770 | 4.120 | 0.042 | 4.773 | 1.055 | 21.589 |
In conclusion, PTMA and PTMS are two important
biological markers that reflect tumorigenesis, tumor progression,
clinical biological behavior, and the prognosis of patients with
SCC, ASC and AC of the gallbladder. It was identified that the
positive expression of PTMA/PTMS may be associated with poor
prognosis in both SCC/ASC and AC of the gallbladder. Therefore, the
detection of the expression levels of PTMA and/or PTMS in
gallbladder tissues may have important clinicopathological
significance in the prevention and early diagnosis of GBC.
References
|
1
|
Roa JC, Tapia O, Cakir A, Basturk O,
Dursun N, Akdemir D, Saka B, Losada H, Bagci P and Adsay NV:
Squamous cell and adenosquamous carcinomas of the gallbladder:
Clinicopathological analysis of 34 cases identified in 606
carcinomas. Mod Pathol. 24:1069–1078. 2011. View Article : Google Scholar : PubMed/NCBI
|
|
2
|
Kim WS, Jang KT, Choi DW, Choi SH, Heo JS,
You DD and Lee HG: Clinicopathologic analysis of
adenosquamous/squamous cell carcinoma of the gallbladder. J Surg
Oncol. 103:239–242. 2011. View Article : Google Scholar : PubMed/NCBI
|
|
3
|
Kondo M, Dono K, Sakon M, Shimizu J,
Nagano H, Nakamori S, Umeshita K, Wakasa K and Monden M:
Adenosquamous carcinoma of the gallbladder. Hepatogastroenterology.
49:1230–1234. 2002.PubMed/NCBI
|
|
4
|
Nishihara K, Nagai E, Izumi Y, Yamaguchi K
and Tsuneyoshi M: Adenosquamous carcinoma of the gallbladder: A
clinicopathological, immunohistochemical and flow-cytometric study
of twenty cases. Jpn J Cancer Res. 85:389–399. 1994. View Article : Google Scholar : PubMed/NCBI
|
|
5
|
Mingoli A, Brachini G, Petroni R,
Antoniozzi A, Cavaliere F, Simonelli L, Chirletti P and Modini C:
Squamous and adenosquamous cell carcinomas of the gallbladder. J
Exp Clin Cancer Res. 24:143–150. 2005.PubMed/NCBI
|
|
6
|
Chan KM, Yu MC, Lee WC, Jan YY and Chen
MF: Adenosquamous/squamous cell carcinoma of the gallbladder. J
Surg Oncol. 95:129–134. 2007. View Article : Google Scholar : PubMed/NCBI
|
|
7
|
Rekik W, Ben Fadhel C, Boufaroua AL,
Mestiri H, Khalfallah MT, Bouraoui S and Mzabi-Rgaya S: Case
report: Primary pure squamous cell carcinoma of the gallbladder. J
Visc Surg. 148:e149–e151. 2011. View Article : Google Scholar : PubMed/NCBI
|
|
8
|
Oohashi Y, Shirai Y, Wakai T, Nagakura S,
Watanabe H and Hatakeyama K: Adenosquamous carcinoma of the
gallbladder warrants resection only if curative resection is
feasible. Cancer. 94:3000–3005. 2002. View Article : Google Scholar : PubMed/NCBI
|
|
9
|
Haritos AA, Goodall GJ and Horecker BL:
Prothymosin alpha: Isolation and properties of the major
immunoreactive form of thymosin alpha 1 in rat thymus. Proc Natl
Acad Sci USA. 81:pp. 1008–1011. 1984; View Article : Google Scholar : PubMed/NCBI
|
|
10
|
Letsas KP and Frangou-Lazaridis M: Surfing
on prothymosin alpha proliferation and anti-apoptotic properties.
Neoplasma. 53:92–96. 2006.PubMed/NCBI
|
|
11
|
Jiang X, Kim HE, Shu H, Zhao Y, Zhang H,
Kofron J, Donnelly J, Burns D, Ng SC, Rosenberg S and Wang X:
Distinctive roles of PHAP proteins and prothymosin-alpha in a death
regulatory pathway. Science. 299:223–226. 2003. View Article : Google Scholar : PubMed/NCBI
|
|
12
|
Jou YC, Tung CL, Tsai YS, Shen CH, Syue-Yi
C, Shiau AL, Tsai HT, Wu CL and Tzai TS: Prognostic relevance of
prothymosin-alpha expression in human upper urinary tract
transitional cell carcinoma. Urology. 74:951–957. 2009. View Article : Google Scholar : PubMed/NCBI
|
|
13
|
Letsas KP, Vartholomatos G, Tsepi C,
Tsatsoulis A and Frangou-Lazaridis M: Fine-needle aspiration
biopsy-RT-PCR expression analysis of prothymosin alpha and
parathymosin in thyroid: Novel proliferation markers? Neoplasma.
54:57–62. 2007.PubMed/NCBI
|
|
14
|
Wang M, Pan JY, Song GR, Chen HB, An LJ
and Qu SX: Altered expression of estrogen receptor alpha and beta
in advanced gastric adenocarcinoma: Correlation with prothymosin
alpha and clinicopathological parameters. Eur J Surg Oncol.
33:195–201. 2007. View Article : Google Scholar : PubMed/NCBI
|
|
15
|
Zhang M, Cui F, Lu S, Lu H, Jiang T, Chen
J, Zhang X, Jin Y, Peng Z and Tang H: Increased expression of
prothymosin-α, independently or combined with TP53, correlates with
poor prognosis in colorectal cancer. Int J Clin Exp Pathol.
7:4867–4876. 2014.PubMed/NCBI
|
|
16
|
Frangou-Lazaridis M, Clinton M, Goodall GJ
and Horecker BL: Prothymosin alpha and parathymosin: Amino acid
sequences deduced from the cloned rat spleen cDNAs. Arch Biochem
Biophys. 263:305–310. 1988. View Article : Google Scholar : PubMed/NCBI
|
|
17
|
Clinton M, Frangou-Lazaridis M,
Panneerselvam C and Horecker BL: The sequence of human parathymosin
deduced from a cloned human kidney cDNA. Biochem Biophys Res
Commun. 158:855–862. 1989. View Article : Google Scholar : PubMed/NCBI
|
|
18
|
Haritos AA, Salvin SB, Blacher R, Stein S
and Horecker BL: Parathymosin alpha: A peptide from rat tissues
with structural homology to prothymosin alpha. Proc Natl Acad Sci
USA. 82:pp. 1050–1053. 1985; View Article : Google Scholar : PubMed/NCBI
|
|
19
|
Hannappel E and Huff T: The thymosins.
Prothymosin alpha, parathymosin, and beta-thymosins: Structure and
function. Vitam Horm. 66:257–296. 2003. View Article : Google Scholar : PubMed/NCBI
|
|
20
|
Vareli K, Frangou-Lazaridis M, van der
Kraan I, Tsolas O and van Driel R: Nuclear distribution of
prothymosin alpha and parathymosin: Evidence that prothymosin alpha
is associated with RNA synthesis processing and parathymosin with
early DNA replication. Exp Cell Res. 257:152–161. 2000. View Article : Google Scholar : PubMed/NCBI
|
|
21
|
Lazcano-Ponce EC, Miquel JF, Muñoz N,
Herrero R, Ferrecio C, Wistuba II, Alonso de Ruiz P, Aristi Urista
G and Nervi F: Epidemiology and molecular pathology of gallbladder
cancer. CA Cancer J Clin. 51:349–364. 2001. View Article : Google Scholar : PubMed/NCBI
|
|
22
|
Edge SB and Compton CC: The American Joint
Committee on Cancer: The 7th edition of the AJCC cancer staging
Manual and the Future of TNM. Ann Surg Oncol. 17:1471–1474. 2010.
View Article : Google Scholar : PubMed/NCBI
|
|
23
|
Hamilton SR and Aaltonen LA: Patholigy and
Genetics of Tumours of the Digestive System. IARC Press; Lyon:
2000
|
|
24
|
Okamoto K and Isohashi F: Purification and
primary structure of a macromolecular-translocation inhibitor II of
glucocorticoid-receptor binding to nuclei from rat liver. Inhibitor
II is the 11.5-kDa Zn2+-binding protein (parathymosin). Eur J
Biochem. 267:155–162. 2000. View Article : Google Scholar : PubMed/NCBI
|
|
25
|
Hoch K and Volk DE: Structures of thymosin
proteins. Vitam Horm. 102:1–24. 2016. View Article : Google Scholar : PubMed/NCBI
|
|
26
|
Mosoian A, Teixeira A, High AA, Christian
RE, Hunt DF, Shabanowitz J, Liu X and Klotman M: Novel function of
prothymosin alpha as a potent inhibitor of human immunodeficiency
virus type 1 gene expression in primary macrophages. J Virol.
80:9200–9206. 2006. View Article : Google Scholar : PubMed/NCBI
|