Introduction
Tumors of the central nervous system (CNS) are the
most frequent type of solid tumor identified in children. Among
them, medulloblastoma has the highest incidence rate, at 6 per
1,000,000 in children aged 1–9 years in the United States (1), which is 10-fold greater than the
incidence rate in adults (2). Since
the organogenesis of the cerebellum is strongly associated with its
susceptibility to oncogenic transformation, medulloblastomas are
classified as embryonic tumors, which is consistent with the high
incidence rate of tumors derived from this organ in children
(3,4).
Conventionally, the histological classification of medulloblastoma
has been established to comprise the following variants: Classic,
desmoplastic/nodular, anaplastic, large-cell and medulloblastoma
with extensive nodularity (5).
Current treatment options include surgery, radiotherapy and
chemotherapy, and treatment is selected based on patient age, among
other risk factors (6). These
strategies typically achieve a 5-year survival rate of 50–80%;
however, severe neurological secondary effects can result from such
treatments (6–8).
The discovery of the molecular landscape of
medulloblastoma has provided a new perspective in the research of
the disease. This has allowed the elucidation of the origin of
medulloblastoma, and how specific molecular dysregulation can
affect the treatment response and subsequent clinical outcomes. The
molecular classification of medulloblastoma is based on 4
subgroups: WNT, SHH, Group 3 (G3) and Group 4 (G4). The WNT
subgroup is associated with the dysregulation of Wnt signaling; it
accounts for 10% of all medulloblastoma cases and is associated
with the most positive prognosis (9,10). This
subgroup is characterized by mutations in catenin β1, APC
and Frizzled, among other genes, which are known to maintain and
activate pathways involving the β-catenin protein, a transcription
factor upregulating cell proliferation, survival and migration
(11). Additionally, the WNT subgroup
is associated with a predisposition to the development of Turcot
syndrome, and may also be associated with deletions in chromosome 6
(12–14). The SHH subgroup is characterized by
the dysregulation of the sonic hedgehog pathway. It accounts for
~30% of all medulloblastomas, and is associated with an
intermediate prognosis (9,10). SHH medulloblastomas are also
associated with Gorlin syndrome (15,16). SHH
medulloblastomas principally exhibit the inactivation of patched 1
and suppressor of fused homolog, missense mutations in smoothened
(SMO), and amplifications of GLI family zinc finger 2. These
genetic alterations promote the translocation of the transcription
factor, GLI, into the nucleus, which can lead to the activation of
cancer driver genes (17). WNT and
SHH are the best characterized subgroups of medulloblastoma, which
may enable specific therapeutic targeting.
Group 3 (G3) represents ~25% of medulloblastoma
cases, and is characterized by amplifications in MYCN and
orthodenticle homeobox 2 (OTX2), the gain of chromosomes 7
and 17q, and the loss of chromosomes 10q or 16q (9). Group 4 (G4) is the most common subgroup,
accounting for ~35% of all cases (9,10); it is
biologically heterogeneous and difficult to characterize due to its
molecular markers being shared with G3 and SHH. These markers
include mutations in lysine demethylase, and amplifications of OTX2
or lysine methyltransferase 2D, among others. G3 and G4 are
associated with a relatively poor prognosis compared with the WNT
and SHH subgroups (9).
The high heterogeneity and prevalence of G3 and G4
medulloblastomas highlight the requirement to establish molecular
classifications for each subgroup based on specific markers
detectable by inexpensive techniques. Ellison et al
(18) reported an immunohistochemical
method for distinguishing between SHH/WNT and non-SHH/WNT tumors.
This method considers specific markers of each subgroup, including
GRB2 associated binding protein 1, β-catenin, filamin A and Yes
associated protein 1. However, it cannot differentiate between the
G3 and G4 subgroups. The identification of novel biomarkers would
increase the efficiency of molecular diagnosis, and may be achieved
through the identification and characterization of the key pathways
that are distinctly dysregulated in the G3 or G4 subgroups.
In the present study, an in silico analysis
of the 4 molecular subgroups of medulloblastoma was performed with
the aim of characterizing potential novel markers for the
identification of each subgroup, with an emphasis on the
characterization of G4. A number of key markers were identified,
allowing the classification of further subdivisions within G4. This
data may contribute to the more effective classification of
medulloblastoma, and aid in the identification of alternative
therapeutic targets, particularly for G4 medulloblastoma.
Materials and methods
Datasets
Affymetrix microarray U133_Plus 2 Array data was
downloaded from the Gene Expression Omnibus database (http://www.ncbi.nlm.nih.gov/geo). This included
medulloblastoma and healthy control cerebellar tissue (CT) data.
The microarray data included various characteristics, including the
sample information (tissue type and disease status), RNA
purification method, RNA quality, RNA integrity, RNA concentration
and the microarray protocol used. Tumor expression profiles were
grouped according to the medulloblastoma molecular subgroups. The
following datasets were included in the present study: GSE4036,
GSE10327 (19–21), GSE37418 (20–22),
GSE44971 (23) and GSE49243 (20,24).
Data analysis
Bioinformatics analysis was performed using the
Partek Genomics Suite version 6.6 (Partek, Inc., St Louis,
Missouri, USA). In brief, all datasets were uploaded to the Partek
Genomics Suite and summarization was performed with Median Polish
analysis with quantile normalization and background correction
using a robust multiarray average. The probe set was then
transformed to log2. A second selection of the
microarray dataset was performed based on an analysis by Quality
Control Microarray processing according to a previous study
(25). In the aforementioned analysis
the fluorescence intensity of the microarray quality control was
evaluated using bioB, bioC, bioD and Cre, at final concentrations
of 1.5, 5, 25 and 100 pM, respectively. Additionally, Poly-A RNA
controls were evaluated using Dap, Thr, Phe and Lys to final
concentrations of 1:7,500, 1:25,000, 1:50,000 and 1:100,000,
respectively. Microarrays without the relative signal intensities
of Poly-A RNA and hybridization controls were excluded from the
present study.
Differentially expressed genes were determined using
the data from healthy CT to define baseline expression. The
geometric least squares means model was used for the following
independent analyses: WNT vs. CT; SHH vs. CT; G3 vs. CT; and G4 vs.
CT. Differential gene expression was also detected between G3 and
G4 using G3 as the baseline, between the subsequently defined
subgroups G4α and G4β using G4β as the baseline, and between WNT,
SHH, G3, G4α and G4β, using CT as the baseline. Significantly
differentially expressed genes were detected by an analysis of
variance using a false discovery rate threshold of <0.005 and
fold change (FC) thresholds of <-5 and >5. Hierarchical
clustering heatmaps were constructed using the Euclidean distance
method.
Systems biology
The differentially expressed genes were uploaded to
the MetaCore portal (Thomson Reuters, New York City, NY, USA) for
enrichment analysis, in which FC was used as the parameter for
differential expression. Significant signaling pathways were
selected using a Z-score, as outlined in our previous study
(26).
Results
Medulloblastoma expression profiles
can be grouped based on the molecular subgroups
Initially, the data from 237 microarray expression
profiles of medulloblastoma tumor and CT samples were downloaded.
All microarrays were subjected to quality control analysis; ~42% of
all arrays were excluded based on the Poly-A RNA controls. The
signal intensity demonstrated a high level of variation, as
previously reported (25,27).
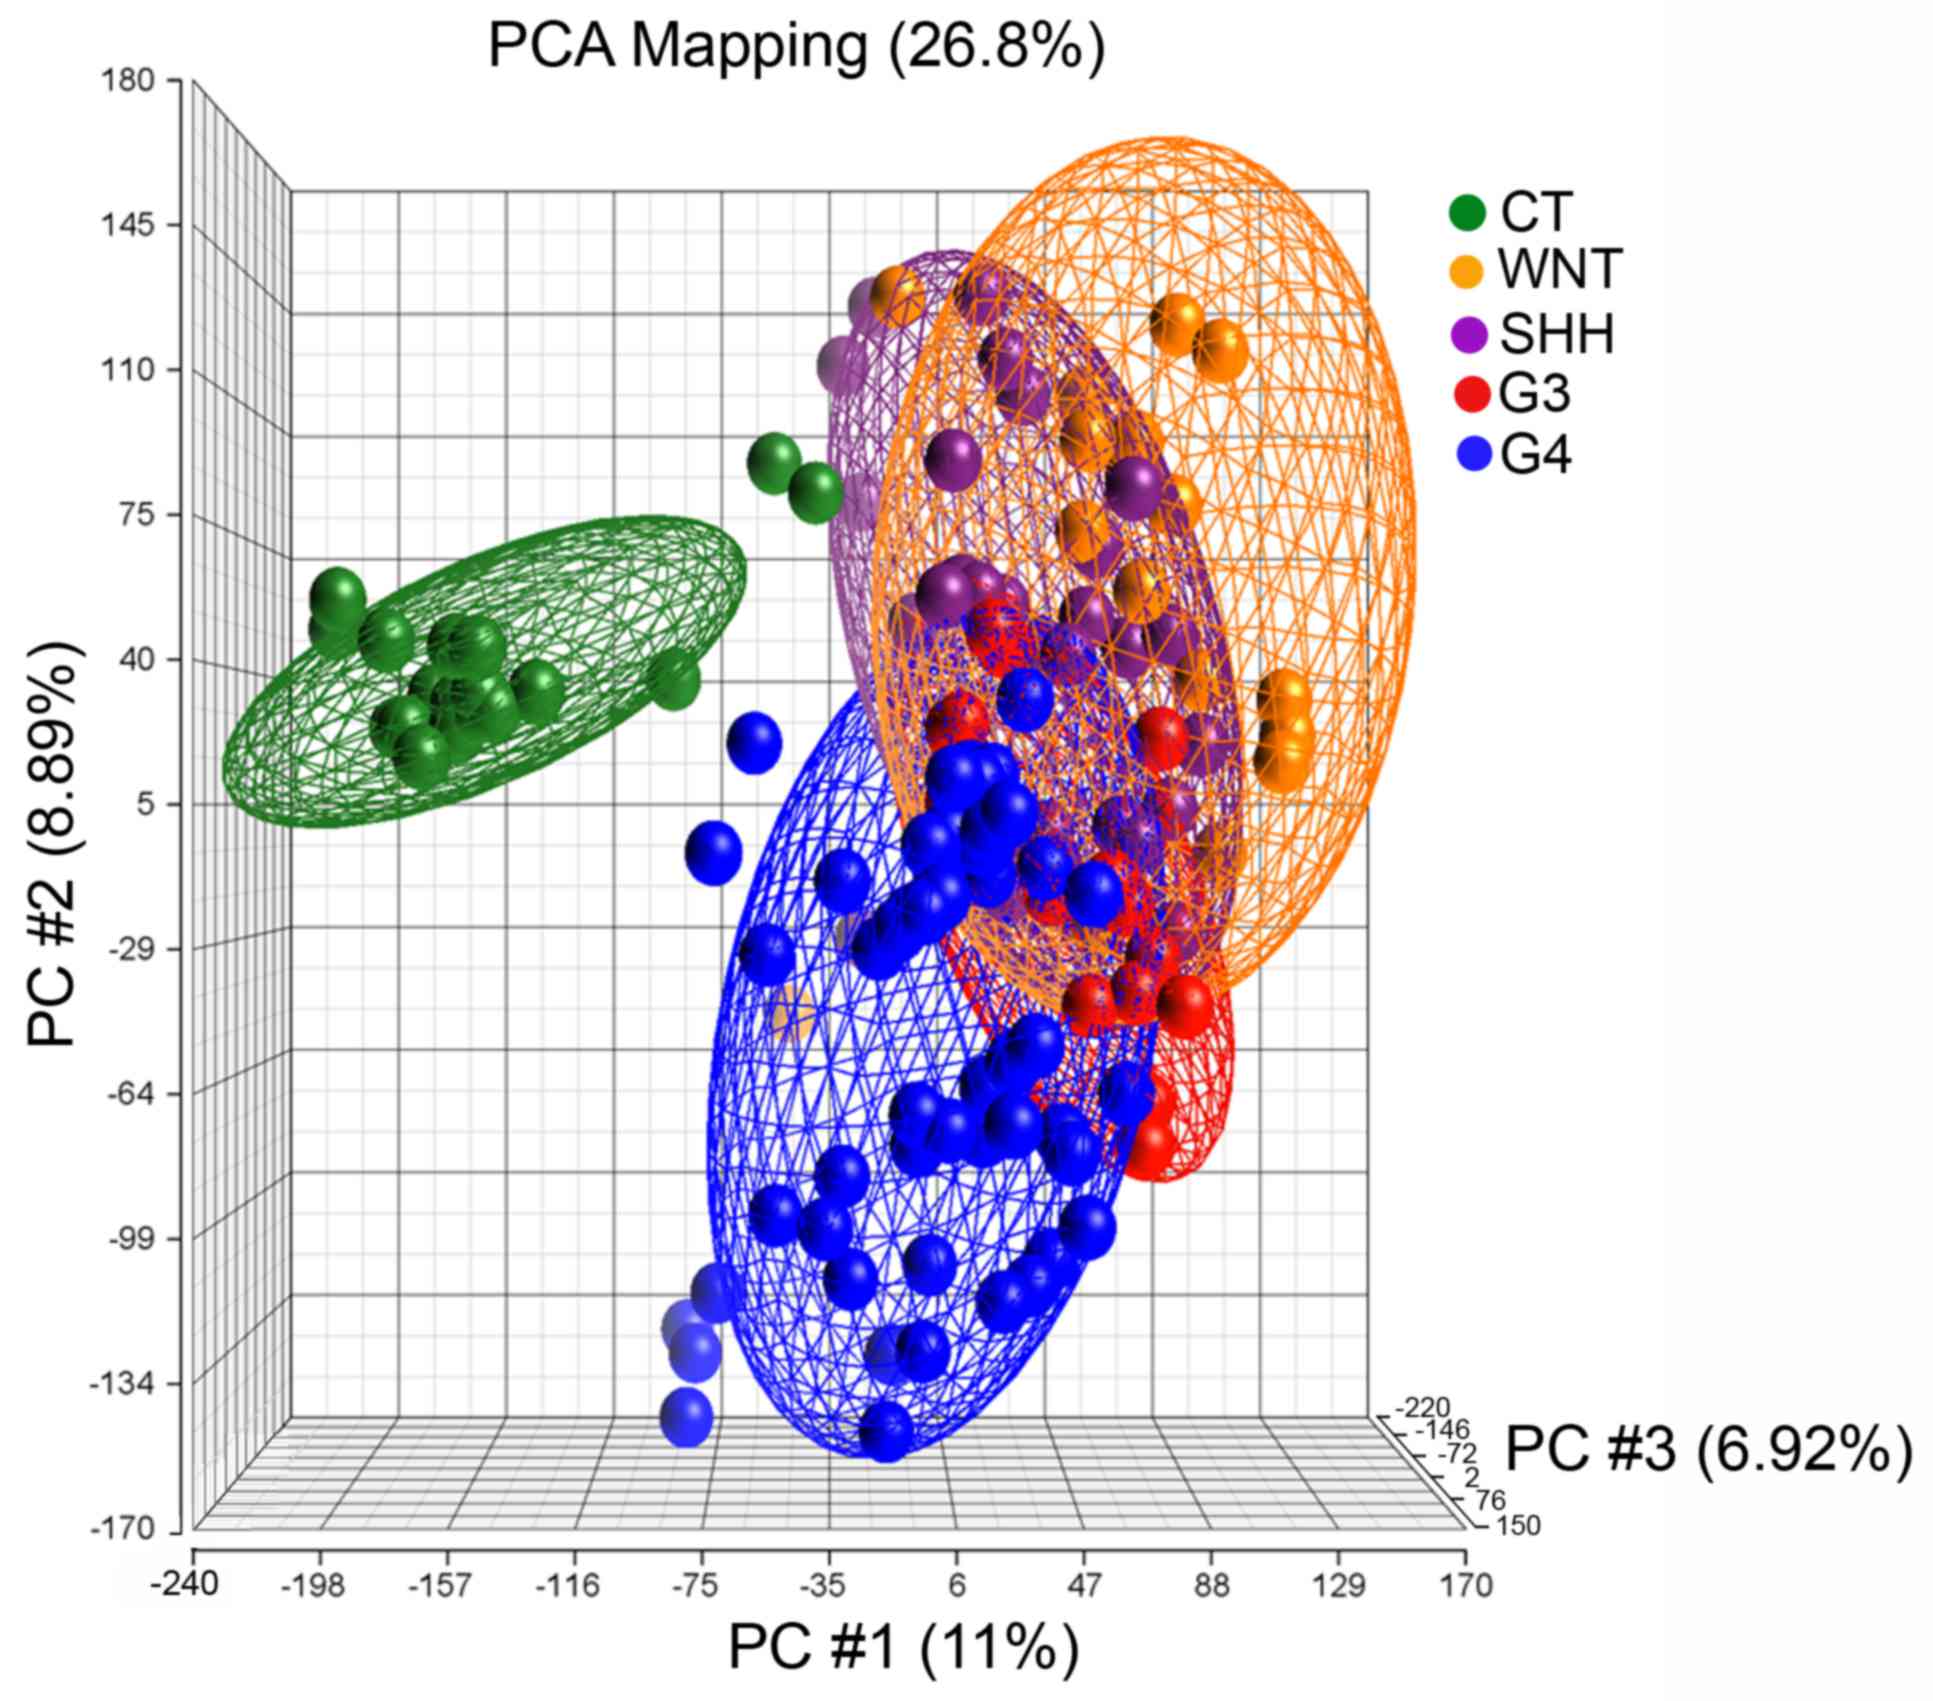
A total of 137 expression profiles were included in
the analysis, including profiles from the following molecular
subgroups: WNT, n=17; SHH, n=27; G3, n=20; G4, n=53 and healthy CT,
n=20 (Table I). The medulloblastoma
samples were successfully grouped based on their molecular
classification using the CT group as a reference control (Fig. 1).
 | Table I.DEGs in molecular subgroups compared
with the control cerebellar tissues (n=20). |
Table I.
DEGs in molecular subgroups compared
with the control cerebellar tissues (n=20).
|
|
| DEGs, n |
|---|
|
|
|
|
|---|
| Subgroup name | Samples, n | Upregulated | Downregulated | Total |
|---|
| WNT | 17 | 1,073 | 1,092 | 2,165 |
| SHH | 27 | 728 | 991 | 1,719 |
| G3 | 20 | 673 | 1,117 | 1,790 |
| G4 | 53 | 602 | 801 | 1,403 |
Gene expression profiling revealed potential targets
for molecular subgroup classification. The expression profiles of
the medulloblastoma molecular subgroups compared with healthy CT
revealed numerous differences. The number of upregulated or
downregulated differentially expressed genes were as follows: WNT,
n=2,165; SHH, n=1,719; G3, n=1,790; and G4, n=1,403 (Fig. 2; Table
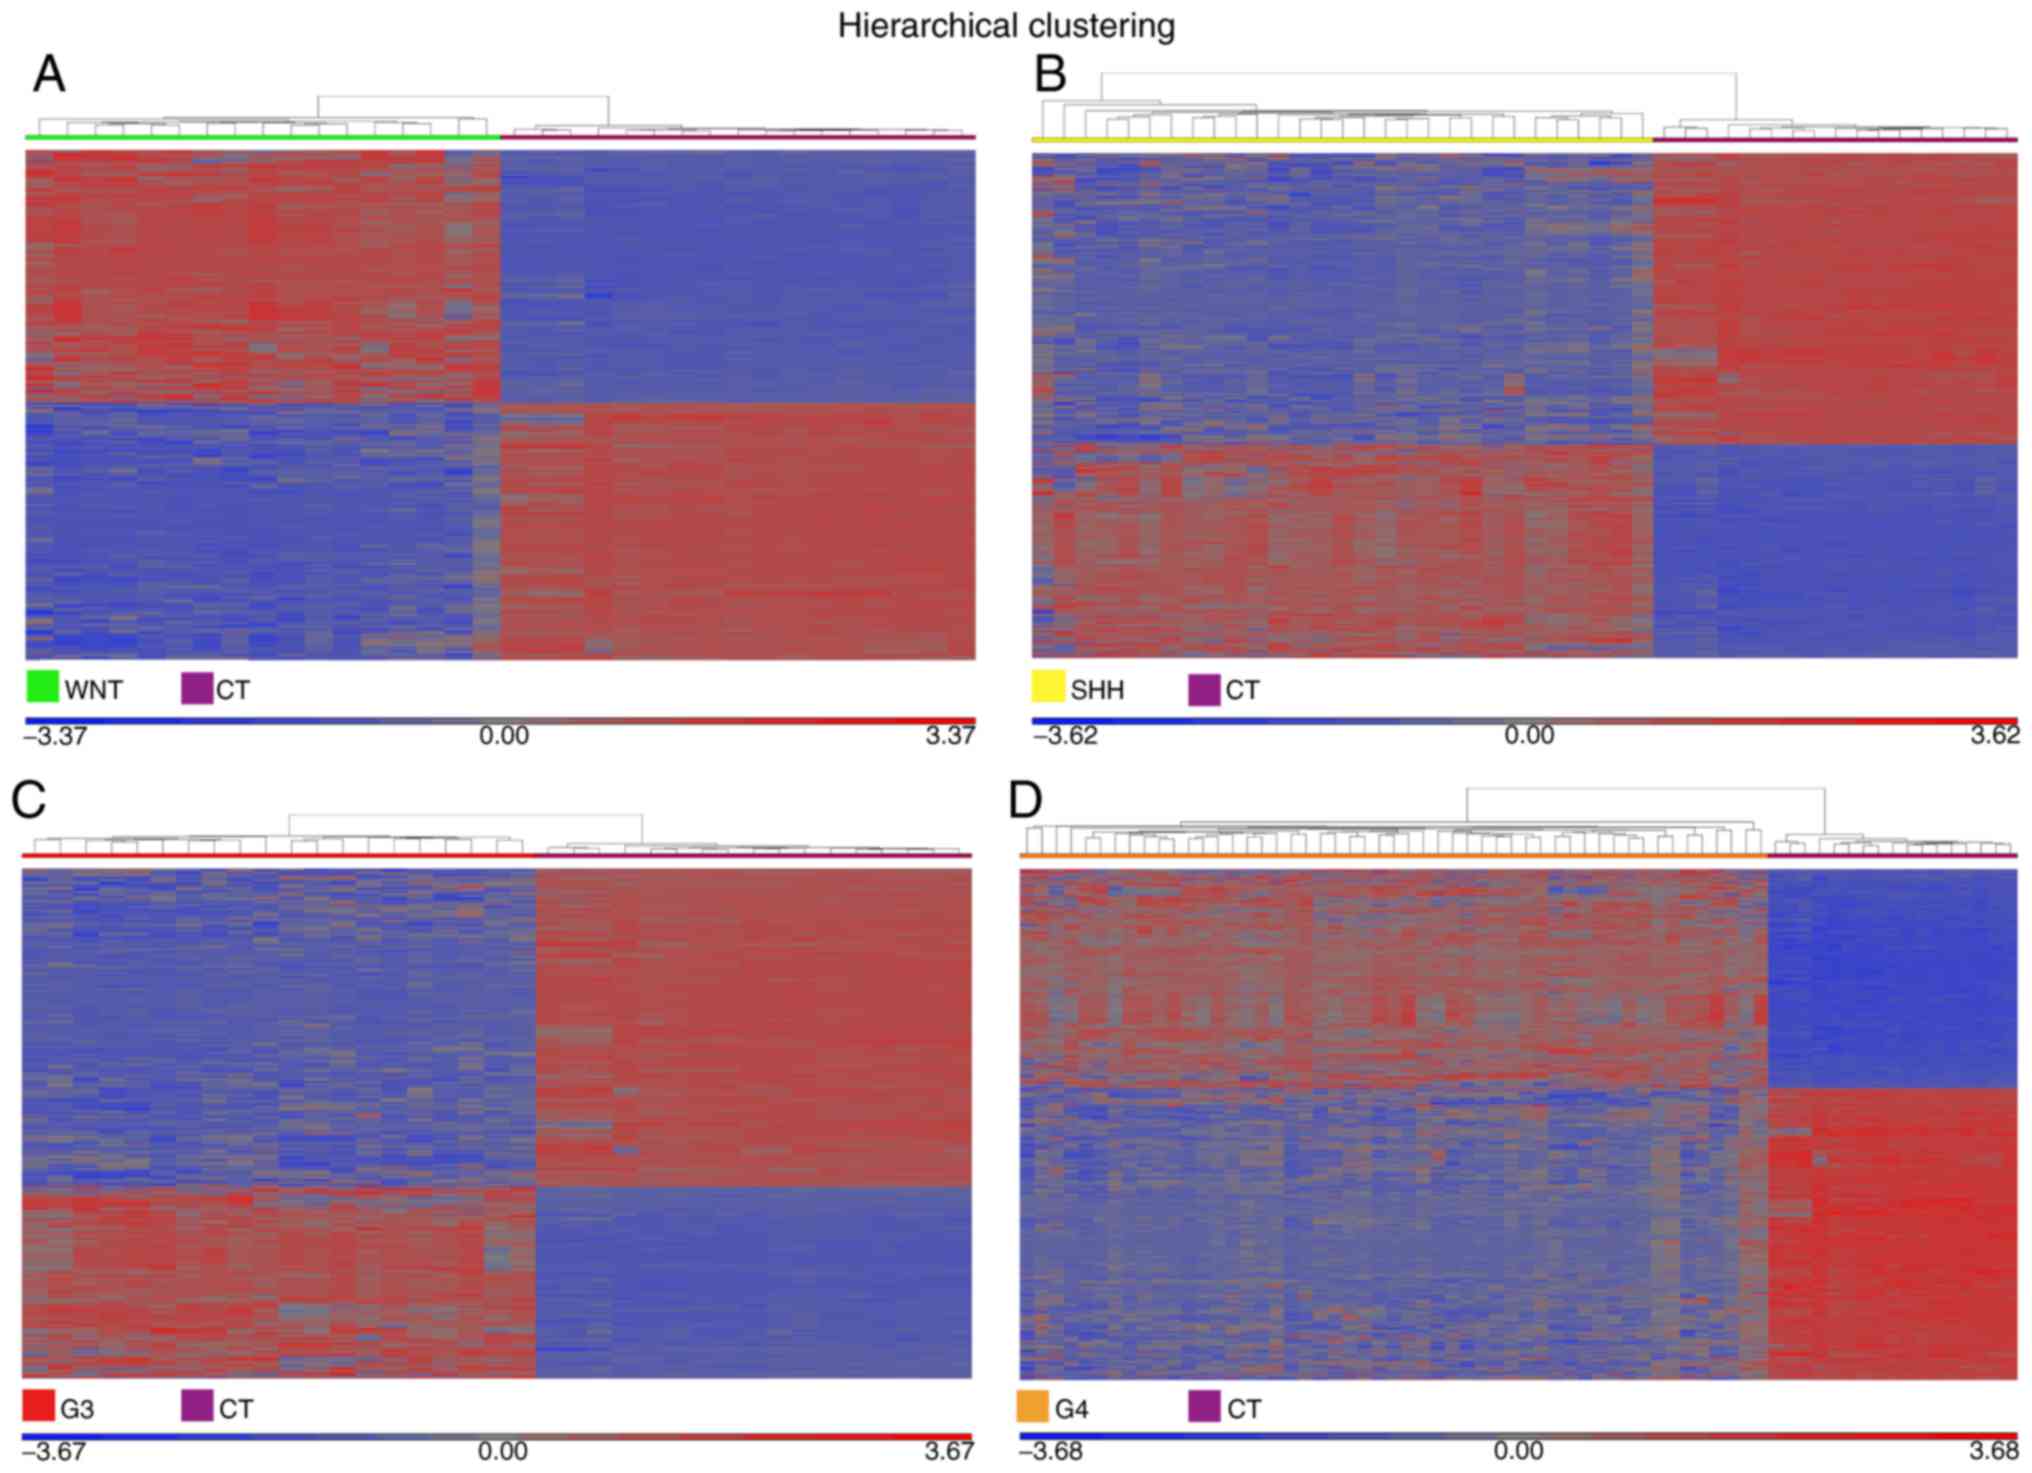
I). The transcripts overexpressed in the WNT subgroup included
frizzled class receptor 10 (FC, 55.2), Dickkopf WNT signaling
pathway inhibitor 1 (FC, 16.6), forkhead box D1 (FC, 10.6), ALK
receptor tyrosine kinase (FC, 6.4) and forkhead box L2 (FC, 6.3;
Fig. 3A). Claudin 1 (FC, 12.33), ADAM
metallopeptidase with thrombospondin type 1 motif 6 (FC, 11.43) and
growth arrest specific 1 (FC, 8.19) were upregulated in the SHH
subgroup (Fig. 3B); FEZ family zinc
finger 2 (FC, 6.83), ADP Ribosylation Factor Like GTPase 4D (FC,
6.41) and sperm associated antigen 5 (FC, 5.25) (Fig. 3C) were upregulated in G3; G4 exhibited
the overexpression of caspase recruitment domain family member 10
(FC, 10.23), CXXC finger protein 4 (FC, 6.64), SH2 domain
containing adaptor protein B (FC, 5.92) and CXC motif chemokine
ligand 14 (FC, 5.38; Fig. 3D).
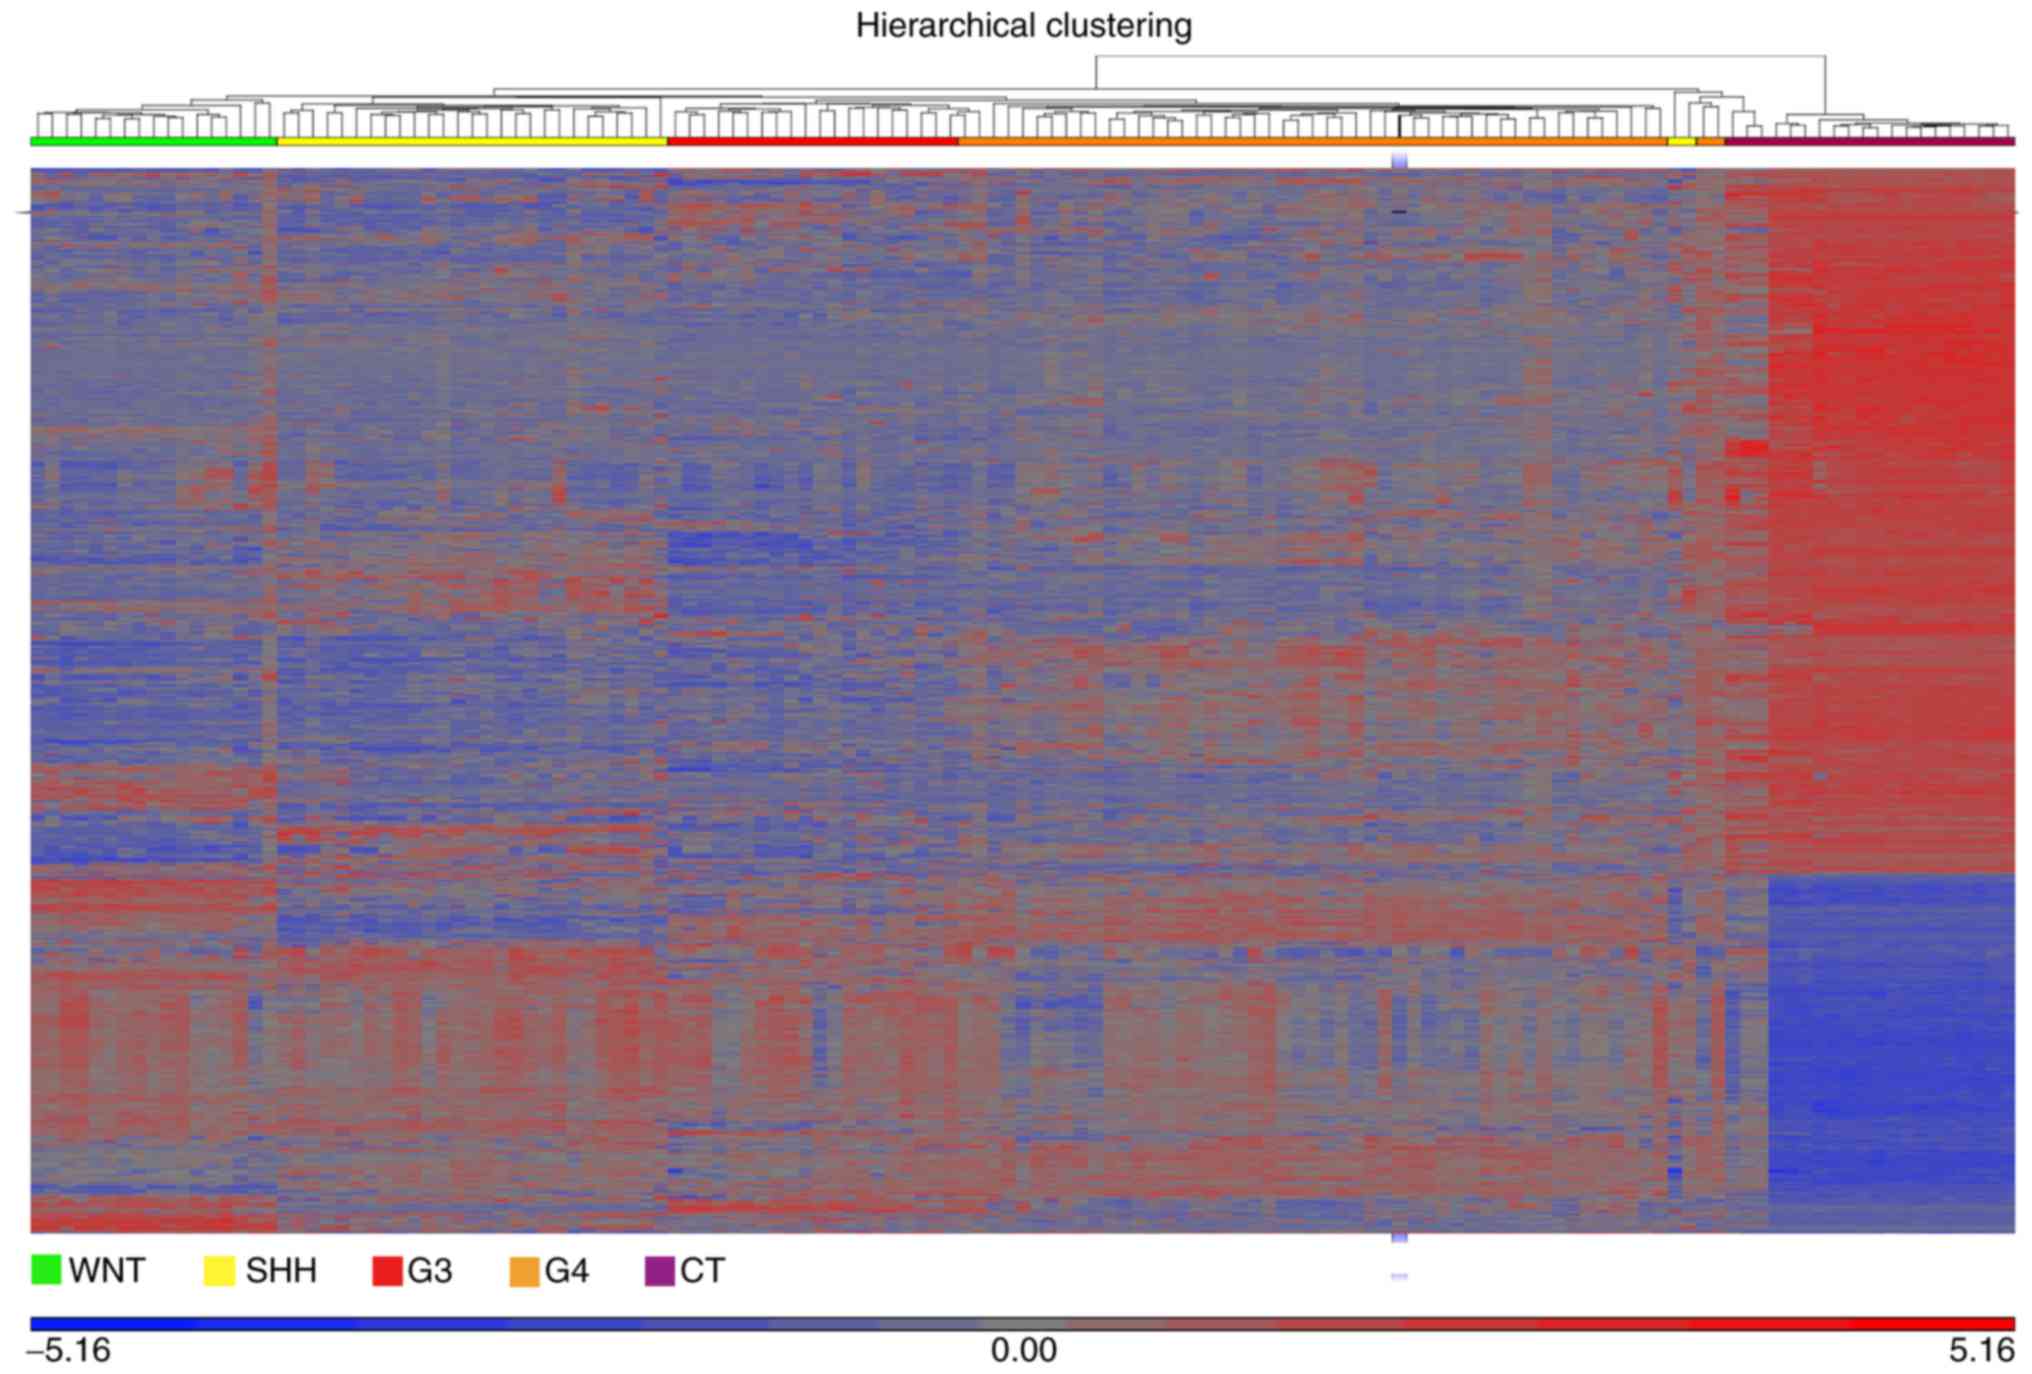 | Figure 2.Dysregulated genes in
medulloblastoma. The heatmap illustrates the differentially
expressed genes in the 4 molecular subgroups of medulloblastoma
compared with CT. Differential gene expression was identified by an
analysis of variance. The plot was generated for up- and
downregulated genes using a fold change threshold of >5 or
<-5, and a false discovery rate threshold of <0.005. The
profiles of the WNT, SHH, G3 and G4 subgroups were examined against
the baseline CT profile using the geometric least squares means
model. WNT, green; SHH, yellow; G3, red; G4, orange; and CT,
purple. CT, control cerebellar tissue; G3, group 3 medulloblastoma;
G4, group 4 medulloblastoma. |
Differential gene expression between
G3 and G4 reveals a novel subgroup in G4
The molecular classification of medulloblastoma and
other types of CNS tumor was previously investigated (28). Defining the expression profiles
associated with G3 and G4 has been a particular challenge in
medulloblastoma research, as the groups share several molecular
characteristics and are considered the most internally
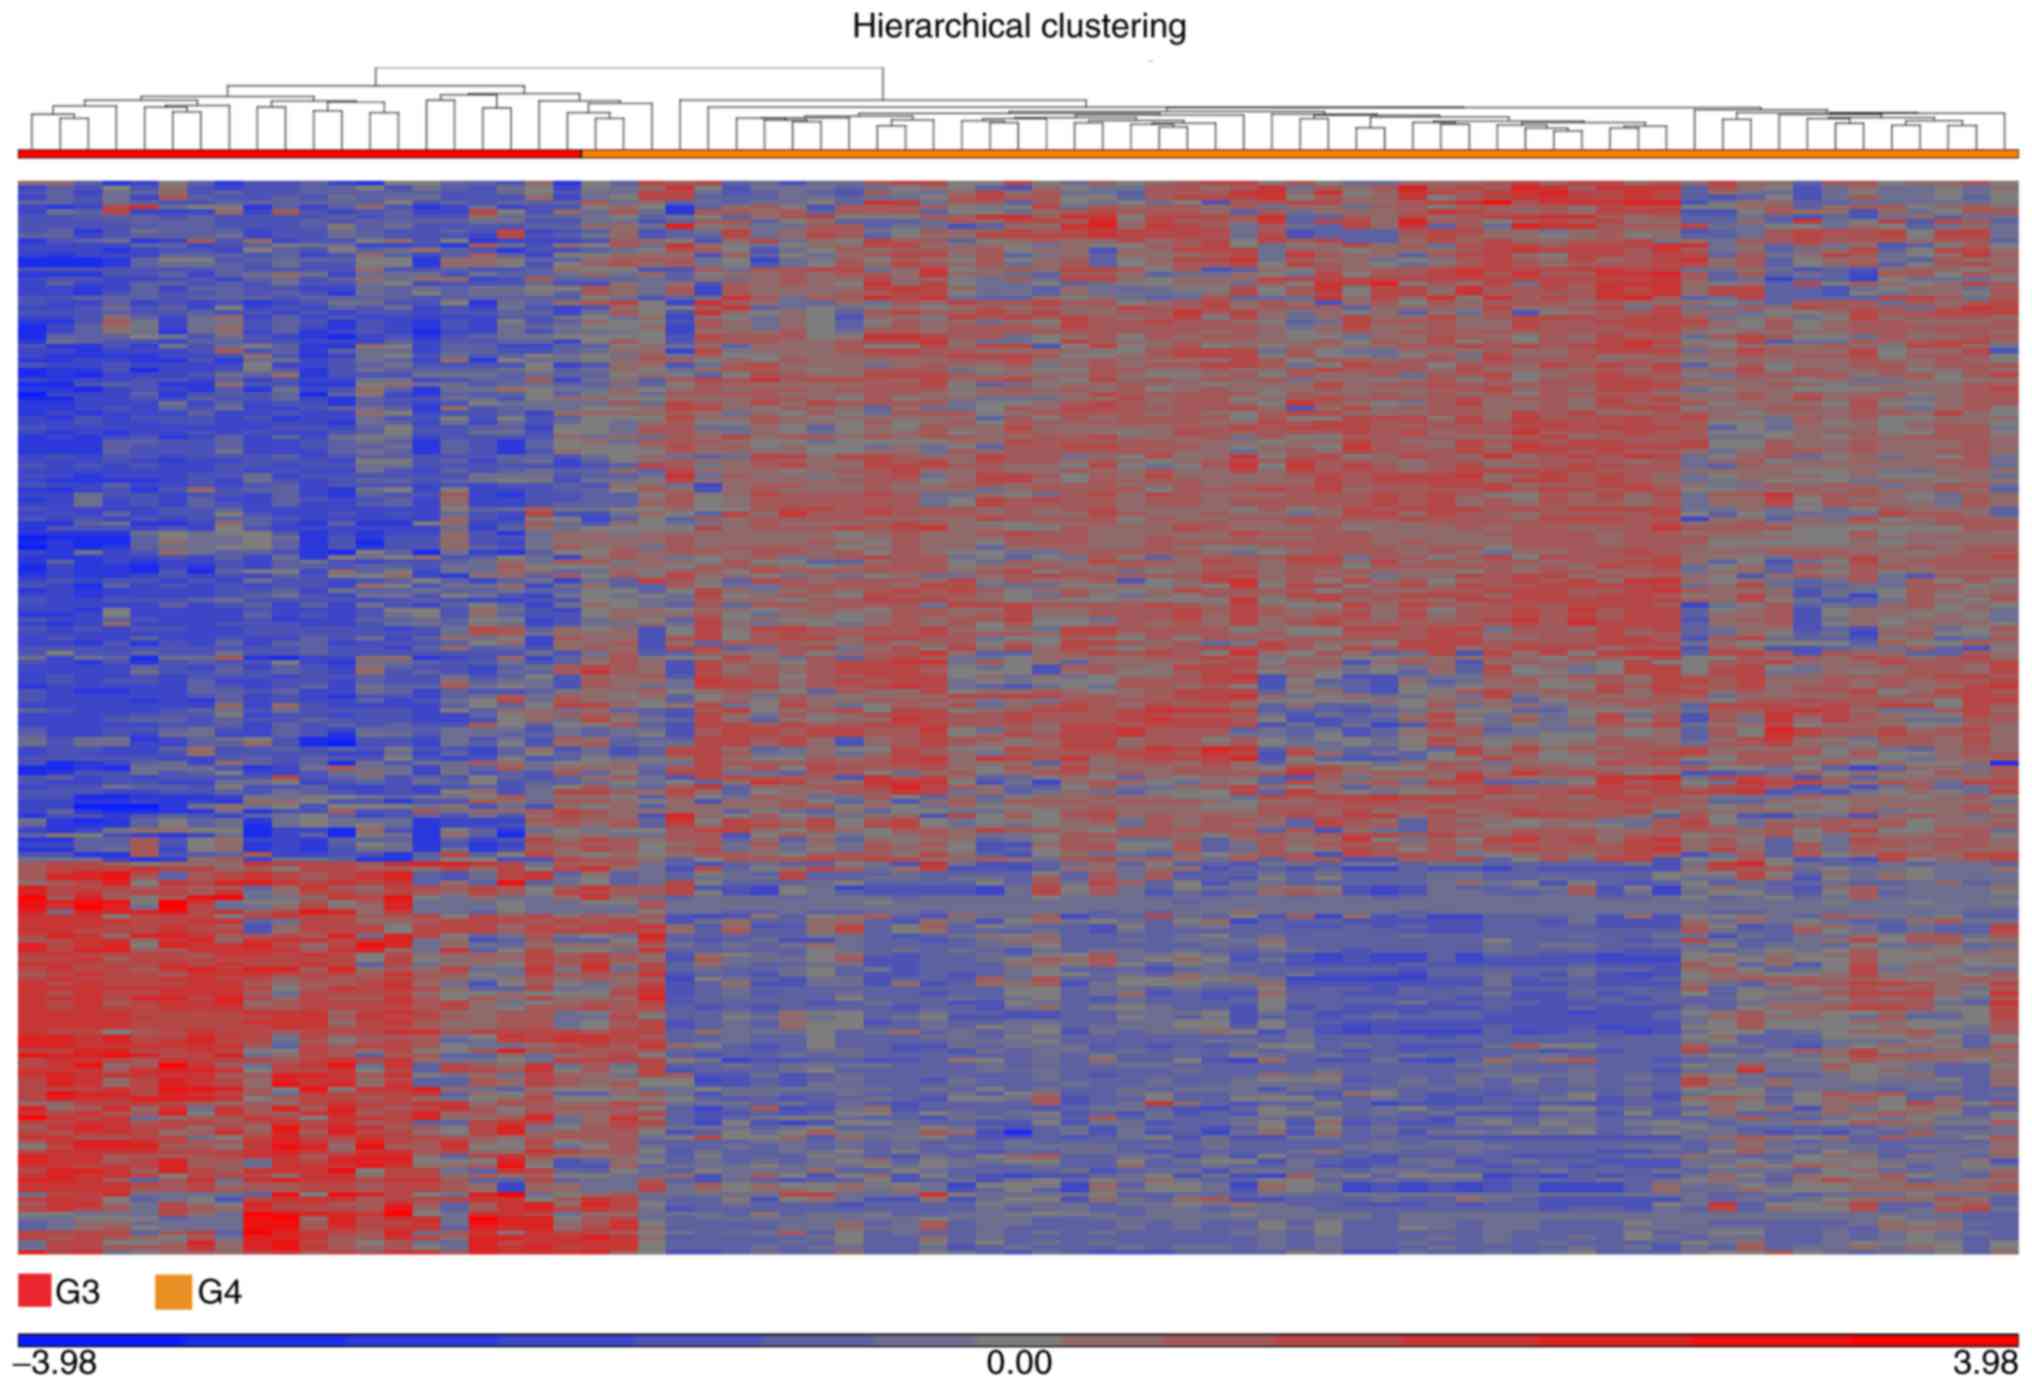
heterogeneous (29). In order to
identify potential molecular markers associated with G3 and G4, G3
was used for a comparative analysis against G4. The analysis
identified 224 differentially expressed genes; 142 were upregulated
and 82 were downregulated in G4 compared with G3 (Fig. 4). The differentially expressed genes
allowed clustering into 2 distinct groups, representing G3 and G4,
as illustrated by the heatmap. However, the G4 cluster unexpectedly
demonstrated 2 profiles, with a small secondary cluster
representing 12 samples (~25%; Fig.
4).
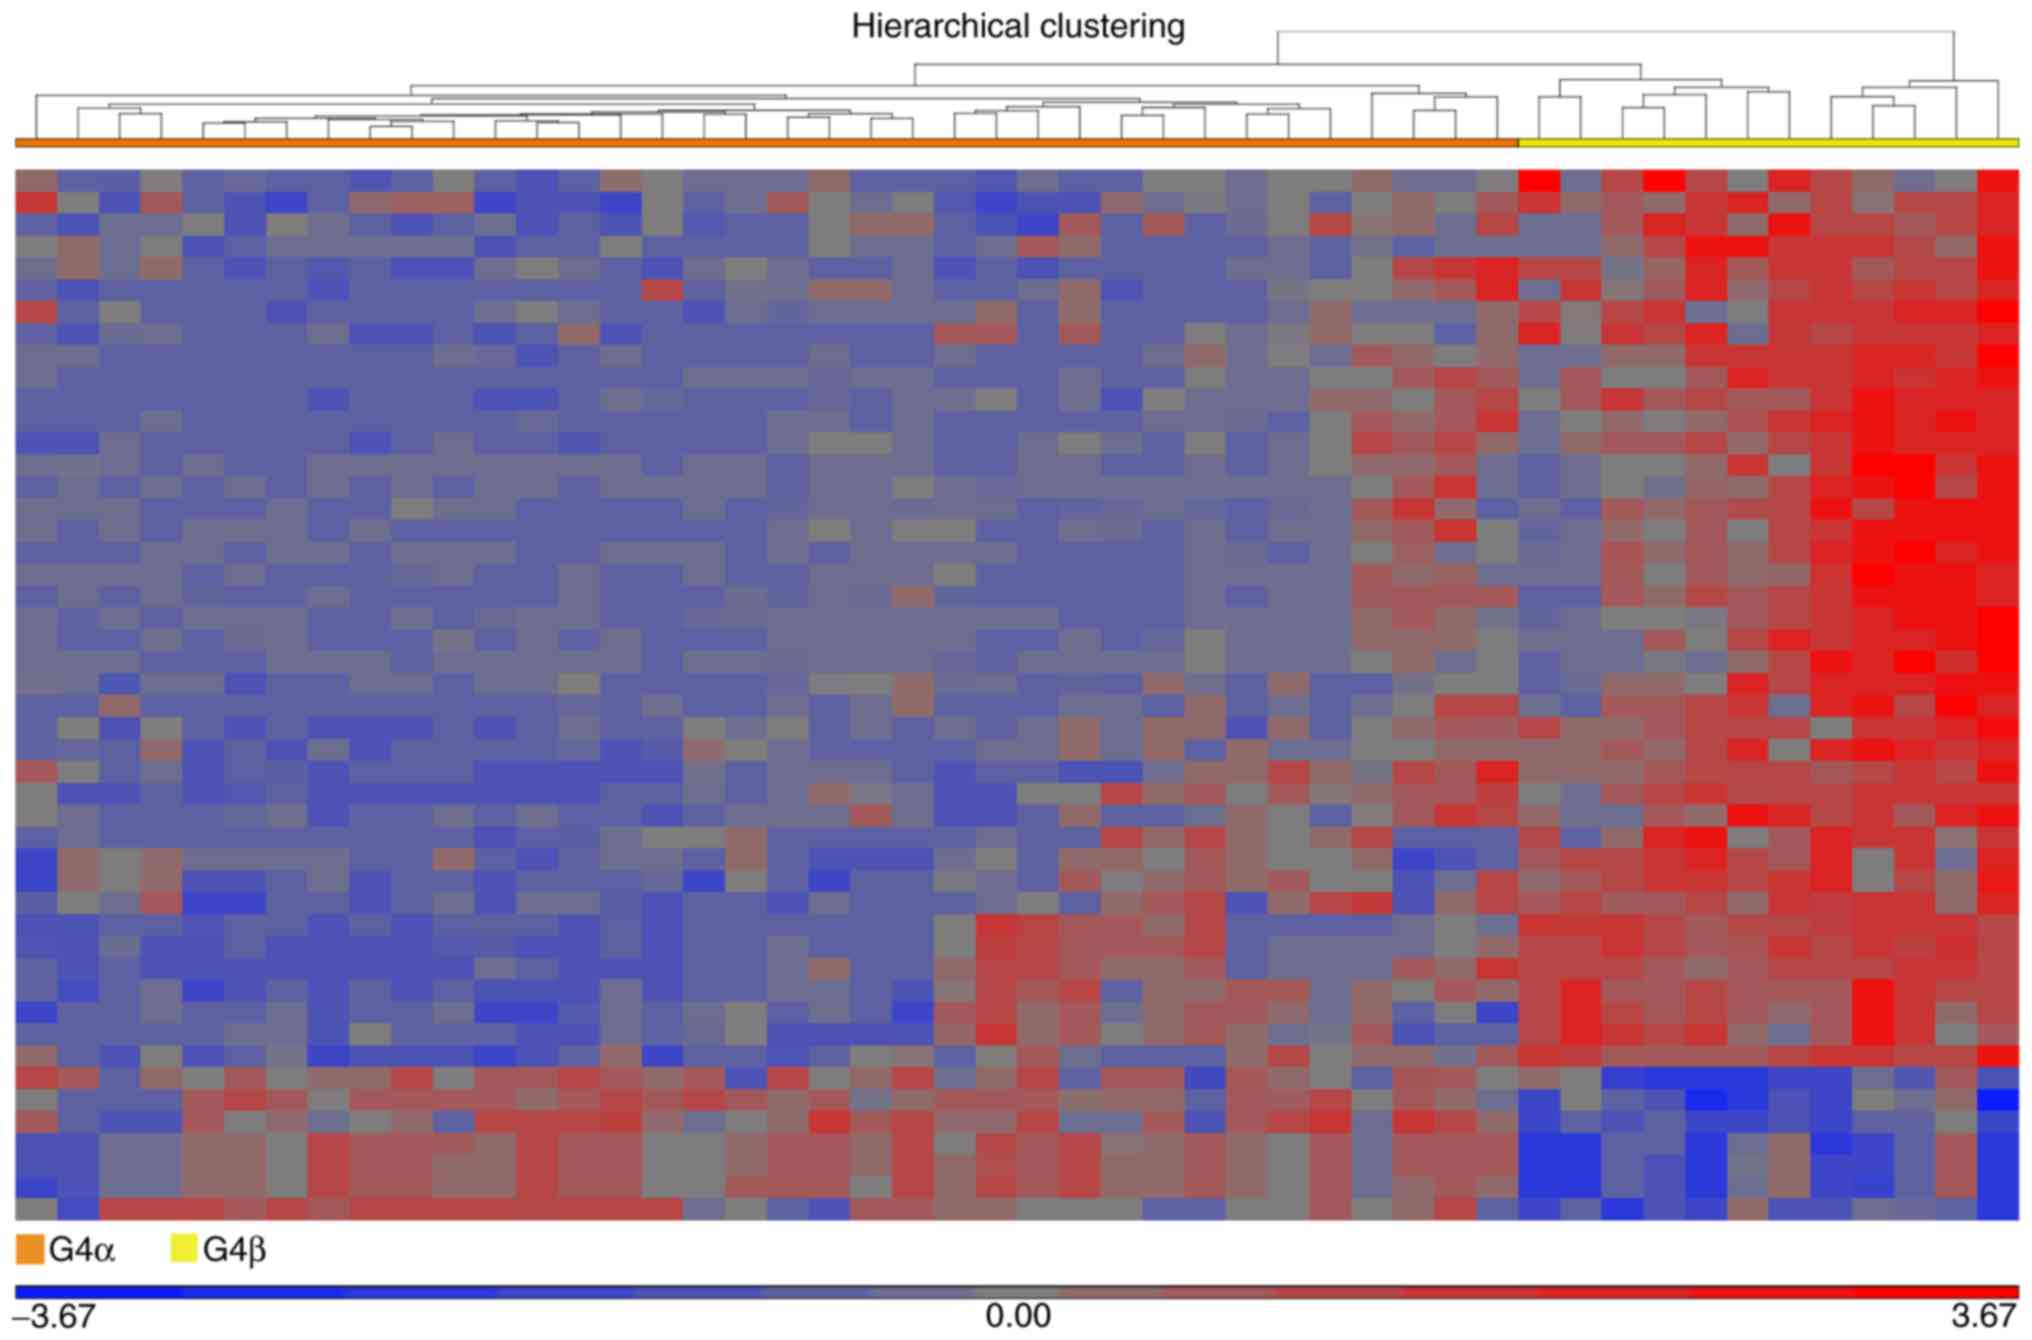
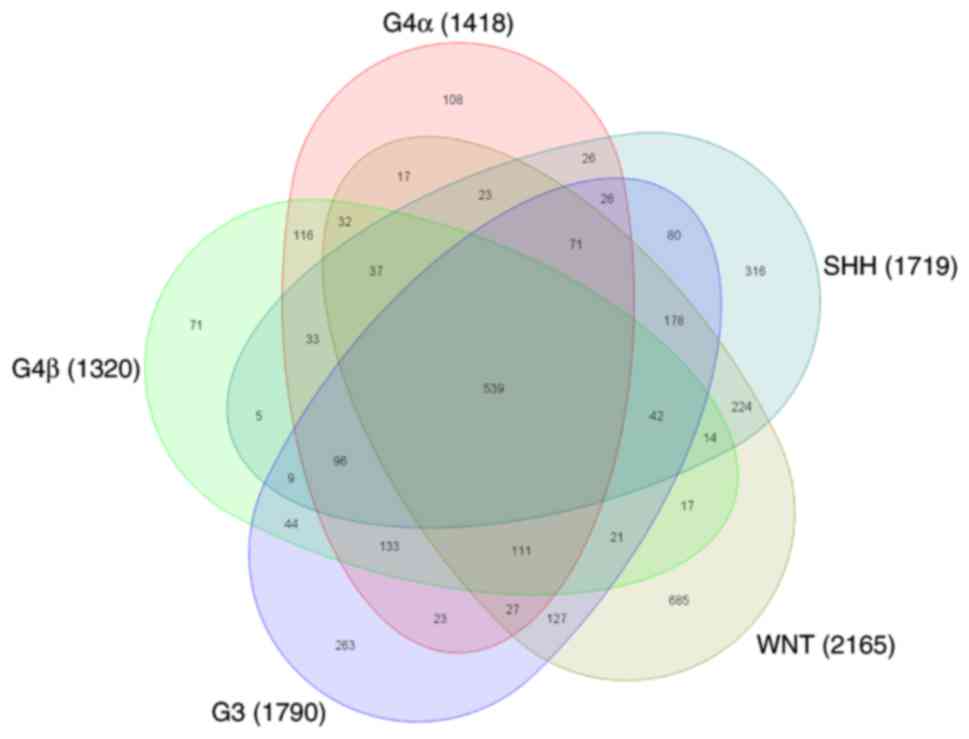
The results indicated a potential sub-classification
of G4. In order to identify the molecular differences within G4, G4
samples were sub-classified as G4α and G4β [36 (75%) and 12 samples
(25%), respectively; (Fig. 5)]. A
comparative analysis was performed using G4β as the baseline
against G4α. The analysis identified a differential expression
profile for G4α, with 3 genes upregulated and 33 downregulated
(Table II). The 5 molecular
subgroups of medulloblastoma were integrated for a comparative
analysis using the CT profile as the baseline against WNT, SHH, G3,
G4α, and G4β. The WNT, SHH, and G3 subgroups retained the same
molecular profiles as the first analysis of only 4 subgroups,
whereas the G4α and G4β subgroups demonstrated 1,418 and 1,320
differentially expressed genes, respectively (Fig. 6). However, a number of molecules
shared expression patterns among the molecular subgroups, including
G4α and G4β, which would be expected, as molecular similarities
between medulloblastoma tumors of all types are inevitable
(Table III).
| Table II.Differentially expressed genes in the
G4α subgroup compared with the G4β subgroup. |
Table II.
Differentially expressed genes in the
G4α subgroup compared with the G4β subgroup.
| Gene symbol | Gene name | Fold change (G4α
vs. G4β) |
|---|
| TOX3 | TOX high mobility
group box family member 3 | 8.61506 |
| SNCAIP | Synuclein α
interacting protein | 6.85187 |
| KCNIP4 | Potassium
voltage-gated channel interacting protein 4 | 6.27879 |
| PLXDC1 | Plexin domain
containing 1 | −3.02931 |
| BCL11B | B-cell CLL/lymphoma
11B | −3.06849 |
| ABCA4 | ATP-binding
cassette sub-family A member 4 | −3.07119 |
| GALNT10 | Polypeptide
N-acetylgalactosaminyltransferase 10 | −3.13204 |
| GLCCI1 | Glucocorticoid
induced transcript 1 | −3.22556 |
| FAM126A | Family with
sequence similarity 126, member A | −3.24904 |
| SLC1A7 | Solute carrier
family 1, member 7 | −3.29459 |
| GALNT14 | Polypeptide
N-acetylgalactosaminyltransferase 14 | −3.33326 |
| IGSF11 | Immunoglobulin
superfamily, member 11 | −3.33354 |
| SHROOM2 | Shroom family
member 2 | −3.39392 |
| CNTN3 | Contactin 3 | −3.83419 |
| GNGT2 | G protein subunit γ
transducin 2 | −3.85892 |
| AIPL1 | Aryl hydrocarbon
receptor interacting protein-like 1 | −3.99598 |
| RASGRF2 | Ras
protein-specific guanine nucleotide-releasing factor 2 | −4.01560 |
| RP1 | Retinitis
pigmentosa 1 | −4.04201 |
| NR2E3 | Nuclear receptor
subfamily 2, group E, member 3 | −4.36478 |
| CRX | Cone-rod
homeobox | −4.41841 |
| LAPTM4B | Lysosomal protein
transmembrane 4β | −4.56260 |
| PTPN13 | Protein tyrosine
phosphatase, non-receptor type 13 | −4.76854 |
| PDC | Phosducin | −4.80708 |
| RCVRN | Recoverin | −4.91791 |
| ANO2 | Anoctamin 2 | −5.11475 |
| MPP4 | Membrane protein,
palmitoylated 4 | −5.39617 |
| RD3 | Retinal
degeneration 3 | −5.39937 |
| FAM19A4 | Family with
sequence similarity 19, member A4, C-C motif chemokine-like | −5.76661 |
| CDHR1 | Cadherin-related
family member 1 | −5.80075 |
| CABP5 | Calcium binding
protein 5 | −7.79064 |
| ZNF385B | Zinc finger protein
385B | −8.85360 |
| IMPG2 | Interphotoreceptor
matrix proteoglycan 2 | −9.61426 |
| PRSS12 | Protease, serine
12 | −9.84918 |
| SST | Somatostatin | −9.92109 |
| NRL | Neural retina
leucine zipper | −10.53520 |
| PDE6H | Phosphodiesterase
6H | −11.56650 |
| Table III.Potential therapeutic targets in
medulloblastoma tumors, including the top ten upregulated and
downregulated differentially expressed genes in the 5 subgroups of
medulloblastoma. |
Table III.
Potential therapeutic targets in
medulloblastoma tumors, including the top ten upregulated and
downregulated differentially expressed genes in the 5 subgroups of
medulloblastoma.
|
| Fold change vs.
control cerebellar tissue |
|---|
|
|
|
|---|
| Gene symbol | WNT | SHH | G3 | G4α | G4β |
|---|
| SOX11 | 50.4508 | 159.2550 | 114.7920 | 214.6350 | 157.7430 |
| LHX2 | 19.0600 | 18.1300 | 62.1164 | 118.7020 | 45.9915 |
| KIAA0101 | 89.8103 | 97.5187 | 119.3500 | 106.7370 | 70.2860 |
| TOP2A | 97.4276 | 74.4959 | 95.3006 | 89.4034 | 56.8238 |
| TMSB15A/B | 27.3665 | 131.5370 | 36.4977 | 80.2035 | 74.1441 |
| DACH1 | 25.9512 | 23.0074 | 28.4259 | 74.5587 | 41.3941 |
| SOX4 | 13.2496 | 15.9908 | 25.3652 | 64.0049 | 53.1116 |
| DACH1 | 19.2667 | 14.5598 | 16.1719 | 61.2870 | 21.7303 |
| RRM2 | 48.8038 | 47.4022 | 75.8280 | 55.5282 | 46.5205 |
| IGFBPL1 | 68.8801 | 60.7771 | 10.3575 | 50.0114 | 48.5435 |
| ITPR1 | −26.0343 | −27.0244 | −78.6472 | −58.7188 | −47.0085 |
| SYT1 | −8.2123 | −8.1780 | −25.8050 | −62.9443 | −37.5653 |
| SPHKAP | −98.0768 | −21.4717 | −91.2947 | −64.4953 | −42.0679 |
| PDE1A | −119.2340 | −13.2837 | −128.5230 | −66.5903 | −25.8941 |
| CDR1 | −78.4458 | −66.2995 | −75.0443 | −83.1560 | −78.4922 |
| CBLN3 | −82.5110 | −97.7424 | −131.9180 | −97.2893 | −71.7417 |
| CRTAM | −142.5620 | −119.6880 | −176.9190 | −98.6054 | −91.3960 |
| CALB1 | −90.1248 | −100.8540 | −50.7010 | −121.3370 | −113.9070 |
| PVALB | −125.1260 | −90.7036 | −243.5880 | −175.7630 | −113.7100 |
| GABRA6 | −254.6810 | −245.7720 | −171.3970 | −192.7920 | −133.8460 |
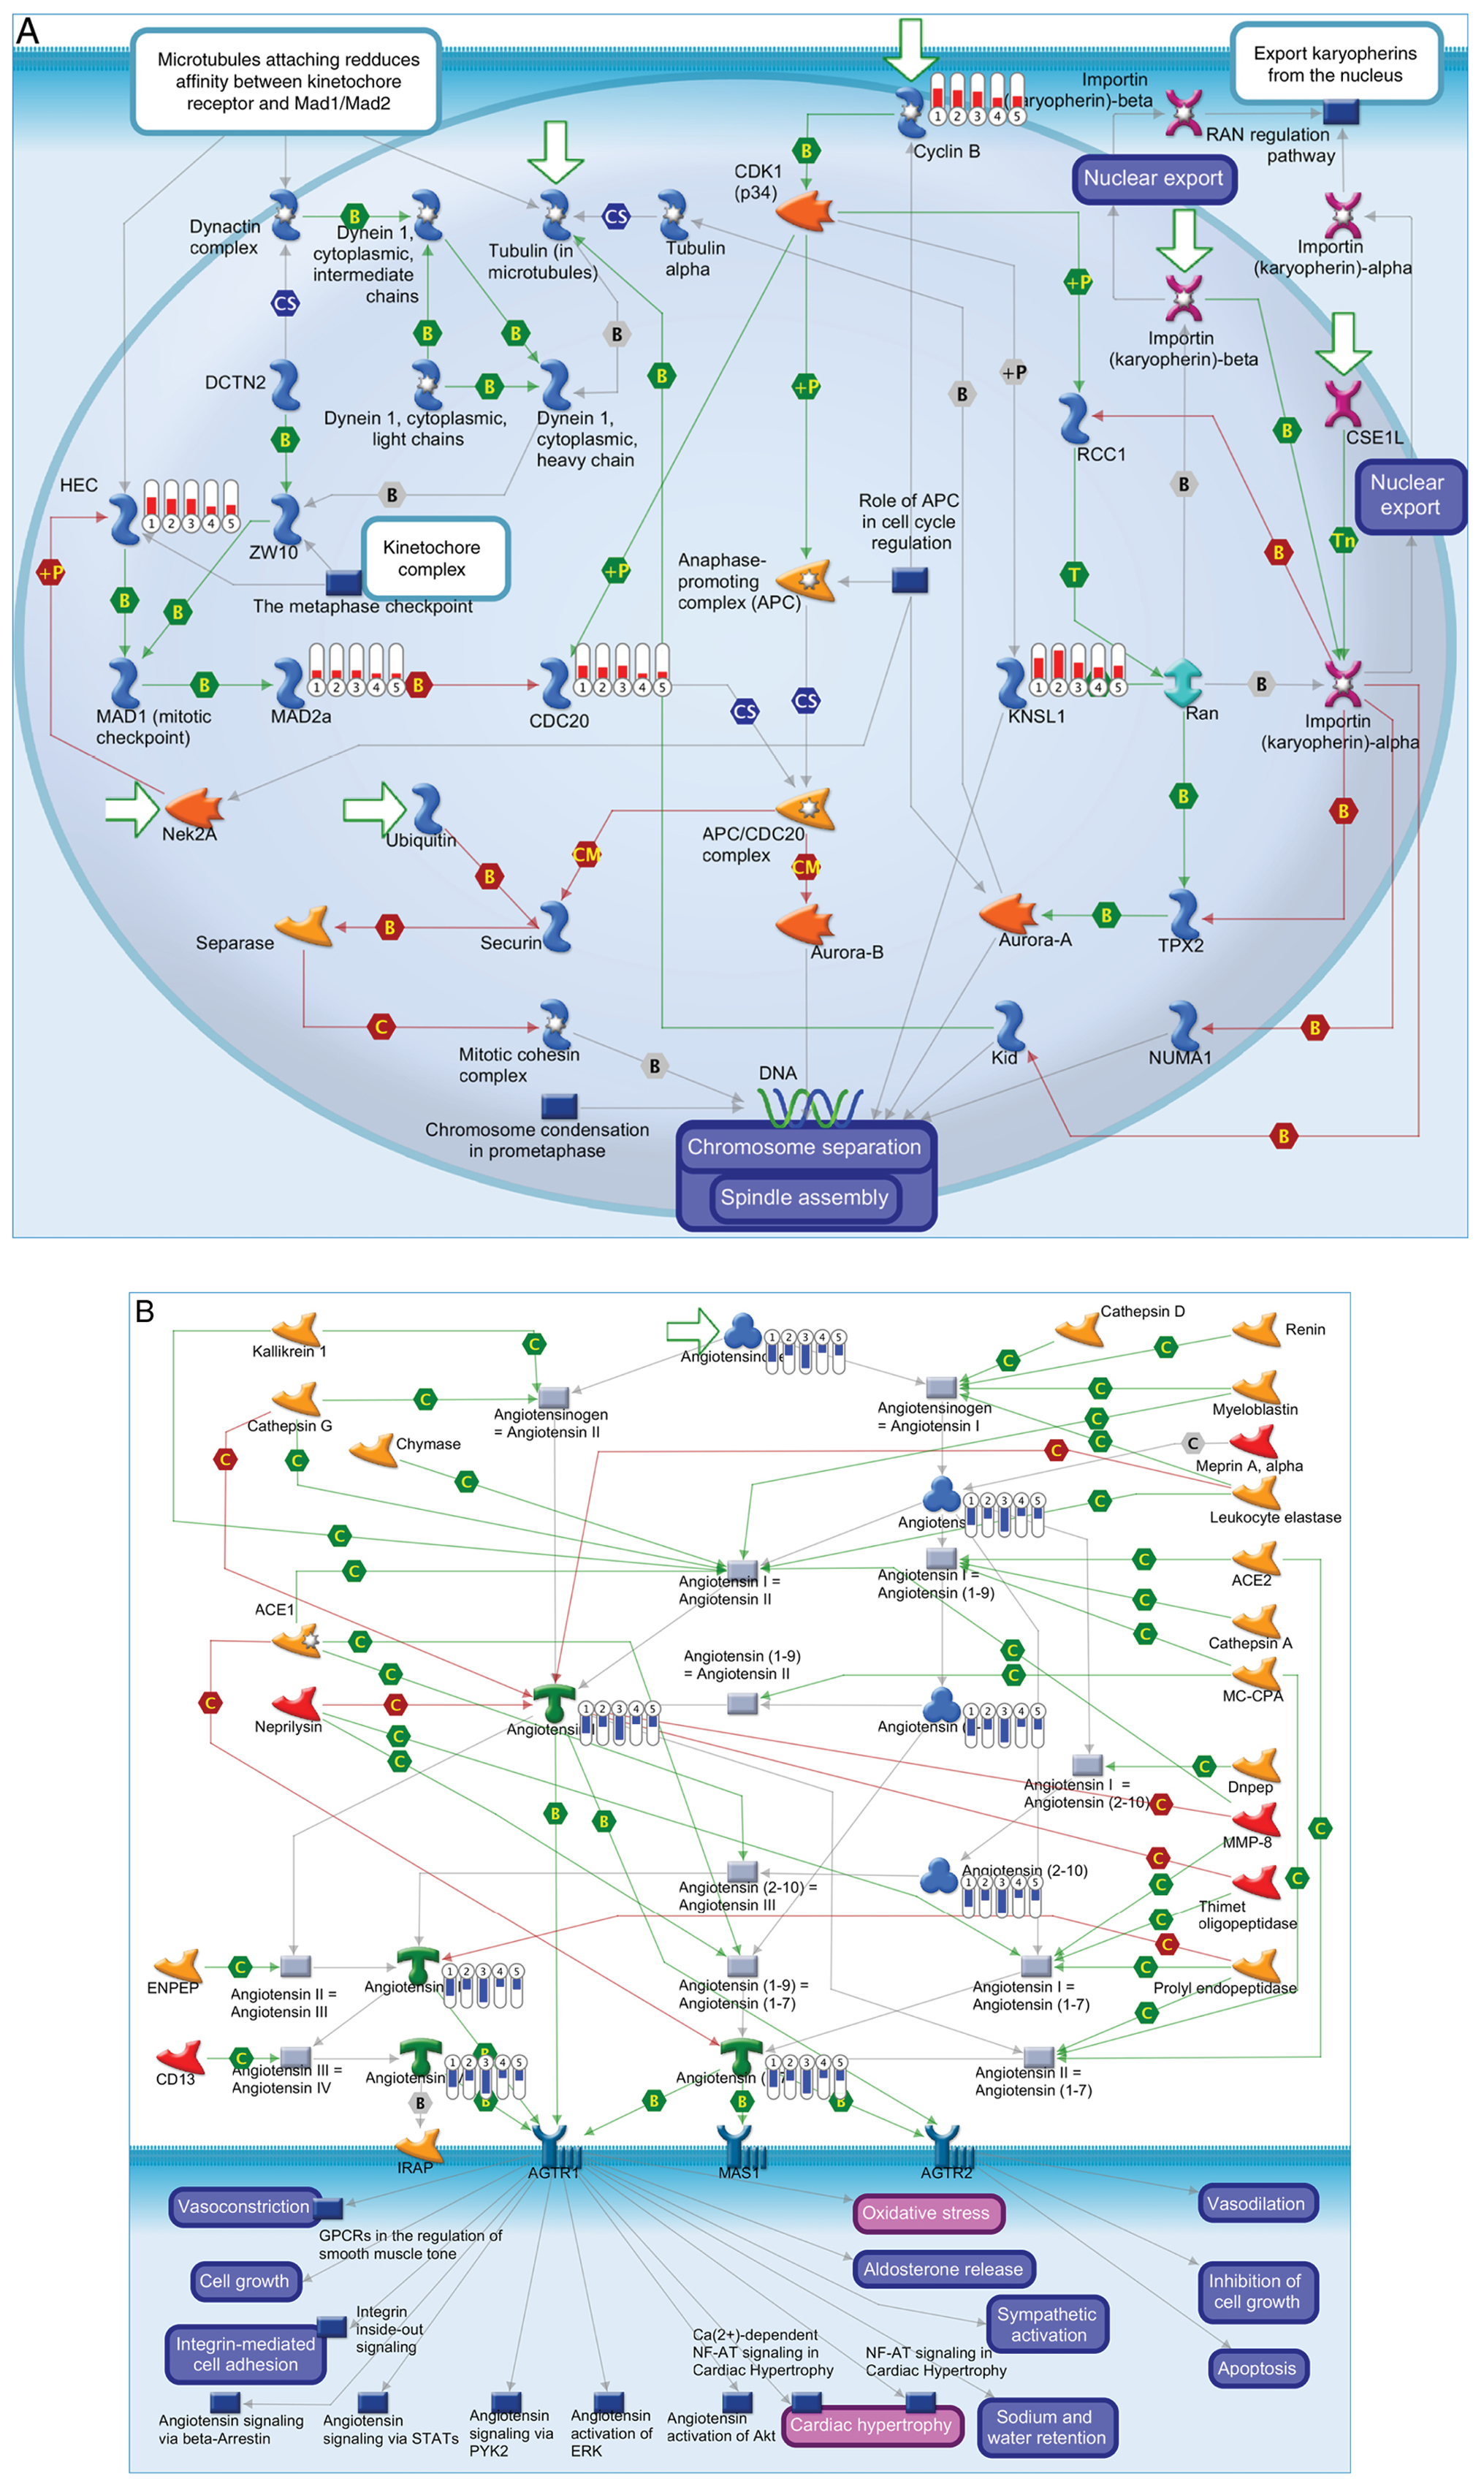
Enrichment analysis demonstrated
potential therapeutic targets associated with medulloblastoma
subgroups
Enrichment analysis enabled the identification of
gene profiles and pathways shared between each molecular subtype of
medulloblastoma (Fig. 7). The most
common medulloblastoma-associated process was ‘cell cycle’,
associated with the upregulation of kinesin family member 11, cell
division cycle 20, mitotic arrest deficient 2 like 1, kinetochore
complex component and cyclin B1 (Fig.
7A). The ‘renin-angiotensin pathway’ was significantly
downregulated, which was associated with the downregulated
expression of angiotensinogen and angiotensins I, II, III, IV,
-(2–10), -(1–7) and -(1–9) (Fig. 7B).
However, differences in the level of expression existed between the
subgroups, consistent with the subclassifications described in the
present study (Fig. 7A and B).
Discussion
This data mining analysis of microarray gene
expression data enabled the identification of a range of
dysregulated molecules associated with each subgroup of
medulloblastoma, as has been previously achieved (9,28).
Furthermore, a potential subcategorization of G4 was defined. G4
medulloblastoma is the most frequently occurring molecular
subgroup, as well as one of the most heterogeneous, as no
definitive pathway defines its pathogenesis.
Despite the classification of medulloblastoma into 4
subgroups, the heterogeneity of G3 and G4 and their association
with poorer prognoses remain unaddressed. Thompson et al
(30) described 5 subgroups instead
of the standard 4, suggesting some overlap between the G3 and G4
subgroups and/or a subdivision of G4 itself. Additionally, Cho
et al (31) reported an
analysis of the mRNA transcriptome via a high-density
single-nucleotide polymorphism array and miRNA analysis, in which 6
molecular subgroups were identified; the WNT and SHH subgroups
remained the same, whereas G3 was subclassified into the C1/C5
subgroups and G4 into the C2/C4 subgroups, reflecting the lack of
homogeneity in the G3 and G4 subgroups. These C2 and C4 G4
subcategories may be equivalent to those described in the present
study.
It has been indicated that G3 and G4 medulloblastoma
express gene members of pathways associated with photoreception and
neuronal function, thus suggesting a grade of differentiation
(32). In the present study, the
overexpression of TOX high mobility group box family member 3
(TOX3), potassium voltage-gated channel interacting protein
4 (KCNIP4), and synuclein α interacting protein
(SNCAIP) was identified in the G4α group compared with G4β.
TOX3 is important in the development of the CNS (33) and its expression is correlated with
neuronal markers, including Nestin and SOX2. The TOX3 protein
participates in the regulation of DNA structure and coiling, and
thus aids in transcriptional regulation. For instance, TOX3
interacts with the CAMP Responsive Element Binding Protein
(CREB)/CREB binding protein complex and regulates the transcription
of genes dependent on calcium ions, and is associated with neuronal
survival (34). In addition,
TOX3 is expressed in breast and lung cancer (35).
The overexpression of KCNIP4 was identified
in the G4α subgroup only. The KCNIP family comprises a group of
small calcium-binding proteins. KCNIP4 encodes a potassium
ion transporter directly associated with neuronal function, which
interacts with presenilin, a protein associated with early-onset
familial Alzheimer's disease (36).
To date, KCNA1 (10) and
KCNJ2 (37) have been reported
as potential markers of G4 medulloblastoma; however, to the best of
our knowledge, this is the first time that KCNIP4 has been
identified as specifically associated with the G4α subgroup of
medulloblastoma.
SNCAIP has been described by Northcott et
al (37) as a key gene in the
subcategorization of G4 medulloblastoma, which is supported by the
results of the present study. Northcott et al (37), reported that a tandem duplication of
SNCAIP defined a novel subtype of G4 medulloblastoma, 4α,
which comprised 10.4% of G4 medulloblastoma cases among 1,087
medulloblastoma genomes. The SNCAIP duplication was
associated with a 1.5-fold increase in SNCAIP expression in
G4α compared with G4β. Significantly, SNCAIP duplications
are mutually exclusive with MYCN and CDK6
amplifications (37). It has been
established that synphilin-1 in neurons interacts with α-synuclein,
a protein present in Lewy bodies in patients with Parkinson's
disease (38).
Northcott et al (37) also reported that somatic copy number
aberrations (SCNAs) were common in medulloblastoma and were
enriched depending on the subgroup. Specific SCNAs were associated
with TGF-β in G3, and NF-kB in G4, which may enable the
identification of novel targets for the specific treatment of
different subgroups of medulloblastoma. Despite the existing
specific therapies for SHH medulloblastoma, including GDC-0449, an
inhibitor of the SHH pathway that targets the SMO receptor
(39), it is necessary to identify
alternative therapies for all the molecular subgroups, particularly
for those associated with a relatively poor prognosis, including G3
and G4. The markers identified in the present study, together with
other markers reported elsewhere, may form the basis for new
approaches to treat medulloblastoma.
Further studies are required to verify the potential
of the markers identified in the present study to define G4
subcategories. It will be important to validate the presence of
these markers in patient samples, and explore whether they are
associated with a relatively poor prognosis in medulloblastoma, as
well as how they participate in the physiopathology of the
disease.
In conclusion, three novel potential markers to
differentiate G4 medulloblastoma into two subclassifications,
TOX3, KCNIP4 and SNCAIP, have been identified in the
present study. This may provide a basis for future studies on the
characterization of G4 medulloblastomas. Future research should
focus on these genes as potential biomarkers, in the pathogenesis
of medulloblastoma, and as targets for the development of targeted
therapies.
Acknowledgements
Not applicable.
Funding
The present study was supported by CONACyT (grant
no., SALUD-2014-1-233868) and by federal funds of the National
Institute of Pediatrics (protocol no. 036/2014 and 37/2015). Rosa
Angélica Castillo-Rodríguez was supported by Cátedras-CONACyT
(project no. 1059).
Availability of data and materials
The datasets analyzed during the current study are
public and available in the Gene Expression Omnibus database,
www.ncbi.nlm.nih.gov/geo (accession nos.
GSE4036, GSE10327, GSE37418, GSE44971 and GSE49243).
Authors' contributions
RACR and SJM conceived and designed the work. RACR,
SJM, and VMDB acquired, analyzed, and interpreted the data. All
authors discussed and wrote the manuscript. All authors read and
approved the final manuscript.
Ethics approval and consent to
participate
Not applicable.
Consent for publication
Not applicable.
Competing interests
The authors declare that they have no competing
interests.
References
|
1
|
Smoll NR: Relative survival of childhood
and adult medulloblastomas and primitive neuroectodermal tumors
(PNETs). Cancer. 118:1313–1322. 2012. View Article : Google Scholar : PubMed/NCBI
|
|
2
|
Smoll NR and Drummond KJ: The incidence of
medulloblastomas and primitive neurectodermal tumours in adults and
children. J Clin Neurosci. 19:1541–1544. 2012. View Article : Google Scholar : PubMed/NCBI
|
|
3
|
Louis DN, Perry A, Reifenberger G, von
Deimling A, Figarella-Branger D, Cavenee WK, Ohgaki H, Wiestler OD,
Kleihues P and Ellison DW: The 2016 world health organization
classification of tumors of the central nervous system: A summary.
Acta Neuropathol. 131:803–820. 2016. View Article : Google Scholar : PubMed/NCBI
|
|
4
|
Scotting PJ, Walker DA and Perilongo G:
Childhood solid tumours: A developmental disorder. Nat Rev Cancer.
5:481–488. 2005. View
Article : Google Scholar : PubMed/NCBI
|
|
5
|
Gilbertson RJ and Ellison DW: The origins
of medulloblastoma subtypes. Annu Rev Pathol. 3:341–365. 2008.
View Article : Google Scholar : PubMed/NCBI
|
|
6
|
Childhood Central Nervous System Embryonal
Tumors Treatment (PDQ®), . Health Professional Version: PDQ
pediatric treatment editorial boardPDQ Cancer Information
Summaries[Internet]. Bethesda (MD): National Cancer Institute (US);
2002
|
|
7
|
Crawford JR, MacDonald TJ and Packer RJ:
Medulloblastoma in childhood: New biological advances. Lancet
Neurol. 6:1073–1085. 2007. View Article : Google Scholar : PubMed/NCBI
|
|
8
|
Paulino AC, Lobo M, Teh BS, Okcu MF, South
M, Butler EB, Su J and Chintagumpala M: Ototoxicity after
intensity-modulated radiation therapy and cisplatin-based
chemotherapy in children with medulloblastoma. Int J Radiat Oncol
Biol Phys. 78:1445–1450. 2010. View Article : Google Scholar : PubMed/NCBI
|
|
9
|
Kool M, Korshunov A, Remke M, Jones DT,
Schlanstein M, Northcott PA, Cho YJ, Koster J, Schouten-van
Meeteren A, van Vuurden D, et al: Molecular subgroups of
medulloblastoma: An international meta-analysis of transcriptome,
genetic aberrations, and clinical data of WNT, SHH, Group 3, and
Group 4 medulloblastomas. Acta Neuropathol. 123:473–484. 2012.
View Article : Google Scholar : PubMed/NCBI
|
|
10
|
Kijima N and Kanemura Y: Molecular
classification of medulloblastoma. Neurol Med Chir (Tokyo).
56:687–697. 2016. View Article : Google Scholar : PubMed/NCBI
|
|
11
|
Skowron P, Ramaswamy V and Taylor MD:
Genetic and molecular alterations across medulloblastoma subgroups.
J Mol Med (Berl). 93:1075–1084. 2015. View Article : Google Scholar : PubMed/NCBI
|
|
12
|
Huang H, Mahler-Araujo BM, Sankila A,
Chimelli L, Yonekawa Y, Kleihues P and Ohgaki H: APC mutations in
sporadic medulloblastomas. Am J Pathol. 156:433–437. 2000.
View Article : Google Scholar : PubMed/NCBI
|
|
13
|
Dahmen RP, Koch A, Denkhaus D, Tonn JC,
Sörensen N, Berthold F, Behrens J, Birchmeier W, Wiestler OD and
Pietsch T: Deletions of AXIN1, a component of the WNT/wingless
pathway, in sporadic medulloblastomas. Cancer Res. 61:7039–7043.
2001.PubMed/NCBI
|
|
14
|
Clifford SC, Lusher ME, Lindsey JC,
Langdon JA, Gilbertson RJ, Straughton D and Ellison DW:
Wnt/wingless pathway activation and chromosome 6 loss characterize
a distinct molecular sub-group of medulloblastomas associated with
a favorable prognosis. Cell cycle. 5:2666–2670. 2006. View Article : Google Scholar : PubMed/NCBI
|
|
15
|
Evans DG, Farndon PA, Burnell LD,
Gattamaneni HR and Birch JM: The incidence of gorlin syndrome in
173 consecutive cases of medulloblastoma. Br J Cancer. 64:959–961.
1991. View Article : Google Scholar : PubMed/NCBI
|
|
16
|
Fujii K and Miyashita T: Gorlin syndrome
(nevoid basal cell carcinoma syndrome): Update and literature
review. Pediatr Int. 56:667–674. 2014. View Article : Google Scholar : PubMed/NCBI
|
|
17
|
He X, Zhang L, Chen Y, Remke M, Shih D, Lu
F, Wang H, Deng Y, Yu Y, Xia Y, et al: The G protein α subunit Gαs
is a tumor suppressor in sonic hedgehog-driven medulloblastoma. Nat
Med. 20:1035–1042. 2014. View
Article : Google Scholar : PubMed/NCBI
|
|
18
|
Ellison DW, Dalton J, Kocak M, Nicholson
SL, Fraga C, Neale G, Kenney AM, Brat DJ, Perry A, Yong WH, et al:
Medulloblastoma: Clinicopathological correlates of SHH, WNT, and
non-SHH/WNT molecular subgroups. Acta Neuropathol. 121:381–396.
2011. View Article : Google Scholar : PubMed/NCBI
|
|
19
|
Kool M, Koster J, Bunt J, Hasselt NE,
Lakeman A, van Sluis P, Troost D, Meeteren NS, Caron HN, Cloos J,
et al: Integrated genomics identifies five medulloblastoma subtypes
with distinct genetic profiles, pathway signatures and
clinicopathological features. PLoS One. 3:e30882008. View Article : Google Scholar : PubMed/NCBI
|
|
20
|
Pöschl J, Stark S, Neumann P, Gröbner S,
Kawauchi D, Jones DT, Northcott PA, Lichter P, Pfister SM, Kool M
and Schüller U: Genomic and transcriptomic analyses match
medulloblastoma mouse models to their human counterparts. Acta
Neuropathol. 128:123–136. 2014. View Article : Google Scholar : PubMed/NCBI
|
|
21
|
Rack PG, Ni J, Payumo AY, Nguyen V,
Crapster JA, Hovestadt V, Kool M, Jones DT, Mich JK, Firestone AJ,
et al: Arhgap36-dependent activation of Gli transcription factors.
Proc Natl Acad Sci USA. 111:pp. 11061–11066. 2014; View Article : Google Scholar : PubMed/NCBI
|
|
22
|
Robinson G, Parker M, Kranenburg TA, Lu C,
Chen X, Ding L, Phoenix TN, Hedlund E, Wei L, Zhu X, et al: Novel
mutations target distinct subgroups of medulloblastoma. Nature.
488:43–48. 2012. View Article : Google Scholar : PubMed/NCBI
|
|
23
|
Lambert SR, Witt H, Hovestadt V, Zucknick
M, Kool M, Pearson DM, Korshunov A, Ryzhova M, Ichimura K, Jabado
N, et al: Differential expression and methylation of brain
developmental genes define location-specific subsets of pilocytic
astrocytoma. Acta Neuropathol. 126:291–301. 2013. View Article : Google Scholar : PubMed/NCBI
|
|
24
|
Kool M, Jones DT, Jäger N, Northcott PA,
Pugh TJ, Hovestadt V, Piro RM, Esparza LA, Markant SL, Remke M, et
al: Genome sequencing of SHH medulloblastoma predicts
genotype-related response to smoothened inhibition. Cancer Cell.
25:393–405. 2014. View Article : Google Scholar : PubMed/NCBI
|
|
25
|
Villegas-Ruiz V, Moreno J, Jacome-Lopez K,
Zentella-Dehesa A and Juarez-Mendez S: Quality control usage in
high-density microarrays reveals differential gene expression
profiles in ovarian cancer. Asian Pac J Cancer Prev. 17:2519–2525.
2016.PubMed/NCBI
|
|
26
|
Villegas-Ruiz V and Juarez-Mendez S: Data
mining for identification of molecular targets in ovarian cancer.
Asian Pac J Cancer Prev. 17:1691–1699. 2016. View Article : Google Scholar : PubMed/NCBI
|
|
27
|
McCall MN, Murakami PN, Lukk M, Huber W
and Irizarry RA: Assessing affymetrix Genechip microarray quality.
BMC Bioinformatics. 12:1372011. View Article : Google Scholar : PubMed/NCBI
|
|
28
|
Northcott PA, Korshunov A, Witt H,
Hielscher T, Eberhart CG, Mack S, Bouffet E, Clifford SC, Hawkins
CE, French P, et al: Medulloblastoma comprises four distinct
molecular variants. J Clin Oncol. 29:1408–1414. 2011. View Article : Google Scholar : PubMed/NCBI
|
|
29
|
Li KK, Lau KM and Ng HK: Signaling pathway
and molecular subgroups of medulloblastoma. Int J Clin Exp Pathol.
6:1211–1222. 2013.PubMed/NCBI
|
|
30
|
Thompson MC, Fuller C, Hogg TL, Dalton J,
Finkelstein D, Lau CC, Chintagumpala M, Adesina A, Ashley DM,
Kellie SJ, et al: Genomics identifies medulloblastoma subgroups
that are enriched for specific genetic alterations. J Clin Oncol.
24:1924–1931. 2006. View Article : Google Scholar : PubMed/NCBI
|
|
31
|
Cho YJ, Tsherniak A, Tamayo P, Santagata
S, Ligon A, Greulich H, Berhoukim R, Amani V, Goumnerova L,
Eberhart CG, et al: Integrative genomic analysis of medulloblastoma
identifies a molecular subgroup that drives poor clinical outcome.
J Clin Oncol. 29:1424–1430. 2011. View Article : Google Scholar : PubMed/NCBI
|
|
32
|
Hooper CM, Hawes SM, Kees UR, Gottardo NG
and Dallas PB: Gene expression analyses of the spatio-temporal
relationships of human medulloblastoma subgroups during early human
neurogenesis. PLoS One. 9:e1129092014. View Article : Google Scholar : PubMed/NCBI
|
|
33
|
Dittmer S, Kovacs Z, Yuan SH, Siszler G,
Kögl M, Summer H, Geerts A, Golz S, Shioda T and Methner A: TOX3 is
a neuronal survival factor that induces transcription depending on
the presence of CITED1 or phosphorylated CREB in the
transcriptionally active complex. J Cell Sci. 124(Pt 2): 1–260.
2011.PubMed/NCBI
|
|
34
|
Yuan SH, Qiu Z and Ghosh A: TOX3 regulates
calcium-dependent transcription in neurons. Proc Natl Acad Sci USA.
106:pp. 2909–2914. 2009; View Article : Google Scholar : PubMed/NCBI
|
|
35
|
Tessema M, Yingling CM, Grimes MJ, Thomas
CL, Liu Y, Leng S, Joste N and Belinsky SA: Differential epigenetic
regulation of TOX subfamily high mobility group box genes in lung
and breast cancers. PLoS One. 7:e348502012. View Article : Google Scholar : PubMed/NCBI
|
|
36
|
Morohashi Y, Hatano N, Ohya S, Takikawa R,
Watabiki T, Takasugi N, Imaizumi Y, Tomita T and Iwatsubo T:
Molecular cloning and characterization of CALP/KChIP4, a novel
EF-hand protein interacting with presenilin 2 and voltage-gated
potassium channel subunit Kv4. J Biol Chem. 277:14965–14975. 2002.
View Article : Google Scholar : PubMed/NCBI
|
|
37
|
Northcott PA, Shih DJ, Peacock J, Garzia
L, Morrissy AS, Zichner T, Stütz AM, Korshunov A, Reimand J,
Schumacher SE, et al: Subgroup-specific structural variation across
1,000 medulloblastoma genomes. Nature. 488:49–56. 2012. View Article : Google Scholar : PubMed/NCBI
|
|
38
|
Engelender S, Kaminsky Z, Guo X, Sharp AH,
Amaravi RK, Kleiderlein JJ, Margolis RL, Troncoso JC, Lanahan AA,
Worley PF, et al: Synphilin-1 associates with alpha-synuclein and
promotes the formation of cytosolic inclusions. Nat Genet.
22:110–114. 1999. View
Article : Google Scholar : PubMed/NCBI
|
|
39
|
Rudin CM, Hann CL, Laterra J, Yauch RL,
Callahan CA, Fu L, Holcomb T, Stinson J, Gould SE, Coleman B, et
al: Treatment of medulloblastoma with hedgehog pathway inhibitor
GDC-0449. N Engl J Med. 361:1173–1178. 2009. View Article : Google Scholar : PubMed/NCBI
|