Introduction
Cancer tissues are composed of cancer cells and the
surrounding stroma including fibroblasts, vascular endothelial
cells, and extracellular matrix. Recent studies have focused on the
cancer-associated fibroblasts (CAFs), a major cellular component of
the cancer stroma, and have demonstrated that CAFs promote
neoplastic angiogenesis and tumor growth in various tumors
(1–6).
Collagen I, D2-40 (antibody recognizing podoplanin),
Platelet-derived growth factor receptor-β (PDGFR-β), and α-smooth
muscle actin (α-SMA) have been known as molecular/histopathological
markers of CAFs (7). Podoplanin
(D2-40) expressions in CAFs from various cancers have been studied
(8). The majority of recently reports
identified podoplanin (D2-40) expression of CAFs as an unfavorable
marker of prognosis, such as lung cancer (9), breast cancer (10), and esophageal adenocarcinoma (11), while podoplanin expression of CAFs was
shown as a favorable prognosis indicator of colorectal cancer
(12,13). Some previous studies have reported one
of the above CAF markers, but there are no papers for analyzing the
relationships among these CAFs using image technique in colorectal
cancer. The relationships of CAF markers, such as collagen I,
D2-40, PDGFR-β, and α-SMA in advanced colorectal cancer are still
unknown. We speculate synergic effects of individual CAF markers
are important, and may significantly contribute neoplastic
angiogenesis.
In this study, we analyzed histopathological
expression of CAF markers in the human advanced colorectal cancers,
as well as vessel markers (CD31 and CD34), because CAFs are thought
to promote neoplastic angiogenesis in the cancer stroma. In
addition, we examined the relations among the CAF/vessel markers
and clinicopathological factors.
Materials and methods
Tissue specimens
A total 121 tumor samples from patients who
underwent curative surgical resection for advanced colorectal
cancer at the Hirosaki University Hospital between January 2008 and
December 2009 were included. Informed consent was obtained from
each patient regarding the use of clinical records and pathological
specimens. Cancer had invaded the subserosa layer of the colorectal
wall, and the clinical stages were stage IIA, IIIB, or IIIC
according to the TNM classification of the UICC (14). Lymph nodes were evaluated
histologically. No patient received preoperative chemotherapy, and
no patient had metastasis of other organs. Ethical approval was
obtained from the Hirosaki University Graduate School of Medicine
Ethics Committee (Hirosaki, Japan).
Pathological analysis
For histopathological examination, all surgically
resected specimens were fixed using 10% formalin, embedded in
paraffin, and stained using hematoxylin and eosin. The histological
features were assessed in the largest cross-sectional tumor
section, and histological type, lymphatic invasion, venous
invasion, and lymph node metastasis were evaluated according to the
Japanese Classification of Colorectal Cancer (15). One hundred twenty-one cases of
colorectal cancer were classified into well-differentiated tubular
adenocarcinoma (tub1), moderately differentiated tubular
adenocarcinoma (tub2), papillary adenocarcinoma (pap), poorly
differentiated adenocarcinoma (por), and mucinous adenocarcinoma
(muc). Papillary adenocarcinoma consists of papillary or villous
architecture neoplastic glands. Histological type was classified
into two groups: Differentiated type, tub1, tub2, or pap, and
poorly differentiated type, por or muc. The degree of lymphatic
invasion was classified as ly0, no invasion; ly1, minimal invasion;
ly2, moderate invasion; or ly3, severe invasion. We regarded ly0
and ly1 as low-grade invasion and ly2 and ly3 as high-grade
invasion. The degree of venous invasion was classified as the same
as lymphatic invasion.
Immunohistochemical staining
For immunohistochemical examination, sections on
microslides were deparaffinized using the standard
avidin-biotin-peroxidase complex method with automated
immunostainer (Benchmark XT; Ventana Medical System, Tucson, AZ,
USA). The antibodies of clones and dilution ratios were α-SMA
(clone 1A4, dilution 1:100; Dako; Agilent Technologies, Inc., Santa
Clara, CA, USA), desmin (clone D33, dilution 1:100; Dako; Agilent
Technologies, Inc.), D2-40 (clone D2-40, cat. no. 413451, diluted
antibody; Nichirei Biosciences, Inc., Tokyo, Japan), CD31 (clone
JC70A, dilution 1:40; Dako; Agilent Technologies, Inc.), CD34
(clone QBEnd 10, DAKO, dilution 1:100), PDGFR-β (clone C82A3,
dilution 1:100; Cell Signaling Technology, Inc., Danvers, MA, USA),
and collagen I (clone COL1A1, dilution 1:100; Rockland, Inc.,
Gilbertsville, PE, USA).
Image analysis
For the evaluation of each marker in the cancer
stroma, we used an image analysis. We selected a hot spot of
D2-40-positive stromal area for each case. When the D2-40
expression was not found, we captured an image of the site with the
most CAFs. We used a microscope BX53 with an UPlanFL objection
lens, ×4 magnification, DP control software, and a DP-21 digital
camera (Olympus, Tokyo, Japan) for captured images. ImageJ software
(National Institutes of Health, Bethesda, MD, USA) was applied to
analyze captured images. We captured immunohistochemical staining
images, and adjusted phases in each case by using Adobe Photoshop
software (Adobe® Photoshop® CC
2014®; Adobe Systems, Inc., San Jose, CA, USA) for image
registration. We cropped out the maximum range that a cancer stroma
could be evaluated from the adjusted image, and binarized them
using the ImageJ software.
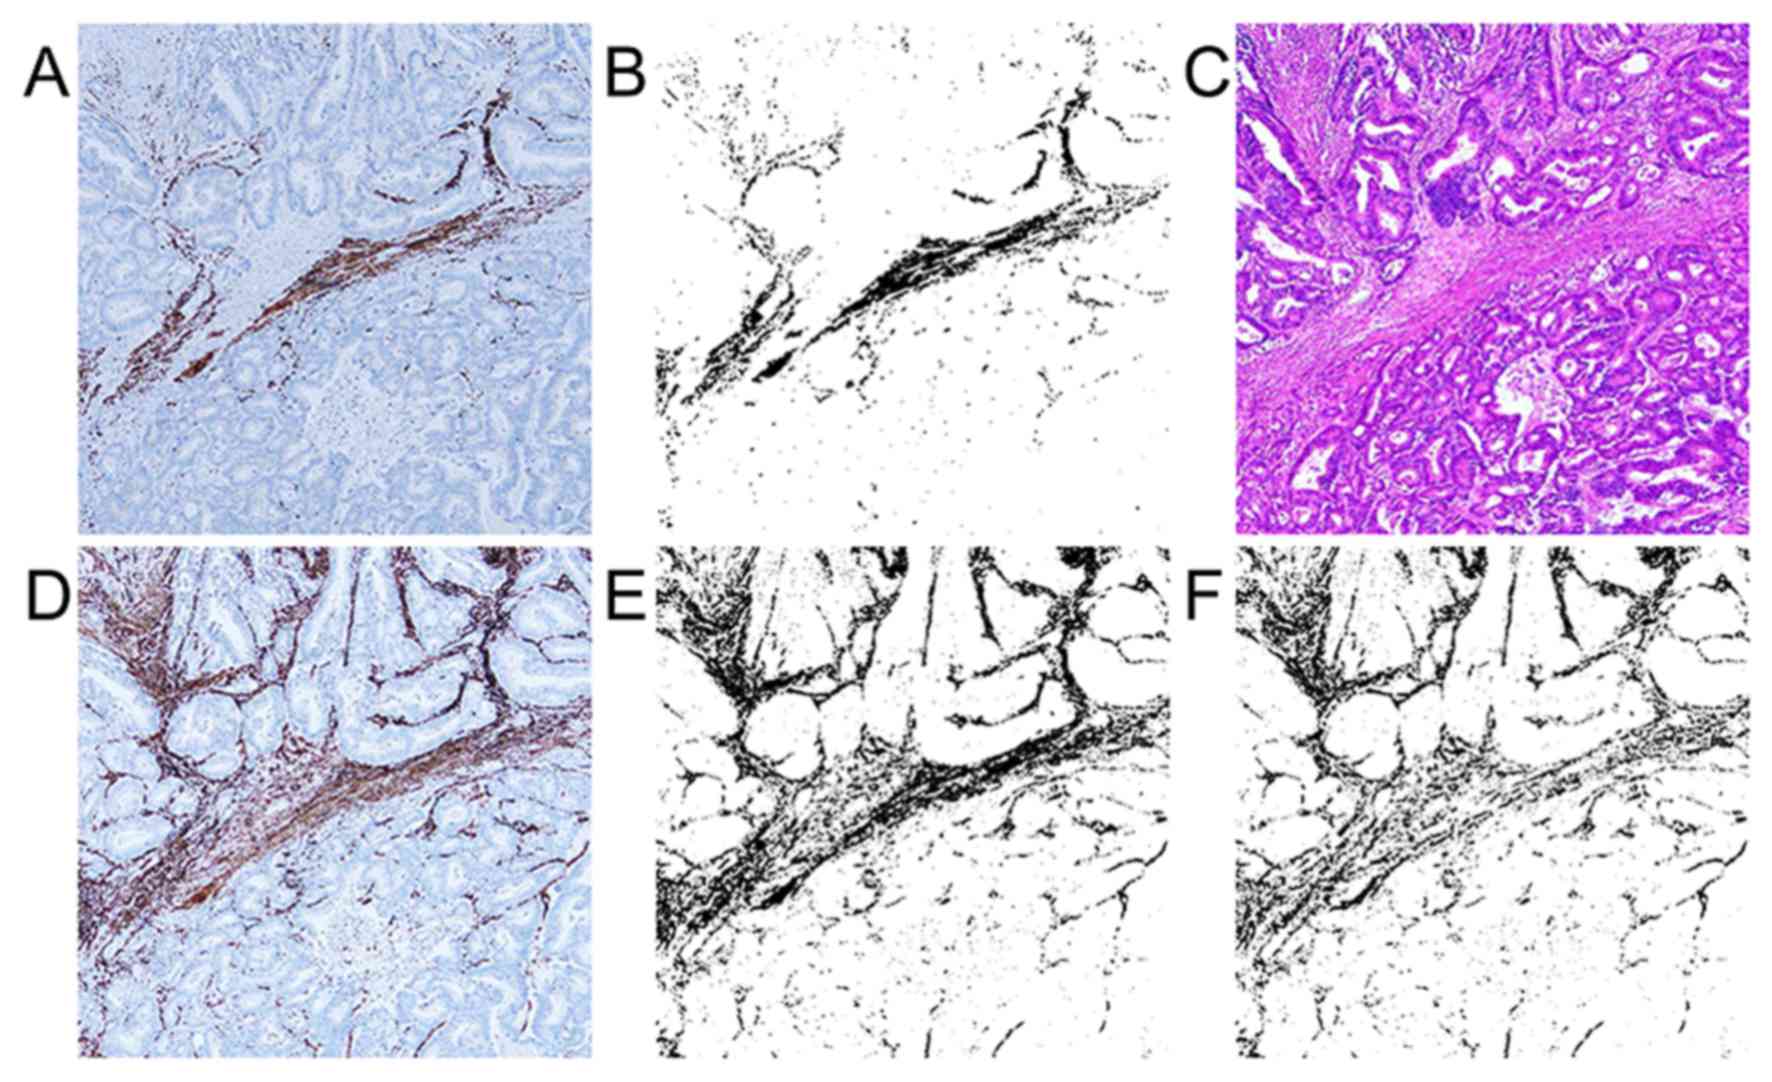
Evaluation of immunohistchemical
staining expression area
We measured the percentage of
immunostaining-positive lesions in the total cropped, binarized
area for each immunostained slide. The binarized image shows
immunostaining-positive and -negative lesions as black and white,
respectively. For the examination of α-SMA-positive myofibroblasts,
we made an α-SMA-desmin subtraction image using the subtraction
mode of the ImageJ software (Fig. 1)
because α-SMA became positive for muscle tissues, such as
muscularis mucosa and muscular layer, in addition to the
myofibroblasts. The subtraction image shows the value of
α-SMA-positive and desmin-negative myofibroblasts in the cancer
stroma. We called this subtraction image as α-SMA subtraction.
D2-40-, PDGFR-β-, and collagen I-positive lesions were made
binarized and calculated expression area (the positive percentage
of the cropped area) by using ImageJ software in the cancer stroma
as CAF markers. CD31 and CD34 positive lesions were also made
binarized and calculated as vessel markers by using ImageJ
software.
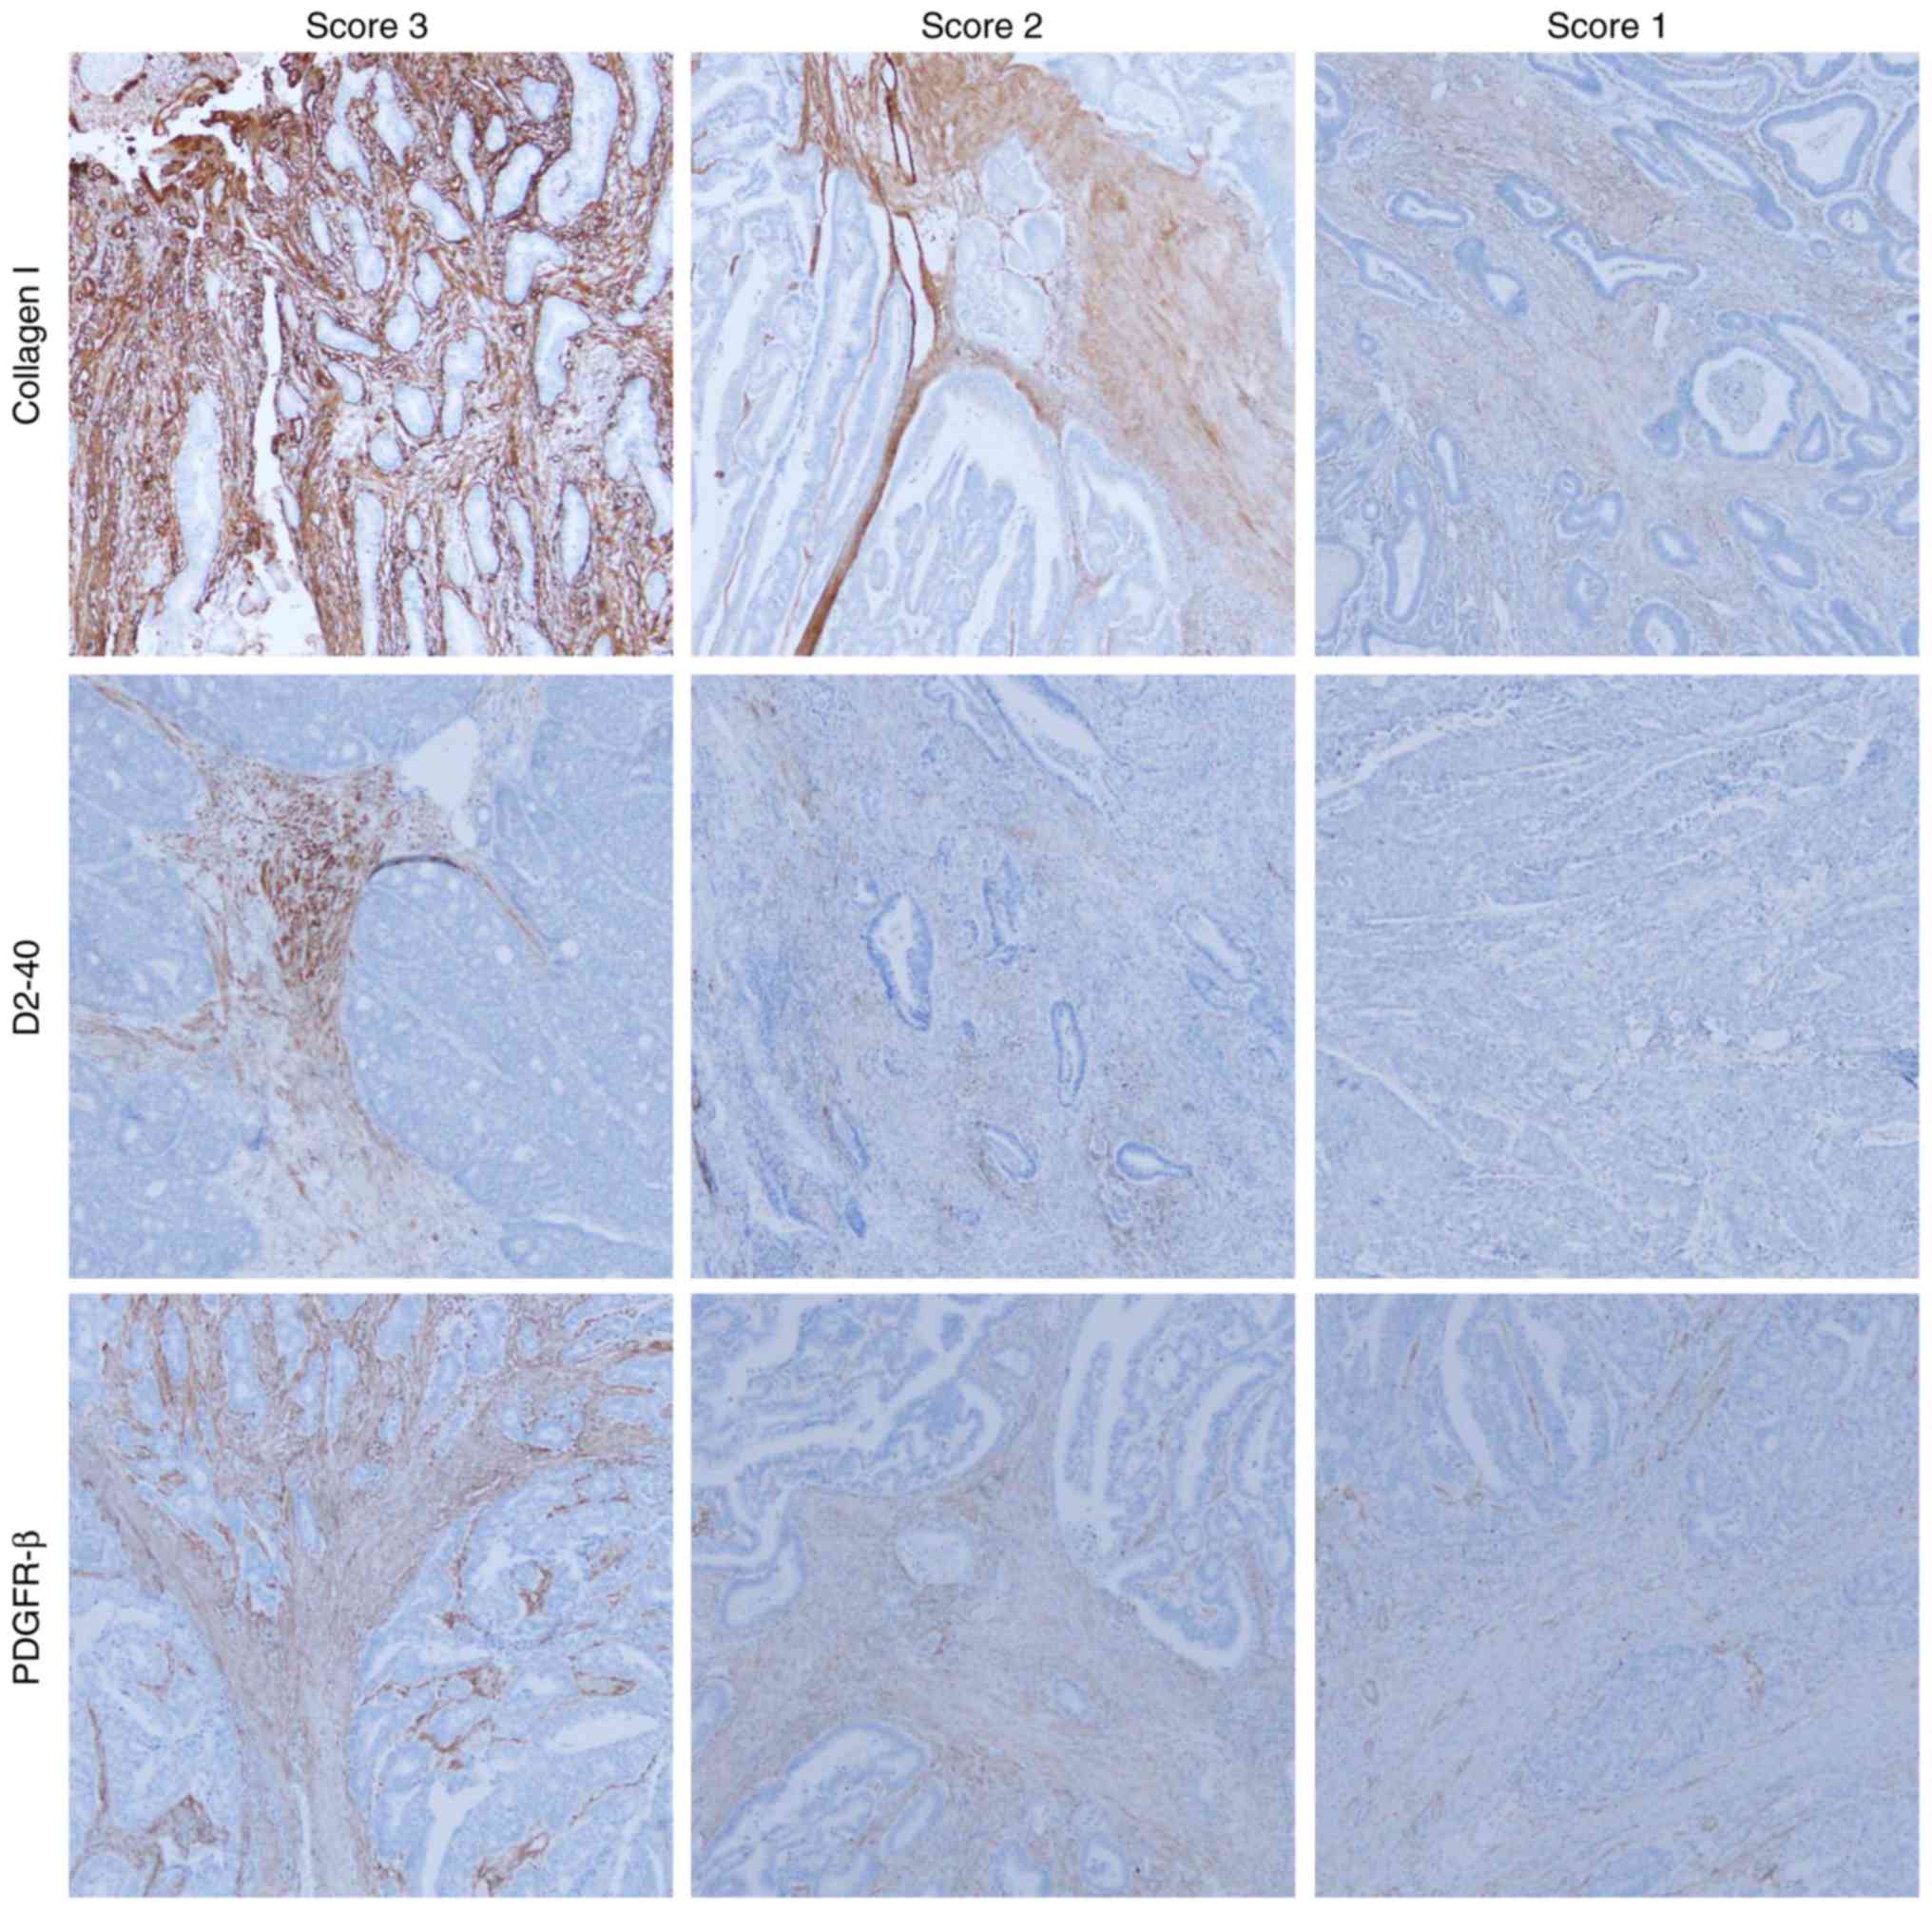
Evaluation of immunohistchemical
staining expression intensity
Three investigators (RN, SM, and HS) evaluated the
immunohistochemical results in the captured images at low
magnification (×40). There was unevenness in the level of PDGFR-β,
D2-40, and collagen I staining intensity for each case, which
required an evaluation by intensity score. The intensity of α-SMA
staining was strong and uniform for all cases, therefore, α-SMA was
evaluated by only expression area analysis. Immunohistochemical
scores for PDGFR-β, collagen I, and D2-40 were evaluated according
to the staining intensity as follows: Score 1, weak staining in
stromal cell; score 2, moderate staining in stromal cell; score 3,
severe staining in stromal cell (Fig.
2). The scores given by the three evaluators were summed for
each case. We regarded cases with total score of 8 to 9 as high
intensity and 3 to 7 as low intensity. The intensity of CD31/CD34
staining was strong and uniform for all cases, therefore, CD31/CD34
were evaluated by only expression area analysis.
Statistical analysis
The value of immunohistochemical expression area and
intensity and pathological factor were compared by using Pearson's
chi-square test or Fisher's exact test for categorical data.
Normally distributed and homoscedastic data were analyzed by
two-sample t-test, and non-normally distributed data were analyzed
by the Wilcoxon rank sum test for continuous data. The median
immunostaining expression area (α-SMA subtraction, CD31, and CD34)
and each staining intensity score (collagen I, D2-40, and PDGFR-β)
were compared by using Kruskal-Wallis test. P<0.05 was
considered to indicate a statistically significant difference. Each
of the mean/median immunostaining expression percentage in the
cancer stroma was compared using Spearman's rank correlation
coefficient. Correlation was defined as statistically significant
if the rho value (r) was >0.4. All statistical evaluations were
performed using R (http://www.r-project.org) and EZR (Saitama Medical
Center, Jichi Medical University, Saitama, Japan).
Results
Expression of CAF/vessel markers of
colorectal cancer tissues
The clinicopathological characteristics of the 121
colorectal cancer cases are summarized in Table I. We analyzed immunohistochemical
expression area (ratio; percentage) of colorectal stroma.
Mean/median expression areas of CAF/vessel markers were 26.787%
(collagen I, range 0.848–59.069%), 1.372% (D2-40, range
0.002–11.860%), 11.646% (PDGFR-β, range 0.014–38.381%), 15.372%
(α-SMA subtraction, range 1.552–38.608%), 3.635% (CD31, range
0.249–11.071%), and 2.226% (CD34, range 0.681–8.508%) in 121
colorectal cancer specimens. There was no statistical association
between any CAF/vessel markers (both of expression area/intensity)
and the histological type (Table
II).
 | Table I.Clinicopathological characteristics of
121 colorectal cancer cases. |
Table I.
Clinicopathological characteristics of
121 colorectal cancer cases.
| Clinicopathological
features | Number of patients
(%) |
|---|
| Age, median
(range) | 67.4 (26–93) |
| Sex |
|
| Male | 66 (54.5) |
|
Female | 55 (45.5) |
| Location |
|
|
Colon | 77 (63.6) |
|
Rectum | 44 (36.4) |
| Histological
type |
|
|
Well-differentiated tubular
adenocarcinoma (tub1) | 11 (9.1) |
|
Moderately differentiated
tubular adenocarcinoma (tub2) | 99 (81.8) |
| Papillary
adenocarcinoma (pap) | 3 (2.5) |
| Poorly
differentiated adenocarcinoma (por) | 5 (4.1) |
| Mucinous
adenocarcinoma (muc) | 3 (2.5) |
| Stage |
|
| IIA | 64 (52.9) |
| IIIB | 48 (39.7) |
| IIIC | 9 (7.4) |
| Venous invasion |
|
| Low (v0,
v1) | 89 (73.6) |
| High (v2,
v3) | 32 (26.4) |
| Lymphatic
invasion |
|
| Low (ly0,
ly1) | 80 (66.2) |
| High
(ly2, ly3) | 41 (33.8) |
| Lymph node
metastasis |
|
|
Negative | 64 (52.9) |
|
Positive | 57 (47.1) |
| Table II.Expression of CAFs/vessel markers and
histological type of colorectal cancer. |
Table II.
Expression of CAFs/vessel markers and
histological type of colorectal cancer.
| Histological
type | Differentiated type
(tub1, tub2, pap) n=113 (93.4%) | Poorly differentiated
type (por, muc) n=8 (6.6%) | P-value |
|---|
| Expression area |
|
|
|
| Collagen
I | 27.020 | 23.494 | 0.361 |
|
D2-40 |
1.372 |
1.178 | 0.449 |
|
PDGFR-β | 11.759 |
8.614 | 0.249 |
| α-SMA
subtraction | 15.372 | 15.034 | 0.718 |
| CD31 |
3.635 |
3.620 | 0.726 |
| CD34 |
2.226 |
2.343 | 0.888 |
| Expression
intensity |
|
|
|
| Collagen I |
|
| 0.719 |
| High | 58 (47.9) | 5 (4.1) |
|
| Low | 55 (45.5) | 3 (2.5) |
|
| D2-40 |
|
| 0.481 |
|
High | 45 (37.2) | 2 (1.7) |
|
|
Low | 68 (56.2) | 6 (5.0) |
|
| PDGFR-β |
|
| 0.481 |
|
High | 45 (37.2) | 2 (1.7) |
|
|
Low | 68 (56.2) | 6 (5.0) |
|
Expression of CAF/vessel markers, and
venous invasion/lymphatic invasion/lymph node metastasis
Relationships between the expression of CAF/vessel
markers, and venous invasion/lymphatic invasion/lymph node
metastasis are summarized in Tables
III, IV and V, respectively. Extensive expression area of
α-SMA subtraction (P=0.002), collagen I (P=0.040) and PDGFR-β
(P=0.040) were significantly correlated with high-grade venous
invasion (Table III). There was no
relation between lymphatic invasion and expression of CAF/vessel
markers except for CD34. Much expression area of CD34 was
correlated with high lymphatic invasion (P=0.048) (Table IV). There was no relation between
lymph node metastasis and expression of CAF/vessel markers except
for α-SMA subtraction (Table V). Weak
expression area of α-SMA subtraction was significantly correlated
with positive lymph node metastasis (P=0.025). Strong expression
area of α-SMA subtraction was significantly correlated with
negative lymph node metastasis (P=0.025).
| Table III.Expression of CAF/vessel markers and
venous invasion of colorectal cancer. |
Table III.
Expression of CAF/vessel markers and
venous invasion of colorectal cancer.
| Venous
invasion | Low (v0, v1) n=89
(73.6%) | High (v2, v3) n=32
(26.4%) | P-value |
|---|
| Expression
area |
|
|
|
|
Collagen I | 25.615 | 30.048 | 0.040a |
|
D2-40 |
2.339 |
2.338 | 0.971 |
|
PDGFR-β | 12.590 | 16.835 | 0.040a |
| α-SMA
subtraction | 14.820 | 19.377 | 0.002a |
|
CD31 |
4.271 |
4.098 | 0.570 |
|
CD34 |
2.516 |
2.391 | 0.993 |
| Expression
intensity |
|
|
|
|
Collagen I |
|
| 0.168 |
|
High | 43 (35.5) | 20
(16.5) |
|
|
Low | 46 (38.0) | 12 (9.9) |
|
|
D2-40 |
|
| 0.277 |
|
High | 32 (26.4) | 15 (12.4) |
|
|
Low | 57 (47.1) | 17 (14.0) |
|
|
PDGFR-β |
|
| 0.506 |
|
High | 33 (27.3) | 14 (11.6) |
|
|
Low | 56 (46.3) | 18 (14.9) |
|
| Table IV.Expression of CAF/vessel markers and
lymphatic invasion of colorectal cancer. |
Table IV.
Expression of CAF/vessel markers and
lymphatic invasion of colorectal cancer.
| Lymphatic
invasion | Low (ly0, ly1) n=80
(66.1%) | High (ly2, ly3)
n=41 (33.9%) | P-value |
|---|
| Expression
area |
|
|
|
|
Collagen I | 26.333 | 27.673 | 0.509 |
|
D2-40 |
2.026 |
2.950 | 0.156 |
|
PDGFR-β | 12.789 | 15.515 | 0.188 |
| α-SMA
subtraction | 15.287 | 17.465 | 0.119 |
|
CD31 |
4.113 |
4.443 | 0.665 |
|
CD34 |
2.301 |
2.838 | 0.048a |
| Expression
intensity |
|
|
|
|
Collagen I |
|
| 0.604 |
|
High | 43 (35.5) | 20 (16.5) |
|
|
Low | 37 (30.6) | 21 (17.4) |
|
|
D2-40 |
|
| 0.225 |
|
High | 28 (23.1) | 19 (15.7) |
|
|
Low | 52 (43.0) | 22 (18.2) |
|
|
PDGFR-β |
|
| 0.715 |
|
High | 32 (26.4) | 15 (12.4) |
|
|
Low | 48 (39.7) | 26 (21.5) |
|
| Table V.Expression of CAF/vessel markers and
lymph node metastasis of colorectal cancer. |
Table V.
Expression of CAF/vessel markers and
lymph node metastasis of colorectal cancer.
| Lymph node
metastasis | Negative n=64
(52.9%) | Positive n=57
(47.1%) | P-value |
|---|
| Expression
area |
|
|
|
|
Collagen I | 26.798 | 26.775 | 0.990 |
|
D2-40 |
2.228 |
2.463 | 0.698 |
|
PDGFR-β | 13.943 | 13.454 | 0.882 |
| α-SMA
subtraction | 17.242 | 14.659 | 0.025a |
|
CD31 |
3.627 |
4.098 | 0.704 |
|
CD34 |
2.350 |
2.632 | 0.352 |
| Expression
intensity |
|
|
|
|
Collagen I |
|
| 0.168 |
|
High | 33 (27.3) | 30 (24.8) |
|
|
Low | 31 (25.6) | 27 (22.3) |
|
|
D2-40 |
|
| 0.277 |
|
High | 23 (19.0) | 24 (19.8) |
|
|
Low | 41 (33.9) | 33 (27.3) |
|
|
PDGFR-β |
|
| 0.506 |
|
High | 24 (19.8) | 23 (19.0) |
|
|
Low | 40 (33.1) | 34 (28.1) |
|
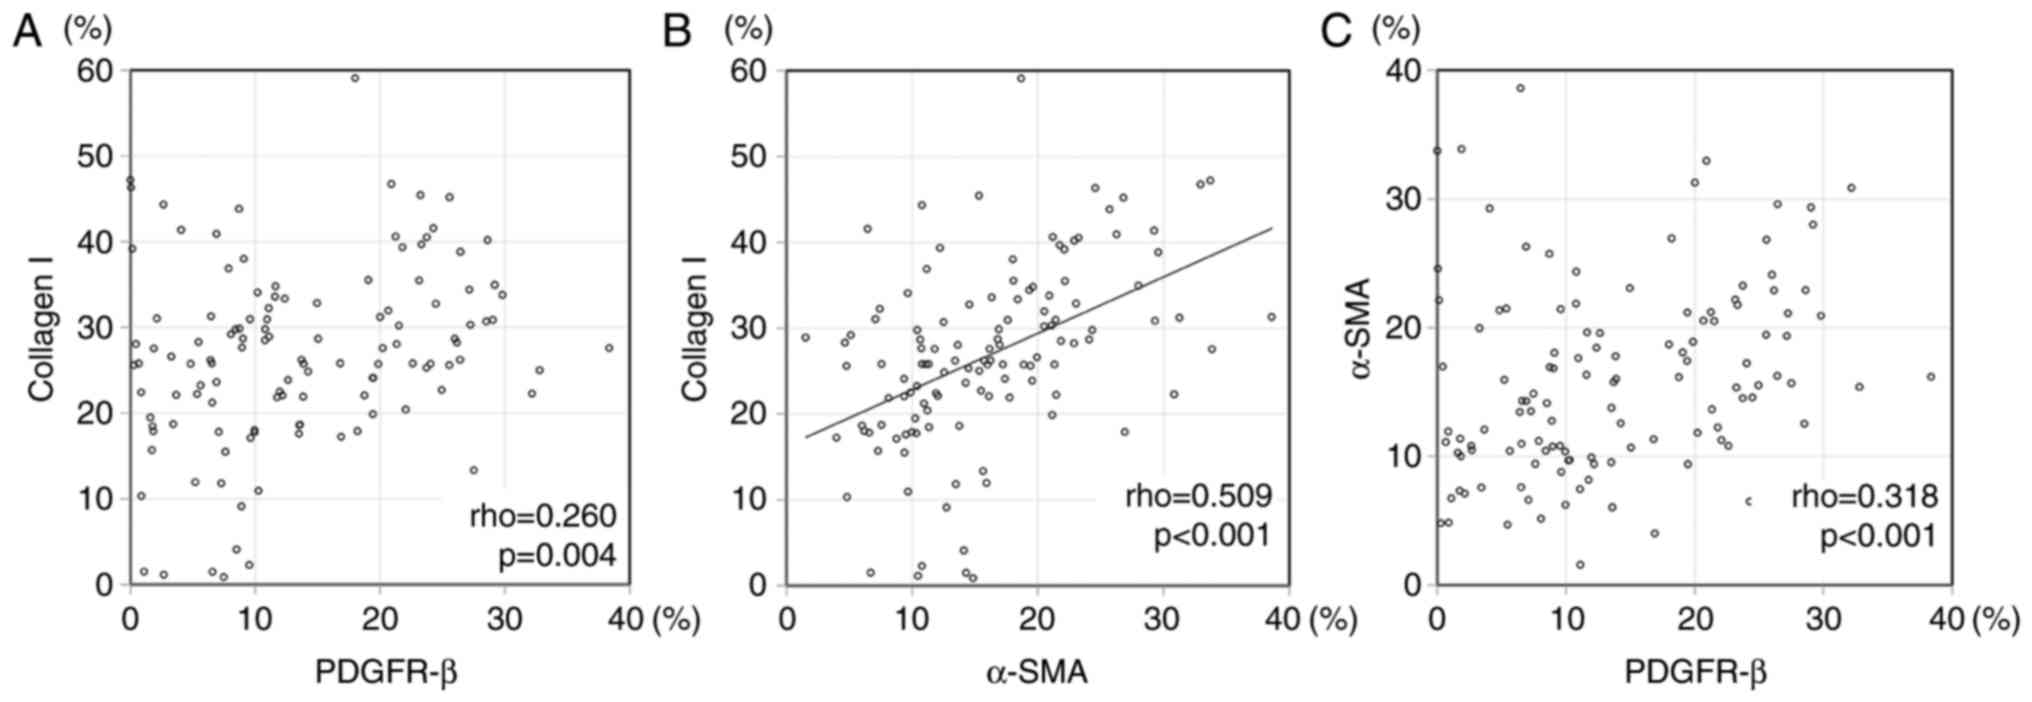
Correlation among CAF/vessel
markers
We evaluated the correlation among the expression of
CAF/vessel markers. Speaman's correlation rho, and the scatter
plots are shown in Table VI, and
Fig. 3, respectively. There was
significant correlation between α-SMA subtraction and collagen I
(P<0.001, correlation rho=0.509) in expression area. The
significant difference was not found between other CAF and vascular
marker nor other CAF markers each other in expression area. There
was not significant difference between collagen I and D2-40
(P=0.119), collagen I and PDGFR-β (P=0.665), PDGFR-β and D2-40
(P=0.940) in intensity score. There was not significant difference
between α-SMA subtraction (expression area) and three each CAF
markers intensity score; collagen I (P=0.072), D2-40 (P=0.297), and
PDGFR-β (P=0.386). There was not difference between CD31 expression
area and three CAF markers of intensity score; collagen I
(P=0.232), D2-40 (P=0.205), and PDGFR-β (P=0.657). There was not
difference between CD34 expression area and three CAF markers of
intensity score; collagen I (P=0.133), D2-40 (P=0.090), and PDGFR-β
(P=0.641).
| Table VI.Spearman's rank correlation rho in
CAFs/vessel markers. |
Table VI.
Spearman's rank correlation rho in
CAFs/vessel markers.
|
| Collagen I | D2-40 | PDGFR-β | α-SMA
subtraction | CD31 | CD34 |
|---|
| Collagen I |
| 0.150 | 0.260 | 0.509a | 0.088 | 0.133 |
| D2-40 |
|
| 0.145 | 0.257 | 0.227 | 0.237 |
| PDGFR-β |
|
|
| 0.318 | 0.127 | 0.086 |
| α-SMA
subtraction |
|
|
|
| 0.060 | 0.145 |
| CD31 |
|
|
|
|
| 0.319 |
| CD34 |
|
|
|
|
|
|
Discussion
Previous reports were accomplished about each CAF
(13,16–19), but
did not provided the information about the comparison of each CAF.
We captured immunohistochemical staining images, and adjusted
phases in each case by using Adobe Photoshop software
(Adobe® Photoshop® CC 2014®; USA)
for image registration, and compared the different antibodies in
the same field. In the present study, we analyzed histopathological
expression of CAF markers (collagen I, D2-40, PDGFR-β and α-SMA
subtraction) in 121 cases of the surgically resected advanced
colorectal cancers, using digital image analyses. High levels of
α-SMA subtraction (P=0.002), collagen I (P=0.040), and PDGFR-β
(P=0.040) expression areas tended to be associated with high venous
invasion. α-SMA positive and desmin negative myofibroblasts in the
advanced colorectal cancer is associated with malignant potential
in previous study (16,17). Serum levels of Collagen I degradation
telopeptide are correlated with staging and poor disease-free
survival of colorectal patients (19). PDGFR-β expression in colorectal cancer
stroma is associated with metastatic potential (18). Our data supported these previous
reports. α-SMA subtraction and venous invasion had strongest
positive correlation in the three markers (α-SMA subtraction,
collagen I, and PDGFR-β), in spite of a median expression of the
α-SMA subtraction not being so high (α-SMA subtraction 15.372%,
collagen I 26.787%, and PDGFR-β 11.646%).
We evaluated the correlation among the expression of
CAF/vessel markers. Collagen I, α-SMA subtraction, and PDGFR-β
correlated with venous invasion. There was significant correlation
between α-SMA subtraction and collagen I expression (P<0.001,
correlation rho=0.509). PDGFR-β was not associated with collagen I
nor α-SMA subtraction image, though high PDGFR-β expression was
correlated with venous invasion. These data suggested that α-SMA
subtraction, collagen I, and PDGFR-β might have differential
strength effects for venous invasion and different expression
patterns in advanced colorectal cancer stroma.
Immunohistochemically, collagen I, α-SMA subtraction, and PDGFR-β
widely expressed in the whole colorectal cancer stroma. On the
other hand, the expression of D2-40 was generally localized in the
cancer stroma, and was more frequently detected in the superficial
parts of the cancer tissue. The expression patterns (location,
intensity) of collagen I were similar to that of α-SMA subtraction
image, but PDGFR-β and D2-40 showed different expression patterns
in advanced colorectal cancer stroma. The different expression
pattern may influence venous invasion. It is necessary to further
study the relationships between CAFs in colorectal cancer. CAF
markers must become potential targets of future colorectal cancer
treatment. Combination therapy of PDGFR tyrosine kinase inhibitor
and anticancer drug was more effective than the anticancer drug
alone (20,21). In the future, cancer treatment will be
taylor made treatment, and its options will be expanded. Knowing
the detailed characters of CAFs leads to taylor made treatment. In
our study, it is possible that α-SMA subtraction contributes most
to venous invasion compare with collagen I, PDGFR-β.
The significant differences were seen in the
expression of collagen I, PDGFR-β and α-SMA subtraction between low
and high venous invasion. Expression area analysis was quantifiable
by using digital image analyses. On the other hand, it was
difficult to analyze the intensity of collagen I, and α-SMA
subtraction, because the expression of α-SMA subtraction and
collagen I was highly expressed in most cases. The intensity of the
expression of PDGFR-β is likely to be unstable due to its small
fluctuation in intensity. Therefore, there was no significant
difference in the expression intensity. Interestingly, the
expression of α-SMA subtraction was low in lymph node metastasis
cases in this study. We analyzed the CAF and vessel markers focused
on the D2-40 expressed lesions, therefore D2-40 might have some
influence for CAF and vessel markers expression. D2-40 (Podoplanin)
is a 38-kDa mucin-type transmembrane glycoprotein with extensive
O-glycosylation and high sialic acid content, and it has been
implicated in tumor progression (22). Podoplanin promotes relocalization of
ezrin to filopodia-like structure and platelet aggregation, so that
podoplanin may be involved in cancer migration, invasion, and
malignant progression (23–25). The majority of recently reports
identified D2-40 expression of CAFs as an unfavorable marker of
prognosis (9–11), but some reports described D2-40 in
CAFs as a favorable marker for colorectal cancer (12,13). Choi
et al analyzed early and advanced colorectal cancer
(12). Yamanashi et al
analyzed 120 advanced colorectal cancer cases (13). The detailed mechanism has not been
understood why the expression of D2-40 becomes a favorable marker
for colorectal cancer. Despite high venous invasion of α-SMA
subtraction expression, D2-40 expressed area might influence the
potential of lymph node metastasis in this study. Collagen I and
PDGFR-β are recognized to have malignant potential in CAFs of
colorectal cancer (18,19). These two markers do not have a
relationship with lymph node metastases, but have a relationship
with vein involvement in our study. There is possibility that α-SMA
subtraction, collagen I, and PDGFR-β are associated with venous
invasion rather than lymphatic invasion. Both vessel markers
(CD31/CD34) were not statistically associated with CAF
markers/other histological factors, except for the relationship
between CD34 and lymphatic invasion.
Our results indicated that the patterns of
expression for α-SMA subtraction, collagen I, D2-40, and PDGFR-β
vary in CAFs of advanced colorectal cancer. Collagen I, α-SMA
subtraction, and PDGFR-β were widely distributed in the colorectal
cancer stroma, while D2-40 was limited. The expression of α-SMA
subtraction, collagen I, and PDGFR-β were associated with high
venous invasion. However, the relationship between CAF markers
might be complicated to understand. There have been any previous
studies for the relationships between CAF markers. We must further
study CAF markers by analyzing with variable viewpoints (i.e.,
expression pattern, relationship between CAFs and strength for
clinicopathological factors).
Acknowledgements
This study was supported by Grants-in Aid for
Science from the Ministry of Education, Culture, Sports, Science
and Technology in Japan and a grant for Hirosaki University
Institutional Research.
Glossary
Abbreviation
Abbreviations:
|
CAF
|
cancer-associated fibroblast
|
References
|
1
|
Orimo A, Gupta PB, Sgroi DC,
Arenzana-Seisdedos F, Delaunay T, Naeem R, Carey VJ, Richardson AL
and Weinberg RA: Stromal fibroblasts present in invasive human
breast carcinomas promote tumor growth and angiogenesis through
elevated SDF-1/CXCL12 secretion. Cell. 121:335–348. 2005.
View Article : Google Scholar : PubMed/NCBI
|
|
2
|
Erez N, Truitt M, Olson P, Arron ST and
Hanahan D: Cancer-associated fibroblasts are activated in incipient
neoplasia to orchestrate tumor-promoting inflammation in an
NF-kappaB-dependent manner. Cancer Cell. 17:135–147. 2010.
View Article : Google Scholar : PubMed/NCBI
|
|
3
|
Olumi AF, Grossfeld GD, Hayward SW,
Carroll PR, Tlsty TD and Cunha GR: Carcinoma-associated fibroblasts
direct tumor progression of initiated human prostatic epithelium.
Cancer Res. 59:5002–5011. 1999.PubMed/NCBI
|
|
4
|
Yang G, Rosen DG, Zhang Z, Bast RC Jr,
Mills GB, Colacino JA, Mercado-Uribe I and Liu J: The chemokine
growth-regulated oncogene 1 (Gro-1) links RAS signaling to the
senescence of stromal fibroblasts and ovarian tumorigenesis. Proc
Natl Acad Sci USA. 103:pp. 16472–16477. 2006; View Article : Google Scholar : PubMed/NCBI
|
|
5
|
Hwang RF, Moore T, Arumugam T,
Ramachandran V, Amos KD, Rivera A, Ji B, Evans DB and Logsdon CD:
Cancer-associated stromal fibroblasts promote pancreatic tumor
progression. Cancer Res. 68:918–926. 2008. View Article : Google Scholar : PubMed/NCBI
|
|
6
|
Hu M, Peluffo G, Chen H, Gelman R, Schnitt
S and Polyak K: Role of COX-2 in epithelial-stromal cell
interactions and progression of ductal carcinoma in situ of the
breast. Proc Natl Acad Sci USA. 106:pp. 3372–3377. 2009; View Article : Google Scholar : PubMed/NCBI
|
|
7
|
Togo S, Polanska UM, Horimoto Y and Orimo
A: Carcinoma-associated fibroblasts are a promising therapeutic
target. Cancers (Basel). 5:149–169. 2013. View Article : Google Scholar : PubMed/NCBI
|
|
8
|
Pula B, Witkiewicz W, Dziegiel P and
Podhorska-Okolow M: Significance of podoplanin expression in
cancer-associated fibroblasts: A comprehensive review. Int J Oncol.
42:1849–1857. 2013. View Article : Google Scholar : PubMed/NCBI
|
|
9
|
Kitano H, Kageyama S, Hewitt SM, Hayashi
R, Doki Y, Ozaki Y, Fujino S, Takikita M, Kubo H and Fukuoka J:
Podoplanin expression in cancerous stroma induces lymphangiogenesis
and predicts lymphatic spread and patient survival. Arch Pathol Lab
Med. 134:1520–1527. 2010.PubMed/NCBI
|
|
10
|
Pula B, Jethon A, Piotrowska A,
Gomulkiewicz A, Owczarek T, Calik J, Wojnar A, Witkiewicz W, Rys J,
Ugorski M, et al: Podoplanin expression by cancer-associated
fibroblasts predicts poor outcome in invasive ductal breast
carcinoma. Histopathology. 59:1249–1260. 2011. View Article : Google Scholar : PubMed/NCBI
|
|
11
|
Schoppmann SF, Jesch B, Riegler MF,
Maroske F, Schwameis K, Jomrich G and Birner P: Podoplanin
expressing cancer associated fibroblasts are associated with
unfavourable prognosis in adenocarcinoma of the esophagus. Clin Exp
Metastasis. 30:441–446. 2013. View Article : Google Scholar : PubMed/NCBI
|
|
12
|
Choi SY, Sung R, Lee SJ, Lee TG, Kim N,
Yoon SM, Lee EJ, Chae HB, Youn SJ and Park SM: Podoplanin, α-smooth
muscle actin or S100A4 expressing cancer-associated fibroblasts are
associated with different prognosis in colorectal cancers. J Korean
Med Sci. 28:1293–1301. 2013. View Article : Google Scholar : PubMed/NCBI
|
|
13
|
Yamanashi T, Nakanishi Y, Fujii G,
Akishima-Fukasawa Y, Moriya Y, Kanai Y, Watanabe M and Hirohashi S:
Podoplanin expression identified in stromal fibroblasts as a
favorable prognostic marker in patients with colorectal carcinoma.
Oncology. 77:53–62. 2009. View Article : Google Scholar : PubMed/NCBI
|
|
14
|
International Union Against Cancer, . TNM
Classification of Malignant TumoursSobin LH, Gospodarowicz MK and
Wittekind CH: 7th. Wiley-Blackwell; New York, NY: 2009
|
|
15
|
Japanese Society for Cancer of the Colon
and Rectum: Japanese Classification of Colorectal Carcinoma.
Kanehara & Co., Ltd.; Tokyo: 2013
|
|
16
|
Takatsuna M, Morohashi S, Yoshizawa T,
Hirai H, Haga T, Ota R, Saito K, Wu Y, Seino H, Aoyagi Y, et al:
Myofibroblast distribution is associated with invasive growth types
of colorectal cancer. Oncol Rep. 36:3154–3160. 2016. View Article : Google Scholar : PubMed/NCBI
|
|
17
|
Takatsuna M, Morohashi S, Yoshizawa T,
Hirai H, Haga T, Ota R, Wu Y, Morohashi H, Hakamada K, Terai S and
Kijima H: Myofibroblasts of the muscle layer stimulate the
malignant potential of colorectal cancer. Oncol Rep. 36:1251–1257.
2016. View Article : Google Scholar : PubMed/NCBI
|
|
18
|
Kitadai Y, Sasaki T, Kuwai T, Nakamura T,
Bucana CD, Hamilton SR and Fidler IJ: Expression of activated
platelet-derived growth factor receptor in stromal cells of human
colon carcinomas is associated with metastatic potential. Int J
Cancer. 119:2567–2574. 2006. View Article : Google Scholar : PubMed/NCBI
|
|
19
|
Zou X, Feng B, Dong T, Yan G, Tan B, Shen
H, Huang A, Zhang X, Zhang M, Yang P, et al: Up-regulation of type
I collagen during tumorigenesis of colorectal cancer revealed by
quantitative proteomic analysis. J Proteomics. 94:473–485. 2013.
View Article : Google Scholar : PubMed/NCBI
|
|
20
|
Kitadai Y, Sasaki T, Kuwai T, Nakamura T,
Bucana CD and Fidler IJ: Targeting the expression of
platelet-derived growth factor receptor by reactive stroma inhibits
growth and metastasis of human colon carcinoma. Am J Pathol.
169:2054–2065. 2006. View Article : Google Scholar : PubMed/NCBI
|
|
21
|
Sumida T, Kitadai Y, Shinagawa K, Tanaka
M, Kodama M, Ohnishi M, Ohara E, Tanaka S, Yasui W and Chayama K:
Anti-stromal therapy with imatinib inhibits growth and metastasis
of gastric carcinoma in an orthotopic nude mouse model. Int J
Cancer. 128:2050–2062. 2011. View Article : Google Scholar : PubMed/NCBI
|
|
22
|
Kono T, Shimoda M, Takahashi M, Matsumoto
K, Yoshimoto T, Mizutani M, Tabata C, Okoshi K, Wada H and Kubo H:
Immunohistochemical detection of the lymphatic marker podoplanin in
diverse types of human cancer cells using a novel antibody. Int J
Oncol. 31:501–508. 2007.PubMed/NCBI
|
|
23
|
Wicki A, Lehembre F, Wick N, Hantusch B,
Kerjaschki D and Christofori G: Tumor invasion in the absence of
epithelial-mesenchymal transition: Podoplanin-mediated remodeling
of the actin cytoskeleton. Cancer Cell. 9:261–272. 2006. View Article : Google Scholar : PubMed/NCBI
|
|
24
|
Sugimoto Y, Watanabe M, Oh-hara T, Sato S,
Isoe T and Tsuruo T: Suppression of experimental lung colonization
of a metastatic variant of murine colon adenocarcinoma 26 by a
monoclonal antibody 8F11 inhibiting tumor cell-induced platelet
aggregation. Cancer Res. 51:921–925. 1991.PubMed/NCBI
|
|
25
|
Watanabe M, Okochi E, Sugimoto Y and
Tsuruo T: Identification of a platelet-aggregating factor of murine
colon adenocarcinoma 26: Mr 44,000 membrane protein as determined
by monoclonal antibodies. Cancer Res. 48:6411–6416. 1988.PubMed/NCBI
|